Note: Descriptions are shown in the official language in which they were submitted.
CA 02804354 2013-02-01
Title: SYSTEM, METHOD, AND MODEL OF A DRILLING RIG FOR HORIZONTAL,
LATERAL, AND DIRECTIONAL DRILLING THAT IS ADJUSTABLE IN REAL TIME
FIELD
[0001] The present embodiments generally relate to a system, method and
model of a drilling
rig for horizontal, lateral, and directional drilling, wherein drilling
operations are
adjustable in real time.
BACKGROUND
[0002] A need exists for a drilling rig for geo-steering directional
drilling equipment, such as
horizontal drilling equipment, that can provide real-time formation
information.
[0003] A further need exists for real-time location identification for a
drilling bit during
horizontal drilling.
[0004] A further need exists for a system for dynamic drilling
monitoring that can provide
real-time formation information and alarms when the drilling approaches a
dangerous
condition.
[0005] A further need exists for a computer assisted method for
horizontal, lateral, and
directional drilling using data from a drill string.
[0006] A further need exists for a model for directional drilling that
enables a user, a driller,
and other non-technical people to easily understand a wellbore profile and
other down
hole data in a cross discipline manner in real time for improved
communication.
[0007] The present embodiments meet these needs.
1
CA 02804354 2013-02-01
BRIEF DESCRIPTION OF THE DRAWINGS
[0008] The detailed description will be better understood in conjunction
with the
accompanying drawings as follows:
[0009] Figure 1 is a schematic representation of a drilling rig with geo-
steering system.
[00010] Figure 2 is a diagram of the controller of the drilling rig that
communicates with the
geo-steering system.
[00011] Figure 3 is a detailed multi-dimensional simulation of a 3D graph,
usable with the
geo-steering system.
[00012] Figure 4 is an executive board for the geo-steering system.
[00013] Figure 5 is an executive dashboard of a stratigraphic cross section
with two relative
matching graphs.
[00014] Figures 6A-6F depict a data storage of the system.
[00015] Figure 7 is a presentation of a geological prognosis usable according
to one or more
embodiments.
[00016] Figure 8 is a representation of an offset/type table usable in the
system.
[00017] Figure 9 is a representation of an actual survey usable in the system.
[00018] Figure 10 is a detailed view of the stratigraphic cross section.
[00019] Figure 11 depicts an embodiment of a prognosed tops table.
[00020] Figure 12 depicts a flow chart of an embodiment of a model for
directional drilling.
[00021] Figure 13 depicts additional computer instruction useable in a model
for directional
drilling.
[00022] Figures 14A-14E depict flow charts of an embodiment of a method for
geo-steering
during directional drilling of a wellbore.
2
CA 02804354 2013-02-01
_ .
[00023] Figure 15 is a diagram of computer instructions usable to implement an
alarm.
[00024] The present embodiments are detailed below with reference to the
listed Figures.
DETAILED DESCRIPTION OF THE EMBODIMENTS
[00025] Before explaining the present system and associated method in detail,
it is to be
understood that the system and associated method are not limited to the
particular
embodiments and that the embodiments can be practiced or carried out in
various
ways.
[00026] One or more of the present embodiments generally relate to a system,
method, and
model of a drilling rig for horizontal, lateral, and directional drilling,
wherein drilling
operations are adjustable in real time
[00027] The drilling rig can be used for horizontal, lateral, and directional
drilling. The
drilling operations performed by the drilling rig can be adjusted in real
time. The
drilling rig can have the ability to change direction to stay on target in the
wellbore
[00028] The drilling rig can include a sub structure. The substructure can
include a base. A
mast or derrick can be supported by the base.
[00029] A pipe handler can be operatively connected with the substructure. The
substructure
can be configured to place pipe in an operation position. For example, the
pipe
handler can be used to operatively engage pipe with a top drive connected with
the
derrick.
[00030] The substructure connected with one or more mud pumps. The mud pumps
can
provide drilling fluids downhole.
[00031] A draw works can be connected with the substructure. The draw works
can be
configured to move the top drive during drilling operations. For example, the
draw
works can be connected to the top drive by cabling.
[00032] The pipe provided to the top drive can be connected near the base of
the drilling rig to
3
CA 02804354 2013-02-01
= , =
=
form a drill string. In one or more embodiments, a drill bit can be connected
to the
drill string.
[00033] Piping can be used to provide fluid communication between portions of
the rig or the
wellhead. For example, piping can be used to provide fluid communication
between
the mud pumps and the wellhead.
[00034] A power source can be used to drive the mud pumps, the draw works, and
other
components of the drill rig.
[00035] A blow out preventer can be operatively disposed at the wellhead. The
drill rig can
also include directional drilling equipment.
[00036] A controller can be operatively connected with the drilling rig. The
controller can
control the directional drilling equipment, the mud pumps, the draw works, and
other
components of the drilling rig.
[00037] The controller can include a controller processor. The controller
processor can be in
communication with controller data storage.
[00038] The controller can collect wellbore data from a tool connected to the
drill string in the
wellbore.
[00039] The controller can transmit collected transmitting the wellbore data
collected to the
system for geo-steering.
[00040] The system for geo-steering can use a geo-steering processor to
analyze data in real
time.
1000411 The geo-steering system can also identify a projected path for the
drill string during
directional drilling. The projected path can be calculated using the data. The
projected
path and collected data can be stored in a data storage of the geo-steering
system.
[00042] The geo-steering system can also compute a wellbore profile. The
wellbore profile
can be calculated using the collected data. The wellbore profile can be a
composite
visualization of a plurality of true vertical depths.
4
CA 02804354 2013-02-01
'
[00043] The geo-steering system can also compute a stratigraphic cross section
for the
wellbore profile.
[00044] The stratigraphic cross section can include a formation dipping away
from a
perpendicular angle to a horizontal plane representing a surface surrounding
the
wellbore.
[00045] The stratigraphic cross section can also include a formation dipping
toward the
perpendicular angle to the horizontal plane representing the surface
surrounding the
wellbore.
[00046] The geo-steering system can also plot an actual drilling path for the
drill string using
an actual survey from the actual drilling path.
[00047] The geo-steering system can also overlay the actual drilling path onto
a projected path
in the stratigraphic cross section in the wellbore profile, enabling real-time
updating
of the actual drilling path over the projected path as an executive dashboard.
[00048] The geo-steering system can transmit the executive dashboard from the
geo-steering
system to the drill rig, indicating that the wellbore of the drill string
operated by the
drill rig is on target or off target.
[00049] The geo-steering system can also transmit the executive dashboard to a
multidimensional simulation, allowing a user to select a dimensional plot of
the
operation of the drill rig.
[00050] The equipment can form an operational drilling rig with horizontal,
lateral, and
directional drilling, and the drilling operations performed by the drill rig
can be
adjusted in real time. The drill rig can have the ability to change direction
to stay on
target in the wellbore within 3 to 12 hours.
[00051] The dynamic drilling monitoring system, ("monitoring system") may
prevent loss of
life due to explosions at a drilling rig site as the embodiments provide a
real time
continuously updating view of a wellbore profile and an actual path to prevent
moving a drill string into a hazardous formation zone.
5
CA 02804354 2013-02-01
[00052] The monitoring system enables accurate drilling of relief wells as a
drilling rig
operates to stop explosive blow outs and waste of a well, by providing
accurate real
time comparisons to what is in the formation and the location of the drill bit
in view
of the upcoming formations.
[00053] The monitoring system allows visualization in 3D of the drill bit, the
formation,
upcoming formations and land rights.
[00054] The monitoring system stops legal battles over drilling on the wrong
land, as the
embodiments enable a driller to view lease boundaries and stop drilling when
the drill
string might penetrate land that has no clearances or avoid drilling into land
without
leases in place.
[00055] The monitoring system enhances communication between team boundaries,
such as
the geologist, the drilling engineer, and the on-site hands, bringing the team
in up to
date communication, seeing the effect of their drilling in 3D and what is to
happen to
their drilling in 3D, for efficient team function.
[00056] The monitoring system can include a dynamic condition monitor. The
dynamic
condition monitor can be configured to be coupled to at least one sensor in a
wellbore. The sensor can collect data around a drill string. The data can be
related to
measured depth, inclinations; azimuths, and gamma ray curves of the well bore.
[00057] The dynamic control monitor can receive the acquired data from the
sensors. The
dynamic condition monitor can also be configured to use computer instructions
to
overlay an actual drilling path of the drill string over a projected drilling
path, a
stratigraphic cross section for drilling by the drill string, formations in
the
stratifgaphic cross section, and an actual location of the drill bit.
[00058] The monitoring system can also include computer instructions in
communication with
the dynamic condition monitor to calculate departure from a target zone for
drilling
based upon the signals from the sensors, computer instructions to provide an
alarm
when the calculations indicate a departure from the target zone.
[00059] The monitoring system can also include a server. The server can
include a processor
6
CA 02804354 2013-02-01
and data storage integrated in the dynamic condition monitor for storing a web
accessible executive dashboard. The server can be configured to populate the
web
accessible executive dashboard with data derived from the signals received
from the
sensors. The server can also be configured to provide the populated web
accessible
executive dashboard with the alarm to a remote user via a network when the
well bore
data indicates that drilling is off target; computer instructions to instruct
the server to
transmit an alarm if continued drilling in a formation will violate a permit,
will pose a
safety hazard, will be an economic hazard or combinations thereof; computer
instructions to transmit an alarm to a specific client device of a user over
network, or
combinations thereof. The alarm can be an audible alarm, a flashing light, a
big red X
on a display at the drilling site, an email, a text message, a phone call, or
combinations thereof.
[00060] The monitoring system can also include computer instructions to
calculate a precise
distance to a preset target and to generate text. The text can indicate that
precise
distance by unit of measure to a preset limit as the alarm. Illustrative units
of measure
can include feet, inches, millimeters, meters, and the like.
[00061] The monitoring system can also include computer instructions to
provide a text
software recommendation for a user to change drilling direction by degrees of
azimuth, degree of inclination, or combinations thereof, computer instructions
to use
at least two industry standard gateways simultaneously to provide the alarm to
different client devices with different client device protocols; computer
instructions to
create and transmit to safety groupings alarms by a first priority group of
team
members first, a secondary priority group of team members, in series.
[00062] The first group can be geology management of the drill site, such as
decision makers
on the drill site to relocate the drill string, guys who can make decisions
right away to
turn the drill string to be on target, or the like, and the second group can
be secondary
team members, such as geology team members, drilling engineers not on site,
and
other rig site personnel.
[00063] The monitoring system can also include computer instructions in the
data storage to
7
CA 02804354 2013-02-01
,
provide user information with the alarm. The user information can include well
location, well name, directions to the drilling rig, names of recipients of
the alarm,
current status of the drilling rig, the like, or combinations thereof.
[00064] The monitoring system can also include computer instructions in the
data storage to
provide with the alarm an alarm receipt and a retransmission from the client
device
that the user has received the alarm; computer instructions to track the
retransmissions from the user to indicate if the alarm has reached designated
user;
computer instructions to remedy drilling off target with specific text
directions to a
user describing equipment operation.
[00065] One or more of the present embodiments relate to a system including a
software
program that can be used to directionally drill relief wells, such as when a
blowout
occurs.
[00066] One or more embodiments of the software program can be used for
horizontal and
directional drilling, and can utilize various geologic and seismic curves
including
gamma curves. The drilling discussed herein can include drilling for an oil
well, a
natural gas well, a water well, or any another type of subsurface well
drilling.
[00067] One or more of the present embodiments relate to a computer assisted
method for
horizontal, lateral, and directional drilling using data from a drill string.
[00068] The computer assisted method for horizontal, lateral, and directional
drilling using
data from a drill string can use a drill string extending into the earth from
a drilling
rig. The method can enable drilling operations to be adjusted in real time,
change
drilling direction, and stay on target while drilling.
[00069] The method can include collecting data from the wellbore using a tool
connected to
the drill string of the drilling rig. The collected data can be transmitted to
a system for
geo-steering.
[00070] The system for geo-steering can use a geo-steering processor to
analyze the data in
real-time. The geo steering processor can also identify a projected path for
the drill
string during directional drilling, using the data and storing the projected
path in a
8
CA 02804354 2013-02-01
data storage.
[00071] The system for geo-steering can use the data to compute a wellbore
profile. The
wellbore profile can be a composite visualization of a plurality of true
vertical depths.
[00072] The system for geo-steering can compute a stratigraphic cross section
for the wellbore
profile.
[00073] The stratigraphic cross section can include a formation clipping away
from a
perpendicular angle to a horizontal plane representing a surface surrounding
the
wellbore; a formation dipping toward the perpendicular angle to the horizontal
plane
representing the surface surrounding the wellbore; or combinations thereof
[00074] The system for geo-steering can plot an actual drilling path for the
drill string using
an actual survey from the actual drilling path.
[00075] The system for geo-steering can overlay the actual drilling path onto
a projected path
in the stratigraphic cross section in the wellbore profile, enabling real-time
updating
of the actual drilling path over the projected path as an executive dashboard.
[00076] The system for geo-steering can transmit the executive dashboard
therefrom to the
drill rig, indicating that the well bore of the drill string operated by the
drill rig is on
target or off target.
[00077] The system for geo-steering can transmit the executive dashboard to a
multidimensional simulation allowing a user to select a dimensional plot of
the
operation of the drill rig, allowing the drilling rig to adjust drilling in
real time, with
an ability to change direction and to stay on target in the wellbore within 3
to 12
hours.
[00078] One or more embodiments of the method can use one or more software
programs.
[00079] The present embodiments generally relate to a computer drilling model
for horizontal,
lateral, and directional drilling using data from a drill string. The drill
string can
extend into the earth from drilling rig enabling drilling operations to be
adjusted in
real time, change drilling direction, and staying on target while drilling.
9
CA 02804354 2013-02-01
, - =
[00080] The computer drilling model can include a geo-steering model with data
storage
comprising: computer instructions to identify a projected path simultaneously
in at
least one dimension for the drill string during directional drilling, using
the data and
storing the projected path in a data storage; computer instructions to compute
a
wellbore profile using the data, wherein the wellbore profile is a composite
visualization of a plurality of true vertical depths; computer instructions to
computing
a stratigraphic cross section for the wellbore profile.
[00081] The stratigraphic cross section can have a formation dipping away from
a
perpendicular angle to a horizontal plane representing a surface surrounding
the
wellbore. A formation dipping toward the perpendicular angle to the horizontal
plane
representing the surface surrounding the wellbore; or combinations thereof.
[00082] The computer drilling model can include computer instructions to plot
an actual
drilling path for the drill string using an actual survey from the actual
drilling path.
[00083] The computer drilling model can include computer instructions for
overlaying the
actual drilling path onto a projected path in the stratigraphic cross section
in the
wellbore profile, enabling real-time updating of the actual drilling path over
the
projected path as an executive dashboard.
[00084] The computer drilling model can include computer instructions to
transmit the
executive dashboard from the geo-steering system to the drill rig indicating
that the
wellbore of the drill string operated by the drill rig is on target or off
target.
[00085] The computer drilling model can include computer instructions to
transmit the
executive dashboard to a multidimensional simulation, allowing a user to
select a
dimensional plot of the operation of the drill rig, allowing the drilling rig
to adjust
drilling in real time, with an ability to change direction and to stay on
target in the
wellbore within 3 to 12 hours.
[00086] The computer drilling model can include computer instructions for
collecting data
from the wellbore from a tool connected to the drill string of the drilling
rig.
[00087] The computer drilling model can include computer instructions for
transmitting the
CA 02804354 2013-02-01
= = .
data collected to the geo-steering model.
(00088] The computer drilling model can include computer instructions computer
instructions
to receive data from the geo-steering model.
[00089] The computer drilling model can include computer instructions to
present a wellbore
profile graphically to the user on a display at a drill rig site.
[00090] The computer drilling model can include computer instructions to offer
a link to the
user at a drill rig site to link to a multidimensional simulation.
[00091] One or more of the present embodiments relate to a model including a
software
program that can be used to directionally drill relief wells, such as when a
blowout
occurs.
[00092] One or more embodiments of the software program can be used for
horizontal and
directional drilling, and can utilize various geologic and seismic curves
including
gamma curves. The drilling discussed herein can include drilling for an oil
well, a
natural gas well, a water well, or any another type of subsurface well
drilling.
[00093] The geo-steering system, method, or model, can include computer
software designed
to import and export WITSTm-compliant information. WITS, as used herein,
stands
for Wellsite Information Transfer Specification.
[00094] The computer software can enable a user of the system to receive and
send updated
drilling and seismic survey data from a plurality of formats, such as:
WITSMLTm,
WITSTM, Log ASCII Standard (LAS), different streaming formats, different
logging
formats, and other formats installed for use. The receiving and sending of
updated
drilling and seismic survey data from the plurality of formats can occur in
real-time,
such as in a matter of seconds.
[00095] One or more embodiments of the system, method or model can be used:
solely in the
field adjacent a drilling site; remote from the drilling site, such as at an
office; at sea
on a subsea well site; or simultaneously from various remote and field
locations.
[00096] The system, method or model can include an executive dashboard program
that can
11
CA 02804354 2013-02-01
=
be used to present data to a plurality of users simultaneously and in real-
time. The
executive dashboard can allow users to simultaneously view numerous pieces of
data
and information associated with the drilling.
[00097] The system, method or model can enable users, which can be computers,
to more
efficiently and effectively determine stratigraphy, dipping, and faulting by
using
graphical matching of actual curve data against reference curves, such as type
log
curves, using real-time drilling data.
[00098] The system, method or model can help users visualize formation
structures by
allowing users to explore formation structures in three dimensions and in two
dimensions, and to explore different segments of a stratigraphic section or
map
simultaneously, thereby allowing the users to determine where a drilling bit
is within
a wellbore. The system can therefore be used to avoid disasters associated
with
formation problems, such as unexpected faults and the like.
[0001] One or more embodiments of the system, model or method for geo-
steering of
directional drilling equipment can include a processor in communication with
directional drilling equipment and with a data storage. The communication can
occur
through a network.
[0002] The processor and the data storage can be used to receive and
send data to the
directional drilling equipment, and to control at least portions of the
directional
drilling equipment.
[0003] The directional drilling equipment can include mud pumps, mud
tanks, drilling pipe,
controls, directional tools installed on a drill string, and similar
conventional
directional drilling equipment.
[0004] The data received from the directional drilling equipment can be
an inclination of the
wellbore as measured by a directional drilling tool, such as a sensor or gyro;
a
measured depth of the wellbore, such as a measured depth measured by a depth
encoder on a crown of the drilling rig; a tool depth, which can be the
measured depth
minus the distance of the tool from the bottom of the drill string; an azimuth
as
12
CA 02804354 2013-02-01
measured by a sensor on a directional drilling tool; and actual curve data
such as
gamma ray readings and resistivity readings as measured by sensors on
directional
drilling tools.
[0005] The processor can send data and/or commands to the directional
drilling equipment or
to user's operating the directional drilling equipment, such as user's viewing
the
executive dashboard at the drilling site.
[0006] The data and/or commands can include all of the data that can be
presented in the
executive dashboard as described herein and a suggested build rate to remain
at a
target depth or in a target formation, as well as other instructions regarding
drilling.
[0007] The commands can be: commands that directly control the directional
drilling
equipment, suggestions and/or instructions to users on how to control the
directional
drilling equipment, or combinations thereof.
[00099] One or more embodiments can include client devices in communication
with the
processor through the network. The client devices can be: computers; mobile
devices,
such as cellular phones; laptop computers; or another type of client device
having
communication means, processing means, and data storing means. Each client
device
can have a processor, a data storage, and a display. The network can be a
wireless
network, a wired network, or any other type of communications network.
[000100] In one or more embodiments, the processor with the data storage can
be disposed at a
drilling site, remote from the drilling site, or combinations thereof. The
system,
method, or model can be used to form a new wellbore at the drilling site, such
as in
land that has not been previously drilled.
[000101] Also, the system, method, or model can be used to expand an existing
wellbore. For
example, the processor can be in communication with the directional drilling
equipment, such as horizontal drilling equipment, for monitoring and
controlling the
drilling equipment.
[000102] The data storage can include a plurality of computer instructions.
The data storage
can include computer instructions to instruct the processor to create and
present an
13
CA 02804354 2013-02-01
=
executive dashboard. The executive dashboard can be presented to a user on a
display
of the user's client device. The executive dashboard can include a
presentation of: a
section of a formation, a location of a drill bit on a real-time basis, and
other data
associated with the drilling.
[0001031 The executive dashboard can present numerous continuously updated
data and pieces
of information to a single user or simultaneously to a plurality of users
connected
together over the network. The executive dashboard can provide the users with
the
ability to continually monitor the drilling in real-time during the occurrence
of the
drilling in order to avoid dangers and environmental problems, such as
disasters that
occur in the Gulf of Mexico.
[0001041 The system, method, or model can be used to enable users, such as
responders, to
quickly view the drilling to determine whether or not an actual drilling path
of the
drill bit is in compliance with a projected drilling path of the drill bit.
10001051 For example, a projected drilling path can be determined and/or
formed in order to
prevent excursion into areas that can cause: damage to a water supply; an
explosion;
significant harm to humans, structures, or animals at the surface of the
wellbore; or
significant harm to marine life in a body of water. With the executive
dashboard
disclosed herein, the user can view the actual drill path and compare that to
the
projected drill path in real-time in order to avoid dangers. Real-time
presentation of
data onto the executive dashboard can refer to data that is presented on the
executive
dashboard in no more than ten seconds after the actual occurrence of an event
associated with the data. For example, if the real-time presentation of data
includes a
location of the drill bit, the actual location of the drill bit can be
measured and
transmitted to the executive dashboard within ten seconds.
10001061 The executive dashboard can enable a user to view portions of
interest in a
stratigraphic cross section of the wellbore. The portions of interest in the
stratigraphic
cross section of the wellbore can be used to correctly identify a location of
a drill bit
within the wellbore. The identification of the location of the drill bit
within the
stratigraphic cross section, and therefore within the actual wellbore, allows
a user to
14
CA 02804354 2013-02-01
=
initiate action to fix any deviations of the actual drilling path from the
projected
drilling path.
[000107] The data storage can include computer instructions to instruct the
processor to present
an overlay of the actual drilling path over the projected drilling path. The
data storage
can include computer instructions to provide an alarm to the user, such as to
the
user's display, when a deviation of the actual drilling path from the
projected path
occurs.
[000108] The data storage can include computer instructions to instruct the
processor to
identify the projected path of a drilling bit used in directional drilling.
For example,
the processor can use a current inclination of the drill bit and a current
true vertical
depth of the drill bit to determine the projected path. The projected path can
be a line
from the current actual location of the drill bit and extending to a projected
location
of the drill bit that is estimated to occur in the future, given the current
inclination of
the drill bit and the current true vertical depth of the drill bit.
[000109] The data storage can include computer instructions to instruct the
processor to enable
a selected projected path to be simultaneously viewed in two dimensions and in
three
dimensions within the executive dashboard.
[000110] The data storage can include computer instructions to present all
data, information,
multidimensional data, and images from the directional drilling equipment to a
user
on the user's client device as an executive dashboard. The data storage can
include
computer instructions to store all data, information, multidimensional data,
and
images from the directional drilling equipment in the data storage.
[000111] The data storage can include computer instructions to instruct the
processor to
communicate over the network to import data including a plurality of
offset/type tops
of formations. The imported plurality of offset/type tops of formations can
include
offset/type tops of formations that are projected to be traversed by the drill
bit along
the projected path. The data storage can include computer instructions to
instruct the
processor to save the imported plurality of offset/type tops of formations in
an
offset/type table in the data storage. The offset/type table can be presented
within the
CA 02804354 2013-02-01
=
executive dashboard. An offset/type top of a formation, as the term used
herein, can
be a depth of a type log curve that has been selected and that corresponds to
certain
feature, such as tops of formations, markers, and other features. The type log
curve
can be a curve that includes multiple data points, such as those from a gamma
ray
analysis or another commonly known analytical method. Each data point can
include
a magnitude and a depth.
[000112] The data storage can include computer instructions to instruct the
processor to import
data including an actual survey of the wellbore. The actual survey data can
include: a
plurality of azimuths for the wellbore, a plurality of inclinations for the
wellbore, a
plurality of measured depth points for the wellbore path, and other data and
information associated with an actual survey of the wellbore. The actual
survey data
can be stored in the data storage using computer instructions, and can be
presented
within the executive dashboard.
[000113] The data storage can include computer instructions to instruct the
processor to import
data including a geological prognosis on the wellbore site to a proposed tops
table,
which can then be stored in the data storage. The geological prognosis can
include: at
least one depth for at least one formation top, a formation top through which
the drill
bit is expected to pass along the projected path, and other information. The
prognosed
tops table can be presented in the executive dashboard.
[000114] The data storage can include computer instructions to instruct the
processor to
construct a wellbore profile, to save the wellbore profile in the data
storage, and to
present the wellbore profile in the executive dashboard. The wellbore profile
can
include a composite visualization of a plurality of true vertical depths (TVD)
of the
wellbore, as can be more easily understood with reference to the figures
below.
[000115] The data storage can include computer instructions to instruct the
processor to use the
imported data to form a stratigraphic cross section in the wellbore profile.
The data
storage can include computer instructions to instruct the processor to
position the
actual location of the drill bit onto the stratigraphic cross section. The
stratigraphic
cross section can include a depiction of a formation dipping away from a
16
CA 02804354 2013-02-01
=
perpendicular angle from a horizontal plane representing the surface
surrounding the
wellbore. The stratigraphic cross section can include a depiction of a
formation
dipping toward the perpendicular angle from the horizontal plane representing
the
surface surrounding the wellbore.
[000116] The data storage can include computer instructions to instruct the
processor to
compute and plot the actual drilling path using the actual survey data. The
data
storage can include computer instructions to overlay the actual drilling path
onto the
stratigraphic cross section. The stratigraphic cross section can continuously
be
viewable in the executive dashboard in both three dimensions and two
dimensions,
such as during overlaying. The actual drilling path can be overlaid and
plotted onto
the projected path for the drilling bit in the stratigraphic cross section of
the wellbore
profile. With the actual drilling path overlaid and plotted onto the projected
path for
the drilling bit, the users can monitor the actual drilling path in real-time
on the
executive dashboard. The actual drilling path in view of the projected path of
the
drilling bit can be updated continually and/or continuously for real-time
presentation
on the executive dashboard.
[000117] The data storage can include computer instructions configured to
instruct the
processor to present a plurality of control buttons on a display within the
executive
dashboard. The control buttons can be viewed and operated by users. For
example,
the user can increase or decrease a starting measured depth of the drilling to
predict
drilling paths using one or more of the control buttons. The user can modify
an
ending measured depth of the drilling using one or more of the control
buttons. The
user can use the control buttons to modify values by increasing or decreasing
the true
vertical depth offset. The user can use the control buttons to increase or
decrease dip
or dip angle of formations, and to change which section of the wellbore is a
portion of
interest in the stratigraphic cross section.
[000118] In one or more embodiments, the data storage can include computer
instructions
configured to allow a user to increase or decrease values associated with each
control
button to modify: the start measured depth, ending measured depth, true
vertical
depth offset, dip or dip angle, or combinations thereof, of portions of
interest in the
17
CA 02804354 2013-02-01
stratigraphic cross section to correctly identify the location of the drill
bit in the
stratigraphic cross section.
[000119] One or more embodiments can include computer instructions to instruct
the processor
to measure a distance, such as in feet or meters, at a perpendicular angle
from a
horizontal plane representing the surface surrounding the wellbore or the true
vertical
depth of the wellbore. The measurements can be initiated from a rotary table
bushing,
also known as a kelly bushing, to determine a current or final depth of the
wellbore as
plotted against the measured depth of a borehole. The measured depth of the
wellbore
can be equivalent to a length of the drill string when the drill bit is at a
bottom or end
of the borehole.
[000120] The data storage can include computer instructions to instruct the
processor to present
additional control buttons that control the rates of adjustment or granularity
of the
other controls.
[000121] The data storage can include computer instructions to instruct the
processor to
provide an alarm. The alarm can be provided when it appears or is determined
that
continued drilling within a formation will violate a permit, cause a safety
hazard,
cause an environmental hazard, cause an economic hazard, cause another hazard,
or
combinations thereof.
[000122] The data storage can include computer instructions to instruct the
processor to
superimpose the projected path for the drilling bit over a formation structure
map, and
to position the formation structure map behind the projected path to establish
faults in
the formation relative to the projected path and/or the actual drilling path.
The
formation structure map can be imported and/or inputted into the data storage
from an
external source and saved therein, and can include a calculated stratigraphic
cross
section before the wellbore has been drilled.
[000123] The data storage can include computer instructions to instruct the
processor to
superimpose the projected path for the drilling bit over stratigraphic cross
section, and
to position the stratigraphic cross section behind the projected path to
establish
formations simultaneously both in two dimensions and in three dimensions.
18
CA 02804354 2013-02-01
[000124] The data storage can include computer instructions to instruct the
processor to form at
least one report. Each report can include: any information imported and/or
inputted
into the data storage; any information and/or data stored in the data storage;
any data
received from the directional drilling equipment; any information and/or data
presented within the executive dashboard; any information and/or date included
within the various reports described herein; any information and/or data
associated
with the wellbore, the drilling equipment, and the drilling process; or
combinations
thereof. Similarly, the executive dashboard can present any information
imported
and/or inputted into the data storage; any information and/or data stored in
the data
storage; any data received from the directional drilling equipment; any
information
and/or date included within the various reports described herein; any
information
and/or data associated with the wellbore, the drilling equipment, and the
drilling
process; or combinations thereof.
[000125] The data storage can include computer instructions to instruct the
processor to plot an
actual drilling path on a real-time basis in view of the projected path, and
to transmit
the plot along with images and a text report to a plurality of users
simultaneously over
the network for presentation on the executive dashboard.
[000126] The executive dashboard can include a report for a wellbore of
current information.
The current information can include a current measured depth, such as 10500
feet,
which can be adjustable using an onscreen control button. The current
information
can also include a current formation name, such as "Selman Formation." The
formation name can be procured from an offset/type log table that the
processor can
obtain from communicating with another data storage accessible through the
network.
[000127] The current information can include a "next formation name", such as
"Juanita
Shale", which can be obtained from the same or a similar data storage. The
next
formation name can be the name of the next formation through which the drill
bit is
expected pass through along the projected path. The current information can
include
location information for the current formation and for the next formation.
[000128] The data storage can include computer instructions to instruct the
processor to
19
CA 02804354 2013-02-01
=
compute a "distance to next formation" from the current formation, and to
present the
computed distance to next formation to the user within the executive
dashboard.
[000129] The data storage can include computer instructions to instruct the
processor to
compute an "estimated subsea depth of next formation", such as ¨7842 feet,
using the
kelly bushing elevation and the estimated true vertical depth of the next
formation.
The estimated subsea depth of next formation can be presented to the user on
the
executive dashboard.
[000130] The data storage can include computer instructions to instruct the
processor to
compute the "current dip or dip angle." The current dip or dip angle, as the
term used
herein, can be the angle of a formation referenced from the horizontal plane
representing the surface surrounding the wellbore. In operation, if the angle
is
positive and the angle points towards the surface or is shallower, the current
dip or
dip angle can be referred to as "dipping towards" the wellbore; whereas if the
angle is
negative and the angle points away from the surface or is deeper, the current
dip or
dip angle can be referred to as "dipping away" from the wellbore.
[000131] The data storage can include computer instructions to instruct the
processor to present
a "current true vertical depth" in the executive dashboard, which can
represent the
distance measured at the perpendicular angle from the horizontal plane
representing
the surface surrounding the wellbore to the drill bit using the kelly bushing
as a
reference point on top of the wellbore.
[000132] The data storage can include computer instructions to instruct the
processor to present
a "current subsea true vertical depth" in the executive dashboard. The current
subsea
true vertical depth can be a true vertical depth that is referenced from sea
level,
wherein positive numbers can indicate depths that are above sea level and
negative
numbers can indicate depths that are below sea level.
[000133] The data storage can include computer instructions to instruct the
processor to present
a report to the users in addition to, and simultaneously with, the executive
dashboard.
[000134] The report can include past drilling data and estimated future
drilling data. The report
CA 02804354 2013-02-01
can include at least one, and up to several thousand, formation names,
projected tops
of each listed formation, and a true vertical depth as drilled for each
formation. The
report can include a value representing a difference between a projected top
of a
formation and a formation top as drilled. The report can include a dip or dip
angle,
measured in degrees, of a plurality of formations as drilled at the tops of
the
formations. The report can include each drill angle, measured in degrees. The
drill
angle can be the angle of inclination of the wellbore at the top of the
formation as
drilled. For example, the drill angle can be 25.3 degrees. The report can
include an
estimated distance needed for the drill bit to travel to reach a top of the
next formation
or to reach a selected formation considering the current drill angle and the
current dip
or dip angle of the formation. The report can include an estimated/actual
subsea depth
of formation relative to sea level of an encountered formation, of the next
formation,
or of a selected formation, considering the current drill angle and the
current dip or
dip angle of the formation.
[000135] The report can include identification information. The identification
information can
include: a job number; a well number; a location in which the well is being
drilled,
such as a country name, a state name, a county name; a rotary table bushing
elevation,
such as a kelly bushing elevation; a field name, such as the name of the field
where
the well is being drilled; a start date for drilling; a start depth for
drilling, such as
1240 feet; an API number, wherein the term "API" refers to American Petroleum
Institute; a UWI, wherein the term "UWI" refers to a Unique Well Identifier; a
ground level elevation, such as 783 feet; a unit number, such as unit 2 of the
Lyon
field with 12 units; an end date of drilling; an end depth of the drilling,
such as 10,700
feet; and other information. The API number can be a unique, permanent,
numeric
identifier assigned to each well drilled for oil and gas in the United States.
[000136] The data storage can include computer instructions to instruct the
processor to display
an actual location of a drilling bit on the actual drilling path within the
executive
dashboard for real-time identification of the drilling bit during horizontal
drilling.
[000137] In one more embodiments, the stratigraphic cross section and/or the
portion of
interest in the stratigraphic cross section can be calculated using: the
offset/type tops
21
CA 02804354 2013-02-01
,
,
'
section through which the projected path will follow, which can be shown as a
thicknesses between lines; the starting measured depths for the stratigraphic
section
of the wellbore; the ending measured depths for the stratigraphic section of
the
wellbore; the true vertical depth offset for the stratigraphic section of the
wellbore;
and the dip angle for the stratigraphic cross section, which can be shown as
an angle
of tilt in the formation.
10001381 In one or more embodiments, the wellbore profile can be displayed
with actual
curves, which can be gamma ray curves. The wellbore profile can be displayed
with
curves that are total gas curves. Total gas can be the volume of gas detected
at a
particular measured depth. The actual curve can be a curve that includes
multiple data
points, such as those from a gamma ray analysis or another commonly known
analytical method. Each data point can include a magnitude and a depth.
[000139] The stratigraphic cross section can be presented on the executive
dashboard as a
colored and/or visual map prior to importing the actual survey. Within the
executive
dashboard, different colors can represent different estimated tops of
formations and
other related data.
[000140] In one or more embodiments, the wellbore profile can include and
provide a plot of
the subsea true vertical depth against the true vertical depth and the
measured depth
of the wellbore.
[000141] A unique benefit of one or more embodiments is that projected
formations can be
presented as a geological hypothesis of the actual geological formation,
thereby
enabling users to perform adjustments to the drilling equipment in real-time
using the
data and controls provided by the executive dashboard. The user can adjust
different
values relative to the geological hypothesis using the control buttons,
thereby
enabling the geological hypothesis to continue to update as the drilling
continues in
real-time.
[000142] The geological prognosis, as the term is used herein, can include a
stratigraphic
section or map. The stratigraphic section or map can include at least one
identified
depth of a formation top, at least one identified depth of a formation bottom,
at least
22
CA 02804354 2013-02-01
one anticline, at least one syncline, at least one depth of a fault, at least
one bedding
plane between two formations, a fracture line of at least one fault, or
combinations
thereof.
[000143] The geological prognosis can be generated using computer instructions
stored in the
data storage that instruct the processor to use a surface elevation or a
rotary table
bushing elevation of a surface for a start of a wellbore, and at least one
offset/type top
of the projected formation provided by a user.
[000144] In one or more embodiments, the actual curves and projected curves
can be used as
gamma curves from a type log.
[000145] The overlaying of the projected path onto the stratigraphic cross
section can be
performed by overlaying the projected path onto a three dimensional
stratigraphic
cross section, with the three dimensions being: casting, northing, and true
vertical
depth as overlaid on the azimuth of the projected path.
[000146] In one or more embodiments, a type log can be used as a test well to
calculate
thicknesses of formations and thicknesses of rock between formations. For
example,
by calculating an absolute value of the difference between the top true
vertical depth
of a first formation, the Juanita Shale formation, and the top true vertical
depth of a
second formation, the Nikki Sand formation, which, in this example, is the
next
deepest formation underneath the first formation, the thickness of the Juanita
shale
formation can be obtained.
[000147] In one or more embodiments, the plurality of offset/type tops can
include a type log.
An illustrative type log for the formation Juanita Shale can be the top true
vertical
depth value of 1,020 feet, and an illustrative type log for the formation
Nikki Sand
can be the top true vertical depth value of 1,200 feet.
[000148] The projected path can be generated using computer instructions in
the data storage
that instruct the processor to calculate the projected path using a kick off
point, such
as a depth of 4,500 feet, a build rate, such as 8 degrees/100 feet, and a
target depth,
such as 6,632 feet. In one or more embodiments, a user can provide the
projected
23
CA 02804354 2013-02-01
path, such as by uploading the projected path into the data storage.
[000149] The data storage can include computer instructions to instruct the
processor to
provide correlation points for at least one actual curve, or for at least one
point along
an actual curve of a stratigyaphic section. Each correlation point can be tied
to a
known type log curve for confirming accuracy of the actual curve. For example,
a
plurality of sampling data points along a plot of an actual curve can be
compared with
sampling data points along a plot of a related type log curve. Correlation
between the
actual curve and the type log curve can be confirmed when the sampling data
points
in the actual curve match the sampling data points in the type log curve. An
actual
curve that has more matching sampling data points with the type log curve has
a
greater degree of correlation.
[000150] One or more embodiments can include computer instructions in the data
storage
configured to allow a user to thicken or thin a curve of the stratigraphic
cross section
in order to fit or correlate with type log curves.
[000151] In one or more embodiments, the user can be a processor, a computer,
or another like
device in communication with the processor of the system, method, or model.
[000152] In one or more embodiments, after the wellbore is drilled, a user can
analyze the
wellbore profile to determine portions of the wellbore that are appropriate
for
perforation, fracing, and/or production stimulation during completion stage
operations. For example, the user can highlight portions of the wellbore
within the
wellbore profile, such as by using an input device in communication with the
executive dashboard. The data storage can include computer instructions to
instruct
the processor to configure the executive dashboard to allow the user to
highlight
portions of the wellbore profile within the executive dashboard. The user can
highlight portions to indicate the portions of the wellbore that are
appropriate for
perforation, fracing, and/or production stimulation. Therefore, users, such as
engineers, at a location remote for the drilling site can analyze the wellbore
profile
and can highlight portions for further drilling exploration. Then, users, such
as
wellbore completion personnel, located at the drilling site can see those
highlighted
24
CA 02804354 2013-02-01
portions on a presentation of the same executive dashboard and can use the
information to perform well completion operations. The engineers can therefore
use
the executive dashboard to communicate to drill site personnel which areas
within the
wellbore to perform further perforation, fracing, and/or production
stimulation. The
system, method, or model therefore provides a unique graphical representation
and
communication means for indicating perforation, fracing, and/or production
stimulation areas within a wellbore.
[000153] The user can also highlight portions of the wellbore within the
wellbore profile to
indicate portions of the wellbore that the user has determined are not
appropriate for
perforating, fracing, and/or production stimulation. For example, the user can
highlight portions of the wellbore that are appropriate for perforating,
fracing, and/or
production stimulation in a first color, and can highlight portions of the
wellbore that
are not appropriate for perforating, tracing, and/or production stimulation in
a second
color. Users of the system, method, or model can therefore more efficiently
implement perforating, tracing, and/or production stimulation in a wellbore
without
having to perform tracing, and/or production stimulation in areas which are
not
appropriate for fracing, and/or production stimulation, such as areas wherein
an
environmental, economic, or safety hazard exists.
[000154] In one or more embodiments, a textual report regarding areas
appropriate and not
appropriate for fracing, and/or production stimulation can be produced. This
textual
report can be presented in the executive dashboard along with the highlighted
portions in the wellbore profile, and can be used in combination with the
highlighted
portions of the wellbore profile for determinations and communications.
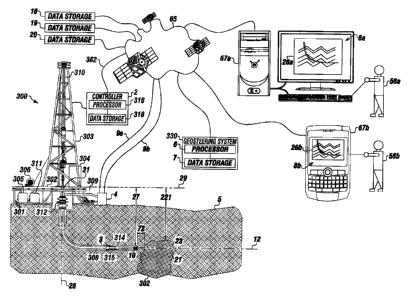
[000155] Turning to the Figures, Figure 1 is a schematic representation of a
drilling rig 300 for
horizontal, lateral, and directional drilling, wherein drilling operations is
adjustable in
real time, with an ability to change direction to stay on target in the
wellbore.
[000156] The drilling rig has a controller 2 is operatively connected to a geo-
steering system
330 such as through the network 65 for controlling rig drilling functions.
[000157] The controller functions to collect wellbore data from a tool 314
connected to the drill
CA 02804354 2013-02-01
= =
string 308 in the wellbore 3.
[000158] The geo-steering system 330 has a geo-steering processor 6 in
communication with
data storage 7 to analyze in real time the data 9a from the rig to the geo-
steering
processor and to transmit data 9b from the geo-steering processor to the
drilling rig.
[000159] The processor 6 can be in communication with the network 65. The
network 65 can
be in communication with one or more client devices, here shown including
client
device 67a and client device 67b. Client device 67a is shown associated with a
first
user 56a, while client device 67b is shown associated with a second user 56b.
Each
client device 67a and 67b has a display 8a and 8b, for presenting the
executive
dashboard, shown as executive dashboard 26a and executive dashboard 26b.
[000160] The processor 6 can be in communication with directional drilling
equipment 4 for
steering a drill bit 10 in the wellbore 3. The drill bit 10 can be connected
to a drill
string 308.
[000161] The drill string 308 can have a tool 314 connected therewith. The
tool 314 can be
integrated with, attached with, formed into, or otherwise connected with the
drill
string 308. The tool 314 can include one or more sensors 315.
[000162] In operation, the processor 6 can receive data 9a from the
directional drilling
equipment 4 concerning a current status of the drilling. The processor 6 can
store this
received data 9a in the data storage 7 and can present this data 9a in various
forms to
the client devices 67a and 67b in the executive dashboards 26a and 26b. The
processor 6 can send data and/or commands 9b to the directional drilling
equipment
4.
[000163] The processor 6 can also receive additional data from other sources,
including data
that is input by users or data from additional data storages, such as second
data
storage 16, a third data storage 19 or a fourth data storage 20. The third
data storage
can include a WITSENDTm software product available from Selman and Associates,
Ltd., of Midland, Texas for analysis of all wellbore data, all storage data or
otherwise.
The fourth data storage can contain a WITSMLTm software that facilitates data
26
CA 02804354 2013-02-01
=
transmission and delivery using known international standards of the oil and
natural
gas industry.
[000164] The executive dashboards 26a and 26b can present this additional data
along with the
received data 9a to the users 56a and 56b. The processor 6 can use the
received data
9a and additional data to perform calculations and to make determinations
associated
with the drilling process.
[000165] The executive dashboards 26a and 26b can allow the users 56a and 56b
to analyze the
received data 9a and the additional data, and to provide control commands
using
control buttons on the executive dashboards 26a and 26b.
[000166] In embodiments, control commands can be performed by one user on the
executive
dashboard that can be seen by all user's viewing the executive dashboard.
[000167] A depth 221 for a formation 302 with a formation dipping away from
the
perpendicular angle 21 and a formation dipping toward the perpendicular angle
23 is
depicted. A projected path 12 of the drill bit 10 is depicted passing through
the
formation 302. Also, a distance to the next formation 72 is shown.
[000168] A surface 5 of the wellbore 3 is depicted with a kelly bushing 31 of
a drilling rig 300.
A perpendicular angle 28 can be computed from the kelly bushing 31.
[000169] A horizontal plane 29 representing the surface 5 where the wellbore 3
is drilled along
with the perpendicular angle 28 from the horizontal plane 29 can be used to
determine
the true vertical depth 27 (TVD) of the wellbore 3.
[000170] The network 65 can be in communication with multidimensional
simulation in the
data storage 318. The multidimensional simulation can allow a user to select a
dimensional plot of the operation of the drill rig, allowing the drilling rig
to adjust
drilling in real time, with an ability to change direction and to stay on
target in the
wellbore within 3 to 12 hours.
27
CA 02804354 2013-02-01
[000171] The processor 6 can receive one or more signals 362 from the network
65. The
signals 362 can transmit data collected by the tool 314 to the geo-steering
system 330
for storage in the data storage 7.
[000172] The processor 6 can send encrypted signals to the drill rig 300. For
example, a
controller 2 in communication with the drill rig 300 can receive the encrypted
signals.
[000173] The drill rig can include sub structure 301. The substructure 301 can
have a base 302.
A mast or derrick 303 can be supported by the base. A pipe handler 304 can be
connected with the sub structure 301.
[000174] One or more mud pumps 305 can be in fluid communication with the
wellbore 3. A
draw works 306 can be connected with the mast or derrick 310. The draw works
306
can be connected with cabling 310 that can also be connected with a top drive
supported by the derrick 310, allowing the draw works to control the movement
of
the drill string 308 relative to the wellbore.
[000175] Piping 309 can be used to provide fluid communication between the
directional
drilling equipment 4, the mud pumps 305, or combinations thereof with the
wellbore
3.
[000176] A power source 311 can provide power for driving the directional
drilling equipment
4, the mud pumps 305, the draw works 306, or combinations thereof.
[000177] A blow out preventer 312 can be operatively connected with the
wellbore 3.
[000178] Figure 2 is a diagram of the controller of the drilling rig that
communicates with the
geo-steering computer instructions.
[000179] The controller 2 can include the controller processor 316, and the
controller processor
316 can be in communication with the controller data storage 318.
[000180] The controller data storage 318 can include computer instructions 320
for receiving
the data from the tool.
[000181] The controller data storage 318 can also include controller computer
instructions 322
28
CA 02804354 2013-02-01
,
to transmit the data to the geo-steering system.
10001821 The controller data storage 318 can also include controller computer
instructions 324
receive data from the geo-steering system.
[000183] The controller data storage 318 can also include controller computer
instructions 326
to present the wellbore profile, stratigyaphic cross section, actual drilling
path, and
projected path to a user on the drilling rig.
[000184] The controller data storage 318 can also include controller computer
instructions 328
for to the user a link to the network 65.
[000185] The controller data storage 318 can include computer instructions to
create a
multidimensional simulation 332. The multidimensional simulation can allow a
user
to select a dimensional plot of the operation of the drill rig, allowing the
drilling rig to
adjust drilling in real time, with an ability to change direction and to stay
on target in
the wellbore within 3 to 12 hours.
[000186] Figure 3 is a detailed of a three dimensional plot of the
multidimensional simulation
which is produced using the geo-steering system.
10001871 The multi-dimensional simulation 300 can display a first formation.
The first
formation can dip away from a perpendicular angle 21. The multi-dimensional
simulation 300 can display a second formation that dips toward the
perpendicular
angle 23.
10001881 The formations are displayed on a three dimensional plot 63. The
three dimensional
plot 63 can include northing 59 as the "y" axis, casting 220 as the "x" axis,
and true
vertical depth 27 as the "z" axis.
1000189] Each portion of the executive dashboard with the multidimensional
simulation can be
presented simultaneously to a plurality of users with client devices over a
network,
providing for constant monitoring and increased safety during drilling
operations.
[000190] Also shown is the stratigraphic cross section 11.
29
CA 02804354 2013-02-01
[000191] The actual drilling path 35 and the projected drilling path 12 are
also depicted.
[000192] Figure 4 depicts an embodiment of the executive dashboard 26 of the
system for geo-
steering during directional drilling.
[000193] The executive dashboard 26 can be a composite visualization that
presents a wellbore
profile 25. The wellbore profile 25 can include true vertical depths (TVD) 27
and for
subsea drilling, a subsea true vertical depths (SSTVD) 114. Both true vertical
depths
are plotted with respect to measured depths 33.
[000194] The actual location of the drill bit 101 can also be seen in the
wellbore profile 25.
[000195] The true vertical depths 27 for the wellbore profile 25 are shown
here ranging from
6,200 feet to 6,900 feet. The measured depths 33 of the wellbore profile 25 is
shown
here ranging from 5,500 feet to 10,700 feet. The subsea true vertical depths
114 of the
wellbore profile are shown here ranging from -4,966 feet to -5,666 feet. Any
variation
of feet for a given formation can be used.
[000196] The executive dashboard 26 can include a toolbar 222 located at a top
of the
executive dashboard. The toolbar 222 can include a job management menu 134
that
allows a user to choose at least one of the following options: new, open from
local
database, open from file, close, edit job information, save/export job to
file, import
and/load job file to local database, backup local database, and exit program.
[000197] The toolbar 222 can include a report generation menu 136 that allows
the user to
choose at least one of the following options: create a PDF report or create a
rich text
format report (RTF report) and select additional report options.
[000198] The toolbar 222 can include a tops button 138 that can produce a drop
down menu
allowing the user to edit a type log tops and edit a prognosed tops table.
[000199] The toolbar 222 can include a survey button 140 that allows the user
to choose at least
one of the following: edit a planned survey or edit an actual survey. For
example, a
planned survey can include the kick off point for a proposed wellbore, a
landing point
for the proposed wellbore, and a target true vertical depth for the proposed
wellbore.
CA 02804354 2013-02-01
[000200] The toolbar can include a stratigraphy button 142 that permits the
user to edit
stratigraphy adjustments to adjust the fitting/correlation of the actual
curve, such as a
gamma ray curve 110 and total gas curve 111, to a type log curve 103, such as
a type
log gamma ray curve. The stratigraphy button 142 allows editing of the
estimated
formation structure map by a user.
[000201] The toolbar 222 can include a curve button 144 that enables the user
to perform
editing of continuous curves used in the wellbore profile 25, such as the
gamma curve
110 and the total gas curve 111. For example, the user can add values versus
measured depths in a table that produces the continuous curves of the wellbore
profile.
[000202] The toolbar 222 can include an update button 145 that allows the user
to update data
from data sources which includes information from the data storage 16, 19, and
20 in
a synchronized manner.
[000203] The toolbar 222 can include a configure button 146 that allows the
user to select at
least one of the following: formation to configure, curve to configure, data
source to
reference for mapping, a map for inserting data from a selected data source,
alarm to
configure, view a quantity of days left on a license key of an analytic tool
usable for
wellbore profiling, and view information on the validity of a license key. For
example, the user can select the formation option and can then configure a
formation
set of data by adding formations to the formation set, removing one or more
formations from the formation set, configuring line styles, line thicknesses,
and line
colors of formations in the formation set, or combinations thereof
[000204] The toolbar 222 can include a help button 148 that allows the user to
type questions
and receive answers based on key words within the user's questions.
[0008] The executive dashboard 26 can display report header information,
including: a job
number 86 shown as 44455; a well name or number 87, shown as PUMA #5; a
county 88, shown as Midland; a kelly bushing elevation 89, shown as 1234; a
field
name 90, shown as WILDCAT; a start date for drilling 91, shown as 8/11/2010; a
start depth for drilling 92, shown as 5500 feet; an American Petroleum
Institute (API)
31
CA 02804354 2013-02-01
number 93, shown as 12-345-67890 which is a unique number for a well drilled
in the
United States; a state in which the drilling occurs 94, shown as Texas; a
ground level
elevation 95, shown as 1204; a unit number 96, shown as having a value 99; an
end
date of drilling 97, shown as 8/25/2010; and an end depth of the drilling 98,
shown as
10700 feet. Additional report elements 120 can also be shown.
[000205] Figure 4 shows a detail of the additional report elements 120 which
include show
formation labels check box 121; show formations check box 123; minimum true
vertical depth (TVD) scale control 125; maximum true vertical depth scale
control
127; minimum northing scale control 129; a maximum northing scale control 131;
a
minimum casting scale control 133; a maximum casting scale control 135; and
combinations thereof
[000206] Figure 4 shows that the executive dashboard 26 can include current
information 68,
which can include: a current measured depth 69, shown as 10300.0 feet; a
current
formation name 70, such as MATT SPRINGS; a next formation name 71, such as
HARD BOTTOM; a distance to next formation 72, show as 358.7 feet; an estimated
subsea depth of next formation 73, shown as -5501.4 feet; a current dip angle
of the
formation 74 shown as 8.60 degrees; a current true vertical depth 75, shown as
6636.1
feet; and a current subsea true vertical depth 76, shown as -5402.1 feet.
[000207] In Figure 4, the executive dashboard 26 can include a formation
transition report 77,
which can include: at least one formation name 78, such as UPPER TOMMY; at
least
one projected formation top 79 of the formation associated with the formation
name,
such as 6418.0; at least one true vertical depth as drilled 80, shown as
6397.3; at least
one difference 81 between a projected formation top and an as drilled top,
shown as -
20.7; at least one dip 82 for a top of a formation as drilled, shown as -0.90;
at least
one drilled angle 83 of the wellbore at a top of a formation, shown as 47.40;
at least
one distance to formation 84, shown as 0.0; and at least one estimated/actual
subsea
formation depth 85 relative to sea level for a top of a formation, shown as -
5163.3.
The distance to formation 84 can be a distance to the next formation or a
distance to a
selected formation.
32
CA 02804354 2013-02-01
[000208] The executive dashboard 26 can include a legend 34 which identifies
the planned
wellbore curve, the actual wellbore curve, formation names, a total gas curve,
and a
gamma ray curve.
[000209] The gamma ray curve 110 can be formed by plotting a real-time value
115, here
shown with a range from 0 to 300, against the measured depths 33 of the
wellbore,
here shown ranging from 5500 feet to 10700 feet.
[000210] The total gas curves 111 can be formed by plotting a lag time value
117, shown as
ranging from 0 to 8000, against the measured depths 33 of the wellbore.
[000211] The executive dashboard 26 can present a three dimensional plot 63 of
a projected
path for a drill bit simultaneously as superimposed over the stratigaphic
cross section
11 (which is shown in Figure 4).
[000212] The three dimensional plot 63 includes northing 59 as the "y" axis,
easting 220 as the
"x" axis, and true vertical depth 27 as the "z" axis.
[000213] Each portion of the executive dashboard 26 can be presented
simultaneously to a
plurality of users with client devices over a network, providing for constant
monitoring and increased safety during drilling operations.
[000214] In an embodiment, it is contemplated that the information for the
executive dashboard
can be updated with only two clicks, based on events. If the events occur
quickly,
then the dashboard can be updated in only a few seconds, such as 3 to 5
seconds, or
updated daily if the gamma ray is only updated daily. If the user is connected
to
streaming gamma ray, then the updating can be automatically without clicking,
every
three to five sections.
[000215] The graphic wellbore profile of the dashboard can be updated in
seconds with the
system. In an embodiment it can take 10 seconds to 1 minute to perform
configurations of the curve, and the fitting the curve to be outside of a
target zone.
[000216] In an embodiment, the system can show the information in color for
fast
understanding. Namely, the graphic representations can show the tops for the
33
CA 02804354 2013-02-01
,
,
= .
formations as green markers, the bottom of the target formation can be red,
particular
-
named formations such "Eagleford Shale "can be color coded blue or yellow,
brown,
black, and the curves for the wellbore path can be dashed lines, or solid
lines, the
wellbore path can change color as the wellbore path passes through specific
formations. A hot gamma ray path can be red, and a cold gamma ray path can be
blue
to easily identify the hot zone versus the cold zone.
[000217] An alarm 58 is shown as a "red flag area" indicated on the executive
dashboard 26.
The alarm 58 can inform the user that the drill bit is about to enter
dangerous territory
and should be realigned. The alarm 58 can be formed from computer instructions
348
(shown in Figure 5) that transmit an alarm when the data from the actual drill
bit
location exceeds or does not meet preprogrammed levels.
[000218] The executive dashboard 26 can display generated text 338. The
generated text 338
can display warning information. The executive dashboard 26 can also display a
text
recommendation 340. The text recommendation 340 can instruct a user to change
drilling direction by degrees of azimuth, degree of inclination, or
combinations
thereof
[000219] Figure 5 depicts an embodiment of an executive dashboard 26 with a
plurality of
control buttons that can be presented to a user to manipulate, such as by
clicking a
mouse over the buttons.
[000220] The control buttons can include: a control button 36a to manipulate a
start measured
depth, a control button 36b to manipulate an ending measured depth, a control
button
36c to manipulate a true vertical depth offset, and a control button 36d to
manipulate
a dip or dip angle in degrees. For example, the user can increase values,
decrease
values, or replace a value with a new value using the control buttons.
[000221] A first indicator 36e to identify dipping away from the projected
path of the drill bit,
and a second indicator 36f to identify dipping towards the projected path of
the drill
bit are also depicted.
34
CA 02804354 2013-02-01
[000222] Additional navigation controls can be presented to the user,
including a first
navigation control 150 for moving the portion of interest in the stratigraphic
section
in a first direction along the stratigraphic cross section, and a second
navigation
control 152 for moving portion of interest in the stratigraphic section 57 in
a second
direction along the stratigraphic cross section. In one or more embodiments,
the
navigation controls can have "double" arrows for moving a user to the end or
start of
a stratigraphic cross section.
[000223] The executive dashboard 26 can have additional buttons 44,45,46,47,
48, and 50 that
can be used to manipulate a first relative matching graph 43a and a second
relative
matching graph 43b.
[000224] The additional control buttons include an actual scale factor button
40 that can be
used to increase or decrease a scale value of the actual curves for both of
the relative
matching graphs, such as the gamma ray curves and the total gas curves.
[000225] The executive dashboard 26 can include a control button 42 to set,
change, increase,
or decrease a starting true vertical depth offset of a type log curve for both
of the
relative matching graphs.
[000226] The additional controls for the relative matching graph 43a can
include a control
button 44 for each of the relative matching graphs that can be used for depth
zoom-in
and a control button 45 for each of the relative matching graphs that can be
used for
depth zoom-out. For example, a user can use a depth zoom-in to examine the
curve
values in more detail to achieve a better or desired curve fit.
[000227] A control button 46 for each of the relative matching graphs that can
be used for
value zoom-in, a control button 47 for each of the relative matching graphs
that can
be used for value zoom-out, and a control button 48 for each of the relative
matching
graphs that can be used to scroll up along the relative matching graph 43a.
For
example, a user can use a value zoom-out button to examine the curve from a
macro
perspective rather than in detail.
CA 02804354 2013-02-01
=
. .
[000228] A control button 50 for each of the relative matching graphs is also
used to scroll
down along the relative matching graph 43a. For example, the user can use
control
button 50 to view different portions of the relative graph. The relative
matching graph
43b can have the same additional control buttons, which are not labeled in
this figure.
[000229] The relative matching graphs can be formed by plotting the target
relative depth scale
51 versus the value scale 52. The target relative depth scale 51 can be a true
vertical
depth scale that is relative to the target true vertical depth. For example,
if the target
true vertical depth is 6632 feet, this target true vertical depth can be set
as a zero on
the target relative depth scale 51, such that a value of -100 feet on the
target relative
depth scale 51 would represent 6532 feet in terms of true vertical depth, and
a value
of 50 feet on the target relative depth scale 51 would represent 6682 feet in
terms of
true vertical depth. The value scale 52 can be a real-time value of the actual
curves
and type log curves, such as the gamma ray curves and other curves.
[000230] The relative matching graph 43a can include: the first
formation/marker top 53, the
second formation/marker top 54, and the third formation/marker top 55. In
operation,
a user can use the two relative matching graphs to view two separate views of
the
actual curve overlaid onto the type log curve, thereby simultaneously viewing
a
macro and a micro view of the curve fit.
[000231] The executive dashboard 26 can include additional control buttons,
which can be
disposed below the plot of the actual curves, such as the gamma rays curve
110,
which are disposed below the wellbore profile 25. For example, the executive
dashboard 26 can include a control button 38 to add a stratigraphic section to
the
wellbore profile, and control button 39 to delete a stratigraphic section to
the wellbore
profile. For example, the user can add a stratigraphic section representing
the
measured depths of the wellbore starting at 7040 feet and ending at 7650 feet
to the
wellbore profile 25. The executive dashboard 26 can include a control button
to set
speed control 41a for depth and a control button speed control 41b for dip,
which can
each be used to adjust a rate of change of the other controls of the executive
dashboard 26.
36
CA 02804354 2013-02-01
,
[000232] The wellbore profile 25 and the plot of the actual curves, such as
the gamma ray
curve 110, can include a portion of interest in the stratigraphic section 57.
A portion
of the actual curve 49a within the portion of interest in the stratigraphic
section 57
can be plotted within each of the relative matching graphs 43a and 43b, shown
as 49b
and 49c, along with the type log curves 103a and 103b.
[000233] In operation, the user can add stratigraphic sections using the
control buttons. Then,
for each stratigraphic section, the user can adjust a width of the portion of
interest in
the stratigraphic section 57. Then, for each stratigraphic section, the user
can then
adjust true vertical depth offset and the dip or dip angle using the control
buttons such
that the actual curve overlays the type log curve to achieve the highest
degree of
fit/correlation between the two curves as is possible. Adjusting the true
vertical depth
offset in the actual curve changes the vertical shift of the actual curve as
plotted.
Adjusting the dip or dip angle of the actual curve changes the thickness,
shape, and
direction of the actual curve as plotted.
[000234] Also shown is gamma ray curve 110.
[000235] Figures 6A-6F are a representation of the data storage of the system.
[000236] Figure 6A shows that the data storage 7 can include computer
instructions 600 to
instruct the processor to create an executive dashboard and to continuously
present
the executive dashboard on a display to a user in real-time.
[000237] The data storage 7 can include computer instructions 602 to instruct
the processor to
identify a projected path in the dashboard simultaneously in two dimensions
and three
dimensions, for the drilling bit during directional drilling, and to store the
projected
path in the data storage.
[000238] The data storage 7 can include computer instructions 604 to instruct
the processor to
import data, to the dashboard, including a plurality of offset/type tops of a
projected
formation through which the projected path will follow, from a second data
storage to
an offset/type table.
37
CA 02804354 2013-02-01
[000239] The data storage 7 can include computer instructions 606 to instruct
the processor to
import data to the dashboard, including an actual survey of the wellbore from
the
second data storage, a third data storage, or combinations thereof, into the
data
storage.
[000240] The data storage 7 can include computer instructions 608 to instruct
the processor to
import data to the dashboard, including a geological prognosis from the second
data
storage, third data storage, a fourth data storage, or combinations thereof to
a
prognosed tops table into the data storage.
[000241] The data storage 7 can include computer instructions 610 to instruct
the processor to
compute a wellbore profile for display on the dashboard using the imported
data,
wherein the wellbore profile is a composite visualization of a plurality of
true vertical
depths, and to compute the stratigraphic cross section for the wellbore
profile.
[000242] The data storage 7 can include computer instructions 612 to instruct
the processor to
plot an actual drilling path for display on the dashboard using the actual
survey.
[000243] The data storage 7 can include computer instructions 614 to instruct
the processor to
overlay the actual drilling path onto the projected path in the stratigraphic
cross
section in the wellbore profile, for display on the dashboard, thereby
enabling a real-
time and moment-by-moment updating of the actual drilling path over the
projected
path for the drill bit. A user can therefore view the actual drilling path and
the
projected drilling path in the executive dashboard.
[000244] The data storage 7 can include computer instructions 616 to instruct
the processor to
present control buttons to the user on the executive dashboard enabling the
user to
increase or decrease, for at least one portion of the stratigraphic cross
section, each
member of the group consisting of: a start measured depth, an ending measured
depth, a true vertical depths offset, and a dip.
[000245] Figure 6B is a continuation of Figure 6A. The data storage 7 can
include computer
instructions 617 to instruct the processor to enable the user to increase or
decrease
values associated with each control button to modify: the start measured
depth, the
38
CA 02804354 2013-02-01
ending measured depth, the true vertical depths offset, the dip, or
combinations
thereof, on portions of the stratigraphic cross section to correctly identify
a location of
the drill bit in the stratigraphic cross section.
[000246] The data storage 7 can include computer instructions 618 to instruct
the processor to
compute the true vertical depths as measured at the perpendicular angle from
the
horizontal plane representing the surface surrounding the wellbore using
measured
depths, inclinations, and azimuths; to plot the true vertical depths versus
the measured
depths of the drill bit; and to present the plotted true vertical depths
versus the
measured depths within the wellbore profile in the executive dashboard.
[000247] One or more embodiments can include one or more control buttons that
control rates
of speed for one or more other controls. For example, the data storage 7 can
include
computer instructions 620 to instruct the processor to present a first speed
control
button in the executive dashboard to control a rate of adjustment for control
buttons,
and a second speed control button to control a rate of adjustment for control
buttons.
[000248] The data storage 7 can include computer instructions 622 to instruct
the processor to
transmit an alarm if continued drilling in a formation: will violate a permit.
[000249] The data storage 7 can include computer instructions 624 to instruct
the processor to
superimpose the projected path for the drill bit over a formation structure
map to
determine faults through which the projected path will pass.
[000250] The data storage 7 can include computer instructions 626 to instruct
the processor to
superimpose the projected path for the drill bit over the stratigraphic cross
section to
determine specific next formations through which the projected path will pass.
[000251] The data storage 7 can include computer instructions 628 to instruct
the processor to
form a report of the projected path and the actual drilling path, and to
present the
report of the projected path and the actual drilling path in the executive
dashboard to
be viewed in real-time by a plurality of users simultaneously.
39
CA 02804354 2013-02-01
=
[000252] The data storage 7 can include computer instructions 630 to instruct
the processor to
form a report of past drilling data and planned drilling actions associated
with the
executive dashboard.
[000253] The data storage 7 can include computer instructions 632 to instruct
the processor to
display in the executive dashboard an actual location of the drill bit on the
actual
drilling path for instantaneous identification of the drill bit during
horizontal drilling.
[000254] Figure 6C is a continuation of Figure 6B. The data storage 7 can
include computer
instructions 634 to instruct the processor to use a surface elevation or a
rotary table
bushing elevation of a surface for a start of a bore hole and at least one
offset/type
tops of the projected formation to generate the geological prognosis.
[000255] The data storage 7 can include computer instructions 636 to instruct
the processor to
use type log tops from a vertical well proximate the wellbore to calculate
thicknesses
of formations, thicknesses of rock between formations, other geological
features, or
combinations thereof. The vertical well proximate the wellbore can be used as
a
reference point to represent geological features of the area proximate the
wellbore,
such as thicknesses of formations and thicknesses of rock between formations.
[000256] The data storage 7 can include computer instructions 638 to instruct
the processor to
generate the projected path by calculating the projected path using a kick off
point, a
build rate, a landing point, and a target angle. The kick off point can be the
portion of
the wellbore wherein the horizontal drilling begins. The build rate can be the
rate of
change of inclination of the wellbore to reach the landing point. The landing
point can
be the point at which the wellbore reaches a target depth. The target angle
can be the
angle of inclination of the wellbore as it extends from the landing point.
[000257] The data storage 7 can include computer instructions 640 to instruct
the processor to
provide correlation points for at least one actual curve or at least one point
along an
actual curve of the stratigraphic cross section, wherein each correlation
point is tied to
a known type log curve for confirming accuracy of the actual curve, accuracy
of a fit
of the actual curve to the known type log curve, or combinations thereof.
CA 02804354 2013-02-01
=
[000258] The data storage 7 can include computer instructions 642 to instruct
the processor to
provide correlation points for at least one actual curve or at least one point
along an
actual curve of the stratigraphic cross section to allow the user to thicken
or thin each
actual curve of the stratigraphic cross section to fit a known type log curve.
[000259] The data storage 7 can include computer instructions 644 to instruct
the processor to
present the projected path in the executive dashboard simultaneously in two
dimensions and in three dimensions. The three dimensional presentation of the
projected path includes an overlay of an ownership map for the land and a
seismic
image projected into the three dimensional presentation. The ownership map can
be
used to determine whether or not the actual drilling path and the projected
path are
within identified land ownership/lease boundaries.
[000260] The data storage 7 can include computer instructions 646 to instruct
the processor to
store data received from the directional drilling equipment within the data
storage.
[000261] The data storage 7 can include computer instructions 648 to instruct
the processor to
communicate over a network and to import the plurality of offset/type tops of
the
projected formation through which the projected path will follow.
[000262] The data storage 7 can include computer instructions 650 to instruct
the processor to
save the wellbore profile in the data storage.
[000263] The data storage 7 can include computer instructions 652 to instruct
the processor to
transmit the wellbore profile to the display.
[000264] The data storage 7 can include computer instructions 654 to instruct
the processor to
compute a "distance to next formation" using the measured depth from the
current
formation.
[000265] Figure 6D is a continuation of Figure 6C. The data storage 7 can
include computer
instructions 656 to instruct the processor to use an estimated true vertical
depth of the
next formation and a kelly bushing elevation to compute an "estimated subsea
depth
of next formation."
41
CA 02804354 2013-02-01
[000266] The data storage 7 can include computer instructions 658 to instruct
the processor to
determine a "current dip."
[000267] The data storage 7 can include computer instructions 660 to instruct
the processor to
calculate a "current true vertical depth."
[000268] The data storage 7 can include computer instructions 662 to instruct
the processor to
present the reports to the user in addition to and simultaneously with the
executive
dashboard.
[000269] The data storage 7 can include computer instructions 664 to instruct
the processor to
configure the executive dashboard to allow users to highlight portions of the
wellbore
profile.
[000270] The data storage 7 can include computer instructions 666 to instruct
the processor to
plot an actual curve and to plot a type log curve for use within the same
graph.
[000271] The data storage 7 can include computer instructions 668 to instruct
the processor to
form a plot of a portion of the actual curve within the portion of interest in
the
stratigraphic section versus the target relative depth scale.
[000272] The calculation used to plot the portion of the actual curve within
the portion of
interest in the stratigraphic section versus the target relative depth scale
can include as
factors: the true vertical depths of the wellbore that passes through the
stratigraphic
section, as well as any formation dips and/or faults that occur in the
stratigraphic
section. For example, the plot of the portion of the actual curve within the
portion of
interest in the stratigraphic section versus the target relative depth scale
can be
calculated using a plurality of sampling data points along the portion of the
actual
curve having a measured depth and an actual value.
[000273] The data storage 7 contains computer instructions 670 to instruct the
processor to
calculate a change in true vertical depth due to a dip. The calculation of the
change in
true vertical depth due to the dip can be performed by multiplying the tangent
of the
negation of the dip angle (DA) for the stratigraphic section with the absolute
value of
42
CA 02804354 2013-02-01
=
the difference in the measured depth (MD) and the starting measured depth
(SMD) of
the stratigraphic section, that is, tan(-DA) x IMD-SMDI.
[000274] The data storage 7 can include computer instructions 672 to instruct
the processor to
calculate the true vertical depth at the starting measured depth for the
stratigraphic
section using the actual survey stored in the data storage. The calculation of
the true
vertical depth at the starting measured depth for the stratigraphic section
using the
actual survey stored in the data storage can also be performed using the
computer
instructions 660, but using a measured depth other than the current measured
depth.
[000275] The data storage 7 can include computer instructions 674 to instruct
the processor to
calculate the true vertical depth at the measured depth of the data point
along the
actual curve using the actual survey within the data storage. The calculation
of the
true vertical depth at the measured depth at the data point along the actual
curve using
the actual survey within the data storage can be performed using the computer
instructions 660.
[000276] The data storage 7 can include computer instructions 676 to instruct
the processor to
calculate a change in the true vertical depth due to a change in true vertical
depth in
the actual survey by determining a difference between the true vertical depth
at the
starting measured depth and the true vertical depth at the measured depth at
the data
point along the actual curve.
[000277] Figure 6E is a continuation of Figure 6D. The data storage 7 can
include computer
instructions 678 to instruct the processor to calculate a change in target
relative depth
by performing a summation of the change in true vertical depth due to dip and
the
change in true vertical depth due to the change in true vertical depth in the
actual
survey.
[000278] The data storage 7 can include computer instructions 680 to instruct
the processor to
calculate an "X" axis value for the plot of the portion of the actual curve
within the
portion of interest in the stratigraphic section versus the target relative
depth scale by
multiplying an actual value of the data point with an actual scale factor.
43
CA 02804354 2013-02-01
[000279] The actual scale factor can be set by a user using the control
buttons in the executive
dashboard.
[000280] The data storage 7 can include computer instructions 682 to instruct
the processor to
calculate a "Y" axis value for the plot of the portion of the actual curve
within the
portion of interest in the stratigraphic section versus the target relative
depth scale by
determining a difference between the starting target relative depth of the
stratigraphic
section and the change in target relative depth, and then subtract the true
vertical
depth shift from the determined difference.
[000281] The true vertical depth shift can be set by a user using the control
buttons in the
executive dashboard.
[000282] The data storage 7 can include computer instructions 684 to instruct
the processor to
plot the stratigraphic cross section.
[000283] The data storage 7 can include computer instructions 686 to instruct
the processor to
calculate the stratigraphic cross section consisting of multiple curves
representing
tops of formations through which the wellbore has traversed or is expected to
traverse.
[000284] In one or more embodiments, the multiple curves can represent
formations through
which the wellbore is expected not to traverse.
[000285] The data storage 7 can include computer instructions 688 to instruct
the processor to
plot curves for each formation in the stratigraphic cross section using: the
true vertical
depth offsets, the starting measured depth, the ending measured depth, the
dip, and
thicknesses from the offset/type tops table.
[000286] The data storage 7 can include computer instructions 690 to instruct
the processor to
determine two points along the plotted curves for each formation in the
stratigraphic
cross section, wherein a first point represents a starting point for a portion
of the
plotted curve, and a second point represents an ending point for the portion
of the
plotted curve, and wherein the portion of the plotted curve represents a
formation
within the portion of interest in the stratigraphic section. The portion of
the plotted
44
CA 02804354 2013-02-01
curve can be the portion of interest in the stratigraphic section. The first
point can
have a first X-axis value and a first Y-axis value, and the second point can
have a
second X-axis value and a second Y-axis value.
10002871 The data storage 7 can include computer instructions 692 to instruct
the processor to
use an "X" axis value of the first point of a previous stratigraphic section
as the
starting measured depth for the current stratigraphic section.
10002881 The data storage 7 can include computer instructions 694 to instruct
the processor to
calculate a "Y" axis value of the first point by summing a "Y" axis value of a
second
point of a previous stratigraphic section and the true vertical depth offset a
current
stratigraphic section.
[000289] Figure 6F is a continuation of Figure 6E. The data storage 7 can
include computer
instructions 696 to instruct the processor to use an "X" axis value of the
second point
as the ending measured depth for the current stratigraphic section.
10002901 The data storage 7 can include computer instructions 698 to instruct
the processor to
calculate a change in measured depth as the absolute value of the difference
in the
ending measured depth and the starting measured depth of the current
stratigraphic
section.
10002911 The data storage 7 can include computer instructions 700 to instruct
the processor to
calculate a change in true vertical depth by multiplying the tangent of the
negation of
the dip angle for the stratigraphic section with the change in measured depth
of the
current stratigraphic section.
10002921 The data storage 7 can include computer instructions 702 to instruct
the processor to
calculate a "Y" axis value of the second point by summing a "Y" axis value of
the
first point and the change in true vertical depth of the current stratigraphic
section. In
one or more embodiment of the calculation performed by computer instructions
702,
the current stratigraphic section can be replaced with the current portion of
interest in
the stratigraphic section.
CA 02804354 2013-02-01
[000293] The data storage 7 can include computer instructions to computer
instructions 615 to
=
transmit the executive dashboard from the geo-steering system to the drill rig
300
indicating that the well bore of the drill string operated by the drill rig is
on target or
off target.
[000294] The data storage 7 can also include computer instructions 619 for
transmitting the
executive dashboard to a multidimensional simulation allowing a user to select
a
dimensional plot of the operation of the drill rig, thereby allowing the
drilling rig to
adjust drilling in real time, with an ability to change direction and to stay
on target in
the wellbore within 3 to 12 hours.
[000295] One or more embodiment can include computer instructions 621 to
encrypt the data
from the drill rig and to encrypt the signal from the geo-steering system to
the drill
rig.
[000296] Figure 7 is presentation of a geological prognosis 22 usable in the
invention. The
geological prognosis 22 can include: header information 168, payzones 170,
formation information 172, top depths of formations 174, base depths of
formations
178, and a target line 180.
[000297] For example, the header information 168 can include information about
the wellbore
including contact information, identifying information for the wellbore, and
other
information. The payzones 170 can also be referred to as target objectives,
project
objectives, zones of interest, and formations of interest. The formation
information
172 can include formation names, formation markers, markers, and annotated
points
of interest. The target line 180 can include the target true vertical depth,
the target
angle, and a range above and below the target depth forming a target zone. The
top
depths of formations 174 can be true vertical depths or measured depths. The
base
depths of formations 178 can be true vertical depths or measured depths.
[000298] Figure 8 is a representation of an offset/type table 15 usable in the
system, including a
table identifier 181 that identifies the type log tops being stored in the
offset/type
table.
46
CA 02804354 2013-02-01
[000299] The offset/type table 15 can include rows and columns of data. A
first column of data
182 can include a formation marker name. The first column of data 182 can
include a
plurality of offset/type tops of a projected formation, including offset/type
top 14a,
offset/type top 14d, offset/type top 14g, and offset/type top 14j.
[000300] The offset/type table 15 can include: top depths of formations column
184, such as
depth 2110.0 feet for the Selman Sand formation.
[000301] The offset/type table 15 can include a true vertical depth tops
column 186, which can
be 3744.0 for the Midland Silt marker formation.
[000302] The offset/type table 15 can include a true vertical depths base
column 188, such as
4850 for the Thomas SS formation.
[000303] The offset/type table 15 can include a subsea true vertical depth
tops column 190,
such as -4032 for the Brian market 1 formation.
[000304] Additionally the offset/type table 15 can include a subsea true
vertical depth base
column 192, such as -911.0 for the Selman Sand formation, and a thickness
column
194, such as 264.0 for the Midland silt marker.
[000305] The offset/type table 15 can have a first selector button 191 that
allows a user to enter
a true vertical depth into the top depths of formations column 184. A second
selector
button 195 can allow a user to enter a subsea true vertical depth into the top
depths of
formations column 184.
[000306] The offset/type table 15 can have three storage buttons including a
save and close
button 193 that can be used to save data that has been edited in the table 15
to the data
storage 7 of Figure 1, and saves the presented template of the offset/type
table 15, and
can remove the offset/type table 15 from the display. A save button 197 can be
used
to save the data that has been edited in the offset/type table 15 to the data
storage 7. A
close button 199 can be used to close present a template of offset/type table
15, and to
remove the template from the display.
47
CA 02804354 2013-02-01
10003071 Figure 9 is a representation of an actual survey 18 usable in the
system. The actual
survey 18 can include: a measured depth 196; an inclination 198; an azimuth
200; a
tool type 202; such as a gyroscope, a survey table name 204; a proposed
azimuth 206,
such as 149.0 degrees; a target angle 208, such as 90 degrees; a survey
calculation
method 210, such as the minimum curvature method; a target true vertical depth
212,
such as 6632.2; an initial value true vertical depth 214; an initial value
vertical section
216; a northing 59, and an casting 220.
10003081 As an example, in one or more embodiment of the actual survey 18,
calculations will
not be performed in the first line of the actual survey; rather, initial
values will
presented here, such as: starting points, the TVD is 5824.90, the vertical
section, the
northing, and the casting.
10003091 The actual survey 18 can include exemplary survey points. The
exemplary survey
points can include the measured depths at which the actual survey is being or
has
been conducted, such as at 5890 feet. The actual survey 18 can show that the
survey
is using a gyro tool, as depicted in the tool type 202 column. For example,
the gyro
tool can measure the inclination as 2.3 degrees from vertical, and the azimuth
can be
a compass direction at 172.8 degrees when at a depth of 5890 feet. The actual
survey
18 can include a save and close button, a save button, and a close button
which can
function the same as those described for the offset/type table described
herein.
[0003101 Figure 10 is a detailed view of a stratigraphic cross section 11 for
the wellbore profile
25. The stratigraphic cross section 11 can include: a projected path 12 for a
drilling
bit, an actual path 35 for the drilling bit, a true vertical depth offset 106
for the
stratigraphic cross section of the wellbore, a dip angle 108 for the
stratigraphic cross
section, which is shown in this Figure as a dip away that is approximately a
30 degree
angle.
10003111 The stratigraphic cross section 11 can include: one of the offset
type tops sections 100
through which the projected path will follow, a starting measured depth 102
for a
stratigraphic section 57 of the wellbore, and an ending measured depth 104 for
the
stratigraphic section 57.
48
CA 02804354 2013-02-01
[000312] The stratigraphic cross section 11 can display formations. The
formations can be
identified hydrocarbon bearing formations.
[000313] Figure 11 depicts an embodiment of a prognosed tops table 24.
[000314] The prognosed tops table 24 can include the table identifier 181 that
identifies the
type log tops being stored in the prognosed tops table 24.
[000315] The prognosed tops table 24 can include rows and columns of data. A
first column of
data 182 that includes formation names 182. The first column of data 182 can
include
a plurality of offset/type tops of a projected formation, including
offset/type top 14a,
offset/type top 14d, offset/type top 14g, and offset/type top 14j.
[000316] The prognosed tops table 24 can include: top depths of formations
column 184, such
as depth 2110.0 feet for the Selman Sand formation.
[000317] The prognosed tops table 24 can include a true vertical depth tops
column 186, which
can be 3744.0 for the Midland Silt marker formation.
[000318] The prognosed tops table 24 can include a true vertical depths base
column 188, such
as 4850 for the Thomas SS formation.
[000319] The prognosed tops table 24 can include a subsea true vertical depth
tops column 190,
such as -4032 for the Brian market 1 formation.
10003201 Additionally the prognosed tops table 24 can include a subsea true
vertical depth base
column 192, such as -911.0 for the Selman Sand formation, and a thickness of
formation column 194, such as 264.0 for the Midland silt marker.
[000321] The prognosed tops table 24 can have a first selector button 191 that
allows a user to
enter a true vertical depth into the top depths of formations column 184. A
second
selector button 195 can allow a user to enter a subsea true vertical depth
into the top
depths of formations column 184.
[000322] The prognosed tops table 24 can have three storage buttons including
a save and close
button 193 that can be used to save data that has been edited in the prognosed
tops
49
CA 02804354 2013-02-01
=
table to the data storage 7 of Figure 1, and saves the presented template of
the
prognosed tops table, and can remove the prognosed tops table 24 from the
display. A
save button 197 can be used to save the data that has been edited in the
prognosed
tops table 24 to the data storage 7. A close button 199 can be used to close
the
prognosed tops table 24, and to remove the prognosed tops table from the
display.
[000323] Figure 12 depicts an embodiment of a method of drilling using the
drilling model.
[000324] The method 1200 can include identifying a projected path
simultaneously in at least
one dimension for the drill string during directional drilling 1202.
[000325] The method 1200 can also include computing a wellbore profile using
the data 1210.
The wellbore profile can be a composite visualization of a plurality of true
vertical
depths.
[000326] The method 1200 can include computing a stratigraphic cross section
for the wellbore
profile 1217.
[000327] The method 1200 can include plotting an actual drilling path for the
drill string using
an actual survey from the actual drilling path 1218.
[000328] The method 1200 can include overlaying the actual drilling path onto
a projected path
in the stratigraphic cross section in the wellbore profile 1220.
[000329] The method 1200 can include transmitting the executive dashboard from
the geo-
steering system to the drill rig 1225.
[000330] The method 1200 can include transmitting the executive dashboard to a
multi-
dimensional simulation 1229.
[000331] The method 1200 can include collecting data from the wellbore from a
tool connected
to the drill string of the drilling rig 1230.
[000332] The method 1200 can include transmitting the data collected to the
geo-steering
model 1232.
CA 02804354 2013-02-01
[000333] The method 1200 can include receiving data from the geo-steering
model 1234.
=
[000334] The method 1200 can include presenting a wellbore profile graphically
to the user on
a display at a drill rig site 1236.
[000335] The method 1200 can include offering a link to the user at a drill
rig site to link to a
network 1238.
[000336] Figure 13 depicts computer instructions stored on the data storage
for running and
forming an embodiment of an executive dashboard.
[000337] The data storage 7 can include computer instructions to create an
actual scale factor
button allowing the user to increase or decrease the scale factor of the
actual curve for
both of the relative matching graphs 1313.
[000338] The data storage 7 can also include computer instructions to create a
control button to
set, change, increase, or decrease a starting true vertical depth offset of
the type log
curve for both of the relative matching graphs 1314.
[000339] The data storage 7 can also include computer instructions to a create
control button
for each of the relative matching graphs allowing the user to depth zoom-in
and
zoom-out 1315.
[000340] The data storage 7 can include computer instructions to create to a
control button for
each of the relative matching graphs allowing the user to scroll up and scroll
down
along each relative matching graph 1319
[000341] The data storage 7 can include computer instructions to create a
control button to add
stratigraphic cross sections to the wellbore profile 1317 and computer
instructions to
delete stratigraphic cross sections to the wellbore profile 1327.
[000342] The data storage 7 can include computer instructions to create a
first indicator to
identify dipping away from the projected path; and a second indicator to
identify
dipping towards the projected path 1321.
[000343] The data storage 7 can include computer instructions to create a
first navigation
51
CA 02804354 2013-02-01
. .
control for moving the portion of interest in the stratigraphic section in a
first
direction along the stratigraphic cross section and a second navigation
control for
moving portion of interest in the stratigraphic section in a second direction
along the
stratigraphic cross section 1323.
[000344] The data storage 7 can include computer instructions to create a
legend showing: a
planned wellbore, an actual wellbore, formation names, a current formation
name, a
next formation name, total gas curves, gamma ray curves, or other curves 1340.
[000345] The data storage 7 can include computer instructions to create at
least one speed
control button to control a rate of adjustment for at least one of the control
buttons;
and combinations thereof 1320.
[000346] The data storage 7 can include computer instructions to create to a
control button for
each of the relative matching graphs allowing the user to scroll down along
each
relative matching graph 1325.
[000347] The data storage 7 can include computer instruction to present a tool
bar to the user
1329. The toolbar can include a job management menu that allows the user to
choose
at least one of the following options: new, open from local database, open
from file,
close, edit job information, save/export job to file, and exit program; a
report
generation menu that allows the user to choose at least one of the following
options:
create a PDF report or create a rich text format report; a tops button to
produce a drop
down menu allowing the user to edit type logs and edit prognosed tops tables;
a
survey button that allows the user to choose at least one of the following:
edit a
planned survey or edit the actual survey; a stratigraphy button that permits
the user to
edit stratigraphy adjustments to cause the correlation of the actual curve to
the type
log curve; a curve button that enables the user to perform editing of
continuous curves
in the wellbore profile; an update button that allows the user to update data
from data
sources in a synchronized manner; a configure button that allows the user to
select at
least one of the following: formations, curves, data sources, data source
mappings,
alarms, number of days left on a license key, and information on validity of
the
license key; a help button that allows the user to type questions and receive
answers
52
CA 02804354 2013-02-01
based on key words within the questions; and combinations thereof.
[000348] Figures 14A-14E depict an embodiment of a method for geo-steering
during
directional drilling of a wellbore that call be implemented using one or more
embodiments of the method disclosed herein.
[000349] Figure 14A shows that the method can include forming an executive
dashboard and
continuously presenting the executive dashboard in real-time to a display of a
client
device of a user, as illustrated by box 1000.
[000350] The method can include presenting within the executive dashboard to
the user at least
a portion of received data from directional drilling equipment and a portion
of interest
in a stratigraphic cross section for user identification of: a drill bit in
the stratigraphic
cross section, formations in the stratigraphic cross section, other formation
data, as
illustrated by box 1002.
[000351] The method can include identifying a projected path for the drill bit
during directional
drilling and presenting the projected path within the executive dashboard, as
illustrated by box 1004.
[000352] The method can include computing a wellbore profile for the wellbore,
as illustrated
by box 1006.
[000353] For example, the wellbore profile can be computed using: an
onset/type table
including a plurality of offset/type tops of a projected formation through
which the
projected path is expected to pass: an actual survey of the wellbore: and a
geological
prognosis from a prognosed tops table comprising at least one depth for at
least one
formation top through which the projected path is expected to pass, wherein
the
wellbore profile is a composite visualization of a plurality of true vertical
depths.
[000354] The method can include computing the stratigraphic cross section for
the wellbore
profile, as illustrated by box 1008.
[000355] For example, the stratigraphic cross section can be computed using
the imported data,
wherein the stratigraphic cross section comprises: a formation dipping away
from a
53
CA 02804354 2013-02-01
perpendicular angle from a horizontal plane representing a surface surrounding
the
wellbore: a formation dipping toward the perpendicular angle from the
horizontal
plane representing the surface surrounding the wellbore: or combinations
thereof.
[000356] The method can include plotting an actual drilling path for the drill
bit using the
actual survey, as illustrated by box 1010.
[000357] The method can include overlaying the actual drilling path onto the
projected path in
the stratigraphic cross section in the wellbore profile, thereby enabling real-
time
updating of the actual drilling path over the projected path, as illustrated
by box 1012.
[000358] The method can include presenting control buttons to the user on the
executive
dashboard enabling the user to increase or decrease: a start measured depth,
ending
measured depth, and true vertical depth offset of the portion of interest in
the
stratigraphic cross section; and a dip of the projected formation for the
portion of the
stratigraphic cross section, as illustrated by box 1014.
[000359] The method can include sending data and/or commands to the
directional drilling
equipment using the executive dashboard to steer the drill bit in the wellbore
or
allowing the user to send data and/or commands to the directional drilling
equipment
using the executive dashboard to steer the drill bit in the wellbore, as
illustrated by
box 1016.
[000360] The method can include computing the portion of interest of the
stratigraphic section,
as illustrated by box 1018.
[000361] For example, the portion of interest of the stratigraphic section can
be computed using
one of the plurality of offset/type tops of the projected formation through
which the
projected path is expected to pass, the start measured depth, the ending
measured
depth, the true vertical depth offset and the dip angle.
[000362] The method can include presenting an actual curve with the wellbore
profile in the
executive dashboard, as illustrated by box 1020.
10003631 The method can include forming a plot of a portion of the actual
curve within the
54
CA 02804354 2013-02-01
portion of interest in the stratigraphic cross section versus a target
relative depth
scale, as illustrated by box 1022.
[000364] The method can include calculating a change in true vertical depth
due to the dip
angle, as illustrated by box 1024.
[000365] Figure 14B is a continuation of Figure 14A. The method can include
calculating the
true vertical depth at the start measured depth for the portion of interest in
the
stratigraphic cross section using the actual survey, as illustrated by box
1026.
[000366] The method can include calculating the true vertical depth at a
measured depth of a
plurality of sampling data points along the actual curve using the actual
survey, as
illustrated by box 1028.
[000367] The method can include calculating a change in the true vertical
depth, as illustrated
by box 1030.
[000368] For example, the change in the true vertical depth can be calculated
by determining a
difference between the true vertical depth at the start measured depth and the
true
vertical depth at the measured depth of each of the plurality of sampling data
points
along the actual curve.
[000369] The method can include calculating a change in target relative depth,
as illustrated by
box 1032.
[000370] For example, the change in target relative depth can be calculated by
performing a
summation of the change in true vertical depth using the dip angle and the
change in
true vertical depth.
[000371] The method can include calculating an X-axis value for the plot of
the portion of the
actual curve versus the target relative depth scale, as illustrated by box
1034.
[000372] For example, the X-axis value can be calculated by multiplying an
actual value of one
of the plurality of data points with an actual scale factor.
[000373] The method can include calculating a Y-axis value for the plot of the
portion of the
CA 02804354 2013-02-01
actual curve versus the target relative depth scale, as illustrated by box
1036.
10003741 For example, the Y-axis value can be calculated by subtracting a
starting target
relative depth of the portion of interest in the stratigraphic cross section
from a
change in target relative depth forming a difference, and then subtracting a
true
vertical depth shift from the difference.
[000375] The method can include displaying the plot of the portion of the
actual curve versus
the target relative depth scale simultaneously in a first relative matching
graph and a
second relative matching graph allowing the user to correlate the actual curve
to the
type log curve, as illustrated by box 1038.
[000376] The method can include presenting within the executive dashboard
various controls,
buttons, legends, and indicators allowing the user to control portions of the
executive
dashboard, as illustrated by box 1040.
10003771 For example, the various controls, buttons, legends, and indicators
can include: an
actual scale factor button allowing the user to increase or decrease the scale
factor of
the actual curve for both of the relative matching graphs: a control button to
set,
change, increase, or decrease a starting true vertical depth offset of the
type log curve
for both of the relative matching graphs: a control button for each of the
relative
matching graphs allowing the user to depth zoom-in: a control button for each
of the
relative matching graphs allowing the user to depth zoom-out; a control button
for
each of the relative matching graphs allowing the user to value zoom-in; a
control
button for each of tile relative matching graphs allowing the user to value
zoom-out; a
control button for each of the relative matching graphs allowing the user to
scroll up
along each relative matching graph: a control button for each of the relative
matching
graphs allowing the user to scroll clown along each relative matching graph; a
control
button to add stratigraphic cross sections to the wellbore profile; a control
button to
delete stratigraphic cross sections from the wellbore profile; a first
indicator to
identify dipping away from the projected path; a second indicator to identify
dipping
towards the projected path; a first navigation control for moving the portion
of
interest in the stratigraphic section in a first direction along the
stratigraphic cross
56
CA 02804354 2013-02-01
section; a second navigation control for moving portion of interest in the
stratigraphic
section in a second direction along the stratigraphic cross section: a legend
showing: a
planned wellbore, an actual wellbore, formation names, a current formation
name, a
next formation name, total gas curves, gamma ray curves, or other curves: at
least one
speed control button to control a rate of adjustment for at least one of the
control
buttons; and combinations thereof.
[000378] The method can include plotting as the actual curve: a gamma ray
curve, a total gas
curve, a geologic curve, a seismic curve, or combinations thereof, as
illustrated by
box 1042.
[000379] The method can include presenting a toolbar within the executive
dashboard allowing
the user to perform tasks.
[000380] The toolbar can include various drop down menus to perform various
tasks as
described in Figure 2.
[000381] The method can include presenting controls within the executive
dashboard that allow
the user to correlate the actual curve to the type log curve including
controls that
allow the user to: adjust a width of the portion of interest in the
stratigraphic section:
and adjust true vertical depth offset and the dip angle using the control
buttons such
that the actual curve overlays the type log curve to achieve the correlation,
as
illustrated by box 1044.
[000382] The method can include computing and plotting the stratigraphic cross
section for the
wellbore profile, as illustrated by box 1046.
[000383] The method can include calculating the stratigraphic cross section,
as illustrated by
box 1048.
[000384] The stratigraphic cross section consists of multiple curves
representing tops of
formations through which the wellbore has traversed, is expected to traverse,
is
expected to not traverse, or combinations thereof.
[000385] The method can include plotting curves for each formation in the
stratigraphic cross
57
CA 02804354 2013-02-01
section, as illustrated by box 1050.
[000386] For example, the plotting of curves for each formation in the
stratigraphic cross
section can use: true vertical depth onsets from the portion of interest in
the
stratigraphic section, start measured depths from the portion of interest in
the
stratigraphic section, ending measured depths from the portion of interest in
the
stratigraphic section, dips from the portion of interest in the stratigraphic
section, and
thicknesses from the onset/type tops table.
[000387] The method can include determining a first point along the plotted
curves for each
formation in the stratigraphic cross section that represents a starting point
for the
portion of interest in the stratigraphic section, as illustrated by box 1052.
[000388] Figure 14C is a continuation of Figure 14B. The method can include
determining a
second point along the plotted curves for each formation in the stratigraphic
cross
section that represents an ending point for the portion of interest in the
stratigraphic
section, as illustrated by box 1054.
[000389] The portion of interest in the stratigraphic section can represent a
formation within
the portion of interest in the stratigraphic cross section. The first point
can include a
first X-axis value and a first Y-axis value, and the second point can include
a second
X-axis value and a second Y-axis value.
[000390] The method can include using the second X-axis value of a previous
portion or
interest in the stratigraphic section as the start measured depth for a
current portion or
interest in the stratigraphic section, as illustrated by box 1056.
[000391] The method can include calculating the first Y-axis value for the
current portion of
interest in the stratigraphic section, as illustrated by box 1058.
[000392] For example, the first Y-axis value for the current portion of
interest in the
stratigraphic section call be calculated by summing the second Y-axis value of
the
previous portion of interest in the stratigraphic section with a true vertical
depth offset
of the current portion of interest in the stratigraphic section.
58
CA 02804354 2013-02-01
= [000393] The method can include using the second X-axis value of the
current portion of
interest in the stratigraphic section as an ending measured depth for the
current
portion of interest in the stratigraphic section, as illustrated by box 1060.
[000394] The method can include calculating a change in measured depth, as
illustrated by box
1062.
[000395] For example, the change in measured depth can be calculated as an
absolute value of
a difference in the ending measured depth and the starting measured depth of
the
current portion of interest in the stratigraphic section.
[000396] The method can include calculating a change in true vertical depth,
as illustrated by
box 1064.
[000397] For example, the change in true vertical depth can be calculated by
multiplying a
tangent of a negation of a dip angle for the current portion of interest in
the
stratigraphic section with the change in measured depth of the current portion
of
interest in the stratigraphic section.
[000398] The method can include calculating the second Y-axis value, as
illustrated by box
1066.
[000399] For example, the second Y-axis value can be calculated by summing the
first Y-axis
value and the change in true vertical depth or the current portion of interest
in the
stratigraphic section.
[000400] The method can include including various portions of data within the
actual survey,
as illustrated by box 1068.
[000401] For example, the various portions of data can include a member of the
group
consisting of: a measured depth, an inclination, an azimuth, a tool type, a
survey table
name, a proposed azimuth, a target angle, a survey calculation method, a
target true
vertical depth, an initial true vertical depth, an initial vertical section,
an initial
northing, an initial casting, and combinations thereof.
[000402] The method can include including columns of data and buttons within
both the
59
CA 02804354 2013-02-01
offset/type table and the prognosed tops table, as illustrated by box 1070.
[000403] The method can include computing the plurality of true vertical
depths as measured at
the perpendicular angle from the horizontal plane representing the surface
surrounding the wellbore using measured depths, inclinations, and azimuths, as
illustrated by box 1072.
[000404] The method can include plotting the plurality of true vertical depths
versus measured
depths of the drill bit, as illustrated by box 1074.
[000405] The method can include presenting the plotted true vertical depths
versus the
measured depths within the wellbore profile in the executive dashboard, as
illustrated
by box 1076.
[000406] The method can include transmitting an alarm, as illustrated by box
1078.
[000407] For example, an alarm can be transmitted if continued drilling in a
formation: will
violate a permit, will pose a safety hazard, will be an economic hazard, or
combinations thereof, wherein the alarm is transmitted to the client device of
the user.
[000408] The method can include superimposing the projected path over a
formation structure
map of the projected formation, and using the superimposed projected path over
the
formation structure map to determine faults through which the projected path
is
expected to pass, as illustrated by box 1080.
[000409] Figure 14D is a continuation of Figure 14C. The method can include
superimposing
the projected path over the stratigraphic cross section, and using the
superimposed
projected path over the stratigaphic cross section to determine at least one
projected
formation through which the projected path is expected to pass, as illustrated
by box
1082.
[000410] The method can include forming a report of the projected path and the
actual drilling
path, and presenting the report of the projected path and the actual drilling
path in the
executive dashboard to be viewed in real-time by a plurality of users
simultaneously,
as illustrated by box 1084.
CA 02804354 2013-02-01
10004111 The method can include presenting current information within the
executive
dashboard for simultaneous display to the plurality of users, as illustrated
by box
1086.
[000412] The method can include forming a report of past drilling data and
planned drilling
actions und presenting the report of past drilling data and planned drilling
actions
within the display, as illustrated by box 1088.
10004131 The method can include displaying in the executive dashboard an
actual location of
the drill bit on the actual drilling path in the wellbore profile for
instantaneous
identification of the drill bit, as illustrated by box 1090.
[000414] The method can include plotting the subsea true vertical depth
against: the true
vertical depth, the start measured depth, and the ending measured depth: and
including the plot of the subsea true vertical depth within the wellbore
profile, as
illustrated by box. 1092.
10004151 The method can include determining the projected formation using a
geological
hypothesis of an actual geological formation, as illustrated by box 1094.
10004161 The method can include generating the geological prognosis using a
surface elevation
or a rotary table bushing elevation of the surface for a start or the wellbore
and at
least one offset/type top or the projected formation; or allowing the user to
provide
the geological prognosis, as illustrated by box 1096.
[0004171 The method can include using offset/type log tops from a vertical
well proximate the
wellbore to calculate thicknesses of formations, thicknesses of rock between
formations, other geological features, or combinations thereof, as illustrated
by box
1098.
10004181 The method can include including a type log in each of the plurality
of offset/type
tops, as illustrated by box 1100.
[000419] The method can include generating the projected path by calculating
the projected
path using a kick off point, a build rate, a landing point, and a target
angle; or
61
CA 02804354 2013-02-01
. .
allowing the user to provide the projected path, as illustrated by box 1102.
[000420] Figure 14E is a continuation of Figure 14D. The method can include
providing
correlation points for at least one actual curve or at least one point along
the actual
curve of the stratigaphic cross section, and tying each correlation point to a
known
type log curve for confirming: accuracy of the actual curve, accuracy of a fit
of the
actual curve to the known type log curve, or combinations thereof, as
illustrated by
box 1104.
[000421] The method can include allowing the user to thicken or thin each
actual curve within
the portion of interest of the stratigraphic section to tit the known type log
curve, as
illustrated by box 1106.
[000422] The method can include presenting the projected path in the executive
dashboard
simultaneously in two dimensions and in three dimensions, as illustrated by
box 1108.
[000423] The method can include storing the received data from the directional
drilling
equipment within a data storage, as illustrated by box 1110.
[0004241 The method can include communicating over a network and importing the
plurality of
offset/type tops of the projected formation through which the projected path
will
follow into the data storage, as illustrated by box 1112.
[000425] The method can include saving the wellbore profile in the data
storage, as illustrated
by box 1114.
[000426] The method can include transmitting the wellbore profile to the
display, as illustrated
by box 1116.
[000427] The method can include computing a "distance to next formation" using
measured
depth from a current formation, and presenting the computed "distance to next
formation" to the user within the executive dashboard, as illustrated by box
1118.
[000428] The method can include computing an "estimated subsea depth or next
formation"
using an estimated true vertical depth of a next formation and a kelly bushing
elevation, and presenting the "estimated subsea depth of a next formation" to
the user
62
CA 02804354 2013-02-01
=
in the executive dashboard, as illustrated by box 1120.
[000429] The method can include determining a "current dip angle" or a current
formation, as
illustrated by box 1122.
[000430] The method can include configuring the executive dashboard to allow
the user to
highlight portions of the wellbore profile, as illustrated by box 1124.
10004311 The method can include calculating a "current true vertical depth",
and presenting the
"current true vertical depth" in the executive dashboard, as illustrated by
box 1126.
[000432] The method can include presenting the report to the user in addition
to and
simultaneously with the executive dashboard, as illustrated by box 1128.
[000433] Figure 15 is a diagram of computer instructions usable to implement
an alarm. The
data storage 7 contains these computer instructions.
[000434] The data storage 7 can include computer instructions 344 to overlay
an actual drilling
path of the drill string over a projected drilling path, a stratigraphic cross
section for
drilling by the drill string, formations in the stratigraphic cross section,
and an actual
location of the drill bit.
[000435] The computer instructions for issuing the alarm can include computer
instructions
346 to calculate departure from a target zone for drilling based upon the
signals from
the sensors, which can be in communication with the dynamic condition monitor.
[000436] The computer instructions for issuing an alarm can also include
computer instructions
348 to provide an alarm when the calculations indicate a departure from the
target
zone, which can be in communication with the dynamic condition monitor.
[000437] The computer instructions for issuing the alarm can include computer
instructions
350 to use at least two industry standard gateways simultaneously to provide
the
alarm to different client devices with different client device protocols.
63
CA 02804354 2013-02-01
=
[000438] The computer instructions for issuing the alarm can include computer
instructions
352 to create and transmit to safety groupings alarms by a first priority
group of team
members first, a secondary priority group of team members, in series.
[000439] The computer instructions for issuing the alarm can include computer
instructions to
provide user information with the alarm 354 wherein the user information can
include
well location, well name, directions to the drilling rig, names of recipients
of the
alarm, current status of the drilling rig.
[000440] The computer instructions for issuing the alarm can include computer
instructions
356 in the data storage to provide with the alarm, an alarm receipt and a
retransmission from the client device that the user has received the alarm.
[000441] The computer instructions for issuing the alarm can include computer
instructions
358 to track the retransmissions from the user to indicate if the alarm has
reached
designated user.
[000442] The computer instructions 360 for issuing the alarm can include
computer
instructions to remedy drilling off target with specific text directions to a
user
describing equipment operation.
[000443] The computer instructions for issuing the alarm can include computer
instructions
362 to calculate a precise distance to a preset target and to generate text
which
indicates that precise distance by unit of measure to a preset limit as the
alarm.
[000444] The computer instructions 364 for issuing the alarm can include
computer
instructions computer instructions to provide a text software recommendation
for a
user to change drilling direction by degrees of azimuth, degree of
inclination, or
combinations thereof
[000445] While these embodiments have been described with emphasis on the
embodiments, it
should be understood that within the scope of the appended claims, the
embodiments
might be practiced other than as specifically described herein.
64