Note: Descriptions are shown in the official language in which they were submitted.
CA 02819052 2016-01-07
CA 2,819,052
Blakes Ref: 10201/00001
1 Single Nanoparticle Having a Nanogap Between a Core Material and a
Shell
2 Material, and Preparation Method Thereof
3 [Technical Field]
4 The present invention relates to a single nanoparticle, which has
extremely high
amplifying capability of electromagnetic signal by plasomonic coupling of the
nanogap formed
6 between core material and shell material and which shows the homogeneous
signal intensity
7 and quantitative signal contrasted with concentration of particle caused
by homogeneous
8 distribution and quantitative control of signal substance on the surface
of core material, and
9 preparation method thereof.
[Background Art]
11 Highly accurate detection of single molecules from biological sample and
other samples
12 can be widely used in medical diagnostics, pathology, toxicology,
environmental sampling,
13 chemical analysis, and many other areas, and nanoparticles and chemicals
labeled with specific
14 substances have been used in researches for metabolism, distribution and
coupling of small
amounts of synthetic substances and bio-molecules in biochemistry for last a
few years.
16 Typically, there are methods using radioactive isotopes, organic
fluorescent materials and
17 quantum dots which are inorganic materials.
18 3H, 140,3
V -5S and 1251, which are radioactive isotopes of 1H, 120, 31p and 1271
19 extensively found in the living body, are widely used as radioactive
indicators in the method
using radioactive isotopes. Radioactive isotopes have been used for a long
time because of the
21 similar chemical properties with non-radioactive isotope, which enables
a random replacement,
22 and relatively large emission energy, which enables the detection of
small amounts. However, it
23 is not easy to handle because of the harmful radiation and the radiation
of some isotopes has
24 short half-life instead of large emission energy, causing inconvenience
in long-term storage or
experiment.
26 Organic fluorescent dyes are widely used as alternatives to radioactive
isotopes.
27 Fluorescent dyes emit light with unique wavelength when activated by
light with specific
28 wavelength. Particularly, while radioactive material expresses the
limitation in the detection,
29 requiring long detection time with miniaturization of detection device,
fluorescent dyes emit
thousands of photons per molecules under appropriate conditions and
theoretically enable the
31 detection even at the level of a single-molecule. However, the
fluorescent dyes have limitations
1
22391098.3
CA 02819052 2016-01-07
CA 2,819,052
Blakes Ref: 10201/00001
1 in that the fluorescent dyes are connected by deformation of the part
which relatively little
2 affects the activity through structure activity relationship, incapable
of direct substitution of the
3 elements of the active ligand as radioactive isotopes. In addition, these
fluorescent markers emit
4 weaker intensity of fluorescence over time (photobleaching) and have a
very narrow wavelength
range of activation light and a wide wavelength range of emission light
leading to the
6 disadvantage of interference between different fluorophores. Also, the
number of available
7 fluorophores is extremely limited.
8 Also, semiconductor nano materials, quantum dots, is composed of CdSe,
CdS, ZnS,
9 ZnSe, etc. and emit lights of different colors depending on the size and
type. Quantum dots,
with wide active wavelengths and narrow emission wavelength compared to
organic fluorescent
11 dyes, have larger number of cases in which light of different colors are
emitted than organic
12 fluorescent dyes. In recent years, therefore, quantum dots have been
used as a way to
13 overcome the shortcoming of organic fluorescent dyes. However, they have
disadvantages of
14 high toxicity and difficulty of mass production. In addition, the number
of available quantum dots,
although theoretically variable, is highly restricted in practice.
16 To overcome such problems, Raman Spectrometry and/or Surface Plasmon
17 Resonance have been recently used for labeling.
18 Among them, Surface Enhanced Raman Scattering (SERS) is the spectroscopy
using
19 the phenomenon that the intensity of Raman scattering increases rapidly
by more than 106 to
108 times when the molecule is adsorbed on the roughened surface of metallic
nanostructure of
21 gold, silver, etc. When the light passes through a concrete medium, a
certain amount of light
22 deviates from an unique direction, which is known as Raman scattering.
Since some of the
23 scattered light is absorbed and excites an electron to the higher level
of energy, the wavelength
24 of Raman emission spectrum is different from that of stimulated light
and represents the
chemical composition and structural properties of light absorbing molecule in
the sample.
26 Therefore, Raman spectroscopy, combined with rapidly advancing current
nanotechnology, can
27 be developed into the highly sensitive technology to detect directly a
single molecule and is
28 largely expected to be used especially as crucial medical sensor. The
Surface Enhanced
29 Raman Scattering (SERS) is related to plasmon resonance phenomenon, and
since wherein
metal nanoparticles shows the pronounced optical resonance in response to the
incident
31 electromagnetic radiation by group coupling of metal conduction
electrons in the metal, the
32 nanoparticles of gold, silver, copper and certain other metals can be
used essentially as a small
2
22391098.3
CA 02819052 2016-01-07
CA 2,819,052
Blakes Ref: 10201/00001
1 antenna to improve focusing effects of electromagnetic radiation.
Molecules located in the
2 vicinity of these particles represent a much greater sensitivity for
Raman spectroscopy analysis.
3 Therefore, the researches for early diagnosis of various disease-
associated genes and
4 proteins (biomarkers) using SERS sensors are actively carried out. Unlike
the other analysis
methods (infrared spectroscopy), Raman spectroscopy has several advantages.
While infrared
6 spectroscopy obtains a strong signal in the case of molecules with change
in the molecular
7 dipole moment, Raman spectroscopy can obtain a strong signal even in the
case of non-polar
8 molecule, resulting that almost all organic molecules have a unique Raman
shift (cm-1). In
9 addition, because it is not affected by water molecules interference,
Raman spectroscopy is
more suitable for the detection of biomolecules such as proteins, genes, etc.
However, due to
11 the low signal intensity, it did not reach a level of practical use
despite long research period.
12 In the continuous researches since the discovery of Surface-Enhanced
Raman
13 Scattering, researches regarding the SERS enhancement phenomenon using a
variety of
14 nanostructures (nanoparticles, nanoshells, or nanolines) have been
reported after the Surface
Enhanced Raman Scattering (SERS) which is capable of detection of the single
molecular level
16 of signal in the disordered aggregate of nanoparticles with fluorescent
molecules adsorbed, was
17 reported (science 1997, 275(5303), 1102; Phys rev lett 1997, 78(9),
1667). Mirkin and his team
18 recently successfully achieved high sensitivity DNA analysis using gold
nanoparticles combined
19 with DNA to use the SERS phenomenon with high sensitivity in the
development of bio-sensors,
with detection limit of 20 fM (2002, science, 297, 1536). However, there has
been little progress
21 in the preparation methods for single-molecule SERS active substrates
based on salt induced
22 aggregation of silver (Ag) nanoparticles with the Raman active molecule
(eg, Rhodamine 6G)
23 since the initial study. It was reported that in the heterogeneous
coagulated colloid, only a
24 fraction (less than 1%) has single molecule SERS activity (J Phys Chem B
2002, 106(2), 311).
Although randomly inhomogeneous (roughed) surface provides a large amount of
interesting
26 and essential data associated with SERS, such a strategy is essentially
reproducible due to
27 significant changes in enhancement by small surface morphological
changes. Recently, Fang et
28 al. reported the quantitative measurements of distribution of enhanced
regions in SERS. The
29 densest areas (EF> 109) were reported as 64 areas out of total 1,000,000
areas, which
contribute to 24% of the total SERS intensity (Science, 2008, 321, 388). If
the structure in which
31 the SERS signal can be maximized with the reproducibility can be
obtained, it can be a very
32 reliable ultra-sensitive biomolecule analysis method, and can be useful
for in vivo imaging
33 techniques as well as in vitro diagnostics.
3
22391098.3
CA 02819052 2016-01-07
CA 2,819,052
Blakes Ref: 10201/00001
1 However, in the previous SERS detection methods for the various
analytes, the
2 substrate and/or colloidal metal particles, such as aggregated silver
nanoparticles, coated on
3 the supporter were typically used, sometimes yielding SERS detection with
increased sensitivity
4 by 108 to 106 times, without being able to detect single-molecule of
small analytes such as
nucleotides. However, despite the advantages of SERS, the mechanism of SERS
phenomenon
6 are not only not fully understood, the preparation and control of well-
defined nanostructures are
7 also difficult, as well as many unsolved problems exist in terms of
reproducibility and reliability
8 arising from the changes in enhancement efficiency depending on the
wavelength of the light
9 used to measure the spectrum, and the polarization direction remains an
unsolved problem for
the application of the SERS phenomenon including the development and
commercialization of
11 nanobiosensors. Researchers for precise control of the SERS phenomenon
are required to
12 solve these problems by means of understanding the optical properties of
well-defined
13 nanostructures.
14 Heresupon, L. Brus et al. (JACS. 2002) reported in the case of dimer of
metal particles,
that a hot spot (interstitial field), which is a very strong electromagnetic
field, is formed between
16 two or more nanoparticles, resulting in SERS signal enhancement and SERS
enhancement by
17 hot spot is predicted as 1012 times according to theoretical
electromagnetic calculations.
18 Thus, the enhanced sensitivity of Raman detection is not evidently
homogeneous within
19 colloidal particle aggregate, but depends on the presence of hot spots.
However, the
characteristics of the physical structure and distance range from
nanoparticles, where enhanced
21 sensitivity is achieved, of hot spots, and spatial correlation between
the analytes to enhance the
22 sensitivity and aggregate of nanoparticles have not been presented. In
addition, the aggregated
23 nanoparticles are inherently unstable in solution, and give an adverse
effect on the
24 reproducibility of the detection of single-particle analyte.
As far as the amplification of optical signal is concerned, characteristic
amplified signal
26 (eg, Raman, fluorescence, scattering, etc) of molecules emitting the
optical signal located in the
27 gap can be detected by the amplification of electromagnetic signals at
the junction area outside
28 two or more nanostructures. However, if surface-enhanced Raman
scattering (SERS) is to be
29 obtained using these structures, quantification of the signal,
reproducibility of the results, ease
and simplicity of synthesis, cost, and stability of the probe still remain the
problems. In other
31 words, if two or more nanoparticles are combined by a nanogap, the
amplified optical signal
4
22391098.3
CA 02819052 2016-01-07
CA 2,819,052
Bakes Ref: 10201/00001
1 detection is detectable, but simplicity of material synthesis, stability,
reproducibility of the signal
2 and quantification cannot be secured.
3 Therefore, the nanostructure which is capable of strong amplification of
the signal is a
4 single nanoparticle with a nanogap inside and, even though it has not
been reported until now, it
is expected that stable signal can be formed by placing various signal
substances in the intra-
6 nanogap.
7 Meanwhile, although synthesis and assembly of various nanostructures for
DNA have
8 been studied in-depth, there have been very few researches on other roles
of DNA. Hereupon,
9 the present inventors prepared single nanoparticle which includes core
and shell with a
nanogap formed between core and shell using DNA, away from the concept to form
a nanogap
11 using more than two nanoparticles. For the nanoparticle herein,
especially when modifying the
12 surface of the core by the DNA, part of the space between the core and
the shell is connected
13 by the nanobridge, and the nanogap can be adjusted to be formed between
the core and the
14 shell, the number and locations of Raman-active molecules can be easily
adjusted by adjusting
the nucleotide sequence of DNA, the synthesis thereof is simple, very high
signal amplification
16 effect is shown due to plasomonic coupling by intra-nanogap, and the
problem of signal
17 reproducibility and quantification, which is the crucial prerequisite to
commercialization, is
18 known to be overcome due to high reproducibility to complete the present
invention.
19 The present inventors also identified the possibility to form a nanogap
without
nanobridge between core and shell by forming organic molecules (polymer, as
one example,
21 polymer layer with layer-by-layer structure of poly-ally' amine, poly-L-
lysine, which is positively
22 charged polymer, and negatively charged poly-styrene-sulfonate) which
can combine with the
23 surface of gold nanoparticle followed by forming the additional metal
shell.
24 [Description of Figures]
Figure 1 represents a conventional multimetric nanostructure and NNP
nanostructure
26 according to the example of the present invention.
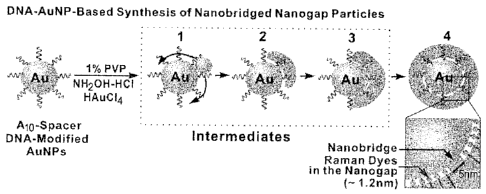
27 Figure 2 represents a method for preparing a nanoparticle according to
the example of
28 the present invention and analysis result thereof. Figure 2a represents
the process of formation
29 of shell, Figure 2b visible light spectrum graph of intermediate 1, 2, 3
and nanoparticle (4, 5),
Figure 2c TEM image of intermediate (1, 2, 3) and nanoparticle (4, 5), and the
result of atom-
31 mapping of nanoparticle (6).
5
22391098.3
CA 02819052 2016-01-07
CA 2,819,052
Blakes Ref: 10201/00001
1 Figure 3A - 3D represent TEM images observed according to the
concentration of each
2 solution used in the process of preparing the nanoparticle according to
the example of the
3 present invention. Each solution containing a different amount of
reactant (1.5 L, 5.2 1_, 10.3
4 1,11_ and 30.4 L, respectively).
Figure 4 represents size of NNP particles (200) and size distribution of intra-
nanogap
6 prepared according to the example of the present invention.
7 Figure 5 represents visible light spectrum graph and TEM image of
nanoparticle
8 prepared using citrate-stabilized 20 nm gold nanoparticle as seed.
9 Figure 6 represents visible light spectrum graph and TEM image of
nanoparticle
prepared using SPP (bis(p-sulfonatophenyl)phenylphosphane dehydrate) modified
gold core.
11 Figure 7 represents TEM image of nanoparticle prepared using mPEG
modified gold
12 nanoparticle as seed.
13 Figure 8 represents TEM image of nanoparticle prepared using T10-
oligonucleotide
14 modified gold nanoparticle as seed.
Figure 9 represents calculation results of nanoparticle surrounded by NNP and
silica
16 based on 3D-FEM. Figure 9a represents calculation result of
electromagnetic field distribution of
17 NNP (it is assumed that gap is full of DNA and Raman reporter molecules
and surroundings of
18 the particle is filled with water), Figure 9b calculation result of
electromagnetic distribution of
19 gold-gold core-gap-shell nanoparticle surrounded by silica of the same
size as NNP, Figure 9c
comparison result of electromagnetic distribution along the center line at
632.8 nm, and Figure
21 9d dependence of NNP on the incident beam, respectively.
22 Figure 10 represents a time-dependent Raman result of nanoparticle which
is modified
23 to three different kinds of dyes. Figure 10A represents the Raman signal
at different
24 wavelengths, Figure 10B the Raman signal of the nanoparticle with a dye
located in the
nanogap, Figure 10C the Raman signal of the nanoparticle with a dye located
inside the shell,
26 and Figure 10D the Raman signal of the nanoparticle with a dye located
outside the shell,
27 respectively.
28 Figure 11 represents a method for adjusting the number of Raman
fluorophores. Figure
29 lla shows the process schematically and Figure llb shows the result.
6
22391098.3
CA 02819052 2016-01-07
CA 2,819,052
Blakes Ref: 10201/00001
1 Figure 12 represents the result of Raman signal of nanoparticle
according the example
2 of the present invention. Figure 12a represents the result of Raman
signal according to the
3 number of dyes, Figure 12b the intensity of Raman signal according to the
number of dyes, and
4 Figure 12c the intensity of Raman signal according to the thickness of
shell, respectively.
Figure 13 represents the SERS spectrum of NNP with other fluorescent dye and
non-
6 fluorescent Raman reporter.
7 Figure 14 represents the intensity of Raman signal and enhancement
factors according
8 the the concentration of nanoparticles according to the example of the
present invention. Figure
9 14a represents the intensity of Raman signal for the nanoparticle with
Cy3 and Figure 14b
represents the intensity of Raman signal for the nanoparticle with 4,4'-
dipyridyl.
11 Figure 15a represents schematically the method for AFM-correlated nano-
Raman
12 measurement, Figure 15a to Figure 15e represent an AFM image in tapping-
mode of
13 nanoparticle, and Figure 15f to Figure 15h represent an enhancement
factor at different
14 wavelengths in graph.
[Technical Problem]
16 The present invention is to provide a novel nanoparticle, which can be
used effectively
17 for optical signal analysis based on very high amplification effect of
electromagnetic signal by
18 plasomonic coupling of nanogap formation inside thereof and high
reproducibility, and which
19 includes core and surrounding shell with nanogap formation between the
same, which may or
may not be connected by a nanobridge, and the method of synthesis thereof.
21 The present invention is also to provide the method for detecting the
analyte using the
22 above nanoparticle and the analyte detection kit including the above
nanoparticle.
23 [Technical Solution]
24 Accordingly, the present invention provides a nanoparticle comprising a
core, a shell
surrounding the core, and a nanogap formed between the core and shell. The
core and shell
26 may or may not be connected by a nanobridge.
27 As used herein, the term "core" refers to a spherical or pseudo-
spherical particle with a
28 diameter of 1 nm to 900 nm, which is composed of the metal that shows
surface plasmon
29 resonance. Gold, silver or copper may be used as the metal that shows
surface plasmon
resonance.
7
22391098.3
CA 02819052 2016-01-07
CA 2,819,052
Blakes Ref: 10201/00001
1 As used herein, the term "shell" refers to a coating layer surrounding
the core, which is
2 composed of the metal that shows surface plasmon resonance. Thickness of
the shell is 0.1 nm
3 to 900 nm, and preferably 10 nm to 100 nm. The nanogap is formed between
the shell and core,
4 and therefore there is a space formed between the shell and core. Gold,
silver or copper may be
used as the metal that shows surface plasmon resonance.
6 As used herein, the term "nanogap" refers to the space formed between
the core and
7 shell. The thickness of nanogap is preferably 0.01 nm to 100 nm. The
nanogap can separate
8 the core and shell, which may not be in contact at all by the nanogap or
may be in contact by
9 nanobridge. Therefore, the term "nanogap" used herein doesn't necessarily
mean the space
that separate completely core and shell.
11 As used herein, the term "nanobridge" refers to a bridge in the nanogap,
with a
12 diameter of 0.5 nm to 20 nm, to connect the core and shell. The
nanoparticle in the present
13 invention may comprises the "nanogap with nanobridge" or "nanogap
without nanobridge"
14 between the core and shell.
Therefore, as the preferred aspect of the present invention, the present
invention
16 relates the nanoparticle selected from the group consisting of i) a
nanoparticle which consists of
17 gold core and silver shell and has nanogap formed between gold core and
silver shell, ii) a
18 nanoparticle which consists of silver core and gold shell and has
nanogap formed between
19 silver core and gold shell, iii) a nanoparticle which consists of gold
core and gold shell and has
nanogap formed between gold core and gold shell, iv) a nanoparticle which
consists of silver
21 core and silver shell and has nanogap formed between silver core and
silver shell. The most
22 preferable nanoparticle in the present invention is a nanoparticle which
consists of gold core
23 and gold shell and has nanogap formed between gold core and gold shell.
It also is not limited
24 by the shape of the particles that make up the core.
Specifically, the core and shell are in contact, if any, in some areas through
nanobridge.
26 In other words, if the shell is formed on the core, the nanogap is
formed between the entire
27 surface of the core and the shell, but, in some areas, some of the
substances that form the shell
28 may form the nanobridge inside and have the structure of contact with
the core. The typical
29 structures were represented in Figures 1 and 2 (a 4). As represented in
Figures 1 and 2 (a 4), in
the process of the formation of the shell, some can be formed toward the core,
resulting in the
31 formation of nanobridge. The number of nanobridge is not limited from
one to the extent which
32 is capable of forming a nanogap. The diameter is preferably 0.5 nm to 20
nm. The nanobridge
8
22391098.3
CA 02819052 2016-01-07
CA 2,819,052
Blakes Ref: 10201/00001
1 can cause the structure of the core and shell to be more stably
maintained, and can be one
2 factor that further increases the SERS signal.
3 The nanoparticle according to the present invention, where the space is
formed
4 between the core and shell by the nanogap, which enables amplification of
Raman signal, can
be used for detection of amplified optical signal. Specifically, the
reproducibility of the nanogap
6 is very high and, when the Surface-enhanced Raman Scattering (SERS)
signal is acquired,
7 quantification of the signal, reproducibility of results, cost, ease and
simplicity of synthesis, and
8 stability of the probe can be dramatically improved.
9 In order to clarify the above, Figure 1 is used as reference. While the
widely used
multimeric nanostructure (Figure 1, left) has multiple point gaps for plasmon
coupling and
11 SERS, it had drawbacks of extremely small surface area and heterogeneous
point gaps. In
12 particular, it is very difficult, and virtually impossible, to
synthesize specific nanostructure which
13 has high reproducibility and emits quantitative SERS.
14 On the other hand, the nanoparticle with nanobridged nanogap according
to the present
invention provides the static and homogeneous gap with large surface area
(Figure 1, right). In
16 the single intra-gap structure such as, the entire surface of the core
can be used for enhancing
17 the SERS, and the location of the dye also can be positioned precisely
inside the structure.
18 Furthermore, in actual use, it can be synthesized simply with high
synthetic yield. In addition, a
19 nanobridge is formed in some areas where the core and shell are
connected so that the
structure of nanoparticle can be maintained more stably.
21 A nanogap in the present invention can be formed by combing the polymer
on the core
22 and forming the shell on the polymer-combined core. That is, the
presence of polymer between
23 the core and shell prevents complete contact between the same, resulting
in the formation of
24 nanogap of isolated space. An oligonucleotide or polymer used in layer-
by-layer assembly
methods be used as the polymer and will be described in more detail in the
following.
26 If the oligonucleotide is used, it is characterized by attachment of the
oligonucleotide to
27 the surface of the core of the nanoparticle by electrostatic attraction
or covalent bond.
28 Specifically, the present invention characterizes in that the surface of
core is modified by one
29 terminus of the oligonucleotide and the portion of oligonucleotide is
inserted into the shell.
As used herein, the term "oligonucleotide" is a polymer composed of a small
number of
31 nucleotides, generally refers to shortest chemically synthesizable
nucleotide-chain, which plays
9
22391098.3
CA 02819052 2016-01-07
CA 2,819,052
Blakes Ref: 10201/00001
1 an important role in preparation of the nanoparticle according to the
present invention.
2 Specifically, poly-adenine (poly A) of oligonucleotide is placed
preferably on the surface of core,
3 because when forming the shell around the core, the shell is not in
complete contact with core
4 by oligonucleotide, resulting in formation of nanogap. However, if
citrate or BSPP (bis(p-
sulfonatophenyl)phenylphosphane dehydrate), as an example, is used instead of
6 oligonucleotide, nanogap cannot be formed.
7 In addition, the oligonucleotide modifying the surface of core can also
act as the optical
8 signal-modifying platform where optical signal substance such as Raman
active molecule is
9 located. That is, it is possible to position the optical signal substance
such as Raman molecule
on the surface of the core, in the nanogap or inside the shell, and control
precisely the position
11 and number thereof, by combing the optical signal substance such as
Raman active molecule
12 with the oligonucleotide.
13 The oligonucleotide can be attached to the surface of core through the
linker compound
14 which 3' terminus or 5' terminus is modified to. As used herein, the
term "linker compound"
refers to a compound which is connected to the 3' or 5' terminus of each
oligonucleotide and
16 which serves to attach the oligonucletide to the surface of the core
particle. The method for
17 crosslinking the nanoparticles through a linker compound are known in
the art (Feldheim, The
18 Electrochemical Society Interface, Fall, 2001, pp. 22-25). The linker
compound comprises at its
19 one end a surface-bound functional group which binds to the surface of
the core particle.
Preferably, the surface-bound functional group is a sulfur-containing group
such as thiol or
21 sulfhydryl (HS). Thus, the functional group may be a compound
represented by RSH, an
22 alcohol or phenol derivative in which a sulfur atom is present instead
of an oxygen atom.
23 Alternatively, the functional group may be a thiol ester or dithiol
ester group respectively
24 represented by RSSR' and RSR or an amino group (-NF12)=
In the present invention, 3'-HS-(CH2)3-A10-PEG18-AAACTOTTTGCGCAC-5' is used as
26 the example of oligonucleotides, but is not limited thereto.
27 If the polymer available for layer-by-layer assembly method is used, the
surface of the
28 core of the nanoparticle is coated with, polymer and the shell is formed
on the coated core with
29 the formation of nanogap, without the formation of nanobridge. Polymer
coating is possible by
covalent bond or electrostatic attraction, and if the electrostatic attraction
is applied, layer-by-
31 layer assembly is possible. The "layer-by-layer assembly" refers to a
method for manufacturing
32 a multilayer by stacking the positively and negatively charged polymer
electrolytes alternately.
22391098.3
CA 02819052 2016-01-07
CA 2,819,052
Blakes Ref: 10201/00001
1 Therefore, it is possible a method of manufacturing a multilayer with
positively and negatively
2 charged polymer electrolyte, respectively, are alternately stacked.
Therefore, only one layer or
3 coating to minimize the thickness of the nanogap by coating with only one
layer or to control the
4 thickness of nanogap by adjusting by adjusting the number of multi-layers
Any polymer material
used in the "layer-by-layer assembly", without limitation, can be used and for
example, positively
6 charged polymer poly-allylamine, and poly-L-lysine, etc., with the
negatively charged poly-
7 styrene-sulfonate can be used.
8 In addition, the nanoparticle according to the present invention is
characterized in
9 comprising signal substance inside the nanogap. In particular, the
optical active molecule for
measuring the Raman signal may be any, without limitation, molecule consisting
of atoms
11 selected from the group consisting of C, H, 0, N, S and combinations
thereof, and the metal ion,
12 metal ion chelate, or gold nanoparticle may be used. Specifically,
signal substances used in the
13 present invention have a broad concept that encompasses fluorescent
organic molecules, non-
14 fluorescent organic molecules, inorganic nanoparticles, and Raman active
molecules, may
include any markers, without limitation, with capability of color-development,
and are desirably
16 the Raman-active molecules. As used herein, the term "Raman-active
molecule" refers to a
17 substance which, when the nanoparticle in the present invention is
attached to one or more
18 analytes, facilitates the detection and measurement of the analyte by
Raman detection device.
19 Raman-active molecule used in Raman spectroscopy includes organic atom
or molecule, or
inorganic atom or molecules, etc. Specifically, the Raman-active molecule
includes, but is not
21 limited to, FAM, Dabcyl, TRITC (tetramethyl rhodamine-5-isothiocyanate),
MGITC (malachite
22 green isothiocyanate), XRITC (X-rhodamine-5-isothiocyanate), DTDC (3,3-
23 diethylthiadicarbocyanine iodide), TRIT (tetramethyl rhodamine
isothiol), NBD (7-nitrobenz-2-
24 1,3-diazol), phthalic acid, terephthalic acid, isophthalic acid, para-
aminobenzoic acid, erythrocin,
biotin, digoxigenin, 5-carboxy-4',5'-dichloro-2',7'-dimethoxy, fluorescein, 5-
carboxy-2',4',5',7'-
26 tetrachlorofluorescein, 5-carboxyfluorescein, 5-carboxyrhodamine, 6-
carboxyrhodamine, 6-
27 carboxytetramethyl amino phthalocyanine, azomethine, cyanine (Cy3,
Cy3.5, Cy5), xanthine,
28 succinylfluorescein, aminoacridine, quantum dot, carbon allotrope,
cyanide, thiol, chlorine,
29 bromine, methyl, phosphor or sulfur, must represent a distinct Raman
spectrum and be able to
be combined with, and specifically, related to the different type of analyte.
Raman-active
31 molecule is desirably the molecule which represents higher Raman signal
intensity in resonance
32 with wavelength of excitation laser used in Raman analysis.
11
22391098.3
CA 02819052 2016-01-07
CA 2,819,052
Blakes Ref: 10201/00001
1 The signal substance herein, which can be comprised in the nanogap, can
be placed in
2 the intra-nanogap by being attached on the oligonucleotide by covalent
bound or electrostatic
3 attraction, or Raman active molecule can be combined on the surface of
the core particle by
4 covalent bond or electrostatic attraction, regardless of the
oligonucleotide. If the oligonucleotide
is modified by the Raman-active molecule, the location of the Raman-active
molecules is
6 characteristically adjustable. That is, if the Raman-active molecule is
attached in a position
7 close to the terminus of oligonucleotide which is attached on the core,
the Raman-active
8 molecule can be positioned close to core in the nanoparticle, and can be
positioned in the
9 nanogap by adjustment. For example, the Raman signal can vary depending
on the position of
the Raman-active molecules, and if the Raman-active molecule is located in
intra-gap, the
11 strongest Raman signal with high uniformity and reproducibility can be
detected.
12 If the Raman active molecule is combined on the surface of the core,
regardless of the
13 oligonucleotide, the combined weight of the Raman active molecule can be
maximized.
14 Total diameter of the nanoparticle according to the present invention is
preferably 1 nm
to 990 nm, and preferably 20 nm to 500 nm.
16 In addition, a nanoparticle or shell can be formed on the nanoparticle
according to the
17 present invention, which enables formation of nanoparticle which has
multiple layers of shell
18 inside by repeating the above preparation method of the nanogap and
shell.
19 The surface of the shell of the nanoparticle according to the present
invention also can
be combined with various substances, yielding improvement of the
characteristics of
21 nanoparticle. For example, if the nanoparticle is used in the living
body, the surface can be
22 modified by biocompatible polymers. In addition, biomolecule can be
functionalized on the
23 surface of the shell of the nanoparticle according to the present
invention. If the surface of the
24 nanoparticle according to the present invention is functionalized by
biomolecule, nanoparticle
can be combined only to the specific target, resulting in further improvement
of analysis
26 capability using the nanoparticle. Examples of biomolecules
functionalized to nanoparticle may
27 be antibody, antibody fragment, genetically engineered antibody, single-
chain antibody, protein
28 receptor, binding protein, enzyme, protein inhibitor, lectin, cell
adhesion protein, oligonucleotide,
29 polynucleotide, nucleic acid, or aptamer.
The present invention also provides the method for preparation of the
nanoparticle
31 comprising a core, a shell surrounding the core, and a nanogap formed
between the core and
12
22391098.3
CA 02819052 2016-01-07
CA 2,819,052
Blakes Ref: 10201/00001
1 shell, comprising modifying the core by an oligonucleotide; and forming
the shell on the
2 oligonucleotide modified core.
3 The first step is for modifying the core by the oligonucleotide and can
be performed
4 using a method known in the art according to the publicly known
literature. In the examples of
the present invention, the reference 'S. J. Hurst, A. K. R. Lytton-Jean, C. A.
Mirkin, Anal. Chem.
6 78, 8313 (2006) was referred to.
7 The second step is for forming a shell, by reacting the metal precursor
(for example,
8 gold precursor HAuG14), reducing agent (NH2OH-HCI), and poly-N-vinyl-2-
pyrrolidone (PVP)
9 using a phosphate-buffered solution.
According to the above method for preparing a nanoparticle, the nanoparticle
of the
11 core-nanogap-shell can be prepared with high yield (of at least
approximately 95%), and in
12 particular with very good reproducibility of the nanogap. In addition,
if oligonucleotide combined
13 signal substances is used in the first step, nanoparticle including
signal substance can be
14 prepared, and the location and number of signal substances in the
nanoparticle can be easily
adjusted accordingly.
16 Further, the present invention also provides the method for preparation
of the
17 nanoparticle comprising a core, a shell surrounding the core, and a
nanogap formed between
18 the core and shell, comprising coating the core with a polymer; and
forming the shell on the
19 coated core. The coating of polymer can be carried out by layer-by-layer
assembly, and any
material used in the "layer-by-layer assembly", without limitation, can be
used and for example,
21 positively charged polymer poly-allyl amine, and poly-L-lysine, etc.,
with the negatively charged
22 poly-styrene-sulfonate can be used.
23 Further, the present invention also provides the method for detecting an
analyte,
24 comprising synthesizing the nanoparticle of the present invention;
functionalizing the surface of
the shell of the nanoparticle with a bio-molecule capable of detecting an
analyte; exposing the
26 nanoparticle to a sample containing at least one analyte; and detecting
and identifying the
27 analyte by laser excitation and Raman spectroscopy.
28 Examples of the analyte herein may be amino acids, peptides,
polypeptides, proteins,
29 glycoproteins, lipoprotein, nucleoside, nucleotide, oligonucleotide,
nucleic acids, sugars,
carbohydrates, oligosaccharides, polysaccharides, fatty acids, lipids,
hormones, metabolite,
31 cytokines, chemokines, receptors, neurotransmitters, antigens,
allergens, antibodies,
13
22391098.3
CA 02819052 2016-01-07
CA 2,819,052
Blakes Ref: 10201/00001
1 substrates, metabolites, cofactors, inhibitors, drugs, pharmaceutical
substance, nutrients,
2 prions, toxins, poison, explosives, pesticides, chemical warfare agents,
bio-hazard substance,
3 radioisotope, vitamin, heterocyclic aromatic compounds, carcinogens,
mutagenic agent,
4 narcotics, amphetamines, barbiturate, hallucinogens, waste or pollutants.
In addition, if the
analyte is nucleic acid, the nucleic acid herein can be gene, viral RNA and
DNA, bacterial DNA,
6 fungal DNA, mammalian DNA, cDNA, mRNA, RNA and DNA fragments,
oligonucleotide,
7 synthetic oligonucleotide, modified oligonucleotide, single-strand and
double-strand nucleic
8 acid, natural and synthetic nucleic acids.
9 Examples of biomolecules functionalized to nanoparticle herein may be
antibody,
antibody fragment, genetically engineered antibody, single-chain antibody,
protein receptor,
11 binding protein, enzyme, protein inhibitor, lectin, cell adhesion
protein, oligonucleotide,
12 polynucleotide, nucleic acid, or aptamer. Functionalization can be
carried out by attaching
13 biomolecules on the surface of nanoparticle by electrostatic attraction,
directly or through linker,
14 and the method of functionalization is not specifically limited.
Preferably, the analyte in the present invention can be detected or identified
with
16 publicly known Raman spectroscopy, and preferably with Surface Enhanced
Raman Scattering
17 (SERS), Surface Enhanced Resonance Raman Spectroscopy (SERRS), and hyper-
Raman
18 and/or Coherent Anti-Stokes Raman spectroscopy (CARS).
19 As used herein, the term "Surface Enhanced Raman Scattering (SERS)"
refers to a the
spectroscopy using the phenomenon which is a type of Raman scattering, whose
Raman
21 intensity is increased by more than 106 to 108 times compared with
general Raman intensity,
22 occurred when adsorbed on roughed surface of specific metal or located
within a distance of
23 several hundred nanometers. The term "Surface Enhanced Resonance Raman
Spectroscopy
24 (SERRS)" refers to a spectroscopy using resonance of laser excitation
wavelength with the
absorbate on the SERS active surface. The term "Coherent Anti-Stokes Raman
Spectroscopy
26 (CARS)" refers to the spectroscopy measuring the spectrum of anti Stokes
radiation obtained by
27 the combination of two, fixed and variable, incident laser light onto
the Raman-active medium.
28 In the examples herein, the Raman active substrate can be operationally
combined with
29 one or more Raman detection units. Several methods for detecting an
analyte by Raman
spectroscopy is known in the art (eg, U.S. Patent No. 6,002,471, No.
6,040,191, No. 6,149,868,
31 No. 6,174,677, No. 6,313,914). Sensitivity of Raman detection for SERS
is enhanced by more
14
22391098.3
CA 02819052 2016-01-07
CA 2,819,052
Blakes Ref: 10201/00001
1 than 106 times for the molecules absorbed on the rough metallic surface,
for example, surface of
2 silver, gold, platinum, copper or aluminum.
3 Non-limiting example of Raman detection device is disclosed in U.S.
Patent No.
4 6,002,471. Excitation beam is generated by frequency doubled Nd:YAG laser
at a wavelength of
532 nm or frequency doubled Ti:Sapphire laser at a wavelength of 365 nm.
Pulsed laser beam
6 or continuous laser beam can be used. Excitation beam passes through
confocal optics and
7 microscope lens, and is focused onto Raman active substrate containing
one or more analytes.
8 Analysis of water Raman emission light from the analyte was collected by
the microscope lens
9 and a confocal optics and combined with monochrometer for spectral
separation. Confocal
optics includes a combination of dichroic filter for reducing the background
signal, cutoff filter,
11 confocal pinhole, objective lens and mirror. Standard full field optical
device as well as confocal
12 optics can be used. Raman emission signal is detected by the Raman
detector that includes
13 avalanche photodiode which interfaces with the computer to count and
digitize the signal.
14 Another example of detection device is disclosed in U.S. Patent No.
5,306,403, which is
a double grating spectrometer (Spex Model 1403) equipped with gallium-arsenide
16 photomultiplier (RCA Model C31034 or Burle Industries Model C3103402)
operating as a single-
17 photon counting method. Excitation source includes the 514.5 nm line
argon-ion laser
18 (SpectraPhysics, model 166) and 647.1 nm line of krypton-ion laser
(Innova 70, incoherent).
19 Other excitation sources include nitrogen laser at 337 nm (Laser Science
Inc.) and
helium-cadmium laser at 325 nm (Liconox) (U.S. Patent No. 6,174,677), light-
emitting diode,
21 Nd:YLF laser, and/or various ion lasers and/or dye laser. Excitation
beam can be refined
22 spectrally by band-pass filter (Corion) and focused on Raman active
substrate using 6X
23 objective lens (Newport, Model L6X). Objective lens can be used to
excite an analyte by using
24 holographic beam splitter (Kaiser Optical Systems, Inc., Model HB 647-
26N18), collect Raman
signal, and polarize the emitted Raman signal perpendicular to excitation
beam. Holographic
26 notch filter (Kaiser Optical Systems, Inc.) can be used to reduce
Rayleigh scattering radiation.
27 Other Raman detectors include ISA HR-320 spectrometer equipped with high
sensitivity red
28 enhanced charge-coupled device (RE-ICCD) detection system (Princeton
Instruments). Other
29 types of detectors such as Fourier transform spectrometer (based on the
Michelson
interferometer), charge injection device, photodiode array, InGaAs detector,
electron
31 multiplication CCD, high sensitivity CCD and /or phototransistor arrays
can be used.
22391098.3
CA 02819052 2016-01-07
CA 2,819,052
Blakes Ref: 10201/00001
1 Any well-known suitable form or configuration of Raman spectroscopy or
related technique may
2 be used for detecting an analyte. Examples include normal Raman
scattering, resonance
3 Raman scattering, surface enhanced Raman scattering, surface enhanced
resonance Raman
4 scattering, coherent anti-Stokes Raman spectroscopy, Molecular Optical
Laser Examiner
(MOLE), Raman microprobing or Raman microscopy, confocal Raman
microspectrometer, 3-D
6 or scanning Raman, Raman saturation spectroscopy, time resolution
differential resonance
7 Raman, Raman dissociation spectroscopy, or UV-Raman microscopy, but are
limited thereto.
8 In a specific example of the present invention, Raman detection device
can be
9 operationally linked with computer. Data from detection device is
processed by processor and
stored in a main memory device. Data in emission profile for the standard
analyte also can be
11 stored in a main memory device or ROM. Processor can compare emission
spectra from the
12 analytes on the Raman active substrate and identify the type of analyte
in the sample.
13 Processor can analyze the data from detection device and determine the
identity and/or
14 concentration of various analytes. Differently configured computer may
be used to serve
different purposes. Therefore, the structure of the system may be different in
different example
16 of the present invention. After being collected, data are typically
transferred to analyzing
17 process. In order to make the analyzing process easy, data obtained from
the detection device
18 are typically analyzed by digital computer. Typically, the computer is
programmed appropriately
19 to receive and store the data from detection device as well as analyze
and report the collected
data.
21 The present invention also provides the analyte detection kit including
nanoparticle
22 according to the present invention. The detection kit will include tools
and reagents that are
23 commonly used in the art. These tools/reagents may include, but is not
limited to, a suitable
24 carrier, marker which can generate a detectable, solvent, detergent,
buffer, and stabilizer. If the
marker is an enzyme, it may include substrate and chain stopper which are
capable of
26 measuring enzyme activity. Suitable carrier may include, but not limited
to, the soluble
27 substrate, for example, physiologically acceptable buffer known in the
art, which may be, for
28 example, PBS, insoluble carrier, whose example may be polystyrene,
polyethylene,
29 polypropylene, polyester, polyacrylonitrile, fluorine resin, cross-
linked dextran, polysaccharides,
polymers such as magnetic particulate which is metal plated latex, other
paper, glass, metal,
31 agarose, and combinations thereof.
16
22391098.3
CA 02819052 2016-01-07
CA 2,819,052
Bakes Ref: 10201/00001
1 The nanoparticle according to the present invention may replace the
nanoparticle used
2 in conventional molecular diagnostic chip for detection or conventional
imaging diagnosis. The
3 nanoparticle according to the present invention can be applied to
molecular diagnostic chip such
4 as DNA chip and protein chips. The analytes to be detected may be gene,
viral RNA and DNA,
bacterial DNA, fungal DNA, mammalian DNA, cDNA, mRNA, RNA, DNA fragment,
6 oligonucleotide, synthetic oligonucleotide, modified oligonucleotide,
single-strand and double-
7 strand nucleic acid, natural and synthetic nucleic acids, amino acids,
peptides, polypeptides,
8 proteins, glycoproteins, lipoprotein, nucleoside, nucleotide,
oligonucleotide, nucleic acids,
9 sugars, carbohydrates, oligosaccharides, polysaccharides, fatty acids,
lipids, hormones,
metabolite, cytokines, chemokines, receptors, neurotransmitters, antigens,
allergens,
11 antibodies, substrates, metabolites, cofactors, inhibitors, drugs,
pharmaceutical substance,
12 nutrients, prions, toxins, poison, explosives, pesticides, chemical
warfare agents, bio-hazard
13 substance, radioisotope, vitamin, heterocyclic aromatic compounds,
carcinogens, mutagenic
14 agent, narcotics, amphetamines, barbiturate, hallucinogens, waste or
pollutants.
The nanoparticle according to the present invention may be highly applicable
to the
16 detection of analyte such as DNA and protein related to the onset and
progress of particular
17 diseases, and applicable to molecular diagnostic technique and molecular
imaging field, such as
18 large-scale genome sequence analysis, Single Nucleotide Polymorphism
(SNP) detection,
19 sequence comparison, genotype-specific analysis, care and drug
development.
In addition, on the surface of nanoparticle according to the present
invention, the
21 substance which indicates other signal can be included inside or outside
of the nanoparticle. For
22 example, the computed tomography (CT) contrast agents, magnetic
resonance imaging (MRI)
23 contrast agents, optical contrast agents, ultrasound contrast agents, or
a combination of these
24 substances can be included additionally, featuring that Raman analysis
using nanoparticle can
be performed along with CT, MRI, optical or ultrasonic analysis at the same
time accordingly.
26 In addition, the nanoparticle according to the present invention may
include genes,
27 antibodies or drugs, and accordingly can be used in the treatment of
disease as drug carrier.
28 [Advantageous Effect]
29 The nanostructure of nanogap particle has a large surface area and
provides the
nanogap of high reproducibility and uniform thickness. Accordingly, the entire
surface of the
31 core can be used for enhancing the SERS, and the location of the dye
also can be positioned
32 precisely inside the nanogap. Furthermore, in actual use, it can be
synthesized simply with high
17
22391098.3
CA 02819052 2016-01-07
CA 2,819,052
Bakes Ref: 10201/00001
1 synthetic yield. Therefore, very high signal amplification effect is
shown, and the problem of
2 signal reproducibility and quantification, which is the crucial
prerequisite to the
3 commercialization, can be overcome due to high reproducibility.
4
[Preferable Mode for Invention]
6 The present invention is described in more details through providing
examples as
7 below. However, these examples are merely meant to illustrate, but in no
way to limit, the
8 claimed invention.
9
Material used
11 Gold nanoparticle was purchased from Ted Pella (Redding, CA, USA). All
other
12 chemical materials (HAuC14=3H20, Polyvinylpyrrolidone (K value: 29-32),
NH2OH=HCI,
13 Dithiothreitol, BSPP) were purchased from Sigma-Aldrich (St. Louis, MO,
USA) and used as
14 received without further purification. HPLC-purified dye-coded thiolated
oligonucleotides were
purchased from IDT Inc. (Coralville, IA, USA) and reduced by using
dithiothreitol (DTT, 0.1 M) in
16 a phosphate buffer (0.17 M, pH = 8.0). The reduced oligonucleotides were
then purified through
17 a desalting NAP-5 column (Sephadex G-25 medium, DNA grade). NANO pure
H20 (>18.0 MO),
18 purified using a Milli-Q water purification system, was used for all
experiments. The
19 formvar/carbon coated copper grid (Ted Pella, Inc. Redding, CA, USA) and
HR-TEM (JEM-
3010, Japan, 300 kV) equipped with EDS unit (Link oxford ISIS 310) was used
for TEM
21 analysis.
22
23 Optical calculation for the NNP and silica-insulated nanoparticle
24 To understand correlation between electromagnetic wave and bridged Au
core-gap-
shell, 3D finite element model was studied using commercially available FEM
software
26 COSMOL which is capable of calculating the time-harmonic Maxwell
equation on the given
27 boundary condition. Linearly(x) polarized wave (A=632nm) was incident on
the bridged Au core-
28 gap-shell particle. Empirical dielectric constant of gold by Johnson and
Christy was used with
29 interpolation ((1) P. B. Johnson, R. W. Christy, Phys. Rev. B. 6, 4370-
4379 (1972); (2) P.G.
Etchegoin, E. C. Le Ru, M. Meyer, J. Chem. Phys. 125, 164705 (2006)).
18
22391098.3
CA 02819052 2016-01-07
CA 2,819,052
Blakes Ref: 10201/00001
1 Relative permeability of gold is p,=1, and complex refractive index was
calculated as
nAu (A) = Ve_4õ (A) = n +lk =
2 Dielectric constants of water, air, and silica
are
3 ewater=1.332, eah=1, es/02=1.462, respectively. Effective dielectric
constant of mixture of air and
4 DNA in the gap area was determined by Maxwell-Garnett equation:
eavii. (1 -,- 295) --h 2e0 (1, ¨
6() EDNA ( ¨ eo (2 t-21)
6 wherein, eeff is effective dielectric constant of the mixture of water
(or air) and DNA, e0 is
7 dielectric constant of water (or air), eDNA is dielectric constant of DNA
(G. Rong, A. Najmaie, J.
8 E. Sipe, S. M. Weiss, Biosensors and Bioelectronics 23, 1572-1576 (2008))
(eDNA -1.5), and f
9 represents a volume fraction of DNA in the gap area. 300 nucleotides were
assumed to be
present in the gap area and a volume fraction of DNA in the gap area is about
0.0048
11 accordingly.
12
13 Nano-Raman experimental setup
14 Raman spectrum was measured with a nano-Raman spectroscope (Axiovert
200,
Zeiss) equipped with an inverted optical microscope and independently
adjustable piezoelectric
16 x, y sample scanner (Physik Instrumente). Argon ion laser (Melles Griot,
USA) of 514.5 nm, He-
17 Ne laser (JDSU, USA) of 632.8 nm, and diode laser (B&W TEK INC.) of 785
nm were used as
18 excitation source coupled with single-mode optical fiber. Excitation
laser beam of 50 nW to 1
19 mW was reflected by dichroic mirror (Chroma Technology Corp.) on oil-
immersion microscope
objective (x100, 1.3 numerical aperture; x50, 0.5 numerical aperture; Zeiss),
focused on the
21 diffraction-limited spot (<300 nm and <3 pm for x100 and x50 objective
lens, respectively, when
22 laser of 632.8 nm is used) on the upper surface of cover-glass slip. AFM
(Bioscope, Digital
23 Instruments, Veeco Metrology Group) equipped with a nanoscope IV
controller was installed on
24 the micro-mechanical stage. Background Raman signal was collected by CCD
(charge-coupled
device) which was frozen by liquid nitrogen (-125 C). Tapping mode on closed-
loop
26 piezoelectric flexure sample stage and closed-loop AFM scanner were used
in order to relate
27 Raman or Rayleigh scattering signal to AFM topographical image of
overlap precision of <50
28 nrn1 and sample image. Focus of laser is coincided with AFM tip so to
disperse symmetrically
29 to AFM tip. Scattering spectrum was measured at the range of 500-2000 cm-
1 single and at 10
19
22391098.3
CA 02819052 2016-01-07
CA 2,819,052
Blakes Ref: 10201/00001
1 seconds. All data was baseline-corrected by removing background signal
from Si. For all
2 solution used in Raman analysis, 384 well optical bottom plate (NuncTM,
New York, USA) was
3 used. In AFM-correlated nanoRaman analysis, Ploy-L-lysine coated cover
glass (piranha-
4 etched) was used.
6 Example 1: Preparation of core-gap-shell nanoparticle
7 Single NNP nanoparticle with intra-nanogap was prepared according to the
method in
8 the following, using DNA strand as Raman-dye modification platform with
ability to adjust the
9 location very precisely. The method is also represented schematically in
Figure 2a.
As a typical preparation method, DNA modified gold nanoparticle (20 nm
particle; DNA
11 sequence: 3-HS-(CH2)3-A10-PEG18-AAACTCTITGCGCAC-5') was prepared
according to the
12 literature 'S. J. Hurst, A. K. R. Lytton-Jean, C. A. Mirkin, Anal. Chem.
78, 8313 (2006). In order
13 to form a shell (Au) surrounding a core of DNA modified gold
nanoparticle, the DNA modified
14 gold nanoparticle was reacted with gold precursor (HAuC14), reducing
agent (NH2OH-HC1) and
1% poly-N-vinyl-2-pyrrolidone (PVP; MW 40,000) in phosphate-buffered solution
(0.3 M NaCl;
16 10 mM PB; pH 7.4) and was vortexed for 30 minutes at room temperature.
In order to determine
17 the change in the form of nanoparticle according to the process of the
formation of the shell, the
18 amounts of gold precursor (HAuC14) and reducing agent (NH2OH-HCI) were
adjusted on the
19 basis of amount of seed (DNA modified gold nanoparticle, 1 nM).
Concretely, DNA modified gold nanoparticle solution (100 L; 1 nM in 0.3M PBS)
was
21 mixed with 1% PVP solution of 50 L. The resultant solution was mixed
with hydroxylamine
22 hydrochloride solution (10 mM) of 1.5 L, 5.2 L, 10.3 L or 30.4 L and
mixed with chloroauric
23 acid solution (5 mM) of 1.5 L, 5.2 L, 10.3 L or 30.4 L,
respectively. A variety of
24 nanostructures were formed according to the amount of reactant (Figure
2b and 2c;
intermediate (1, 2 and 3) and product (4, 5)). The pattern of nanostructure
prepared for each
26 solution was observed as in Figure 3.
27 In the preparation process, the color of particle solution changed from
pink (DNA
28 modified gold nanoparticle) to pale pink (intermediate 1; budding
structures), blue (intermediate
29 2), purple (intermediate 3; intermediate shell structure), and finally
to red-wine color (NNP
structure), as represented in Figure 2b, which coincide with UV-Vis spectra
and HR-TEM
31 represented in Figure 2b and 2c, respectively.
22391098.3
CA 02819052 2016-01-07
CA 2,819,052
Blakes Ref: 10201/00001
1 Interestingly, as the more reactant was added, the smaller budding
sphere began to
2 appear and was formed sideways on DNA-modified gold surface. Shell-like
structure was
3 gradually formed, and nanogap was observed in the process (Figure 2b,
Figure 2c, and Figure
4 3). UV-Vis spectrum represents that the color change of the solution is
closely related to HR-
TEM images (Figure 2b). UV-Vis spectrum of the intermediate 1 (Figure 2b 1)
indicates that
6 plasmonic resonance peak of approximately 680 nm is due to transverse
mode along the long
7 axis of the synthesized budding structures (Figure 2c 1) and such peaks
gradually disappeared
8 as the shell is formed (Figure 2b 4). For the final product (Au-NNPs
(nanoparticle of gold core-
9 nanobridged nanogap-gold shell structure); core of about 20 nm, gap of
about 1.2 nm, and shell
of about 11 nm), plasmon resonance peaks were close to the template particles
(about 520 nm
11 for DNA modified gold nanoparticles (DNA-Au-NNPs)) with broader peak
shape by perfect
12 nanoshell structure (Figure 2b 4), but UV absorbance is enhanced by more
than 4 times
13 compared with DNA-Au-NNPs (UV-spectrum in Figure 2b was obtained from
the diluted solution
14 by 2 times). Calculated extinction coefficient of the product is about
7.2 x 10⁹ M-lcm-1.
Importantly, HRTEM image of intermediates 2, 3, and the final product (4, 5)
indicates
16 that nanobridge is formed by partial contact between shell and the
surface of core, and
17 nanobridged nanogap was formed on the surface of core (average gap size
is approximately 1.2
18 nm; Figure 2c 4, 5, 6). The final product (Au-NNPs) was prepared with
high yield (approximately
19 95%) as a final product, and all particles has uniform intra-nanobridged
nanogap as TEM image
shown in Figure 2c 4 and 5. The average diameter measured by TEM image is 42 5
nm (Figure
21 4). Element line mapping of Au-NNP shown in Figure 2c 6 represents a
reduced area of gold
22 atoms (about 1.2 nm), which coincides with the nanogap observed in
Figure 2c 5. Prepared
23 NNP in solution was a substantially stable for more than 6 months under
atmospheric conditions
24 (room temperature and 0.3 M PBS).
26 Comparative example 1: Preparation of surface modified nanoparticle by
27 substance other than oliqonucleotide.
28 In order to understand the role of surface modified oligonucleotide,
comparative
29 example was prepared as follows.
Nanoparticle was prepared by the same method as in Example 1, except using
citrate-
31 stabilized 20 nm gold nanoparticle as seed, and 10 mM phosphate buffer
or deionized water.
21
22391098.3
CA 02819052 2016-01-07
CA 2,819,052
Blakes Ref: 10201/00001
1 Branched form or nanoshell was formed on the gold core without the
formation of intra-nanogap
2 (Figure 5).
3 Nanoparticle was also prepared by the same method as in Example 1,
except that
4 BSPP (bis(p-sulfonatophenyl)phenylphosphane dehydrate) was modified on
the surface of gold
nanoparticle and the resultant BSPP modified gold nanoparticle was used as
seed. In this case,
6 the growth of shell is somewhat irregular and highly polydisperse
nanostructure was prepared
7 without the formation of intra-nanogap (Figure 6).
8 For both cases, although the surface charges (the zeta potentials of
citrate-gold
9 nanoparticle and BSPP-gold nanoparticle are -35 3 mV and -45 3 mV,
respectively) were not
significantly different form that of DNA-AuNPs (-25 1 mV), the growth pattern
of the shell was
11 completely different.
12 Nanoparticle was also prepared by the same method as in Example 1,
except using
13 mPEG (molecular weight 5,000) thiol modified gold nanoparticle as seed.
In this case, the
14 nanoparticle of slightly distorted pentagonal or spherical structure was
prepared without the
formation of intra-nanogap (Figure 7).
16 The results identified that DNA is very important in preparing a
nanoparticle of core-
17 nanogap-shell structure according to the present invention.
18
19 Comparative example 2: Preparation of nanoparticle using T10 spacer
instead of
410 spacer
21 Nanoparticle was prepared by the same method as in Example 1, except
using T10
22 spacer instead of Alo spacer. In this case, single-nucleated
nanostructure (Intermediate 1) was
23 not observed in the presence of a small amount of precursor (Figure 8).
If larger amounts of
24 precursor were used, multiple nucleation sites were formed on the
surface of gold core and
intra-nanogap was not formed in the final nanostructure.
26 Based on higher affinity to the gold surface of adenine than thymine,
thymine, when
27 used as a spacer, is expected to have approximately 40% higher DNA
loading ability than when
28 adenine is used as a spacer ((1) SJ Hurst, AKR Lytton-Jean, CA Mirkin,
Anal. Chem. 78, 8313
29 (2006); (2) Z. Wang, J. Zhang, JM Ekman, PJA Kenis, Y. Lu, Nano Lett.
DOI:
10.1021/n1100675p (2010)). The above results represent the importance of
proper DNA
31 sequence in preparing NNP nanostructure, and the formation of intra-
nanobridge and nanogap
22
22391098.3
CA 02819052 2016-01-07
CA 2,819,052
Blakes Ref: 10201/00001
1 is considered due to the surface of thiolated DNA-modified gold core,
AuCI4-ion capture effect of
2 the nucleotide base (amine-base of guanine) ((1) A. Schimanski, E.
Freisinger, A. Erxleben, B.
3 Lippert, Inorganica Chimica Acta 283, 223 (1998) (2) KR Brown, MJ Natan,
Langmuir 14, 726
4 (1998) (3) Z. Ma, S. Sui, Angew Chem. Int Ed 41, 2176 (2002)), PVP.
6 Example 2: FEM calculation of gold nanoparticle and core-shell particle
7 surrounded by nanoqap without bridge and silica
8 In order to understand relation between Au-NNP and electromagnetic wave,
FEM (3D
9 finite-element-method was applied to the calculation (Wustholz, K. L. et
al. Structure-activity
relationships in gold nanoparticle dimers and trimers for surface-enhanced
Raman
11 spectroscopy. J. Am. Chem. Soc. 132, 1 0903-1 0910 (2010)), and the
results were compared
12 with Au-Au core-shell nanoparticle surrounded by silica (Figure 9). In
every calculation, four
13 intra-nanobridges were assumed to be formed between Au core and Au
shell. Radius of core is
14 20 nm, nanobridge is cylindrical shape of 2.5 nm x 1.2 nm, size of gap
or thickness of silica is
1.2 nm, and thickness of shell is 11 nm. Linearly polarized plane wave
incident along the x-axis
16 was used for plasmon excitation. The intensity of EM enhahcement is
represented in Figure 9a,
17 which indicates that EM enhancement is located intensively on the intra-
gap of NNP and
18 enhanced by maximum of 33 times of the incident light. On the other
hand, in the Au-Au core-
19 shell structure, EM is identified to be enhanced only by 3.2 times at
the same area. EF values of
particle surrounded by NNP and silica are 1.2x10⁶ and 1.0x10², respectively.
The calculated EF
21 value (1.2x10⁶) can be compared with the that of "L" type trimer nano-
antenna structure
22 composed of three 100 nm gold cores and silica coating (1.1x10⁶)
(Wustholz, K. L. etal.
23 Structure-activity relationships in gold nanoparticle dimers and trimers
for surface-enhanced
24 Raman spectroscopy. J. Am. Chem. Soc. 132, 10903-10910 (2010)). Surface
roughness
chemical enhancement, which was not considered for the calculation, are
expected to increase
26 total SERS enhancement. The result indicates that high EM enhancement in
NNP is originated
27 from nanogap (-1.2 nm) between core and shell. Importantly, intra-
nanobridge as well affects
28 the enhancement factors. The calculation result for Au-nanogap particle
without bridge is
29 compared with that of NNP (black line in Figure 9c), which indicates
that addition of nanobridge
induces the enhancement of more than 102 times. Symmetry breaking could be a
possible origin
31 of this additional field enhancement. (Sonnefraud, Y. et al.
Experimental realization of
32 subradiant, superradiant, and fano resonance in ring/disk plasmonic
nanocavities. ACS Nano 4,
23
22391098.3
CA 02819052 2016-01-07
CA 2,819,052
Blakes Ref: 10201/00001
1 1664-1670 (2010)). The dependence of NNP structure on the incident
wavelength is studied at
2 the three different wavelengths (514 nm, 632 nm and 785 nm; Figure 9d).
The incident
3 wavelength of 632 nm shows the highest signal intensity. The strong
independence on the
4 wavelength coincides with the experimental result (Figure 10a).
6 Example 3: Preparation of nanoparticle with modified location of Raman
dye
7 DNA strand was used for forming platform for Raman dye modification as
well as
8 forming intra-nanogap.
9 Three different kinds of reduced thiolated oligonucleotides with
modified location of dye
(ROXgap (760 pL, 4.3 pM): 3LHS-(CH2)3-(ROX)-A10-REG18-AAACTOTTTGCGCAC-5',
ROXsheli
11 (131 pL, 24.9 pM): 3'-HS-(CH2)3-A10-PEG18-(ROX)-AAACTCITTGCGCAC-5' and
ROXouter (456
12 pL, 7.1 pM), 3'-HS-(CH2)3-A10-REG18-AAACTCITTGCGCAC-(ROX)-5) was mixed
with and
13 reacted to citrate-gold nanoparticles (1 ml, 1.0 nM) for 20 minutes at
room temperature,
14 respectively. In order to obtain as final phosphate concentration of 10
mM (pH 7.4), the resultant
solution was adjusted with 100 mM phosphate buffer (for ROXgap, ROXsheii and
ROXouter, 176 pL,
16 113 pL and 146 pL added, respectively), to a final concentration of 0.1%
(wt/vol) SDS with 10%
17 SDS solution (for ROXgap, ROXsheli and ROXouter, 1.9 pL, 1.2 pL, and 1.6
pL added respectively).
18 After additional reaction of the resultant solution in orbital shaker
for 20 minutes, 2M NaCI
19 solution (10 mM PB, 0.1% SDS) was added to the reaction mixture every 20
minutes at four
times (0.05 M 2 times, 0.1 M 2 times) to be adjusted to 0.3M NaCI (for ROXgap,
48.5 pL, 48.5 pL,
21 97 pL, 97 pL added each time; for ROXshell, 31.1 pL, 31.1 pL, 62.3 pL,
62.3 pL added each time;
22 for ROXouter, 40 pL, 40 pL, 80 pL, 80 pL added each time). Only the
solution with additional
23 ROXouter sequence was heated in water bath (60 C) for about 5 minutes to
minimize a non-
24 specific interaction between ROX molecules and the gold surface. The
resultant solution
(colloidal) was vortexed at room temperature for a day.
26 Next, the resultant solution was centrifuged (12,000 rpm, 15 min), the
supernatant was
27 removed, and the precipitated was diffused in 10 mM PB solution (pH
7.4), which was repeated
28 twice. Finally, a resultant solution was re-diffused in 0.3 M PBS (1 ml)
and the concentration of
29 particle was measured with ultraviolet-visible light spectrometer
(Agilent 8453
spectrophotometer, USA). After quantifying the number of DNA loading using the
fluorescence
31 intensity of supernatant emitted by 0.1 DTT for a day (SJ Hurst, AKR
Lytton-Jean, CA Mirkin,
24
22391098.3
CA 02819052 2016-01-07
CA 2,819,052
Blakes Ref: 10201/00001
1 Anal. Chem. 78, 8313 (2006)), approximately 100 DNA-modified gold
nanoparticles were used
2 in the following.
3 All Raman experiments were carried out with a nano-Raman spectroscope
(Axiovert
4 200, Zeiss) equipped with an inverted optical microscope(D. K. Lim, K. S.
Jeon, H. M. Kim, J. M.
Nam, Y. D. Suh, Nature Mater. 9, 60 (2010)). Typically, a 50-fold objective
lens (NA 0.5) and
6 300 pW laser power were used throughout the analysis.
7 Each sample solution (20 ,t1_) was placed on the 384 well optical bottom
plate (NuncTM,
8 New York, USA). First, incident wavelength dependence was analyzed with
an Au-g(ROXgap)-
9 AuNP probe (0.5 nM) shown in Figure 4A. Although SERS signal was not
observed at the
excitation wavelengths of 514.5 and 785 nm, the strong SERS signal with Raman
shift of 1504
11 and 1645 cm-1 in ROX was observed, which coincides with the previously
reported literature
12 ((1)P. Zhang, Y. Guo, J. Am. Chem. Soc. 131, 3808 (2009); (2) C. L.
Zavaleta, etal., Proc. Natl.
13 Acad. Sci. USA 116, 13511 (2009); (3) K. Faulds, W. E. Smith, D. Graham,
Anal. Chem. 76, 412
14 (2004)). In the case of ROX-modified gold nanoparticle without gold
shell, SERS spectrum was
not observed at the excitation wavelength of 632.8 nm.
16 Next, the time-dependent Raman result of three different kinds of dye-
modified NNP
17 nanoparticles indicates that the signal is closely related to the
location of dye in the NNP
18 structure (Figures 10B, 10C and 10D). The strongest signal with
excellent reproducibility was
19 observed in the Au-NNP (ROXgap). As the dye moves away from the intra-
gap, the Raman
signal weakens and reproducibility drops (Au-NNP (ROXgap) > Au-NNP (ROXsheri)
> Au-NNP
21 (ROXouter))=
22 Experimental results identified a strong SERS signal can be obtained
reproducibly from
23 Au-NNP (ROXgap) which Raman dye is located in the intra-nanogap. In
addition, signal with high
24 uniformity and reproducibility is considered to be originated form the
dye molecules which are
distributed homogeneously on the surface of the core gold and quantitatively
controlled. It is
26 found that Au-S bonding between gold core and thiolated oligonucleotide
and gold shell
27 including oligonucleotide enables forming the very stable probe and
confines Raman dyes
28 uniformly to a very narrow intra-nanogap. In addition, the nanoparticles
maintain the same
29 optical characteristics at room temperature for more than 6 months.
25
22391098.3
CA 02819052 2016-01-07
CA 2,819,052
Bakes Ref: 10201/00001
1 Example 4: Preparation of nanoparticle with adjusted amount of dye
2 The number of Raman dyes in the intra-nanogap was adjusted as follows,
3 characteristics were identified accordingly and the whole process was
schematically shown in
4 Figure 11a.
It is known that if poly A spacer is used in the condition of 0.3 M PBS, the
number of
6 oligonucleotide loading on 20 nm gold nanoparticle can be approximately
100 according to the
7 size of nanoparticle and DNA loading characteristic of DNA spacer (S. J.
Hurst, A. K. R. Lytton-
8 Jean, C. A. Mirkin, Anal. Chem. 78, 8313 (2006)). Hereupon, the mixtures
of surface protecting
9 sequence and ROXgap-modified sequence (surface protecting sequence: 3'-HS-
(CH2)3-A10-
PEG18-AAACTCTITGCGCAC-5', ROXgap-modified sequence: 3'-HS-(CH2)3-(ROX)-A10-
PEG18-
11 AAACTCTTTGCGCAC-5') of four different kinds of ratio (99:1(259 pL, 12.6
pM: 2.4 pL, 13.8
12 pM), 90:10 (235 pL, 12.6 pM: 24 pL, 13.8 pM), 50:50 (131 pL, 12.6 pM:
120 pL, 13.8 pM) and
13 0:100(0: 760 pL, 4.3 pM)) were bonded and reacted to citrate-gold
nanoparticle (citrate-AuNPs;
14 1 ml, 1.0 nM) for 20 minutes at room temperature, respectively. In order
to obtain as final
phosphate concentration of 10 mM (pH 7.4), the resultant solution was adjusted
with 100 mM
16 phosphate buffer (for 99:1, 90:10, 50:50, and 0:100, 126.1 pL, 125.9 pL,
125.1 pL, and 176 pL
17 added, respectively), to a final concentration of 0.1% (wt / vol) SDS
with 10% SDS solution (for
18 99:1, 90:10, 50:50, and 0:100, 1.3 pL, 1.3 pL, 1.3 pL, and 1.9 pL added,
respectively). After
19 additional reaction of the resultant solution in orbital shaker for 20
minutes, 2M NaCI solution
(10 mM PB, 0.1% SDS) was added to the reaction mixture every 20 minutes at
four times (0.05
21 M twice, 0.1 M 2 times) to be adjusted to 0.3M NaCI (for 99:1, 34.7 pL,
34.7 pL, 69.4 pL, 69.4
22 pL added each time; for 90:10, 34.6 pL, 34.6 pL, 69.3 pL, 69.3 pL added
each time; for 50:50,
23 34.4 pL, 34.4 pL, 68.8 pL, 68.8 pL added each time; for 0:100, 48.5 1_,
48.5 1_, 97 L, 97 pL
24 added each time). The resultant solution (colloidal) was vortexed at
room temperature for a day.
Next, the resultant solution was centrifuged (12,000 rpm, 15 min), the
supernatant was
26 removed, and the precipitated was diffused in 10 mM PB solution (pH
7.4), which was repeated
27 twice. Finally, a resultant solution was re-diffused in 0.3 M PBS (1 ml)
and the concentration of
28 particle was measured with ultraviolet-visible light spectrometer
(Agilent 8453
29 spectrophotometer, USA). After quantifying the number of DNA loading
using the fluorescence
intensity of supernatant emitted by 0.1 DTT for a day (SJ Hurst, AKR Lytton-
Jean, CA Mirkin,
31 Anal. Chem. 78, 8313 (2006)), the result was represented in Figure 11b.
As represented in
26
22391098.3
CA 02819052 2016-01-07
CA 2,819,052
Blakes Ref: 10201/00001
1 Figure 11b, it is identified that the amount of dyes can be adjusted as
intended. Prepared 100
2 DNA-modified gold nanoparticles were used in the following.
3 For all four types of concentration ratio, Au-NNP (ROXgap) was prepared
with high yield
4 (>95%) regardless of the oligonucleotide composition, and all
concentrations of NNP probes
were adjusted to 0.5 nM in ultrapure water (> 18M0).
6 Next, Raman study based on the solution was performed for the above NNP
probes
7 (Figure 12). When dye was not modified on the probe, the Raman signal was
not detected.
8 When only one dye was modified on the probe, small, but detectable, Raman
signal was (Figure
9 12a, n = 1). As the number of dyes per probe increased (form n = 1 to n =
100), the entire
spectrum intensity quantitatively increased. Characteristic spectral peak
(1504 and 1645 cm-1)
11 was proportional to the number of ROX-modified nucleotides per probe,
which indicates that the
12 number of ROX dye per probe is proportional to the Raman signal
intensity (Figure 12b).
13 The above results identified that strong electromagnetic enhancement and
SERS
14 intensity by plasmon coupling between the core and the shell can be
quantitatively adjusted by
adjusting the number of modified dye per probe.
16
17 Example 5: Preparation of nanoparticle with modified thickness of shell
18 It is known that the plasmonic characteristics of metal nanoparticle can
be changed by
19 changing the structure of nanoshell. Accordingly, in order to identify
the change of SERS signal
depending on the thickness of shell in core-nanogap-shell structure, the
particles with shell
21 thickness of 12, 15, 20, 30, 30 and 35 cm were prepared as follows. In
order to gold shell
22 around the DNA modified gold nanoparticle core (ROXgap-modified
sequence: 3'-HS-(CH2)3-
23 (ROX)-A13-PEG18-AAACTCTTTGCGCAC-5', number of DNA loading = 100), the
above DNA-
24 modified nanoparticle (100 L, 1 nM in 0.3M PBS) was mixed with 1% PVP
solution of 50 L.
The resultant solution was mixed with hydroxylamine hydrochloride solution (10
mM) of 33.6 L,
26 53 1_, 124.8 L, 302 L or 432 1_, and mixed with chloroauric acid
solution (5 mM) of 33.6 L,
27 53 L, 124.8 4, 302 L or 432 L, respectively. The reaction mixture was
vortexed for 30
28 minutes at room temperature. After centrifugation, the concentration was
adjusted to 0.5 nM
29 with ultrapure water (18 MO).
The prepared nanoparticles were analyzed at 1504 and 1645 cm-1, respectively.
As
31 shell thickness increased from 25 cm to 12 nm, the SERS signal intensity
was found to rapidly
27
22391098.3
CA 02819052 2016-01-07
CA 2,819,052
Blakes Ref: 10201/00001
1 increase. However, in the case of shell thickness of > 25 nm, the SERS
signal began to
2 decrease rapidly and in the case of shell thickness of 35 nm, SERS signal
decrease close to
3 almost 0 (Figure 12c).
4 The above results indicated larger nanoparticles represent strong
electromagnetic
enhancement in some degree of SERS, which is consistent with well known fact,
and reduction
6 of electromagnetic enhancement in shell thickness of > 25 nm is caused by
decrease of Raman
7 emission signal of Raman dye detected on the gap, which is because these
signals need to
8 pass through metal shell to be detected. Importantly, the whole tendency
of the Raman signal
9 changes depending on the thickness of the shell (Figure 12c black line
with filled squares and
grey line with filled squares) follows tendency of calculated area enhancement
results (Figure
11 12c).
12
13 Example 6: Measurement of multiplexing capability of nanoparticle
14 In order to identify the multiplexing capability of nanoparticle
according to the present
invention, two types of Raman dyes (R6G-green and Cy3 dyes) were used, which
were
16 modified on oligonucleotide and placed in the nanogap.
17 The same thickness of the shell (-11 nm) was used for all of the above
particles, and
18 was analyzed under the same conditions (concentration, apparatus, etc.)
as for ROX dye robe.
19 Fingerprint peaks for R6G-green and Cy3 dye probe were clearly
identified; uniform time-
dependent spectral pattern was confirmed for both cases. Among above three
types of dyes
21 containing ROX dye, NNP with Cy3 dye in gap (Au-NNP (Cy3) n probe (n =
100)) showed the
22 strongest SERS signal (Figure 13).
23 The above results are originated from relatively large Raman cross-
section of Cy3 dye
24 in the nanogap compared with other dyes, molecular flexibility and off-
resonance effect of R6G-
green (Abmax = 504 nm). The more dyes can be modified chemically or physically
on the above
26 gap (Figure 14b) because large surface of intra-nanogap is available,
which improves sensitivity
27 as well as multiplexing capability.
28
28
223910983
CA 02819052 2016-01-07
CA 2,819,052
Blakes Ref: 10201/00001
1 Example 7: Measurement of Raman signal according to the concentration of
the
2 nanoparticles and comparison with fluorescence-based detection methods
3 An experiment using Au-NNP(Cy3)100 probes was carried out to identify
the relation
4 between the concentration of particles and intensity of SERS. First, the
nanoparticles were
washed with deionized water (18 MO) several times and the distribution of
concentration of the
6 particles were analyzed with 650 pW laser power and displayed in Figure
14a. The results of
7 Raman shift in 1190, 1460 and 1580 cm-1 showed the outstanding relation
between the
8 concentration of particles and intensity of SERS (R2=0.9862) (Figure
14a). The detection limit in
9 the solution (1.9 pM) can be improved by using stronger laser power or
increasing the number
of reporter molecules in the nanogap. Unlike the conventional hot spots formed
on the outer
11 connection area between nanoparticles which limited number of Raman dyes
can be located
12 irregularly, Au-NNP according to the present invention can saturate the
Raman dye molecules
13 chemically or physically. In order to achieve higher sensitivity by
using Au-NNP in solution, non-
14 resonant Raman reporter molecule (4,4'-dipyridyI)-saturated Au-NNP was
used. In order to
prepare 4,4'-dipyridyl saturated Au-NNP, oligonucleotides (3'-HS-(CH2)3-A10-
PEG18-
16 AAACTCTTTGCGCAC-5') was first modified on the surface of AuNP core.
After mixing DNA-
17 AuNPs (500 pL of 1.0 nM) with 100 pL of 4,4'-dipyridyl solution (0.1 M,
ultrapure water water),
18 the resultant solution was incubated for 3 days with gentle shaking at
the room temperature.
19 Excess of 4,4'-dipyridyl was removed by repeated centrifugal filtration
(15 min, 12,000 rpm) and
re-diffusion in 0.3M PBS, and Au shell was formed successfully. 4,4'-dipyridyl
molecules was
21 bonded physically on the surface of the core of AuNP and saturated
before Au shell formation.
22 Due to smaller molecular size and higher coating weight than Cy3, the
higher sensitivity can be
23 provided (Figure 10). Linear relationship between probe concentration
and Raman intensity was
24 observed. As a very important result, the Raman signal was measured at
10 fM solution as well
(4,4'-dipyridyl fingerprint peak was clearly identified at 1292 cm-1, 1230 cm-
1, and 1022 cm-1. The
26 results identified that the particles represent stable SERS signal and a
very highly sensitive and
27 quantitative SERS spectrum.
29
22391098.3