Note: Descriptions are shown in the official language in which they were submitted.
CA 02824043 2013 07 05
WO 2012/094643
PCT/US2012/020556
ESOPHAGEAL CYTOKINE EXPRESSION PROFILES IN EOSINOPHILIC
E SOPHAGITIS
STATEMENT REGARDING FEDERALLY-SPONSORED RESEARCH
[0100] This invention was made with U.S. Government support. This
work was supported in part by the Pilot and Feasibility Program PHS Grant P30
DK0789392 and by NIH grants AI079874-01, AI070235, AI045898, and DK076893.
The U.S. Government could have certain rights in the subject matter hereof
CROSS REFERENCE TO RELATED APPLICATION
[0001] The present application claims the benefit of priority under 35
U.S.C. 119(e) to U.S. Provisional Application No. 61/430,453, A STRIKING
LOCAL ESOPHAGEAL CYTOKINE EXPRESSION PROFILE IN EOSINOPHILIC
ESOPHAGITIS, filed on January 6, 2011, which is currently co-pending herewith
and
which is incorporated by reference in its entirety.
FIELD OF THE INVENTION
[ 0 0 0 2 ] The invention disclosed herein generally relates to diagnosis,
treatment, and/or management of eosinophilic esophagitis and/or diseases,
disorders,
and/or conditions arising therefrom and/or related thereto.
BACKGROUND
[0003] All publications mentioned herein are incorporated by reference to
the same extent as if each individual publication or patent application was
specifically
and individually indicated to be incorporated by reference. The following
description
includes information that can be useful in understanding the present subject
matter. It
is not an admission that any of the information provided herein is prior art
or relevant
to the presently claimed subject matter, or that any publication specifically
or
implicitly referenced is prior art.
[0004] Eosinophilic esophagitis (EE, also abbreviated EoE in some
publications) is an emerging worldwide disease characterized by marked
esophageal
eosinophil infiltration (>15 eosinophils/ high power field [hpf]) that is not
responsive
to acid suppressive therapy (see, e.g., Furuta, G. et at., Gastroenterology
133:1342-63
(2007); Assa'ad, A. et at. J Allergy Clin. Immunol. 119:731-8 (2007);
Straumann, A.
and Simon, H. J Allergy Clin. Immunol. 115:418-9 (2005)). EE symptoms mimic
1
CA 02824043 2013 07 05
WO 2012/094643
PCT/US2012/020556
gastroesophageal reflux disease (GERD) and vary with age. Patients with EE can
have gastrointestinal complains that typically include, but are not limited
to, failure to
thrive, vomiting, abdominal pain, dysphagia, and food impactions (see, e.g.,
Furuta,
G. et at., Gastroenterology 133:1342-63 (2007); Liacouras, C. et at. J
Pediatr.
Gastroenterol. Nutr. 45:370-91 (2007)).
[0005] EE diagnosis generally involves endoscopy, which is an invasive
and inconvenient procedure. The endoscopy procedure is then commonly followed
by biopsy analysis.
SUMMARY OF THE INVENTION
[0006] Methods and compositions described herein are provided by way
of example and should not in any way limit the scope of the invention.
[0007] Embodiments of the invention encompass methods of providing or
enhancing a diagnosis of EE, including: obtaining a sample from a patient
having at
least one indication of EE; quantifying from the sample an amount of at
least
one analyte, wherein the analyte can be, for example, any of the cytokines
listed in
Table 1, any of the cytokines listed in Table 2, or an mRNA corresponding to
any
member of the group or its receptor, or the like, wherein an altered level of
the at least
one analyte correlates with a positive diagnosis of EE; and providing or
enhancing a
diagnosis of EE, based upon the quantifying step.
[0008] In some embodiments of the methods, the at least one analyte can
be, for example, any of the cytokines listed in Table 1, or an mRNA
corresponding to
any member of the group or its receptor, or the like. In some embodiments, at
least
two analytes can be quantified; in others, at least four analytes can be
quantified, and
in others, all of the analytes in Table 1 can be quantified, and in others,
all of the
analytes in Table 2 can be quantified.
[0009] In some embodiments, the sample can include, for example, an
esophageal biopsy, and/or esophageal mucosa, and/or include blood, and/or the
like.
Blood can include, for example, plasma, serum, whole blood, blood lysates, and
the
like.
[ 0 0 1 0 ] In some embodiments, the indication of EE can include one or
more of a gastrointestinal complaint, esophageal eosinophil infiltration, and
the like.
The gastrointestinal complaint can include, for example, one or more of:
failure to
thrive, vomiting, abdominal pain, dysphagia, food impaction, and the like.
2
CA 02824043 2013 07 05
WO 2012/094643
PCT/US2012/020556
[0011] In some embodiments, the diagnosis of EE can include
classification as allergic, non-allergic, active, intermediate, or inactive
EE, a variable
degree of disease activity, or the like. In some embodiments, the EE diagnosis
classification can be used to predict the patient's level of response to a
selected
therapy. In some embodiments, the selected therapy can include, for example,
allergen removal, steroid treatment, dietary management, the use of proton
pump
inhibitors (PPIs), topical glucocorticoids, humanized antibodies against
relevant
cytokines, and small molecule inhibitors of an eosinophil and/or allergic
disease
activation pathway, or the like. In some embodiments, the selected therapy can
include the combination of any of these therapies.
[0012] In some embodiments, the diagnosis of EE can be enhanced by
combining information from the quantifying step with one or more other tests
for or
indicia of EE. The other tests for or indicia of EE can include, for example,
determination of allergic status, quantification of biomarkers associated with
allergic
status, determination of atopic status, quantification of biomarkers
associated with
atopic status, endoscopy with biopsy analysis, detection of eosinophils,
detection of
eotaxin-3, detection of eosinophil-derived neurotoxin, detection of IL-5
protein, and
the like.
[0013] Embodiments of the invention also include a diagnostic kit, test, or
array, including materials for quantification of at least two analytes,
wherein the at
least two analytes can be, for example, any of the cytokines listed in Table
1, any of
the cytokines listed in Table 2, or an mRNA corresponding to any member of the
group or its receptor, or the like. In some embodiments, the at least two
analytes
quantified by the diagnostic kit, test, or array can include, for example, any
of the
cytokines listed in Table 1, or an mRNA corresponding to any member of the
group
or its receptor, or the like.
BRIEF DESCRIPTION OF THE DRAWINGS
[0014] Those of skill in the art will understand that the drawings,
described below, are for illustrative purposes only. The drawings are not
intended to
limit the scope of the present teachings in any way.
[0015] Figure 1 depicts a series of graphs representing mRNA levels of
various cytokines in healthy subjects and in patients with EE. Expression
levels were
quantified using real-time PCR and were normalized to the housekeeping gene
glyceraldehyde 3-phosphate dehydrogenase (GAPDH) and expressed as a relative
3
CA 02824043 2013 07 05
WO 2012/094643
PCT/US2012/020556
ratio. P values were calculated by using the Mann-Whitney test: *P < .05; ***P
<
.0005.
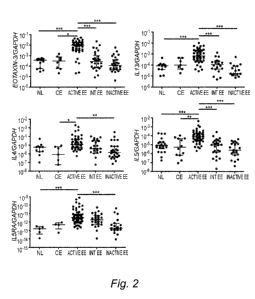
[ 0 0 1 6] Figure 2 depicts a series of graphs representing mRNA levels of
eotaxin-3, 1L5, 1L4, 1E13, and IL5RA in healthy subjects (normal [Ni]) and in
patients
with chronic esophagitis (CE) and EE; patients with EE were further subdivided
on
the basis of the maximum eosinophil number in the biopsy into active (>23
eosinophils/hpf, Active EE), intermediate (1-23 eosinophils/hpf, Int EE), and
inactive
(0 eosinophils/hpf, Inactive EE). Expression levels were quantified using real-
time
PCR and were normalized to GAPDH and expressed as a relative ratio. P values
were
calculated by using the Kruskal-Wallis test with a Dunn multiple comparison
test: *P
<.05; **P < .005; ***P < .0005.
[ 0 0 1 7 ] Figure 3 depicts a series of graphs representing expression of
eotaxin-3, 1L5, 1L4, IL13, and IL5RA in patients with active EE with and
without
allergy. Expression levels were quantified using real-time PCR and were
normalized
to GAPDH and expressed as a relative ratio. P values were calculated by using
the
Mann-Whitney test: **P < .005; ***P < .0005.
[ 0 0 1 8 ] Figure 4 depicts a series of graphs representing correlation and
linear regression between eotaxin-3, 1L5, 1L4, and 1E13. Spearman correlation
r and
P values were calculated to test correlation between the ranked cytokine
levels.
Linear regression curves are presented with the corresponding P value and r2
on the
curves to test whether the cytokine levels directly correlate with each other.
A
nonsignificant P value (NS) indicates that the slope of the curve is not
significantly
different from 0.
[ 0 0 1 9] Figure 5A depicts a series of graphs representing various plasma
cytokine levels in healthy subjects and in patients with EE. Figure 5B depicts
a series
of graphs representing various plasma cytokine levels in EE patients before
and after
therapy. The P values were calculated by using the Mann-Whitney test for
Figure 5A
and the paired t test for Figure 5B.
[ 0 0 2 0 ] Figures 6A and 6B depict a series of graphs representing various
plasma cytokine levels in healthy subjects and in patients with EE. The P
values >
.05 were calculated by using the Mann-Whitney test.
[ 0 0 2 1 1 Figures 7A-D represent various plasma cytokine levels (in pg/mL)
in healthy subjects and in patients with EE before and after therapy.
4
CA 02824043 2013 07 05
WO 2012/094643
PCT/US2012/020556
DETAILED DESCRIPTION OF THE INVENTION
All references cited herein are incorporated by reference in their entirety.
Also incorporated herein by reference in their entirety include: United States
Patent
Application No. 60/633,909, EOTAXIN-3 IN EOSINOPHILIC ESOPHAGITIS, filed
on December 27, 2004; United States Patent No. 8,030,003, DIAGNOSIS OF
EOSINOPHILIC ESOPHAGITIS BASED ON PRESENCE OF AN ELEVATED
LEVEL OF EOTAXIN-3, issued October 04, 2011 and filed as United States Patent
Application No. 11/721,127 on June 07, 2007; United States Patent Application
No.
12/492,456, EVALUATION OF EOSINOPHILIC ESOPHAGITIS, filed on June 26,
2009; United States Patent Application No. 12/628,992, IL-13 INDUCED GENE
SIGNATURE FOR EOSINOPHILIC ESOPHAGITIS, filed on December 01, 2009;
United States Patent Application No. 61/436,907, EPIGENETIC REGULATION OF
THE IL-13-INDUCED HUMAN EOTAXIN-3 GENE BY CBP-MEDIATED
HISTONE 3 ACETYLATION, filed on January 27, 2011; United States Patent
Application No. 13/051,873, METHODS AND COMPOSITIONS FOR
MITIGATING EOSINOPHILIC ESOPHAGITIS BY MODULATING LEVELS
AND ACTIVITY OF EOTAXIN-3, filed on March 18, 2011; United States Patent
Application No. 13/132,884, DETERMINATION OF EOSINOPHILIC
ESOPHAGITIS, filed on June 03, 2011; United States Patent Application No.
61/571,115, DIAGNOSTIC METHODS OF EOSINOPHILIC ESOPHAGITIS, filed
on June 21, 2011; and, United States Patent Application No. 13/132,295,
METHODS
OF DETERMINING EFFICACY OF GLUCOCORTICOID TREATMENT OF
EOSINOPHILIC ESOPHAGITIS, filed on August 22, 2011.
[0022] Unless otherwise noted, technical and scientific terms are to be
understood according to conventional usage by those of ordinary skill in the
relevant
art to which this invention belongs.
[0023] Non-invasive techniques for the diagnosis of EE, such as
biomarker detection methods, would be preferable to endoscopic techniques.
Such
non-invasive techniques are not currently used due to the low sensitivity and
specificity of available EE biomarkers.
[0024] Therapies for EE include allergen removal, steroid treatment,
dietary management, and the combination of steroid treatment and dietary
management. Other EE therapies include the use of proton pump inhibitors
(PPIs),
topical glucocorticoids, such as fluticasone or budesonide, humanized
antibodies
CA 02824043 2013 07 05
WO 2012/094643
PCT/US2012/020556
against relevant cytokines, such as eotaxin-3, IL-13, and IL-5, and small
molecule
inhibitors of an eosinophil and/or allergic disease activation pathway, such
as a
prostaglandin D2, IL-4, or IL-13 antagonist.
[0025] As disclosed herein, certain cytokines/genes can be associated with
EE, and their plasma or serum levels can be measured to provide or contribute
to an
EE diagnosis.
[0026] EE diagnosis typically requires endoscopy with biopsy analysis
because reliable, noninvasive biomarkers for EE have not yet been identified.
While
blood levels of eosinophils, eotaxin-3, eosinophil-derived neurotoxin, and IL-
5
proteins are known to be elevated in EE, their sensitivity and specificity are
generally
too low to be clinically helpful (see, e.g., Konikoff M. et at.
Gastroenterology
131:1381-91 (2006)). Although several phenotypic subsets of EE patients have
emerged, EE esophageal transcriptome analysis has revealed a highly conserved
expression profile irrespective of patient phenotype (as defined by sex,
atopic status,
and familial clustering), but the sensitivity of the EE transcriptome has not
been
determined (see, e.g., Blanchard, C. et at. J. Allergy Clin. Immunol. 118:1054-
9
(2006); Blanchard, C. and Rothenberg, M. Gastrointest. Endosc. Clin. N. Am.
18:133-
43 (2008)).
[0027] Early studies in mice have indicated that esophageal eosinophilia
occurs in TH2 inflammatory responses (see, e.g., Mishra, A. et at. J. Clin.
Invest.
107:83-90 (2001); Mishra, A. et at. J. Immunol. 168:2464-9 (2002); Mishra, A.
and
Rothenberg, M. Gastroenterology 125:1419-27 (2003)). However, the local and
systemic expression of relevant cytokines has not been well characterized, and
the
expression of TH2 cytokines in patients with EE has been reported in only a
few
studies (see, e.g., Prussin, C. et at. J. Allergy Clin. Immunol. 124:1326-32
(2009);
Straumann, A. et at. J. Allergy Clin. Immunol. 108:954-61 (2001); Schmid-
Grendelmeier, P. et at. J. Immunol. 169:1021-7 (2002); Blanchard, C. et at. J.
Clin.
Invest. 116:536-47 (2006); Blanchard, C. et at. J. Allergy Clin. Immunol.
120:1292-
300 (2007); Aceves, S. et at. J. Allergy Clin. Immunol. 119:206-12 (2007);
Gupta, S.
et at. J. Pediatr. Gastroenterol. Nutr. 42:22-6 (2006); Bullock, J. et at. J.
Pediatr.
Gastroenterol. Nutr. 45:22-31 (2007)). Characterization of gene expression
differences between patients with EE and non-EE subjects via esophageal
microarray
expression analysis has established eotaxin-3 as the most overexpressed gene
in
patients with EE; this finding has been replicated in independent studies
(see, e.g.,
6
CA 02824043 2013 07 05
WO 2012/094643
PCT/US2012/020556
Blanchard, C. et at. Int. J. Biochem. Cell Biol. 37:2559-73 (2005);
Bhattacharya, B. et
at. Hum. Pathol. 38:1744-53 (2007); Lucendo, A. et at. Am. J. Gastroenterol.
103:2184-93 (2008)).
[0028] Immunologic cytokines are often produced at levels below the
detection capabilities of genome-wide expression chips. For example, although
IL13
is not part of the initial EE transcriptome identified by microarray analysis
of
esophageal tissue (see, e.g., Blanchard, C. et at. J. Clin. Invest. 116:536-47
(2006)),
real-time PCR has been used to demonstrate that patients with EE display a 16-
fold
increase in esophageal IL13 compared with control individuals (see, e.g.,
Blanchard,
C. et at. J. Allergy Clin. Immunol. 120:1292-300 (2007)).
[0029] As described herein, the expression of a panel of potentially
relevant cytokines in esophageal biopsies from a cohort of patients with EE
and
healthy subjects was examined. Select genes associated with the cytokines
deemed to
be potentially relevant to EE were examined in a larger cohort of EE patients
and
healthy subjects.
[0030] The relationship between these cytokines and other biomarkers
associated with EE was examined, as well as the impact of clinical parameters
on the
expression of these genes. These clinical parameters include atopy, allergic
status,
and eosinophil levels.
[0031] Plasma cytokine levels were also examined for their relevance in
the diagnosis of EE, and were compared with unaffected controls with and
without
allergy. Cytokine expression levels were determined in patients with and
without EE
in the esophageal mucosa and the blood. New cytokines not previously
associated
with EE, such as IL1F9 and CCL23, have been found to be up-regulated in EE
compared with healthy patients.
[0032] Although EE diagnosis is complex, only 8.7% of active EE
samples had an eotaxin-3 level that overlapped with healthy samples using only
a
single biopsy sample per patient.
[0033] Correlations were found between mRNA levels of the TH2
cytokines IL13, IL5, and eotaxin-3, but IL4 was not found to correlate with
IL13 or
eotaxin-3 levels. The allergic status was an important confounder because IL4
and
IL5 mRNA were increased in patients with allergy and EE. Except for the
eosinophil
level, none of the clinical parameters analyzed (therapy, allergic status,
sex) was able
to explain the inter-patient variability of eotaxin-3 and IL13 levels in
patients with
7
CA 02824043 2013 07 05
WO 2012/094643
PCT/US2012/020556
active EE. The establishment of a scoring panel based on plasma levels,
including 8
cytokines, was able to predict diagnosis with 79% positive predictive value,
68%
negative predictive value, 83% specificity, and 61% sensitivity in this
population of
patients referred for endoscopy.
[ 0 0 3 4 ] Diagnostic-testing procedure performance is commonly described
by evaluating control groups to obtain four critical test characteristics,
namely
positive predictive value (PPV), negative predictive value (NPV), sensitivity,
and
specificity, which provide information regarding the effectiveness of the
test. The
PPV of a particular diagnostic test represents the proportion of subjects with
a
positive test result who are correctly diagnosed; for tests with a high PPV, a
positive
test indicates the presence of the condition in question. The NPV of a
particular
diagnostic test represents the proportion of subjects with a negative test
result who are
correctly diagnosed; for tests with a high NPV, a negative test indicates the
absence of
the condition. Sensitivity represents the proportion of correctly identified
subjects
who are actual positives; for tests with high sensitivity, a positive test
indicates the
presence of the condition in question. Specificity represents the proportion
of
correctly identified subjects who are actual negatives; for tests with high
specificity, a
negative test indicates the absence of the condition.
[ 0 0 3 5 ] As described herein, cytokine levels of nearly 300 patients were
analyzed, and the overlap among cytokine levels was assessed. Real-time PCR
was
used to demonstrate with 89% sensitivity that eotaxin-3 mRNA expression in
patients
with EE is increased compared with control patients. Previous histopathologic
studies
indicate that a minimum of 5 biopsies are required to achieve 100% sensitivity
for
diagnosis of EE, with a single biopsy only achieving 55% sensitivity (see,
e.g., Shah,
A. et at. Am. J. Gastroenterol. 104:716-21 (2009); Gonsalves, N. et at.
Gastrointest.
Endosc. 64:313-9 (2006)). As further described herein, results were obtained
by
using only a single RNA sample per patient, indicating that molecular
diagnosis can
be useful for disease diagnosis.
[ 0 0 3 6] As described herein, cytokine correlations reveal the concerted
expression of 1L13, 1L5, and 1L4 mRNA and indicate expression in the same cell
type,
such as a TH2 cell producing IL-13 and IL-5. IL-13 has been shown to
specifically
induce eotaxin-3 in esophageal epithelial cells (see, e.g., Blanchard, C. et
at. J.
Allergy Clin. Immunol. 120:1292-300 (2007)), and a recent study (Prussin, C.
et at. J.
Allergy Clin. Immunol. 124:1326-32 (2009)) has emphasized the presence of
unique
8
CA 02824043 2013 07 05
WO 2012/094643
PCT/US2012/020556
food antigen-specific, IL-5-positive TH2 cells in patients with eosinophil-
associated
gastrointestinal disorders compared with patients with food anaphylaxis. The
implications of IL-5 and IL-13 in EE have also been demonstrated in murine EE
models (see, e.g., Mishra, A. et at. J. Clin. Invest. 107:83-90 (2001);
Mishra, A. et at.
J. Immunol. 168:2464-9 (2002); Mishra, A. and Rothenberg, M. Gastroenterology
125:1419-27 (2003)). Although IL5RA mRNA was up-regulated in patients with
active EE, its low expression level can explain why it did not correlate with
eosinophil levels. IL4 and IL5 are dysregulated in patients with allergy and
EE
compared with patients without allergy with EE, and these increases can
reflect the
systemic allergic history of the patients rather than the local activity of
the disease as
reflected by eotaxin-3 and IL-13 expression levels.
[0037] A recent study (Yamazaki et at. Dig. Dis. Sci. 51:1934-41 (2006))
has shown that common food and environmental allergens induce increased
production of IL-13 and IL-5 by PBMCs after stimulation with aeroallergens or
food
allergens in patients with EE compared with healthy individuals. As described
herein,
in the study of patients referred for endoscopy, the establishment of a plasma
scoring
panel including 8 cytokines was able to predict diagnosis of EE with 79%
positive
predictive value, 68% negative predictive value, 83% specificity, and 61%
sensitivity.
[0038] As described herein, although evidencing relatively high scores,
these results also indicate that patients with an allergic history, who are
challenging to
diagnose, can result in false-positive occurrences. In addition, the positive
predictive
value is reflective of the study population (potential patients with EE) that
was
composed of about 50% non-EE and 50% EE in the cohort. In the general
population,
where the prevalence of EE is lower, the positive predictive value would thus
be
lowered. Although the cytokine dysregulation was not reproduced in the
prospective
study, specificity and sensitivity were relatively high because of the high
threshold
levels chosen, which were set above the maximum level observed in the non-EE
group.
[0039] The potential roles of the cytokines that were significantly
modified in EE compared with healthy subjects is of interest. For example,
CXCL14
down-regulation has also been shown in squamous head and neck cancer and has
an
anti-proliferative role on epithelial cells. The specific epithelial growth
factor
receptor tyrosine kinase inhibitor, which restores CXCL14 expression in head
and
neck squamous cell carcinoma (see, e.g., Ozawa, S. et at. Biomed. Res. 30:315-
8
9
CA 02824043 2013 07 05
WO 2012/094643
PCT/US2012/020556
(2009); Ozawa, S. et at. Cancer Sci. 100:2202-9 (2009)), can contribute to a
decrease
in esophageal epithelial cell proliferation in patients with EE. In contrast,
CCL23
mRNA is increased in EE and has been shown to be induced after signal
transducer
and activator of transcription (STAT) 6 activation (see, e.g., Novak, H. et
at. J.
Immunol. 178:4335-41 (2007)): CCL23 is involved in endothelial cell
proliferation, a
feature that can contribute to the papillae elongation observed in EE.
Dysregulation
of novel cytokines and receptors in EE has also been identified. Marked
changes in
IL-1 family-related molecules have been noted with up-regulation of /LIB and
IL-1-
related family member 6 and down-regulation of the inhibitory receptor (IL1RA)
and
IL-1-related family member 9. Thus, EE can involve coordinate pro-inflammatory
signals triggered by IL-1-related molecules, indicating the importance of post-
IL-1
receptor signaling (such as nuclear factor-KB). The EE transcriptome has
evidence
for activation of this pathway via overexpression of IL8, monocyte chemotactic
protein-2, and TNF-alpha induced protein 6 (see, e.g., Blanchard, C. et at. J.
Clin.
Invest. 116:536-47 (2006)).
[0040] As described herein, the molecular pathogenesis of EE has been
explored by identifying esophageal over-expression of a panel of chemokines
and
cytokines in addition to the previously reported IL13 and eotaxin-3. Although
the
screening array encoded 84 relevant mRNAs, only approximately 20% were
dysregulated in EE. A strong correlation was identified among IL13, IL5, and
eotaxin-3 but not IL4 mRNA levels, consistent with the presence of an IL-13-
producing TH2 cell population. Using molecular analysis of only eotaxin-3 in a
large
cohort of patients, approximately 90% sensitivity for diagnosis was obtained.
Furthermore, blood levels of the core panel of 8 cytokines reached moderate
specificity and sensitivity regardless of the global increase of these
cytokines in the
different groups of patients. However, atopy was a confounder for systemic
cytokine
levels. IL13 and IL5 associate with eosinophil and eotaxin-3 levels,
indicating the key
role of adaptive TH2 immunity in regulating eotaxin-3-driven esophageal
eosinophilia
in the absence of a consistent systemic change in cytokines.
[0041] The clinical value includes the finding that the pathogenesis of EE
involves a dysregulated local cytokine network in the esophageal mucosa and
elevated eotaxin-3 expression (89% sensitivity in a single biopsy) in the
absence of
consistent systemic changes in cytokines.
CA 02824043 2013 07 05
WO 2012/094643
PCT/US2012/020556
[ 0042] Certain embodiments of the invention include using quantification
data from a gene-expression analysis and/or from a cytokine analysis, either
from an
esophageal biopsy sample or from a sample of esophageal mucosa or from a blood
sample. Embodiments of the invention include not only methods of conducting
and
interpreting such tests but also include reagents, kits, assays, and the like,
for
conducting the tests.
[0043] The correlations disclosed herein, between EE and cytokine levels
and/or mRNA levels, provide a basis for conducting a diagnosis of EE, or for
enhancing the reliability of a diagnosis of EE by combining the results of a
quantification of cytokine or mRNA with results from other tests or indicia of
EE.
Thus, even in situations in which a given cytokine or mRNA correlates only
moderately or weakly with EE, providing only a relatively small PPV, NPV,
specificity, and/or sensitivity, the correlation can be one indicium,
combinable with
one or more others that, in combination, provide an enhanced clarity and
certainty of
diagnosis. Accordingly, the methods and materials of the invention are
expressly
contemplated to be used both alone and in combination with other tests and
indicia,
whether quantitative or qualitative in nature.
[0044] The disclosure, figures, and tables herein make mention of
statistical significance and "p values." While p values below 0.05 are
considered to
be statistically significant, it is within the scope of embodiments of the
present
invention to make use of correlations having a reported p value above 0.05 as
well as
below 0.05. For example, in a study having a small sample size but a genuine
correlation, a p value can be above 0.05, such as, for example, 0.06, 0.07,
0.08, 0.09,
0.10, 0.15, or more. Since p value is affected by sample size, two studies can
have the
same proportion of outcomes, and a study with a smaller sample size can have a
p
value above 0.05, while the study with the larger sample size can have a p
value
below 0.05, even though the correlation is proportionally the same. Thus,
while a p
value below 0.05, for any sample size, is a strong indication of a
statistically
significant correlation, a genuine correlation can exist, that is tested with
a small
sample size, and the p value of such a test can be above 0.05.
[0045] The illustrative embodiments described in the detailed description,
drawings, and claims are not meant to be limiting. Having described the
invention in
detail, it will be apparent that modifications, variations, and equivalent
embodiments
11
CA 02824043 2013 07 05
WO 2012/094643
PCT/US2012/020556
are possible without departing from the spirit or scope of the subject matter
presented
herein.
EXAMPLES
[0046] The following non-limiting examples are provided to further
illustrate embodiments of the invention disclosed herein. It should be
appreciated by
those of skill in the art that the techniques disclosed in the examples that
follow
represent approaches that have been found to function well in the practice of
the
invention, and thus can be considered to constitute examples of modes for its
practice.
However, those of skill in the art should, in light of the present disclosure,
appreciate
that many changes can be made in the specific embodiments that are disclosed
and
still obtain a like or similar result without departing from the spirit and
scope of the
invention.
EXAMPLE 1
COMPARISON OF BLOOD CYTOKINE LEVELS BETWEEN HEALTHY
SUBJECTS AND EE PATIENTS
Comparison of Healthy Subjects and EE Patients
[0047] A study was undertaken on patients referred for endoscopy to
determine the levels of various cytokines in their serum. Patients with no
histologic
findings in the gastrointestinal tract and who presented with a healthy
esophagus with
no histological abnormality were defined as healthy.
[0048] Patients were classified into discovery and replication cohorts and
were studied to determine their expression levels of relevant RNA. The
discovery
cohort was composed of 5 healthy subjects and 5 untreated patients with EE.
The
replication cohort was composed of 11 healthy subjects and 11 patients with EE
who
had not received steroid treatment.
[0049] Patients diagnosed with GERD or CE were regrouped in the CE
group. A proportion (47%) of the 226 patients with EE was treated with a
proton
pump inhibitor (PPI) at the time of the endoscopy. Of the patients who did not
receive PPI treatment at the time of the endoscopy (n = 120), the patients
either did
not respond to a treatment including PPI (13%), or the patients did respond to
steroids
alone (11%), diet management alone (39%), or the combination of the steroids
and
12
CA 02824043 2013 07 05
WO 2012/094643
PCT/US2012/020556
diet management (33%) in a later endoscopy. No information was available for 5
patients.
[ 0 0 5 0] Plasma from the blood of those without EE (including healthy
subjects and patients with GERD or CE) and patients with EE was used to
quantify
cytokines in three cohorts: (1) a learning set (n = 25) composed of 12 healthy
subjects
and 13 patients with EE; (2) a before-and-after treatment set (n = 5) composed
of
patients with EE; and (3) a prospectively recruited blind set of patients
referred for
endoscopy composed of patients without EE and with active EE and excluding
treated
and partially treated patients with EE (n = 36). For research purposes, active
EE was
defined as patients having >24 eosinophils/hpf in at least 1 hpf.
[ 0 0 5 1 1 Blood samples were collected in heparinized tubes and centrifuged
(3000 rpm) for 10 minutes at 4 C; plasma was stored at -70 C until further
use. The
allergic status was defined as having present or past history of allergic
diseases and/or
at least 1 positive skin prick test. Biopsy and blood samples were collected
during
routine endoscopy or blood draw after informed consent as approved by the
institutional review board.
RNA Extraction and Real-Time PCR Analysis
[0052] Total RNA from biopsy samples were stored in RNALater
(Qiagen, Valencia, Calif.), then were extracted by using the Qiagen mini RNA
extraction kit (Qiagen), and reverse transcription was performed by using
Iscript (Bio-
Rad, Hercules, Calif.). The reactions for each set of samples were done at
different
times and produced different yields, leading to variations in the detection
limits of the
different data sets. Real-time PCR was performed by rapid cycling using the
ready-
to-use IQ5 SYBR mix (Bio-Rad) according to the manufacturer's instructions.
PCR
products were sequenced at the Cincinnati Children's Hospital Medical Center
sequencing core facility.
[0053] The PAHS-011 Human Inflammatory Cytokine and Receptor
Array (SABiosciences, Frederick, Md) was used in 5 healthy subjects and 5
patients
with EE by interrogating the following: chemokine genes (component of
complement
(C5), CCL1 [1-309], CCL11 [eotaxin], CCL13 [macrophage chemoattractant protein
(MCP-4)], CCL15 [macrophage inflammatory protein (MIP-1d)], CCL16 [human CC
chemokine (HCC-4)], CCL1 7 [TARC], CCL18 [pulmonary and activation-regulated
chemokine (PARC)] , CCL19, CCL2 [MCP-1], CCL20 [MIP-3 a], CCL21 [MIP -2] ,
13
CA 02824043 2013 07 05
WO 2012/094643
PCT/US2012/020556
CCL23 [myeloid progenitor inhibitory factor 1 (MPIF-1)], CCL24 [MPIF-2/eotaxin-
2], CCL25 [thymus-expressed chemokine TECK)], CCL26 [eotaxin-3], CCL3 [MIP-
1 a], CCL4 [MIP-113], CCL5 [regulated on activation normal T cell expressed
and
secreted (RANTES)], CCL7 [MCP-3], CCL8 [MCP-2], CXCL1, CXCL10 [IP-10],
CXCL11 [interferon-inducible T cell (I-TAC)/interferon gamma-induced protein
10
kDa (IP-9)], CXCL 12 [stromal cell-derived factor-1 (SDF1)], CXCL 13, CXCL 14,
CXCL2, CXCL3, CXCL5 [epithelial neutrophil-activating protein ENA-78)/LPS-
induced CXC chemokine (LIX)], CXCL6 [granulocyte chemotactic protein-2 GCP-
2)], CXCL9, and IL8), chemokine receptor genes (CCL13 [MCP-4], CCR1, CCR2,
CCR3, CCR4, CCR5, CCR6, CCR7, CCR8, CCR9, CX3CR1, IL8RA, and XCR1
[CCXCR1]), cytokine genes (CD4OLigand [TNF ligand superfamily member 5
(TNFSF5)], IFNA2, IL10, IL13, IL17C, ILIA, IL1B, IL1F10, IL1F5, IL1F6, IL1F7,
IL1F8, IL1F9, IL22, IL5, IL9, LTA, LTB, MIF, small cytokine El (SCYE1),
secreted
phosphoprotein 1(SPP1), and TNF), cytokine receptor genes (IL1ORA, IL1ORB,
IL13RA, IL13RA1, IL5RA, and IL9R), and other genes involved in inflammatory
responses (ABCF1, BCL6, C3, C4A, CCAAT/enhancer-binding protein beta
(CEBPB), C-reactive protein (CRP), ICEBERG, IL1R1, IL1RN, IL8RB, leukotriene
B4 Receptor (LTB4R), and Toll-interacting protein TOLLIP)). Results were
analyzed
by using the web-based software found at http <colon slash slash> www <dot>
sabiosciences <dot> com <slash> per <slash> arrayanalysis <dot> php.
Multiplex Analysis for Quantification of Blood Cytokine Levels
[0054] The 29-plex Lincoplex human cytokine kit (Millipore, Billerica,
Mass.) was used to quantify serum levels of the following cytokines: IL-113,
IL-2, IL-
1Ra, IL-4, IL-5, EGF, IL-6, IL-7, IL-8, IL-10, TGF-a, fractalkine, IL-12p70,
IL-13,
IL-15, IL-17, IL-la, IFN-y, granulocyte colony-stimulating factor (G-CSF),
granulocyte-macrophage colony-stimulating factor (GM-CSF), TNF-a, eotaxin-1,
MCP-1, CD4OL, IL-12p40, MIP-la, MIP-113, IP-10, and VEGF. Samples were run in
duplicate for the learning set and the before-and-after treatment set.
[0055] Lower and upper detection limits were 3.2 pg/mL and 10,000
pg/mL, respectively. Data with levels lower than 3.2 pg/mL were adjusted to
3.2
pg/mL, and data with values higher than 10,000 pg/mL were adjusted to 10,000
pg/mL.
14
CA 02824043 2013 07 05
WO 2012/094643
PCT/US2012/020556
[0056] For the prospectively recruited blind set of patients, patients were
collected prospectively, and the investigator was unblinded only at the end of
the
analysis. These samples were subjected to the 39-plex Milliplex human cytokine
panel (Millipore), including fibroblast growth factor (FGF-2), FMS-like
tyrosine
kinase 3 receptor ligand (FLT-3L), GRO, IFN-a2, IL-3, IL-9, MCP-3, macrophage-
derived chemokine (MDC), sIL-2Ra, and TNF-I3 in addition to the 29-plex.
Samples
run in the first analysis were incorporated in the second quantification to
check for
reproducibility. All cytokines tested were no more than 18% different between
the
two runs except for CD4OL, which was decreased by 45% in the third set.
[0057] A scoring system based on a panel of cytokines was established,
adding 1 to a patient's score for each up-regulation or down-regulation of
specific
cytokines. Cytokine up-regulation was indicated for cytokine values higher
than the
maximum value observed in the healthy subjects for the following cytokine
levels,
measured in pg/mL: IL-la > 753; IL-4 > 967; IL-5 > 7; IL-6 > 155; IL-13 > 281.
Cytokine down-regulation was indicated for cytokine values lower than the
minimum
value observed in healthy subjects for the following cytokine level, measured
in
pg/mL: CD4OL <2986. Cytokine down-regulation was also indicated for cytokine
values lower than the average observed in healthy subjects when at least 1
healthy
subject was below the detection limit for the following cytokine levels,
measured in
pg/mL: IL-12p70 <24; IL-17 < 15; see Figures 7A-D. Patients with a score of 3
or
more were classified as having EE with 100% sensitivity and 100% specificity;
see
Table 1.
TABLE 1. Establishment of the retrospective scoring panel
(heterodimer)
0
SEQ ID SEQ ID SEQ ID SEQ ID SEQ ID SEQ ID SEQ ID SEQ
ID t..)
o
Threshold NO 1 NO 2 NO 3 NOs 4 and 5 NO 6
NO 7 NO 8 NO 9
t..)
cytokine IL-4 IL-5 IL-6 IL-12p70 IL-13
IL-17 IL-la CD4OL O-
,o
.6.
levels Patient >966.76 >6.53 >155.38
<24.09 >280.72 <15.12 >752.71 <2986.16 Score .12,
Non-EE 1 0 0 0 0 0
0 0 0 0
Non-EE 2 0 0 0 1 0
1 0 0 2
Non-EE 3 0 0 0 1 0
1 0 0 2
Non-EE 4 0 0 0 1 0
1 0 0 2
Non-EE 5 0 0 0 0 0
1 0 0 1
Non-EE 6 0 0 0 0 0
0 0 0 0
Non-EE 7 0 0 0 0 0
0 0 0 0
Non-EE 8 0 0 0 1 0
1 0 0 2
Non-EE 9 0 0 0 0 0
1 0 0 1
Non-EE 10 0 0 0 1 0
1 0 0 2
1
Non-EE 11 0 0 0 1 0
1 0 0 2
g
Non-EE 12 0 0 0 1 0
0 0 0 1 FT '
EE 13 1 1 1 1 1
1 1 0 7
EE 14 1 1 1 1 1
1 1 1 8
EE 15 1 1 1 1 1
1 1 1 8
EE 16 0 0 0 1 0
1 0 1 3
EE 17 1 1 1 1 1
1 1 1 8
EE 18 1 1 1 0 1
1 1 0 6
EE 19 1 1 1 1 1
1 0 0 6
EE 20 0 0 0 1 0
1 0 1 3 1-d
n
EE 21 1 0 1 1 0
1 0 1 5
EE 22 1 1 1 1 1
1 1 1 8 cp
t..)
EE 23 0 0 0 1 0
1 0 1 3 o
,-,
t..)
EE 24 1 1 1 1 1
1 1 0 7 O-
t..)
EE 25 0 0 0 1 0
1 0 1 3 a
u,
16
DWT 18674025v5 0088544-011W00
CA 02824043 2013 07 05
WO 2012/094643
PCT/US2012/020556
Statistical Analysis
[0058] Statistical analysis was performed on the results, with data
expressed as mean +/- SD. Statistical significance comparing different
treatments or
groups was determined by the Student t test (normal distribution, equal
variance), the
Welch t test (normal distribution, unequal variances), the Mann-Whitney test
(non-
parametric test, 2 groups), the Kruskal-Wallis test followed by a Dunn
multiple
comparison test (non-parametric test, 3 groups or more), or a paired t test
(for
quantification of cytokines before and after therapy in the same patients)
using Prism
4 GraphPad Software (Palo Alto, CA). Non-parametric (ranked) correlations were
calculated using Spearman correlations. Linear regressions were then
calculated, and
P values were assessed to test the hypothesis that a linear correlation exists
with a
slope different from 0.
EXAMPLE 2
EXPRESSION OF CYTOKINE AND CYTOKINE-RECEPTOR mRNA IN
ESOPHAGEAL BIOPSIES FROM HEALTHY SUBJECTS AND PATIENTS WITH
EE
[0059] In the same study, the Human Inflammatory Cytokine & Receptor
PCR Array (SABiosciences) was used to quantify the expression levels of 84 key
genes involved in the inflammatory response in esophageal biopsies from a
discovery
cohort with 5 representative patients with EE and 5 representative healthy
control
subjects (Table 2). Of the 84 genes present on the array, the expression of 21
genes
was modified by more than 4-fold in EE compared with healthy patient biopsies;
of
these 21 genes, 19 genes were up-regulated, and 2 genes were down-regulated.
One
gene was significantly down-regulated but not modified by more than 4-fold
(Table
2). The up-regulated genes included eotaxin-3 (69-fold expression increase);
ATP-
binding cassette, subfamily F, member 1 (18-fold); chemokine (C-X-C motif)
ligand 1
(growth-regulated protein alpha [GROA]; 16-fold); chemokine (C-C motif) ligand
23
(macrophage inflammatory protein 3) and IL1B (7-fold each); IL1F9 (6-fold);
CD4OL, CXCL2, CCR5, and CXCL3 (5-fold each); and IL5RA, CCL1, CCL20,
BCL6, and IL17C (4-fold each). The down-regulated genes were chemokine (C-X-C
motif) ligand 14 (breast and kidney-expressed chemokine [BRAK]; 9-fold); IL-1
family, member 6 (IL1F6; 4-fold); and IL-1 receptor antagonist (IL1RN; 2-
fold).
17
CA 02824043 2013 07 05
WO 2012/094643
PCT/US2012/020556
While eotaxin-3, IL8, CXCL1, and IL1B have been found to be up-regulated in
previous studies by using microarray analysis, the present study has
demonstrated
dysregulation of several other genes that were not previously suspected (Table
2).
[0060] Although increased by more than 4-fold, few genes reached
significance, likely due to the sample size (healthy subjects, n = 5; EE, n =
5). Most
gene expression levels were confirmed by real-time PCR and reached
significance in
a replication cohort with a larger sample size (healthy subjects, n = 11; EE,
n = 11).
In the replication cohort, the differential expression of most of the genes
identified in
the discovery cohort was substantiated, including IL1B, IL1RN, IL5RA, and CCL1
(Table 2; Figure 1).
18
TABLE 2. Cytokines with a greater than 4-fold change in expression in EE
compared with control group or with a P value <.05
Discovery cohort Replication cohort
0
PCR array* real-time PCRt
t..)
o
SEQ ID NO Symbol Fold change P value Fold change P value Description
t..)
O-
CCL26 70 .0012 67 <.0001 Chemokine (C-C motif) ligand
26 (eotaxin-3) ,.tD
.6.
11 ABCF1 18 .30 5.8 <.0001 ATP-binding
cassette, subfamily F, member 1
.6.
12 CXCL1 16 .018 16 .001 Chemokine (C-X-
C motif) ligand 1 (GRO-a)
13 CCL23 7.3 .19 7.2 .0003 Chemokine (C-C
motif) ligand 23 (MIP-3)
14 IL1B 7.3 .07 5.5 .0001 IL-113
IL8 6.8 .10 5.8 .008 IL-8
16 CCL8 6.5 .24 5.4 .052 Chemokine (C-C
motif) ligand 8 (MCP-2)
17 IL1F9 6.3 .086 3.1I .38 IL-1 family,
member 9
18 CD4OLG 5.8 .23 ND ND CD40 ligand
19 CXCL2 5.6 .24 19 .0002 Chemokine (C-X-
C motif) ligand 2 (GRO-B, MIP-2)
CXCL3 5.5 .34 ND ND Chemokine (C-X-C motif)
ligand 3 (GRO-y, MIP-2b)
21 CCR5 5.2 .40 ND ND Chemokine (C-C
motif) receptor 5 1
22 IL5RA 4.9 .36 >49 .0001 IL-5 receptor,
a
g
23 CCL1 4.8 .36 5.3 .001 Chemokine (C-C
motif) ligand 1 (TCA3) FT '
24 IL9 4.8 .38 5.6I .76 IL-9
IL17C 4.7 .24 ND I ND IL-17C (CX2)
26 BCL6 4.5 .17 3.6 .013 B-cell
CLL/lymphoma 6
27 1L13 4.2 .36 16 <.0001 IL-13
28 CCL20 4.0 .25 6.0 .043 Chemokine (C-C
motif) ligand 20 (MIP-3a)
29 IL1RN -2.7 .011 -4.0 .0002 IL-1 receptor
antagonist (IL-1Ra)
IL1F6 -4.5 .067 -9.9 .0001 IL-1 family, member 6 (IL-
1c)
31 CXCL14 -9.3 .063 -5.7 .003 Chemokine (C-X-
C motif) ligand 14 (BRAK) 1-d
n
,-i
*Discovery cohort, n = 5 healthy and n = 5 EE.
1-Replication cohort, n = 11 healthy and n = 11 EE.
cp
t..)
o
ILevels were undetectable in several patients in both groups.
t..)
Not done or not reproducible.
O-
t..)
o
It Levels were not detectable in several healthy patients.
u,
u,
19
DWT 18674025v5 0088544-011W00
CA 02824043 2013 07 05
WO 2012/094643
PCT/US2012/020556
EXAMPLE 3
CYTOKINE AND CYTOKINE RECEPTOR mRNA EXPRESSION IN
ESOPHAGEAL BIOPSIES FROM HEALTHY SUBJECTS AND PATIENTS WITH
EE AS A FUNCTION OF THE ACTIVITY OF THE DISEASE
[0061] The mRNA levels of the most up-regulated cytokine (IL13),
chemokine (eotaxin-3), and receptor (IL5RA and its ligand IL5) were tested to
determine their variability with the degree of activity and within patient
groups by
using real-time PCR on a large cohort of patients (n = 288). The large cohort
was
composed of healthy subjects and patients who collectively had 288 biopsies
collected
over 3 years (EE, n = 226; healthy, n = 14; GERD or CE, n = 14, with mean,
6.4,
median, 4.5, range, 1-16 eosinophils/hpf; missing or other diagnosis, n = 34,
were not
included in the study). Patients with EE were classified on the basis of their
number
of eosinophils per hpf (in at least 1 hpf), when available, into active (>24
eosinophils/hpf, n = 97), intermediate (1-23 eosinophils/hpf, n = 49), or
inactive (0
eosinophils, n = 52) EE. Patients who had received steroid treatment and/or
dietary
management were included in these groups.
[0062] Eotaxin-3 mRNA was the most robust gene overexpressed in
patients with active EE (median, 9.7x10⁻³; 25-75 interquartile, 3.3x10⁻³-
1.7x10⁻²; see
Tables 3A-C) compared with healthy controls (median, 3.7x10⁻⁴; 25-75
interquartile,
6.1x10⁻⁵-4.6x10⁻⁴; P < .005). In this population, only 5 patients with EE had
an
eotaxin-3 expression level that overlapped with healthy levels, indicating 89%
sensitivity. The activity of the disease was an important factor because
patients with
partially treated (intermediate) EE, with an intermediate level of eosinophils
(1-23
eosinophils/hpf; median, 2.8x10⁻⁴; 25-75 interquartile, 7.2x10⁻⁵-1.0x10⁻³),
and
patients with successfully treated (inactive) EE, with no esophageal
eosinophils (0
eosinophils/hpf; median, 1.1x10⁴; 25-75 interquartile, 4 .8x10-5-4 .1x10-4),
did not
have significant eotaxin-3 level increases compared with the healthy group.
IL13 was
significantly up-regulated in active EE compared with healthy subjects
(median,
6 .7x10-4; 25-75 interquartile, 2 .5x10-4-2 .2x10-3 vs median, 8 .3x10-5; 25-
75
interquartile, 4.0x10⁻⁵-1.2x10⁻⁴, with 19.5% overlap). Similar to eotaxin-3,
IL13
levels in intermediate (median, 1 .1x10-4; 25-75 interquartile, 4 .3 x10-5-2
.2x10-4) and
inactive EE (median, 1.6x10⁻⁵; 25-75 interquartile, 1.0x10⁻⁵-8.2x10⁻⁵) were
not
significantly different from healthy levels (Figure 2). The IL5RA mRNA
expression
CA 02824043 2013 07 05
WO 2012/094643
PCT/US2012/020556
level was significantly up-regulated in patients with active EE compared with
healthy
controls or patients with inactive EE (Figure 2). Notably, IL5RA mRNA
expression
was not detectable in 64% of healthy patients tested, 50% of patients with
inactive
EE, 33% of patients with intermediate EE, and 22% of patients with active EE.
The
expression of its ligand, 1L5, followed the same trend: 1L5 mRNA was
significantly
increased in patients with active EE versus healthy patients and was lower in
patients
with intermediate and inactive EE compared with patients with active EE
(Figure 2).
[0063] As a control, 1L4 mRNA expression showed no significant
differences in patients with active EE compared with healthy subjects overall.
However, 1L4 mRNA levels were significantly decreased by therapies such as
glucocorticoids or allergen removal (Figure 2). In addition, 1L2 mRNA was not
modified in patients with active EE compared with healthy patients. No
significant
correlation between eotaxin-3 expression and eosinophil number was observed in
the
partially treated EE patient group. Only 4 patients with intermediate EE, with
5-15
eosinophils/hpf, had eotaxin-3 expression levels that reached the lower
interquartile of
eotaxin-3 expression in patients with active EE. No significant difference was
observed between the healthy and CE groups for 1E13, eotaxin-3, IL5RA, 1L5,
and IL-
4 (Figure 2), and sensitivity to distinguish CE from EE was similar to that of
healthy
subjects from EE patients (89%).
21
TABLE 3A. Cytokine mRNA levels
0
Eotaxin-3 EE Healthy Active EE Intermediate EE Inactive EE Nonallergic
Allergic CE t..)
o
,-,
Minimum 3.0E-05 0.0E+00 0.0E+00 4.2E-06
3.3E-04 2.5E-04 2.1E-05 t..)
O-
25% Percentile 6.1E-05 3.3E-03 7.2E-05 4.8E-05 3.0E-03
8.3E-03 5.9E-05 ,.tD
.6.
Median 3.7E-04 9.8E-03 2.8E-04 1.1E-04
5.8E-03 1.3E-02 3.1E-04 .6.
75% Percentile 4.6E-04 1.8E-02 1.0E-03 4.1E-04 1.4E-02
2.3E-02 7.7E-04
Maximum 5.9E-04 5.2E-02 2.3E-02 5.9E-03
2.0E-02 4.4E-02 1.4E-03
Mean 3.1E-04 1.3E-02 1.9E-03 5.6E-04
8.3E-03 1.6E-02 4.5E-04
SD 1.9E-04 1.2E-02 4.6E-03 1.2E-03
6.8E-03 1.2E-02 4.9E-04
SE 5.2E-05 1.8E-03 8.5E-04 2.3E-04
2.2E-03 2.3E-03 1.7E-04
Lower 95% CI of mean 2.0E-04 9.0E-03 1.5E-04 8.2E-05 3.4E-03
1.1E-02 4.3E-05
Upper 95% CI of mean 4.2E-04 1.6E-02 3.6E-03 1.0E-03 1.3E-02
2.1E-02 8.6E-04
Sum 4.3E-03 5.9E-01 5.6E-02 1.5E-02
8.3E-02 4.2E-01 3.6E-03
1L4 Healthy Active EE Intermediate EE Inactive EE Nonallergic
Allergic CE
Minimum 1.0E-07 0.0E+00 0.0E+00 7.0E-08
5.5E-07 2.0E-06 7.4E-09 1
''.
25% Percentile 1.8E-06 4.9E-06 1.1E-06 4.4E-07 3.7E-06
6.0E-06 5.4E-08 h'
8
Median 5.8E-06 1.2E-05 3.9E-06 1.5E-06
4.8E-06 2.2E-05 8.2E-07
75% Percentile 7.3E-06 4.6E-05 3.0E-05 7.3E-06 6.0E-06
9.8E-05 6.4E-06
Maximum 5.4E-05 2.0E-03 1.0E-04 3.1E-04
4.5E-05 2.0E-03 9.0E-06
Mean 8.8E-06 1.1E-04 1.8E-05 2.1E-05
8.8E-06 1.8E-04 3.0E-06
SD 1.5E-05 3.4E-04 2.7E-05 6.2E-05
1.2E-05 4.4E-04 3.6E-06
SE 4.7E-06 4.9E-05 5.3E-06 1.2E-05
3.6E-06 8.2E-05 1.4E-06
Lower 95% CI of mean -1.5E-06 1.1E-05 7.6E-06 -3.5E-06 8.7E-07
8.3E-06 -4.0E-07
Upper 95% CI of mean 1.9E-05 2.1E-04 2.9E-05 4.6E-05 1.7E-05
3.5E-04 6.3E-06 1-d
Sum 9.7E-05 5.3E-03 5.0E-04 5.7E-04
1.1E-04 5.0E-03 2.1E-05 n
cp
t..)
=
,-,
t..)
'a
t..)
=
u,
u,
22
C
TABLE 3B. Cytokine mRNA levels
t..)
o
,-,
1L5 Healthy Active EE Intermediate EE Inactive EE Nonallergic
Allergic CE t..)
Minimum 1.7E-07 1.7E-07 2.1E-06 2.0E-08 4.2E-08
2.9E-06 0.0E+00 8.8E-08 ,.tD
.6.
25% Percentile 3.7E-06 2.4E-05 1.4E-06 7.5E-07 8.4E-06
2.9E-05 6.7E-07 .6.
Median 7.7E-06 7.6E-05 9.7E-06 2.5E-06
3.3E-05 1.2E-04 5.2E-06
75% Percentile 2.0E-05 2.0E-04 2.6E-05 1.5E-05 8.7E-05
3.1E-04 5.0E-05
Maximum 1.9E-04 4.4E-03 2.7E-04 4.2E-05
1.2E-04 4.4E-03 1.1E-04
Mean 3.2E-05 2.5E-04 2.6E-05 8.9E-06
4.6E-05 3.0E-04 2.6E-05
SD 5.9E-05 6.8E-04 5.5E-05 1.2E-05
4.2E-05 7.0E-04 3.5E-05
SE 1.3E-05 1.0E-04 1.1E-05 2.5E-06
1.2E-05 1.1E-04 1.0E-05
Lower 95% CI of mean 5.9E-06 5.1E-05 3.1E-06 3.7E-06 2.0E-05
8.6E-05 4.2E-06
Upper 95% CI of mean 5.8E-05 4.6E-04 4.8E-05 1.4E-05 7.1E-05
5.2E-04 4.9E-05
Sum 7.1E-04 1.2E-02 6.4E-04 1.9E-04
6.0E-04 1.3E-02 3.2E-04
1L13 Healthy Active EE Intermediate EE Inactive EE Nonallergic
Allergic CE 1
''.
Minimum 1.0E-05 2.8E-05 4.9E-06 0.0E100
8.4E-05 0.0E+00 1.8E-05 h'
8
25% Percentile 4.0E-05 2.5E-04 4.3E-05 1.0E-05 2.4E-04
2.5E-04 4.3E-05
Median 8.3E-05 6.7E-04 1.1E-04 1.6E-05
5.1E-04 6.7E-04 9.8E-05
75% Percentile 1.2E-04 2.2E-03 2.2E-04 8.2E-05 1.2E-03
2.2E-03 4.4E-04
Maximum 4.4E-04 1.0E-02 1.3E-03 5.5E-04
1.9E-03 1.0E-02 4.5E-04
Mean 1.0E-04 1.5E-03 2.1E-04 6.9E-05
7.1E-04 1.5E-03 1.9E-04
SD 1.2E-04 2.0E-03 3.2E-04 1.3E-04
5.8E-04 2.1E-03 1.8E-04
SE 3.6E-05 3.1E-04 7.1E-05 3.2E-05
1.9E-04 4.2E-04 7.0E-05
Lower 95% CI of mean 2.3E-05 9.1E-04 6.7E-05 2.5E-06 2.6E-04
6.1E-04 2.0E-05 1-d
Upper 95% CI of mean 1.8E-04 2.2E-03 3.6E-04 1.4E-04 1.2E-03
2.3E-03 3.6E-04 n
1-i
Sum 1.1E-03 6.4E-02 4.3E-03 1.2E-03
6.4E-03 3.8E-03 1.3E-03
cp
t..)
o
,-,
t..)
O-
t..)
o
u,
u,
23
C
TABLE 3C. Cytokine mRNA levels
t..)
o
,-,
IL5RA Healthy Active EE Intermediate EE Inactive EE Nonallergic
Allergic CE t..)
Minimum 1.2E-14 1.2E-14 1.7E-13 3.2E-18
8.8E-15 1.7E-13 2.3E-13 5.4E-14 ,o
.6.
o,
25% Percentile 3.8E-14 1.1E-12 4.8E-13 1.2E-13 1.1E-12
8.9E-13 1.5E-13 .6.
Median 1.6E-13 3.5E-12 1.8E-12 1.9E-13
1.8E-12 2.9E-12 4.7E-13
75% Percentile 2.8E-13 8.5E-12 5.6E-12 6.8E-13 5.4E-12
8.0E-12 7.9E-13
Maximum 3.0E-13 7.7E-10 5.0E-11 4.1E-11
1.3E-11 4.6E-10 8.9E-13
Mean 1.6E-13 3.5E-11 5.3E-12 3.4E-12
3.6E-12 2.5E-11 4.7E-13
SD 1.2E-13 1.2E-10 1.0E-11 9.4E-12
3.9E-12 8.3E-11 3.4E-13
SE 5.4E-14 1.5E-11 2.0E-12 2.1E-12
1.3E-12 1.5E-11 1.7E-13
Lower 95% CI of mean 5.8E-15 4.5E-12 1.2E-12 -9.9E-13 6.6E-13
-5.1E-12 -7.3E-14
Upper 95% CI of mean 3.1E-13 6.6E-11 9.5E-12 7.8E-12 6.6E-12
5.5E-11 1.0E-12
Sum 7.8E-13 2.1E-09 1.4E-10 6.8E-11
3.3E-11 7.8E-10 1.9E-12
1
g
,;.
IV
n
cp
t..)
=
,-,
t..)
'a
t..)
=
u,
u,
24
CA 02824043 2013 07 05
WO 2012/094643
PCT/US2012/020556
EXAMPLE 4
1L4 AND 1L5 ESOPHAGEAL mRNA LEVELS AS A FUNCTION OF ALLERGY
STATUS
[0064] TH2 cytokine levels in patients with active EE (>24
eosinophils/hpf) were measured to determine their correlation with presence of
allergic disease (as determined by medical history or current diagnosis). 1L4
and 1L5
had significantly increased mRNA levels in patients with allergy and EE
compared
with patients without allergy with EE (median, 2.2x10⁻⁵; 25-75 interquartile,
6.0x10⁻⁶-
9.8x10⁻⁵ vs median, 4.8x10⁻⁶; 25-75 interquartile, 3.6x10⁻⁶-5.9x10⁻⁶; P <
.0005; and
median, 1.2x10⁻⁴; 25-75 interquartile, 2.9x10⁻⁵-3.1x10⁻⁴ vs median, 3.3x10⁻⁵;
25-75
interquartile, 8.3x10⁻⁶-8.7x10⁻⁵; P <.005, respectively). No significant
changes in
eotaxin-3 or 1E13 levels (Figure 3) were found in patients with EE with and
without
allergy (median, 1.3x10⁻²; 25-75 interquartile, 8.3x10⁻³-2.3x10⁻² vs median,
5.8x10⁻³;
25-75 interquartile, 3.0x10⁻³-1.4x10⁻² and median, 6.7x10⁻⁴; 25-75
interquartile,
2.5x10⁻⁴-2.1x10⁻³ vs median, 5.1x10⁻⁴; 25-75 interquartile, 2.4x10⁻⁴-2.1x10⁻³,
respectively; Figure 3). No significant change in 1L2 mRNA was observed as a
function of the allergy history. These results indicate that 1L4 and 1L5 are
dysregulated in patients with allergy and EE compared with patients without
allergy
with EE and reflect the systemic allergic history of the patients rather than
the activity
of the disease.
EXAMPLE 5
CORRELATION OF CYTOKINE EXPRESSION IN PATIENTS WITH ACTIVE
EE
[0065] Cytokine levels were measured to determine whether abnormal
cytokine levels would correlate with each other in patients with active EE.
The
correlation between 1E13 and other TH2 cytokines as well as eotaxin-3 was
studied
because IL13 has been shown to induce the latter cytokine. A significant
Spearman
correlation was found between IL13 and eotaxin-3 (r, 0.55; P = .0002) and
between
1L5 and eotaxin-3 (r, 0.55; P = .0001), and a surprisingly high correlation
was found
between IL13 and 1L5 (r, 0.72; P < .0001; Figure 4). A weak correlation was
found
between the expression of 1E13 and 1L4 (r, 0.32; P < .05), and no significant
CA 02824043 2013 07 05
WO 2012/094643
PCT/US2012/020556
correlation was found between 1L4 and eotaxin-3 (r, 0.18; P> .05) or between
1L4 and
1L5 (r, 0.09; P > .05). Linear regression analysis was significant when
comparing
1E13 with either eotaxin-3 or 1L5. No significant linear regressions were seen
between 1L4 and 1E13, 1L5 and eotaxin-3, 1L4 and eotaxin-3, or 1L4 and 1L5.
IL5RA
mRNA levels showed no correlation with any of the cytokine mRNA quantified and
also showed no correlation with eosinophil number in the active EE group (r, -
0.0229;
P = .85; see Table 4). These results indicate that 1E13 mRNA expression is
highly
correlated to 1L5 and eotaxin-3 expression.
TABLE 4. Spearman (rank) correlation of cytokines and cytokine receptor with
eosinophil levels
Correlation
coefficient Correlation coefficient
Genes in active EE P value in the whole cohort P value
1L13 0.442 .00397 0.716 <.0001
Eotaxin-3 0.473 .0190 0.767 <.0001
1L4 0.155 .262 0.412 <.0001
1L5 0.0656 .605 0.470 <.0001
IL5RA -0.0229 .85 0.460 <.0001
EXAMPLE 6
BLOOD CYTOKINE LEVELS IN PATIENTS WITH EE
[ 0 0 6 6 ] Systemic levels of cytokines were measured to determine whether
such levels were abnormal in EE. Cytokine levels of non-EE (healthy, n = 12)
and
active EE patients (EE, n = 13; Figures 5A, 5B, 6A, 6B, and 7A-D); were
quantified
using a human cytokine panel multiplex assay containing 84 cytokines. IL-13,
IL-4,
IL-6, IL-5, CD40 ligand, IL-12p70, and epidermal growth factor (EGF) were
significantly modified in EE compared with healthy subjects (Figure 5A) and
allowed
discrimination of the patient diagnosis with 100% sensitivity and specificity.
Cytokines were also quantified in 5 patients in active and inactive stages of
the
disease, and no difference in the average or paired analysis was observed
between
active and inactive EE, even for cytokine levels that were significantly
different in
healthy subjects versus EE patients (Figure 5B). In this learning set of
patients,
cytokine levels were significantly decreased for IL-10, IL-1Ra, and vascular
endothelial growth factor (VEGF). These results indicate that the activity of
the
disease does not consistently affect these systemic cytokine levels.
26
CA 02824043 2013 07 05
WO 2012/094643
PCT/US2012/020556
EXAMPLE 7
USE OF BLOOD CYTOKINE LEVELS AS A PREDICTIVE DIAGNOSTIC TOOL
FOR EE
[ 0 0 6 7] The scoring panel designed for the learning set (Table 1) was used
to predict diagnosis of prospectively recruited patients. Blind blood plasma
samples
from 36 patients underwent analysis (Tables 5A-D). Of the 36 subjects tested,
the
scoring system identified 14 potential patients with EE; 22 samples were
predicted to
belong to patients without EE (Table 6). After the diagnosis was revealed and
linked
with the data, 3 of the 14 positive patients were patients without EE,
indicating a 79%
positive predictive value. Out of the 22 patients predicted to be patients
without EE,
15 were truly negative, indicating a 68% negative predictive value. The
specificity of
the test was 83%, with 3 false-positives, for the 18 patients without EE that
were
tested. In conjunction, 7 of the 18 patients with EE were not identified by
the test,
demonstrating 61% sensitivity (Table 7). The test was also able to diagnose
the
presence of allergy (as determined by medical history or current diagnosis)
among all
the patients, regardless of the esophageal diagnosis, with a 78% positive
predictive
value, 32% negative predictive value, 70% specificity, and 42% sensitivity. No
significant differences were observed for most cytokines between healthy
subjects and
patients with EE.
27
TABLE 5A. Cytokine levels in 36 patients
Sample ID # EGF Eotaxin FGF-2 FLt-3 L Fractalkine G-CSF GM-
CSF GRO IFNa2 IFN-y
0
1 82 180 67 ND 131 ND
155 993 910 5 t..)
o
2 30 273 29 ND 252 ND
169 1344 1701 9
t..)
O-
3 161 273 109 32 949 118
458 1801 2614 21 ,.tD
.6.
4 66 178 49 ND 62 34
195 769 1537 25
.6.
40 293 61 ND 215 29 250 752
1557 15
6 187 215 57 36 302 ND
618 960 ND 30
7 64 235/321* 45 ND 97 ND 209
711 ND 11
8 99 165 63 ND 133 ND
252 591 ND 47
9 3 263 44 ND 405/210* ND
275 468 ND 38/18*
49 275 50 ND 155 ND 246 796
504 17
11 55 267 50 ND 100 ND
206 786 ND 18
12 74 314 73 40 1'004 ND
198 825 ND 63
13 33 218 40 ND 35 ND 69
770 725 3
14 30 160 31 ND 90 21
134 1018 2374 9
1
53 118 54 ND 58 ND 92 764
ND 4
g
16 88/63* 290 30 151 44 ND
121 1092 ND 37/22* FT '
17 36 330 43 ND 117/33* 29
166 1289 3337 7
18 35 316 26 ND ND ND 59
849 ND 16
19 46 336 46 20 79 37
156 1337 1650 9
55 235 40 51 80 ND 153 804
ND 8
21 56 303 75/128* 31 1656/2510* ND 364/688*
1430 ND 93
22 52 130 49 23 49 ND
109 775 ND 9
23 41 205 30/41* ND 39/113* ND 110
175/244* ND 5
24 107 327 41 ND 166 ND
200 548 578 28 1-d
n
ND 202/323* 26/41* ND/22* 164 ND 79
394/520* 515 9/23*
26 31 272 26 52 31 ND 63
955 ND 6 cp
t..)
27 112 140/220* 72/100* ND/31* 162 ND 364/613*
1573 1193 15/31* o
,-,
t..)
28 140 256 161 178 1687 162
637 808 1684 50 O-
t..)
29 ND 124 28 ND ND ND
103 976 ND 6 a
u,
47 164 41 ND ND ND 113 1234
1336 59
28
31 51 165 44 ND 106 ND
146 581 1637 ND
32 83 294 84 114 807 ND
201 961 ND 25
0
33 ND 213 33 23 22 ND
124 319 ND 11 t..)
o
34 187 394 189 133 1288 182
1279 1289 4342 76
t..)
35 67 193 44 ND ND t
102 1217 ND 5 O-
,o
.6.
36 24 234 37 63 313 ND 94
443 698 23 o,
.6.
ND, Not detected; 00R, out of range.
These data were obtained by using "Research Only" kits. The data cannot be
used for clinical or diagnostic purposes.
*High coefficient of variation (CV), both replicates reported.
tNo result because of insufficient bead count.
c,.
1
g
,;.
IV
n
cp
t..)
=
,-,
t..)
'a
t..)
=
u,
u,
29
TABLE 5B. Cytokine levels in 36 patients
0
t..)
Sample ID # IL-la IL-113 IL-1RA IL-2 IL-3 IL-4
IL-5 IL-7 IL-8 IL-9
t..)
1 394 4 47 8 4 165
4 97 17 ra)
2 296 23 153 4 8 300
10 115 39 70 .6.
o,
.6.
3 692 8 59 18 4 812
17 t 57 26 w
4 157 5 52 52 7 133
9 195 64 ND
282 11 108 6 12 230 9 201
43 41
6 528 7 31 20 ND ND
ND ND 36 Isfl)
7 241 ND 50 10/6* ND ND
ND ND 16 ND
8 181 ND 32 14 1s4:0 Isfl)
1s4:0 1s4:0 38 Isfl)
9 439 -1s4:0 48 11 -1s4:0 Isfl)
lsa) lsa) 38/15* Isfl)
222 lsa) 41 12 lsa) Isfl) 1s4:0
1s4:0 12 Isfl)
11 211 lsa) 41 13 -1s4:0
Isfl) 1s4:0 t 19 Isfl)
12 224 -1s4:0 39 22 13 35
1s4:0 -1s4:0 34 Isfl) c;
2
13 142 -1s4:0 25 4 -1s4:0 45
lsa) 44 14 Isfl) i
8
14 204 13 123 Isfl) 4 415
14 258 57 58 cl
221 -1s4:0 29 9 -1s4:0 Isfl) 1s4:0
1s4:0 5 Isfl)
16 167 lsa) 24 Isfl) 1s4:0 Isfl)
lsa) isa) 27/16* Isfl)
17 111 6 61 7 -1s4:0 612
13 255 81 20
18 143 Isfl) Isfl) Isfl) -1s4:0 Isfl)
lsa) isa) 10 Isfl)
19 196 14 87 4 4 450
9 245 51 38
438 Isfl) Isfl) 4 3 Isfl) 1s4:0 t
6 1s4:0
21 375 17/67* 39/84* 8/26* lsfl) Isfl)
-1s4:0 t 49 324
22 153 10 85 4 7 -1s4:0
4 29 8 51 Iv
23 147/227* 21 80 3/7* 7 ND 5
56/84* 10 31 n
1-i
24 343 33 215 29 13 ra)
12 t 35 400
cp
83 14/41* 65 5/13* ism 27/92* 4 t
13/26* 38 w
o
26 247 ND ism ra) ism ra)
ra) T 7,..,
ra) w
--
27 311 6 59 20 ism 87/170*
5 120/171* 25 ra) w
28 365 60 363 83 161 20
29 104 22 162
c.,
29 260 ND 98 ND ND ND
ND ND 4 ND
30 300 ND ND ND ND 52
5 152 33 ND
0
31 408 9 93 5 10 198
11 288 40 32 t..)
o
32 690 ND 47 26 15 ND
11 ND 8 ND ,¨
t..)
33 148 ND ND 4 ND ND
ND ND 9 ND
34 539 57 322 83 56 1484
35 457 94 170 t
35 160 ND 73 ND ND ND
ND ND 9 ND
36 147 ND 28
16/10* ND 9 ND 80 9 ND
ND, Not detected; 00R, out of range.
These data were obtained by using "Research Only" kits. The data cannot be
used for clinical or diagnostic purposes.
*High coefficient of variation (CV), both replicates reported.
tNo result because of insufficient bead count.
c,.
1
g
,;.
00
n
,-i
cp
t..)
=
t..)
'a
t..)
=
u,
u,
c,
31
TABLE 5C. Cytokinelevelsin36patients
0
w
SanTpleIEI# IL-10 IL-12(p40) IL-12(p70) IL-13 IL-15 IL-17 IP-10 MCP-1 MCP-3
MDC =
,..,
t..)
1 12 72 5 7 10 ra)
532 336 80 1418 O-
,o
2 47 275 ra) 25 50 4
404 404 163 2699 .6.
o,
.6.
3 58 132 9 13 29 4
1372 383 227 4096 w
4 9 63 10 9 16 35
236 318 106 2997
36 377 29 26 33 4 418 393
102 1775
6 4 165 49 140 6 47
390 186 ra) 3193
7 4 93 8 30 4 21
275 359 ND 2058
8 10 176 25 238 4 69
288 328 ra) 1206
9 4 ra) 148/60* 204/108* ra) 74/19*
368 371 ra) 1857/845*
4 198 12 14 4 15 273 352
18 1799
11 7 96 11 15 7 17
259 339 20/29* 2262
12 26 47 92 ra) 6 51
317 343 42 3008
13 ra) 234 ra) ra) 7 ra)
223 282 70 846 1
8
14 21 293 7 28 61 30
333 309 156 1123 cl
9
8
8 ND ND ND ND ND 326 350
17 747
16 ND 237 84
ND ND 41/21* 273 290 ND 2368
17 15 99 12 6 23 7
212 362 238 2682
18 ND ND ND 14 ND 3
188 200 26 1536
19 33 350 6 25 36 8
278 422 143 2014
ND ND 14 ND ND 8 568 260
ND 1564
21 4 213 8/16* 25 10 67
315 274 25 2263
22 17 377 6 14 31 ND
200 335 18 1798 1-d
23 16 141 4 21 31 8
235 273 24 3031 n
1-i
24 58 535 47 56 70 25
366 410 33 908
cp
21 221 5/13* 22 22 8/26* 93/139*
197/355* 52/74* 786/1704* w
o
26 ra) 82 ra) ra) ra) 11
416 499 ra) 667 w
O-
27 22 169 10 7 22 8
521 473 134/213* 1746 w
o
28 118 993 134 128 131 46
549 297 79 2077 u,
u,
o,
32
29 31 117 ND ND ND ND
433 348 ND 2351
30 6 203 ND ND 7 25
333 481 79 1885
0
31 20 225 3 23 30 5
728 181 103 779 t..)
o
32 5 73 50 15 4 12
945 275 29 1311
t..)
33 ND ND 10 7 ND 37
251 292 ND 1494 O-
,o
.6.
34 272 1097 164 108 154 80
600 340 260 1535 o,
.6.
35 ND ND ND ND ND ND
280 337 ND 3676 c,.)
36 ND ND 39 ND 3 16
284 297 46 940
ND, Not detected; 00R, out of range.
These data were obtained by using "Research Only" kits. The data cannot be
used for clinical or diagnostic purposes.
*High coefficient of variation (CV), both replicates reported.
tNo result because of insufficient bead count.
c,.
1
g
,;.
00
n
,-i
cp
t..)
=
t..)
'a
t..)
=
u,
u,
c,
33
TABLE 5D. Cytokinelevelsin36patients
SampleID# MIP-la MIP-1B sCD4OL sIL-21la TGFa INFa TNFB VEGF IL-6
0
1 39 42 9460 254 6
15 10 83 4 w
o
2 124 87 781 77 7
13 ND 53 31 ,..,
w
O-
3 109 70 OCR 414 203
20 6 290 20 ,o
.6.
4 147 77 2873 44 20
9 4 92 15 o,
.6.
w
100 76 3166 153 26 12 11
80 34
6 152 107 2873 86 16
12 12 300 26
7 89 45 1890 49 9
8 ND 66 7
8 179 217 667 175 18
8 ND 276 92
9 129/86* 103/54* 862 55 24
11 ND 238 31/14*
97 41 2276 59 14/6* 9 ND
103 9
11 91 51 1563 48 11
8 ND 85 10
12 139 136 907 134 24
19 24 296 101
13 53 29 1499 70 ND
5 ND ND 5
14 116 30 982 ND 59
7 12 90 21
1
64 29 1761 106 5 5 4
36 ND !!.
g
16 91/60* 94/63* 1094 169/107* 11/7*
6 ND 213 53/32*
17 72 44 993 87 102
10 4 155 15
18 33 21 3787 26 ND
ND ND ND ND
19 98 41 1695 108 27
7 ND 79 22
ND 36 1909 96 8 8 4
103 10
21 143/190* 126/181* 2499 94 22
4 ND 149 2143*
22 87 30 4911 211 ND
7 ND 45 27
23 90 37 638 66 5
5 4 47 23
24 157 110 2291 153 21
9 4 111/175* 115 Iv
n
64/90* 51/119* 518/1122* 72 6/10* 4 4
66/113* 17
26 38 83 952 ND 4
5 ND ND 16 cp
w
27 156/236* 51/76* 1'294 149 155/359*
14 3 406 11 o
,-,
w
28 183 152 2093 433 38
42 170 329 83 O-
w
29 24 31 627 170 ra)
7 ND ra) lo a
,
120 63 2802 39 4 7 ra)
74 20 o,
34
31 74 37 2217 49 8
4 7 64 9
32 73 74 8909 185 17
16 22 184 22
0
33 46 21 391/650* ND 4
4 ND 162 17 t..)
o
34 221 228 3464 306 65
36 112 324 99
t..)
35 ND 23 7005 91 ND
5 ND ND ND O-
,o
.6.
36 57 72 828 69 16
6 10 149 ND o,
.6.
ND, Not detected; 00R, out of range.
These data were obtained by using "Research Only" kits. The data cannot be
used for clinical or diagnostic purposes.
*High coefficient of variation (CV), both replicates reported.
tNo result because of insufficient bead count.
c,.
1
g
,;.
IV
n
cp
t..)
=
,-,
t..)
'a
t..)
=
u,
u,
TABLE 6. Scoring of the 36 blind samples, diagnosis, allergic history, and
peak eosinophil counts in esophageal biopsies
Samples IL-la IL-4 L-5 IL-6 IL-12 p70 L-13 IL-17 CD4OL Score EE Allergy Eos#
0
1 0 0 0 0 1 0 1 0 2 Yes
Yes 207 t..)
o
2 0 0 1 0 1 0 1 1 4 Yes
No 78
t..)
O-
3 0 0 1 0 1 0 1 0 3 Yes
No 50 o
.6.
4 0 0 1 0 1 0 0 1 3 Yes
No 267 o
.6.
(...)
0 0 1 0 0 0 1 0 2 Yes Yes
169
6 0 0 0 0 0 0 0 1 1 No
Yes 0
7 0 0 0 0 1 0 0 1 2 No
No 0
8 0 0 0 0 0 0 0 1 1 No
No 0
9 0 0 0 0 0 0 0 1 1 No
No 0
0 0 0 0 1 0 0 1 2 No Yes
0
11 0 0 0 0 1 0 0 1 2 No
Yes 0
12 0 0 0 0 0 0 0 1 1 No
Yes 0
13 0 0 0 0 1 0 1 1 3 Yes
Yes 194 c;
14 0 0 1 0 1 0 0 1 3 Yes
Yes 186
1
0 0 0 0 1 0 1 1 3 Yes Yes
40
g
16 0 0 0 0 0 0 0 1 1 Yes
Yes 106 8- '
17 0 0 1 0 1 0 1 1 4 Yes
Yes 27
18 0 0 0 0 1 0 1 0 2 Yes
No 29
19 0 0 1 0 1 0 1 1 4 Yes
Yes 154
0 0 0 0 1 0 1 1 3 Yes Yes
97
21 0 0 0 0 1 0 0 1 2 No
No 0
22 0 0 0 0 1 0 1 0 2 Yes
Yes 81
23 0 0 0 0 1 0 1 1 3 Yes
Yes 136
24 0 0 1 0 0 0 0 1 2 Yes
Yes 169 1-d
n
0 0 0 0 1 0 0 1 2 No Yes
0
26 0 0 0 0 1 0 1 1 3 No
Yes 0 cp
t..)
27 0 0 0 0 1 0 1 1 3 No
Yes 2 o
,-,
t..)
28 0 0 1 0 0 0 0 1 2 No
Yes 0 O-
t..)
29 0 0 0 0 1 0 1 1 3 Yes
Yes 105 o
u,
u,
0 0 0 0 1 0 0 1 2 No No
0 o
36
31 0 0 1 0 1 0 1 1 4 No
Yes 0
32 0 0 1 0 0 0 1 0 2 Yes
Yes 103
0
33 0 0 0 0 1 0 0 1 2 No
Yes 0 t..)
o
34 0 1 1 0 0 0 0 0 2 No
Yes 0
t..)
35 0 0 0 0 1 0 1 0 2 No
No 0 O-
,o
4,.
36 0 0 0 0 0 0 0 1 1 No
Yes 0 o,
4,.
Eos #, Maximum eosinophil count/hpf.
TABLE 7. Assessment of the specificity and sensitivity of the test
EE diagnosis
Positive Negative
n = 18 n =
18
Test results Positive TP = 11 FP = 3
PPV = 79%
c,.
n = 14
Negative FN =7 TN = 15
NPV = 68% 1
''.
n = 22
Sensitivity = 61% Specificity
= 83%
FN, False negative; FP, false positive; NPV, negative predictive value, TN/(FN
+ TN); PPV, positive predictive value, TP/(TP + FP); TN, true
negative; TP, true positive.
Sensitivity = TP/(TP + FN).
Specificity = TN/(TN + FP).
1-d
n
cp
t..)
=
,-,
t..)
'a
t..)
=
u,
u,
37
CA 02824043 2013 07 05
WO 2012/094643
PCT/US2012/020556
[0068] The various methods and techniques described above provide a
number of ways to carry out embodiments of the invention. Of course, it is to
be
understood that not necessarily all objectives or advantages described can be
achieved
in accordance with any particular embodiment described herein. Thus, for
example,
those skilled in the art will recognize that the methods can be performed in a
manner
that achieves or optimizes one advantage or group of advantages as taught
herein
without necessarily achieving other objectives or advantages as taught or
suggested
herein. A variety of alternatives are mentioned herein. It is to be understood
that
some preferred embodiments specifically include one, another, or several
features,
while others specifically exclude one, another, or several features, while
still others
mitigate a particular feature by inclusion of one, another, or several
advantageous
features.
[0069] Furthermore, the skilled artisan will recognize the applicability of
various features from different embodiments. Similarly, the various elements,
features and steps discussed above, as well as other known equivalents for
each such
element, feature or step, can be employed in various combinations by one of
ordinary
skill in this art to perform methods in accordance with the principles
described herein.
Among the various elements, features, and steps some will be specifically
included
and others specifically excluded in diverse embodiments.
[0070] Although the invention has been disclosed in the context of certain
embodiments and examples, it will be understood by those skilled in the art
that the
embodiments of the invention extend beyond the specifically disclosed
embodiments
to other alternative embodiments and/or uses and modifications and equivalents
thereof
[0071] In some embodiments, the numbers expressing quantities of
ingredients, properties such as molecular weight, reaction conditions, and so
forth,
used to describe and claim certain embodiments of the invention are to be
understood
as being modified in some instances by the term "about." Accordingly, in some
embodiments, the numerical parameters set forth in the written description and
attached claims are approximations that can vary depending upon the desired
properties sought to be obtained by a particular embodiment. In some
embodiments,
the numerical parameters should be construed in light of the number of
reported
significant digits and by applying ordinary rounding techniques.
Notwithstanding that
the numerical ranges and parameters setting forth the broad scope of some
38
CA 02824043 2013 07 05
WO 2012/094643
PCT/US2012/020556
embodiments of the invention are approximations, the numerical values set
forth in
the specific examples are reported as precisely as practicable.
[0072] In some embodiments, the terms "a" and "an" and "the" and
similar references used in the context of describing a particular embodiment
of the
invention (especially in the context of certain of the following claims) can
be
construed to cover both the singular and the plural. The recitation of ranges
of values
herein is merely intended to serve as a shorthand method of referring
individually to
each separate value falling within the range. Unless otherwise indicated
herein, each
individual value is incorporated into the specification as if it were
individually recited
herein. All methods described herein can be performed in any suitable order
unless
otherwise indicated herein or otherwise clearly contradicted by context. The
use of
any and all examples, or exemplary language (for example, "such as") provided
with
respect to certain embodiments herein is intended merely to better illuminate
the
invention and does not pose a limitation on the scope of the invention
otherwise
claimed. No language in the specification should be construed as indicating
any non-
claimed element essential to the practice of the invention.
[0073] Preferred embodiments of this invention are described herein,
including the best mode known to the inventors for carrying out the invention.
Variations on those preferred embodiments will become apparent to those of
ordinary
skill in the art upon reading the foregoing description. It is contemplated
that skilled
artisans can employ such variations as appropriate, and the invention can be
practiced
otherwise than specifically described herein. Accordingly, many embodiments of
this
invention include all modifications and equivalents of the subject matter
recited in the
claims appended hereto as permitted by applicable law. Moreover, any
combination
of the above-described elements in all possible variations thereof is
encompassed by
the invention unless otherwise indicated herein or otherwise clearly
contradicted by
context.
[0074] All patents, patent applications, publications of patent applications,
and other material, such as articles, books, specifications, publications,
documents,
things, and/or the like, referenced herein are hereby incorporated herein by
this
reference in their entirety for all purposes, excepting any prosecution file
history
associated with same, any of same that is inconsistent with or in conflict
with the
present document, or any of same that can have a limiting affect as to the
broadest
scope of the claims now or later associated with the present document. By way
of
39
CA 02824043 2013 07 05
WO 2012/094643
PCT/US2012/020556
example, should there be any inconsistency or conflict between the
description,
definition, and/or the use of a term associated with any of the incorporated
material
and that associated with the present document, the description, definition,
and/or the
use of the term in the present document shall prevail.
[0075] In closing, it is to be understood that the embodiments of the
invention disclosed herein are illustrative of the principles of the
embodiments of the
invention. Other modifications that can be employed can be within the scope of
the
invention. Thus, by way of example, but not of limitation, alternative
configurations
of the embodiments of the invention can be utilized in accordance with the
teachings
herein. Accordingly, embodiments of the present invention are not limited to
that
precisely as shown and described.