Note: Descriptions are shown in the official language in which they were submitted.
CA 02828654 2013-08-29
1
Description
Method for Ascertaining the Fertilizer Requirement, in Particular
the Nitrogen Fertilizer Requirement,
and Apparatus for Carrying out the Method
The invention relates to a method for ascertaining the fertilizer requirement
of an
agricultural cultivated plant, and to a device for dosing fertilizer.
In the field of precision farming, a subarea-specific fertilizer
administration constitutes
one of the major challenges. Overfertilization is a problem both from an
ecological and
from an economic view. In the case of underfertilization, the yield of the
field is reduced,
so that a demand-optimized fertilization has to be striven for.
Due to the heterogeneity of soil and microclimate, the productivity and the
availability of
nutrients from the soil vary within an agricultural plot. These
heterogeneities result in
different growths of the plants and in differentiated yields and
correspondingly different
fertilizer requirement. Presently, in agricultural practice, the quantity of
nitrogen fertilizer
is discharged in a uniform dosage across the entire agricultural plot ¨ the
heterogeneities mentioned are frequently not taken into consideration. Such
uniform
fertilization results in a more or less large under and/or overfertilization
in individual
partial areas with the drawbacks involved therewith.
A system for a subarea-specific fertilization is known in which the nutrient
status of a
plant is detected by means of a sensor, and the fertilizer requirement is then
calculated
as a function of the sensor signal, for instance, a vegetation index and
subarea-specific
data to be retrieved in an onboard computer or online. On the basis of the
fertilizer
requirement, a control signal is then generated for a fertilizer dosing device
(discharger).
Such a solution is, for instance, disclosed in DE 199 13 971 Al.
In the case of these solutions, the sensor for detecting the vegetation index
has to be
calibrated before it starts operating. This may, for instance, be performed by
a so-called
N tester that has, however, a number of disadvantages. The use of such an N
tester is
CA 02828654 2013-08-29
extremely cumbersome and requires certain experience. The N tester measures
the
transmission of light through the leaves of plants. This value is closely
correlated with
the chlorophyll and N content, but not with the quantity of biomass. The N
uptake that is
important for the assessment of the fertilizer is calculated from the N
content and the
biomass. It is a problem that the N uptake is determined rather by the biomass
of the
plant than by the N content. As mentioned, the productivity of the location is
not taken
into account during the assessment of the fertilizer. This productivity,
however,
influences the nutrient requirement more than fluctuations in the N
concentration of the
plant. Plants on subareas with weak productivity always have low N
concentrations ¨ on
such subareas, due to other parameters limiting productivity, low N quantities
are
accordingly also sufficient for an optimum growth, so that, if the
productivity is
disregarded, such subareas are regularly overfertilized. Subareas with high
productivity,
however, rather tend to get not enough fertilizer.
Moreover, the measurement value of the sensor depends strongly on the variety,
for
which reason so-called variety correction tables are often supplied. Since,
however, a
plurality of varieties are admitted every year by the Bundessortenamt [Federal
Office for
Plant Varieties], these variety correction tables accordingly have to be
updated every
year, which further aggravates the handling of the sensor.
EP 1 411 758 B1 describes a method for discharging fertilizer, wherein a
maximally
achievable yield and a yield predicted for the respective area as well as the
nutrient
uptake of the plant with the optimum yield and the yield predicted for the
agricultural plot
are included in the calculation of the quantity of fertilizer. This method
provides only a
one-time fertilization during the vegetation period.
From prior art, a plurality of vegetation indexes are known; the so-called
REIP (Red
Edge Inflection Point) vegetation index is frequently used. Of course, other
vegetation
indexes such as NDVI, IRR, IRG, IRI, SAVI, etc. may also be used. In the case
of the
REIP index, the light absorption and/or reflection behavior of plants is
utilized.
Accordingly, these plants have the general property of absorbing the light of
particular
wavelengths for a major part while reflecting the light with longer waves for
a major part.
Thus, the blue, green, or red light portions are absorbed by the leaves of a
plant,
3
wherein the cell structure and the water content of the plant result in that
the absorption
in the beginning infrared range transits to a reflection in a steep edge
(inflection point).
Investigations have evidenced that this main inflection point (REIP) may be
used for
ascertaining the bio mass growth and the nitrogen content.
A sensor for ascertaining the chlorophyll content is known from WO 01/45490
Al.
In the scope of the IKB final symposium of 11 to 12 October 2005 in
Weihenstephan,
aspects of the subarea-specific N fertilization were discussed. In the lecture
in the
scope of the IKB partial project 9 "Optimierung der teilflachenspezifischen
Bestandsfuhrung nnit beruhrungsloser Sensorik nach Bestandsheterogenitat"
[Optimization of the subarea-specific crop management with a touchless sensor
system
pursuant to crop heterogeneity], the usability of the above-mentioned
vegetation
indexes is represented in a comparison. Furthermore, the inventor of the
instant
invention explains in the lecture "Teilflachenspezifische N-DOngung" [Subarea-
specific
N fertilization] during the final symposium mentioned that the optimum N
uptake
depends very strongly on the stage of development and on the yield potential
in the
respective partial agricultural plot.
It is an object of the invention to provide a method for discharging
fertilizer, in particular
N fertilizer, and a device for performing such a method, by which it is
possible to take
into consideration the subarea-specific aspects during the dosing of the
fertilizer in an
improved manner, wherein the efforts with respect to regulation technology and
device
technology are to be further minimized.
This object is solved by a method in accordance with one or more aspects of
the
present invention and a device in accordance with one or more aspects of the
present
invention.
In accordance with the invention, with the method for ascertaining the
fertilizer
requirement of an agricultural cultivated plant, a characteristic diagram (or
a table) is
CA 2828654 2017-11-01
CA 02828654 2013-08-29
=
4
first of all stored in a data memory, representing the current nutrient uptake
(nutrient
state) of the plant at least as a function of a vegetation index and/or a
stage of
development of the plant.
Furthermore, a characteristic diagram (table) is stored in the data memory
which
comprises the optimum nutrient uptake of the plant as a function of the stage
of
development and/or of the yield to be expected and/or of the product quality
(crude
protein content) in a partial agricultural plot to be fertilized.
In a measuring step, the vegetation index in the partial agricultural plot to
be fertilized is
measured, and the current nutrient uptake is read out from the corresponding
characteristic diagram/table.
In a further step, the optimum nutrient uptake (nutrient status) in this
partial agricultural
plot is read out with the current stage of development and/or the yield
potential in this
partial agricultural plot, and then a quantity of fertilizer is calculated
from the difference
between the optimum nutrient status and the nutrient requirement by the next
fertilizing
deadline, and this difference is offset against a correction factor determined
from
subarea-specific parameters. These parameters may, for instance, be the
duration of
effect of the fertilizer, the fertilizer immobilization in the soil, the
mineralization from the
soil, and the fertilizer utilization rate. The stage of development of the
plants in the
subarea observed may also be included in this correction factor.
Via an evaluation unit, a control signal is then output to a fertilizer dosing
feeder, and a
quantity of fertilizer is dosed as a function of the above-mentioned amount.
This method is carried out at least once for every partial agricultural plot,
so that a highly
efficient subarea-specific fertilization takes place, with under or
overfertilization being
avoided, and hence the yield potential of the respective subarea is utilized
optimally.
In a particularly preferred further development of the invention, the
difference from
nutrient uptake the expected nutrient requirement by the next vegetation cycle
and the
CA 02828654 2013-08-29
..
,
current nutrient status is additionally included in the calculation of the
nutrient
requirement. This difference is added to the afore-explained difference.
The evaluation of the measurement signals is particularly simple if the
characteristics for
5 ascertaining the current nutrient uptake (nutrient status) from the
sensor signal are
chosen in a first approximation as straight lines or sections of straight
lines. As will be
explained in more detail in the following, these straight lines are distinctly
dependent on
the stage of development of the plant.
In one embodiment according to the invention, the intercept of this straight
line itself is
ascertained from an estimation function, preferably a straight line with a
negative slope,
so that the intercept decreases with an increasing medium fertilizer uptake of
the plant
in the observed stage of development and with the yield potential of the
subarea.
The slope of this straight line is also again ascertained from an estimation
function,
preferably a straight line, wherein the slope increases with the afore-
mentioned medium
nutrient uptake.
In accordance with the invention it is preferred if the vegetation index is
the REIP
vegetation index.
The magnitude of the afore-mentioned correction factor for calculating the
quantity of
fertilizer to be dosed lies, for instance, in the range of 0.5 to 1.5.
The device for discharging (spreading) of fertilizer according to the
invention comprises
a data memory for storing the afore-described characteristics representing the
intended
nutrient status or the optimum nutrient uptake as a function of the respective
stages of
development in the partial agricultural plots to be fertilized, the intended
plant quality in
these partial agricultural plots, and the yield to be expected in the partial
agricultural
plots. The device further comprises a sensor for detecting the vegetation
index and an
evaluation unit for selecting the suitable characteristics/tables and for
reading out the
current nutrient uptake (nutrient status) as a function of the vegetation
index, and for
reading out an optimum nutrient uptake and the subarea-specific correction
value, and
CA 02828654 2013-08-29
6
for calculating the quantity of fertilizer from these parameters. Via the
evaluation unit, a
dosing signal is further output to a fertilizer dosing device and the same is
controlled
accordingly.
Preferred embodiments (for winter wheat, as an example) of the invention will
be
explained in detail in the following by means of schematic drawings. There
show:
Figure 1 a block diagram of essential features of a device for discharging
fertilizer;
Figure 2 a characteristic diagram for determining a current N uptake as a
function of a
vegetation index and the stage of development;
Figures 3 and 4 linear equations for ascertaining the characteristics pursuant
to Figure
2;
Figure 5 a characteristic diagram for ascertaining the optimum N uptake of
winter wheat
as a function of the stage of development and the yield potential;
Figure 6 a characteristic from the characteristic diagram pursuant to Figure 5
with the N
uptake indicated;
Figure 7 the characteristic diagram pursuant to Figure 5 in which the
necessary N
uptake is indicated as a function of the stage of development, the yield
potential, and a
correction factor;
Figures 8 and 9 characteristic diagrams for illustrating the dependence of the
optimum
N uptake on the stage of development and the product quality with different
yield
expectations using the example of winter wheat;
Figure 10 a table for ascertaining the correction factor DIMA as a function of
a fertilizer
utilization rate and the stage of development; and
Figure 11 a soil map for illustrating different yield regions of a field.
CA 02828654 2013-08-29
7
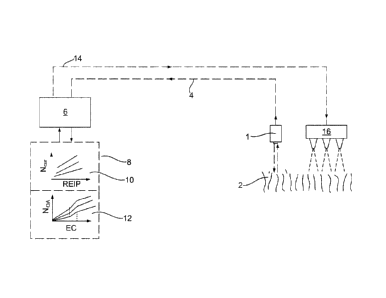
Figure 1 shows a strongly schematized block diagram for illustrating the
method
according to the invention.
Accordingly, one or several sensors 1 for detection are arranged at an
agricultural
tractor or another utility vehicle.
On principle, such a sensor consists of a plurality of light transmitting
elements emitting,
for instance, monochromatic light of a predetermined wavelength. The sensor 1
further
comprises a light receiving element receiving the light reflected by the
plants 2 and
generating a signal indicative of the respective intensity of the received
light. The control
of the light transmitting elements is performed via a controller integrated in
the sensor 1
which controls the light transmitting elements in a cyclic sequence and
determines the
respective intensity of the reflected light from the output signal of the
light receiving
element. The REIP vegetation index is then calculated from the light
intensities
determined over the entire measurement cycle. The measurement signal 4
corresponding to the vegetation index (REIP) is then supplied to an evaluation
unit 6 of
a central processing unit of the agricultural tractor. A data memory 8 is
assigned to this
evaluation unit 6 in which some characteristics and subarea-specific data for
calculation
of a quantity of fertilizer to be discharged are stored, which will be
explained in more
detail in the following.
From multi-spectral reflection measurements performed by the applicant under
various
environmental aspects, numerous vegetation indexes described in literature
were
calculated and examined for stability (variety dependence, angle of incidence
of the
sun, leaf moisture, size of plant, nutrition status of the plants, etc.). The
vegetation index
REIP turned out to be very stable, so that the calculation of the quantity of
fertilizer
explained in the following was also performed on the basis of this index. With
respect to
the stage of development of the plants, the different vegetation indexes and
also the
REIP turned out to be very sensitive during these tests. Accordingly, for
every
plant/variety a characteristic diagram (or a table) is stored in the data
memory which
enables to ascertain the N uptake as a function of the REIP and of the stage
of
development EC. Figure 2 shows, by way of example, a characteristic diagram 10
for an
CA 02828654 2013-08-29
8
agricultural cultivated plant ¨ the strong dependence of the absolute N uptake
(kg/ha)
on the stage of development of the cultivated plant as mentioned above can be
recognized. Thus, with a particular REIP value of, for instance, 725 nm, the
absolute N
uptake is in an earlier stage of development by far more than half lower than
in the
stage of development 65.
Now, if one intended to store the corresponding characteristics 10 for every
agricultural
cultivated plant and for every stage of development of this plant, this would
result in an
excessive quantity of data that is difficult to master both with respect to
hardware
technology and to software technology. In the scope of the invention, an
estimation
algorithm has therefore been developed which enables to indicate the absolute
nitrogen
uptake of the plants irrespective of the stage of development. Due to the
known great
importance of the stage of development of the plants for the peculiarity of
the REIP,
extensive examinations have been performed, and it was found that the
regression
members of the estimation algorithms for ascertaining the above-mentioned
characteristics 10, which will be explained in the following, are in extremely
close
correlation with the plant development. In a first approximation, every
characteristic of
the characteristic diagram 10 illustrated in Figure 2 may be represented by a
straight
line:
NcUr = (a) (REIP) + y
wherein Nair is the current nutrient uptake of the plant, a the slope of the
characteristic,
and y the intercept of the characteristic.
In Figures 3 and 4, the dependence of the intercept y and of the slope a of
this
characteristic is illustrated by way of example for winter wheat. One
recognizes that the
slope a (Figure 3) rises with increasing medium N uptake N* of the examined
plants
pursuant to the equation
A = 0.102N* + 2.0894
wherein the statistic coefficient of determination R2 = 0.8991.
CA 02828654 2013-08-29
9
The above-mentioned equation for ascertaining the slope a was determined by
the
evaluation of existing measurement results, wherein the respective reading
points are
illustrated in Figure 3.
Figure 4 illustrates a diagram for ascertaining the intercept y from the
medium N uptake
N*. One recognizes that the intercept y is also in a linear relationship with
the medium N
uptake N*. The calculation equation reads, with the examined winter wheat and
on the
condition of a medium yield potential and a particular stage of development
EC:
Y = -73.584N* - 1478.3
wherein the statistic coefficient of determination is again very high with R2
= 0.8974.
Accordingly, the intercept y decreases with increasing medium N uptake N*.
From these two equations for ascertaining the intercept y and the slope a of
the
respective characteristic, knowing the medium N uptake N* of the plant, the
characteristic for ascertaining the absolute N uptake Ncur (nutrient status)
may thus be
determined for the respective stage of development and yield potential of the
examined
location.
This system was examined with numerous agricultural cultivated plants (winter
wheat,
summer wheat, winter rape, winter barley, summer barley, Triticale, winter
rye), and it
turned out that it works will all plant varieties mentioned, wherein the
statistic
coefficients of determination are always greater than 0.85, so that it has to
be assumed
that the ascertained algorithm may also be used with other agricultural
cultivated plants.
By means of these algorithms it is thus possible to indicate for the
respective cultivated
plant, knowing the REIP, the biomass in dt/ha and the N uptake in kg
nitrogen/ha at any
stage of development of the plant.
In other words, the respectively valid characteristic for ascertaining the
current N uptake
Ncur may be calculated by means of the above-mentioned equations as a function
of the
stage of development EC and of the REIP in a simple manner.
CA 02828654 2013-08-29
In the following step, the actual fertilizer requirement is now ascertained
from the
current N uptake (nutrient status) Ncur ascertained by measurement.
5 The basis for ascertaining the fertilizer requirement is the knowledge of
the optimum N
supply conditions, i.e. the optimum values for the nitrogen nutrition status
of the
respective cultivated plant. When ascertaining these optimum values it is
assumed that
they depend on the growth conditions of the location. For examination of this
assumption, different test runs and also data in literature were inspected and
calculated
10 for winter wheat as an example. It turned out that the optimum N uptake
values (here for
winter wheat, as an example) may be illustrated pursuant to the relationships
shown in
Figure 5 as a function of the stage of development EC and of the yield range
(t/ha). One
recognizes that the optimum N uptake Nopt increases with increasing stage of
development EC, wherein, of course, the N uptake values Nopt are again
distinctly
higher for areas with high yield than for areas with weak yield. The optimum N
uptake
Nopt with predetermined yield range and stage of development may, in
accordance with
Fig. 5, be illustrated as a characteristic that is composed by approximation
of a plurality
of straight line sections, wherein a modification of the slope takes place at
the
respective stage of development (EC30, EC32, ...).
Figure 6 illustrates the corresponding characteristic for the yield range of 8
t/ha. The
current N uptake Ncur of the plant in the examined partial agricultural plot
is also
indicated in Figure 6, which was ascertained pursuant to the characteristic of
Figure 2
with knowledge of the REIP measured by the sensor 1. The required quantity of
fertilizer
is then calculated pursuant to the equation:
N = [(N0p1 ¨ Ncur) (N0p1+1 ¨ Nopt)] DIMA
wherein N is the quantity of fertilizer to be discharged in kg nitrogen/ha,
Nopt the
optimum N uptake ascertained from the relationship pursuant to Figure 5, Ncur
the
current N uptake ascertained from the REIP, 1\100+1 the optimum N uptake by
the next
fertilizing deadline, and DIMA a correction factor.
CA 02828654 2013-08-29
11
This correction factor DIMA is composed of the components of duration of
effect of the
fertilizer D, N immobilization in the soil I, mineralization from the soil M,
and fertilizer
utilization rate A. These coefficients of the factor DIMA were derived from N
fertilization
tests at different locations and from data of literature. The individual
coefficients of the
DIMA are set relative to the yield level. In Figure 6, the respective
parameters (Ncur,
Nopt, N0p1+1) are indicated, wherein, for convenience, DIMA is equal to 1.
Since Ncur is
distinctly smaller than Now with the planned fertilization deadline, an
undersupplied crop
exists ¨ in order to ensure sufficient N supply by the next fertilizing
deadline, the
quantity of nitrogen indicated by parentheses in the illustration of Figure 6
would have to
be supplied per hectare of subarea.
Figure 7 illustrates the relations of Figure 6 for different yield potentials
¨ accordingly,
with an increasing yield potential a larger quantity of nitrogen has to be
discharged to
avoid underfertilization.
By means of Figures 8 and 9, the dependence of the N uptake on the product
quality is
explained. Figure 8 illustrates by way of example the dependence of the
optimum N
uptake on the stage of development (similar to the characteristic diagrams in
Figures 6
and 7) and on the product quality of winter wheat, wherein the upper
characteristic in
Figure 8 stands for winter wheat with A quality and the lower characteristic
for C quality
with equal yield level (10 t/ha). Figure 9 shows corresponding characteristics
with a
lower yield level of 6 t/ha.
These characteristics illustrate that the optimum N uptake depends relatively
strongly on
the plant quality, wherein, as expected, a higher fertilizer requirement
exists with a
higher quality (A quality) than with a relatively lower plant quality.
One aspect of the described invention thus consists in collecting the
characteristic
diagrams for the respective plant variety, wherein the optimum nitrogen uptake
preferably has to be detected as a function of the stage of development, the
yield
potential, and also of the plant quality.
CA 02828654 2013-08-29
12
In Figure 9, the quantity of fertilizer to be discharged is also indicated by
way of
example, wherein the current nutrient status Nwr (see Figure 2) ascertained
via the
vegetation index is again started out from, and then the quantity of
fertilizer to be
discharged is ascertained from the characteristic diagrams explained, for
instance, as a
function of the product quality, the stage of development, and the yield
expectation/yield
level. In the embodiment pursuant to Figure 9, the quantity of fertilizer (N)
is calculated
by the next but one stage of development (EC92). Of course ¨ like with the
embodiments pursuant to Figures 6 and 7 ¨ the quantity of fertilizer may also
be
calculated by the next stage of development (here EC65).
In these embodiments, the correction factor is again equal to 1 for
convenience.
As already explained, this correction factor DIMA is composed of the factors D
(duration
of effect of the fertilizer), I (nitrogen immobilization in the soil), M
(nitrogen
mineralization from the soil), and A (utilization rate of the fertilizer).
Examples for the
dependence of the factor DIMA on the stage of development and on the
utilization rate
of the fertilizer A are illustrated in the table pursuant to Figure 10. It
reveals that the
correction factor DIMA has a great influence on the ascertaining of the
quantity of
fertilizer to be discharged since it may fluctuate by more than 30% alone due
to different
fertilizer utilization rates in a stage of development. In the table of Figure
10 it has to be
noted that other cultures have another growth rhythm and another soil root
penetration,
so that the values for the different EC stages change accordingly.
The factor D is highly dependent on the soil root penetration and on the
growth intensity
of the cultivated plant. Small or young plants have small roots and weak
growth.
Accordingly, it takes very long until the fertilizer is incorporated and/or
large quantities of
fertilizer (high nutrient concentrations in the soil) are necessary for a
particular nutrient
uptake in a given time. Earlier stages of development require comparatively
high DIMA
values pursuant to the table in Figure 10.
The factors I and M behave in an opposite manner. At the end of winter, the N
immobilization in the soil is first of all predominant. In the course of
spring, the N
mineralization increases, the N immobilization decreases. In middle European
weather
CA 02828654 2013-08-29
,
,
13
conditions, the maximum of mineralization has been achieved approximately at
the
beginning of June. Then, it decreases again, and immobilization increases. A
second
mineralization maximum is achieved approximately in the third September
decade.
In correspondence with the different growth periods of the different
agricultural
cultivated varieties, different amounts for I and/or M apply for the different
development
phases.
The fertilizer utilization A illustrated in Figure 10 is determined by the
water retention
capacity of the soil and the precipitation conditions. High seepage water
rates occur in
the case of high precipitations and/or low usable field capacity. The usable
field capacity
is again closely correlated with the productivity of the soils (see Figure
10). The quantity
of seepage water determines the so-called unavoidable nitrogen eluviation.
Under the following conditions it may be useful to set A to be greater than 1
(fertilizer
utilization 100%):
a) water protection areas: In water protection areas it may be useful to
dispense with
maximum yields in order to keep the N concentration in the seepage water as
low
as possible. Values of A > 1 are not possible in reality. If such values are
assessed, this will always be related with certain losses of yield.
b) locations with long years of N overfertilization: In Germany, the N
excess balance
lies in the range of approx. 100 kg N/ha. In particular livestock holding
farms have
high N excess balances. Locations with long years of N overfertilization have
a
high nitrogen pool in the soils and a high risk potential of nitrate
discharge. This
high nitrogen pool may also be of disadvantage for the yield of the plants if
too
much N is released in the case of strong soil heating. In order to absorb this
nitrogen pool it may be useful to assess higher values for A. In addition, an
absorption of unnecessary N pools in the soil results in a reduction of the
fertilizing
effort, which also offers economic advantages.
CA 02828654 2013-08-29
14
Figure 11 illustrates by way of example a soil map of a test field, wherein
the sections
with bright contrast level mark areas of low yield and the sections with dark
contrast
level mark areas of high yield. This illustration clearly reveals that, when
considering the
different yield areas, stages of development, plant qualities, etc., the
quantity of fertilizer
to be discharged has to fluctuate strongly in the different subareas. The soil
map is
stored digitally in the data memory 8, and then the subarea-specific
fertilization is
performed as a function of the position of the vehicle discharging the
fertilizer which is,
for instance, detected via GPS, so that the respective subareas are optimally
provided
with fertilizer and hence over or underfertilization may reliably be avoided,
taking into
account the remaining circumstances.
The correction factor DIMA may be less than or greater than 1. In early EC
stages the N
immobilization is predominant ¨ DIMA is then greater than 1. In later EC
stages the
mineralization is predominant ¨ DIMA is then correspondingly less than 1.
Thus, it is, for
instance, also warmer at later stages of development, so that the fertilizer
is converted
more quickly. In earlier stages of development it is vice versa. The duration
of effect of
the fertilizer also depends on EC stages. The partial factor A that stands for
the
utilization rate of the fertilizer is determined by the soil type and the
precipitations.
These two parameters determine essentially the so-called unavoidable N losses.
If the
subarea should be located in a water protection area, this partial factor A
should be
equal or close to 1. In practice, the factor A may also be less, for instance,
0.85.
In accordance with the illustration of Figure 1, the curve progressions
required for the
calculation of the optimum N uptake are stored in the data memory 8 by means
of
tables/characteristics 12, so that the fertilizer requirement N may be
ascertained, for
instance, by the next stage of development in the afore-described manner under
knowledge of the current N uptake, the stage of development, the yield range,
the plant
quality, the correction factor, and the other parameters mentioned above and
included
in the calculation. On the basis of this fertilizer requirement N, the
evaluation unit 6 then
outputs a control signal 14 to a fertilizer distributer 16 and the fertilizer
is then dosed in
correspondence with this control signal 14. This way, only such quantity of
fertilizer is
dosed for every partial agricultural plot which the plants can utilize
productively. In this
CA 02828654 2013-08-29
respect, a different regular curve may be available for every partial
agricultural plot, so
that a highly precise subarea-specific fertilizer discharge is enabled.
The device according to the invention of Figure 1 and the afore-described
method
5 enable an absolute measurement of the N uptake under all environment
conditions, in
particular for all culture varieties. The calculation of the subarea-specific
N fertilizer
requirement is performed under consideration of the current N uptake, the
productivity
of the location, the commercialization direction of the product (product
quality), the
duration of effect of the fertilizer, the N mineralization, and the N
immobilization. This
10 enables a highly precise subarea-specific N fertilizer dosing, taking
into account the
environment conditions. Such a solution is highly superior to the initially
explained prior
art solutions.
The invention has been explained for a determination of the nitrogen
requirement; it
15 may basically also be used for determining other kinds of fertilizer.
A method and a device for discharging fertilizer for agricultural cultivated
plants are
disclosed. According to the invention, the required quantity of fertilizer is
determined
depending on the current nutrient uptake (nutrient status), optimum nutrient
uptake
(nutrient requirement) by the fertilizing deadline, and optimum nutrient
uptake (nutrient
requirement) by the next fertilizing deadline, wherein other influencing
factors are taken
into consideration via a correction factor DIMA.
CA 02828654 2013-08-29
,
16
List of reference numbers:
1 sensor
2 plant
4 measurement signal
6 evaluation unit
8 data memory
characteristic diagram
12 characteristic diagram/table
10 14 control signal
16 fertilizer dosing feeder