Note: Descriptions are shown in the official language in which they were submitted.
CA 02833804 2013-10-21
WO 2012/143562 PCT/EP2012/057395
ANALYZING THE EXPRESSION OF BIOMARKERS IN CELLS WITH
CLUSTERS
FIELD
[0002] The invention relates generally to analyzing and visualizing the
expression of
biomarkers in individual cells, wherein the cells are examined in situ in
their tissue of origin, to
identify and understand patterns of expression that have an association with a
diagnosis, a
prognosis, or a response to treatment of a condition or a disease.
BACKGROUND
[0003] Examination of tissue specimens that have been treated to reveal the
expression of
biomarkers is a known tool for biological research and clinical studies. One
such treatment
involves the use of antibodies or antibody surrogates, such as antibody
fragments, that are
specific for the biomarkers, commonly proteins, of interest. Such antibodies
or antibody
surrogates can be directly or indirectly labeled with a moiety capable, under
appropriate
conditions, of generating a signal. For example, a fluorescent moiety can be
attached to the
antibody to interrogate the treated tissue for fluorescence. The signal
obtained is commonly
indicative of not only the presence but also the amount of biomarker present.
[0004] The techniques of tissue treatment and examination have been refined
so that the
level of expression of a given biomarker in a particular cell or even a
compartment of the given
cell such as the nucleus, cytoplasm or membrane can be quantitatively
determined. The
boundaries of these compartments or the cell as a whole are located using
known histological
stains. Commonly the treated tissue is examined with digital imaging and the
level of different
signals emanating from different biomarkers can consequently be readily
quantified.
[0005] A technique has further been developed which allows testing a given
tissue specimen
for the expression of numerous biomarkers. Generally this technique involves
staining the
1
CA 02833804 2013-10-21
WO 2012/143562 PCT/EP2012/057395
specimen with a fluorophore labeled probe to generate signal for one or more
probe bound
biomarkers, chemically bleaching these signals and re-staining the specimen to
generate signals
for some further biomarkers. The chemical bleaching step is convenient because
there are only a
limited number of signals that can be readily differentiated from each other
so only a limited
number of biomarkers can be examined in a particular step. But with bleaching,
the sample may
be re-probed and re-evaluated for multiple steps. This cycling method may be
used on formalin
fixed paraffin embedded tissue (FFPE) samples and cells. Digital images of the
specimen are
collected after each staining step. The successive images of such a specimen
can conveniently be
kept in registry using morphological features such as DAPI stained cell
nuclei, the signal of
which is not modified by the chemical bleaching method.
[0006] Another approach has been to examine frozen tissue specimens by
staining them
iteratively and photo bleaching the labels from the previous staining step
before applying the
next set of stains. The strength of the fluorescent signal associated with
each biomarker
evaluated is then extracted from the appropriate image.
[0007] There have been efforts to utilize this data to identify patterns of
biomarker
expression. One approach has been to look for such patterns in an entire
tissue specimen and to
binarize the fluorophore signals using a threshold values and generate various
expression profiles
that are then overlaid on an image of the tissue of interest.
[0008] U.S. Patent Application Publication Numbers US2011/0091081, entitled
"Method
and System for Analyzing the Expression of Biomarkers in Cells in Situ in
Their Tissue of
Origin," and U.S. Patent Application Publication Numbers US2011/0091091,
entitled "Process
and System for Analyzing the Expression of Biomarkers in Cells," both describe
research and
development work by General Electric prior to the present invention.
[0009] U.S. Patent Publication No. US2011/0091081 disclosed a process for
acquiring data
for analysis of the patterns of expression of multiple biomarkers in cells in
their tissue of origin.
The level of expression of multiple biomarkers in individual cells or in the
subcellular
compartments of the individual cells in situ in the tissue of origin of the
cells was measured. The
measurements could be conveniently made by treating the tissue specimens with
antibodies or
antibody surrogates specific to the biomarkers of interest. The antibodies or
antibody surrogates
2
CA 02833804 2013-10-21
WO 2012/143562 PCT/EP2012/057395
were directly or indirectly labeled with moieties that give off optical
signals when interrogated
with light of the appropriate wavelength. The tissue specimens were repeatedly
treated, with
each treatment involving antibodies or antibody surrogates specific to
different biomarkers than
those involved in any other treatment and the signal generation from the
immediately previous
treatment was neutralized by optical or chemical means. The amount of each
label bound to the
biomarkers of interest by the antibodies or antibody surrogates was measured
by subjecting the
specimen to light of the appropriate wavelength and digitally imaging the
response. The cells
were conveniently segmented into individual cell units and their subcellular
compartments
(including membrane, cytoplasm and nucleus) were part of the data acquisition.
The database
stored the original measurement values and the location, cell or compartment
of the cell, from
which each measurement is drawn.
[0010] U.S. Patent Publication No. US2011/0091081 also disclosed a process
for analyzing
data representative of the patterns of expression of multiple biomarkers in
cells in their tissue of
origin. The numerical methods used to interrogate the database involved
assigning certain
attributes to each cell of interest based upon the measurements of biomarker
expression levels
and grouping those cells together which have similar biomarker expression
attributes. The
grouping involved an algorithm that groups together those cells which have a
minimum distance
between them in attribute space, i.e. two cells are included in the same group
based on their
distance from each other in n-dimensional space wherein each attribute is
assigned a dimension.
[0011] U.S. Patent Publication No. U52011/0091081 further disclosed that
groups of cells
having similar patterns of expression of certain biomarkers could be a
convenient basis for
investigating associations between a biological condition and a given cell
attribute. Each
grouping could be examined to identify any cell attribute which is associated
with the diagnoses
or prognoses of a given condition or disease or with the response to a given
therapy for a given
condition or disease.
[0012] U.S. Patent Publication No. US2011/0091081 disclosed a process for
displaying one
or more groups of cells having similar patterns of expression of certain
biomarkers. The
groupings could be visualized by an overlay over one or more of the digital
images of a field of
view utilized to make the measurements of the levels of expression of the
biomarkers. The
3
CA 02833804 2013-10-21
WO 2012/143562 PCT/EP2012/057395
overlay could show where in the original image cells occur which possess the
profile of a given
group. Images from different tissue specimens with such overlays could be
compared to
determine if the patterns of cells with one or more profiles, i.e. patterns of
cells which belong to
one or more groups, are indicative of any biological condition or process.
[0013] U.S. Patent Publication No. US2011/0091091 disclosed a process
comprising
measurement of the level of expression of multiple biomarkers in individual
cells of a cellular
sample, storing the measurement of biomarker expression of each cell as a data
point in a
database, and interrogating the database for data points having a similar
pattern of biomarker
expression using a computer algorithm where such similarity is determined by a
numerical
analysis that uses the level of expression of each biomarker as at least a
semi-continuous
variable. The data points with minimum variance were identified and grouped
together. The
group was assigned a new biomarker expression profile represented by a new
data point, which
is based on a central value for each attribute considered by the algorithm,
thus forming a new
data set. The steps were repeated with the new data set until a predetermined
number of groups
was generated.
[0014] U.S. Patent Publication No. U52011/0091091 also disclosed a method
for using the
grouping data for displaying a group of cells having similar patterns of
expression of certain
biomarkers. The method involved creating an image of one or more groups in a
field of view of a
cellular sample, by which each cell in a group was given a visible designation
that they belong to
the same group. The new image was registered to the original image of the
sample to allow the
images of the groups in a field of view to be sequentially overlaid and
analyzed and displayed.
DESCRIPTION OF THE INVENTION
[0015] The present invention addresses one or more limitations of the prior
art. For example,
both U.S. Patent Publication No. U52011/0091081 and U.S. Patent Publication
No.
US2011/0091091 failed to disclose how to select an appropriate number of
groups for a specific
data set to investigate a possible association. U.S. Patent Publication No.
US2011/0091091
discloses generating a predetermined number of groups within a specific data
set, but does not
disclose how to select the number of groups to generate. Without an approach
for selecting
appropriate number of groups for a specific data set, an appropriate number of
groups may not be
4
CA 02833804 2013-10-21
WO 2012/143562 PCT/EP2012/057395
selected. Too few groups may result in cells with important distinctive
characteristics being
grouped together. An association of a subset of the grouped cells may be more
difficult or
impossible to identify. Too many groups will result in the need for
unnecessarily complicated
calculations and analysis. Too many groups may result in over-fitting the data
set such that cells
with no important distinctive characteristics are grouped separately. An
association with two
groups of cells that have no important distinctive characteristics may be more
difficult or
impossible to identify.
[0016] As another example, both U.S. Patent Publication No. U52011/0091081
and U.S.
Patent Publication No. US2011/0091091 disclose limited techniques for
displaying group-related
information. Both publications disclose that the location of cells assigned to
a group can be
flagged within a much larger field of view. Both publications further disclose
that cells within a
much larger field of view can be flagged to indicate their assignment to one
of a plurality of
groups within the same view. Other than their relative location within a much
larger field of
view, however, such displays offers limited insight into the characteristics
of cells within any
particular group. Moreover, the groups resulting from multi-dimensional
similarity grouping of
cell may be inherently difficult for a medical practitioner to understand.
Accordingly,
embodiments taught herein involve distinct processes for analyzing a dataset.
[0017] Features, aspects, and advantages of the present invention will
become better
understood when the following description is read with reference to the
accompanying, wherein:
[0018] FIG. 1 illustrates an exemplary computing environment suitable for
practicing
exemplary embodiments taught herein.
[0019] FIG. 2 illustrates an exemplary method of developing a model for
identifying a
predictive set of clusters of similar cells from a data set in accordance with
embodiments taught
herein.
[0020] FIG. 3 illustrates an exemplary method of displaying cell cluster
features in
accordance with embodiments taught herein.
[0021] FIG. 4 illustrates an exemplary method of applying a model set of
clusters to new cell
profile data in accordance with embodiments taught herein.
CA 02833804 2013-10-21
WO 2012/143562 PCT/EP2012/057395
[0022] FIG. 5 illustrates an exemplary method of developing a model for
identifying a
predictive set of moments of cell features from a data set in accordance with
embodiments taught
herein.
[0023] FIG. 6 illustrates an exemplary method of applying a model set of
moments to new
cell profile data in accordance with embodiments taught herein.
[0024] FIG. 7 is a Receiver Operating Characteristic (ROC) curve for the
cancer/normal
classifier including first two moments of the marker data and the
morphological features.
[0025] FIG. 8 is a ROC curve for the cancer only classifier including the
first two moments
of the marker data.
[0026] FIG. 9 is a variable importance plot for the cancer / normal
classifier including first 2
moments of the marker data and the morphological features.
[0027] FIG. 10 is a variable importance plot for the cancer only classifier
including the first
two moments of the marker data.
[0028] FIG. 11 is a partial dependence plots for the top 4 features in the
cancer / normal
classifier.
[0029] FIG. 12 is a partial dependence plots for the top 4 features in the
high-grade/low-
grade classifier.
[0030] FIG. 13 is a graft showing the variable importance for survival
model of whole
cohort.
[0031] FIG. 14 is graphs of the partial dependence plots for survival model
of whole cohort.
[0032] FIG. 15 is a graph showing variable importance for survival model on
Gleason score
> 0 cohort.
[0033] FIG. 16 is partial dependence plots for survival model of Gleason
score > 0 cohort.
[0034] FIG. 17 is the observed average membrane P13Kp1lOa in invasive
fields of view
(F0Vs) by batch.
6
CA 02833804 2013-10-21
WO 2012/143562 PCT/EP2012/057395
[0035] FIG. 18 is the area under the ROC curve (AUC) for cancer/normal
classifiers based
on varying number of cell cluster features.
[0036] FIG. 19 is the area under the ROC curve for high grade/low grade
cancer classifiers
based on varying number of cell cluster features.
[0037] FIG. 20 is the ROC curve for the 20 cell cluster model of
cancer/normal FOVs.
[0038] FIG. 21 is the ROC curve for the 20 ell cluster model of high
grade/low grade FOVs.
[0039] FIG. 22 is the variable importance for the 20 cluster classifier
model of cancer /
normal FOVs
[0040] FIG. 23 is the variable importance of the 20 cluster classifier
model of high grade/low
grade cancer FOVs.
[0041] FIG. 24 is the partial dependence plots for the top 4 features in
the cancer/normal
classifier.
[0042] FIG. 25 is the partial dependence plots for the top 4 features in
the high grade/low
grade cancer classifier.
[0043] FIG. 26 is the observed FOV-level proportions of cluster 7 cells by
batch (in each
panel) and by cancer vs. normal (labeled true/false). The x-axis is the square
root of the cluster 7
proportion in the FOV.
[0044] FIG. 27 is the signature for cluster 7 of 20. The ball end is of
each horizontal line is
the average in cluster 7; the other end is the average of all 20 clusters.
[0045] FIG. 28 is the performance metrics for survival models on the whole
cohort. RSF
concordance and AUC for classifying death of prostate cancer within 3, 5, and
10 years. The
performance of the null model including only age and Gleason score is shown as
a horizontal
line.
[0046] FIG. 29 is the performance metrics for survival models on the
Gleason score >0
cohort. RSF concordance and AUC for classifying death of prostate cancer
within 3, 5, and 10
7
CA 02833804 2013-10-21
WO 2012/143562 PCT/EP2012/057395
years. The performance of the null model including only age and Gleason score
is shown as a
horizontal black line.
[0047] FIG. 30 is the variable importance for the survival model of the
whole cohort.
[0048] FIG. 31 is the partial dependence plots for the top four features in
the whole cohort
survival analysis.
[0049] FIG. 32 is the variable importance of the survival model on the
Gleason score > 0
cohort.
[0050] FIG. 33 is the partial dependence of the top four features in the 20
cluster model of
the Gleason score > 0 cohort.
[0051] FIG. 34 is the signatures of Clusters 6/6 and 1/20, both indications
of shorter survival
time.
[0052] FIG. 35 illustrates exemplary montages of two cells in a cluster in
accordance with
embodiments taught herein.
[0053] Embodiments taught herein leverage multiplexed biometric images that
are generated
through known techniques, such as such as through a multiplexing staining-
destaining technique.
The images illustrate the expression of biomarkers within individual cells
that enables
comparison of the individual cells to each other. The individual cells are
part of a larger cell
sample. For example, the cell sample may be a group of cells from a cell
culture, a tissue
sample, organ, tumor, or lesion. The individual cells may also be part of a
group of specimens of
similar tissue from different subjects. These groups of cells may represent
one or more disease
or condition models, different stages within a disease or condition model, or
one or more
responses to treatment of a disease or condition.
[0054] Images of each stained field of view are generated through known
techniques, such as
with a digital camera coupled with an appropriate microscope and appropriate
quality control
routines. Automated image registration and analysis may also be used to
quantify the biomarker
concentration levels for individual delineated cells, or even sub-cellular
compartments, such as
8
CA 02833804 2013-10-21
WO 2012/143562 PCT/EP2012/057395
nucleus, cytoplasm, and membrane. The data values resulting from the
multiplexing and image
analysis of cells may be stored alone or in conjunction with data that is the
result of further
analysis. The database preserves the identity of the measurement of strength
of the biomarker
expression including the tissue and the location within the tissue from which
it was drawn. The
location should include the particular cell from which a particular
measurement was drawn and
may also include the compartment, nucleus, cytoplasm or membrane, associated
with the
measurement. The information is stored in a database which may be maintained
in a storage
device 116 or in a network device 126.
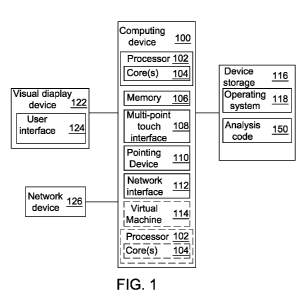
[0055] FIG. 1 illustrates an exemplary computing environment suitable for
practicing
exemplary embodiments taught herein. The environment includes a computing
device 100 with
associated peripheral devices. Computing device 100 is programmable to
implement executable
code 150 for various methods as taught herein. Computing device 100 includes a
storage device
116, such as a hard-drive, CD-ROM, or other non-transitory computer readable
media. Storage
device 116 stores an operating system 118 and other related software.
Computing device 100
may further include memory 106. Memory 106 may comprise a computer system
memory or
random access memory, such as DRAM, SRAM, EDO RAM, etc. Memory 106 may
comprise
other types of memory as well, or combinations thereof. Computing device 100
may store, in
storage device 116 and/or memory 106, instructions for implementing and
processing every
module of the executable code 150.
[0056] Computing device 100 also includes processor 102 and, one or more
processor(s)
102' for executing software stored in the memory 106, and other programs for
controlling system
hardware. Processor 102 and processor(s) 102' each can be a single core
processor or multiple
core (104 and 104') processor. Virtualization may be employed in computing
device 100 so that
infrastructure and resources in the computing device can be shared
dynamically. Virtualized
processors may also be used with executable analysis code 150 and other
software in storage
device 116. A virtual machine 114 may be provided to handle a process running
on multiple
processors so that the process appears to be using only one computing resource
rather than
multiple. Multiple virtual machines can also be used with one processor.
9
CA 02833804 2013-10-21
WO 2012/143562 PCT/EP2012/057395
[0057] A user may interact with computing device 100 through a visual
display device 122,
such as a computer monitor, which may display the user interfaces 124 or any
other interface.
The visual display device 122 may also display other aspects or elements of
exemplary
embodiments, e.g. an icon for storage device 116. Computing device 100 may
include other I/0
devices such a keyboard or a multi-point touch interface 108 and a pointing
device 110, for
example a mouse, for receiving input from a user. The keyboard 108 and the
pointing device
110 may be connected to the visual display device 122. Computing device 100
may include
other suitable conventional I/0 peripherals.
[0058] Computing device 100 may include a network interface 112 to
interface with a
network device 126 via a Local Area Network (LAN), Wide Area Network (WAN) or
the
Internet through a variety of connections including, but not limited to,
standard telephone lines,
LAN or WAN links (e.g., 802.11, Ti, T3, 56kb, X.25), broadband connections
(e.g., ISDN,
Frame Relay, ATM), wireless connections, controller area network (CAN), or
some combination
of any or all of the above. The network interface 112 may comprise a built-in
network adapter,
network interface card, PCMCIA network card, card bus network adapter,
wireless network
adapter, USB network adapter, modem or any other device suitable for enabling
computing
device 100 to interface with any type of network capable of communication and
performing the
operations described herein.
[0059] Moreover, computing device 100 may be any computer system such as a
workstation,
desktop computer, server, laptop, handheld computer or other form of computing
or
telecommunications device that is capable of communication and that has
sufficient processor
power and memory capacity to perform the operations described herein.
[0060] Computing device 100 can be running any operating system 118 such as
any of the
versions of the Microsoft Windows operating systems, the different releases
of the Unix and
Linux operating systems, any version of the MacOS for Macintosh computers,
any embedded
operating system, any real-time operating system, any open source operating
system, any
proprietary operating system, any operating systems for mobile computing
devices, or any other
operating system capable of running on the computing device and performing the
operations
described herein. The operating system may be running in native mode or
emulated mode.
CA 02833804 2013-10-21
WO 2012/143562 PCT/EP2012/057395
[0061] FIG. 2 illustrates a method 200 of developing a model for
identifying a predictive set
of clusters of similar cells from a data set in accordance with embodiments
taught herein. The
method leverages a data set that may be stored, for example, in storage device
116 or network
device 126. The data set comprises cell profile data. The cell profile data
includes multiplexed
biometric images capturing the expression of a plurality of biomarkers with
respect to a plurality
of fields of view in which individual cells are delineated and segmenting into
compartments.
The cell profile data is generated from a plurality of tissue samples drawn
from a cohort of
patients having a commonality. The commonality may be, for example, that the
patients share a
disease or condition. Alternatively, the commonality may be, for example, that
the patients share
a preliminary diagnosis of the same disease or condition. The data set further
comprises an
association of the cell profile data with at least one piece of meta-
information including a field of
view level assessment or a patient-level assessment related to the
commonality. The patient-
level assessment may be, for example, survival time after surgery.
[0062] In 220, a plurality of sets of clusters of similar cells are
generated from the data set.
In some embodiments, one or more processors, such as processors 102, 102',
generate the
plurality of sets of clusters. Each of the plurality of sets of clusters
generated comprises a unique
number of clusters. Each cell is assigned to a single cluster in each of the
plurality of sets of
clusters. Each of the plurality of clusters in each of the plurality of sets
of clusters comprises
cells having a plurality of selected attributes more similar to the plurality
of selected attributes of
other cells in that cluster than to the plurality of selected attributes of
cells in other clusters in the
set.
[0063] Cell similarity is determined at least in part from a comparison of
at least one
attribute of a cell based on the expression of at least one of the plurality
of biomarkers. A cell
attribute used for cluster generation in some embodiments of method 200 is a
nucleus intensity
ratio defined by subtracting half of the sum of the median intensity of the
membrane and the
median intensity of the cytoplasm from the median intensity of the cell
nucleus's expression of at
least one of the plurality of biomarkers. A cell attribute used for cluster
generation in some
embodiments of method 200 is a membrane intensity ratio defined by subtracting
half of the sum
of the median intensity of the nucleus and the median intensity of the
cytoplasm from the median
intensity of the cell membrane's expression of at least one of the plurality
of biomarkers. A cell
11
CA 02833804 2013-10-21
WO 2012/143562 PCT/EP2012/057395
attribute used for cluster generation in some embodiments of method 200 is a
cytoplasm intensity
ratio defined by subtracting half of the sum of the median intensity of the
membrane and the
median intensity of the nucleus from the median intensity of the cell
cytoplasm's expression of at
least one of the plurality of biomarkers. A cell attribute used for cluster
generation in some
embodiments of method 200 is a median intensity of the whole cell. For
example, the nucleus
intensity ratio for each of the plurality of biomarkers may be the basis for
generating sets of
clusters.
[0064] Some embodiments of method 200 determine cell similarity at least in
part from a
comparison of two attributes of a cell based on the expression of at least one
of the plurality of
biomarkers. For example, a nucleus intensity ratio and a membrane intensity
ratio for at least
one of the plurality of biomarkers may be a basis for generating sets of
clusters. Some
embodiments of method 200 determine cell similarity at least in part on a
comparison of three
attributes of a cell based on the expression of at least one of the plurality
of biomarkers. For
example, a nucleus intensity ratio, a membrane intensity ratio, and a
cytoplasm intensity ratio for
at least one of the plurality of biomarkers may be a basis for generating sets
of clusters. Some
embodiments of method 200 determine cell similarity at least in part on a
comparison of four
attributes of a cell based on the expression of at least one of the plurality
of biomarkers. For
example a nucleus intensity ratio, a membrane intensity ratio, a cytoplasm
intensity ratio, and a
median intensity of the whole cell for at least one of the plurality of
biomarkers may be a basis
for generating sets of clusters. Embodiments of method 200 determine cell
similarity from other
combinations of attributes. Some embodiments of method 200 determine cell
similarity from a
comparison of more than four attributes of a cell based on the expression of
at least one of the
plurality of biomarkers.
[0065] Some embodiments of method 200 generate clusters of the similarity
of cells by
applying a K-medians clustering algorithm to the relevant set of cell
attributes. Other
embodiments of method 200 generate clusters of the similarity of cells by
applying a K-mean
clustering algorithm to the relevant set of cell attributes. In some
embodiments, analysis code
150 includes the clustering algorithm.
12
CA 02833804 2013-10-21
WO 2012/143562 PCT/EP2012/057395
[0066] The plurality of sets of clusters in some embodiments is generated
from a normalized
data set. Some embodiments may normalize the measurement values to determine
the mean and
standard deviation of all the measurements associated with a given biomarker
in a given study
and subtract this mean value from each measurement value and then to divide
the resultant
difference by the standard deviation. In some embodiments, the measurement
values are
expressed on a log scale of the intensity of the expression of a biomarker in
the image. A
subtraction in measurement values expressed in the log scale in these
embodiments may
correspond to a division in the original raw measurement scale. Other
embodiments may
normalize the measurement values to determine the median intensity of a whole
cell's expression
for all cells within a batch of measurements and subtract this median value
from each
measurement value in the batch. Such median intensity may apply to the
expression of a specific
biomarker. This normalized or standardized value may be stored in the database
or generated as
part of the processing of the data set in the database.
[0067] The plurality of sets of clusters in some embodiments is generated
from a filtered data
set. Such filtering may be done as a quality control measure. Such filtering
may exclude, for
example, cell profile data related to cells comprising at least one
compartment represented by
fewer than a threshold number of pixels in the multiplexed image. Filtering
may also be done for
reasons beyond quality control. Such filtering may exclude, for example, cell
profile data related
to normal cells from the data set used to generate the plurality of sets of
clusters of similar cells.
[0068] In 230, a proportion of the cells assigned to each cluster within
each of the plurality
of sets of clusters is observed. In 240, the observed proportions are examined
for an association
with the at least one piece of meta-information including the field of view
level assessment or the
patient-level assessment related to the commonality. An association between
observed
proportions and a field of view level assessment or a patient-level assessment
can be derived by
fitting a classification model with the assessment as the outcome and
proportions of observed
clusters as the predictors. Several classification analysis frameworks exist,
including random
forests, neural networks, and logistic regression. For example, an association
between tissue
grade and presence and number of cells observed from a given cell cluster is
derived, in some
embodiments, by fitting a random forest classification model with tissue grade
as the outcome
and proportions of observed clusters as the predictors. An association between
tissue grade and
13
CA 02833804 2013-10-21
WO 2012/143562 PCT/EP2012/057395
presence and number of cells observed from a given cell cluster is derived, in
other
embodiments, by fitting a neural network classification model with tissue
grade as the outcome
and proportions of observed clusters as the predictors. Some embodiments of
method 200 further
comprise examining the observed proportions in the selected set of clusters
for a univariate
association with an assessment. Other embodiments of method 200 further
comprise examining
the observed proportions in the selected set of clusters for a multivariate
association with an
assessment.
[0069] In some embodiments of method 200, the observed proportion of cells
is the observed
proportion of the cells of each field of view assigned to each cluster. In
these embodiments, the
observed proportions are examined for an association with the field of view
level assessment
related to the commonality; and a predictive set of clusters is selected
through on a comparison
of the performance of the field of view level assessment models based on the
plurality of sets of
clusters.
[0070] In some embodiments of method 200, the observed proportion of cells
is the observed
proportion of the cells of each patient assigned to each cluster. In these
embodiments, the
observed proportions are examined for an association with a prognosis of a
condition or a disease
and a plurality of sets of clusters is selected through on a comparison of a
performance of a
patient level assessment model based on the plurality of sets of clusters.
[0071] In some embodiments, the assessments are grouped. In cohorts of
prostate cancer
patients, for example, assessments resulting in a Gleason score of 2 or 3 may
be grouped
together. In these embodiments, the plurality of sets of clusters are examined
for an association
with the grouped assessments related to the commonality of the patient
cohorts. For example,
combinations of attributes can be examined for an association with a low
Gleason score where
samples having a Gleason score of 2 or 3 are grouped together. Field of view
level assessments
of cohorts of other types of cancer may involve assessments of other types of
tumors having their
own relevant tumor grades. Other cancer grading systems include, for example,
the Bloom-
Richardson system for breast cancer and the Fuhrman system for kidney cancer.
Whenever
cancer or other diseases have assessments that may fall within more than two
grades or
categories, similar grades or categories may be grouped in some embodiments.
14
CA 02833804 2013-10-21
WO 2012/143562 PCT/EP2012/057395
[0072] In 250, one of the plurality of sets of clusters is selected based
on a comparison of the
performance of at least one model of the plurality of sets of clusters. In
some embodiments,
visual display device 122 enables the selection to be made. Similar
classification models can be
created for each of the plurality of sets of clusters. In some embodiments,
one or more
processors, such as processors 102, 102', create the classification models.
Each model predicts
an assessment based on cell cluster proportions in the corresponding set of
clusters. In some
embodiments, for example, each model predicts tissue grade based on cell
cluster proportions in
the corresponding set of clusters. The performance of the model of each set of
clusters can be
evaluated by various metrics of predictive performance in a test set of data
not used for
developing the model. Performance metrics that can be used to compare the sets
of clusters based
on the models include sensitivity, specificity, area under the receiver
operating characteristic
curve (also called concordance). The set of clusters to be used may then be
selected based on one
or more of the model performance metrics. For example, in some embodiments,
the set of
clusters associated with the highest concordance is selected. In other
embodiments, the set of
clusters associated with the highest concordance is not selected due to
apparent over-fitting of
the data. The selected set comprising a predictive set of clusters. Some
embodiments of method
200 further comprise comparing the performance of at least one model with
respect to the
number of clusters in each of the plurality of sets of clusters.
[0073] Some embodiments of method 200 further comprise selecting a set of
clusters having
a number of clusters below which a greater number of clusters in the set of
cluster provides a
decrease in performance. Some embodiments of method 200 further comprise
selecting a set of
clusters having a number of clusters above which a greater number of clusters
in the set of
cluster does not offer a statistically significant increase in performance.
Some embodiments of
method 200 further comprise selecting a set of clusters based on a performance
of the at least one
model of the set of clusters corresponding to a performance metric greater
than a pre-defined
threshold, which may be for example a concordance of 0.85 or greater. Some
embodiments of
method 200 further comprise identifying at least one predictive cluster from
the predictive set of
clusters.
CA 02833804 2013-10-21
WO 2012/143562 PCT/EP2012/057395
[0074] Some embodiments of method 200 divide the cell data into training
data and test data,
generate the plurality of sets of clusters of similar cells from training
data, and determine the
performance of the at least one model from the testing data.
[0075] FIG. 3 illustrates an exemplary method 300 of displaying cell
cluster features in
accordance with embodiments taught herein. The method leverages a data set
that may be stored,
for example, in storage device 116 or network device 126. The data set
comprises cell profile
data. The cell profile data includes multiplexed biometric images capturing
the expression of a
plurality of biomarkers with respect to a plurality of fields of view in which
individual cells are
delineated and segmenting into compartments.
[0076] In 320, a first cluster in a plurality of clusters of similar cells
from the data set is
identified. Each cell is assigned to one of the plurality of clusters. Each
cluster in the plurality of
clusters includes cells having a plurality of selected attributes more similar
to the plurality of
selected attributes of other cells in that cluster than to the plurality of
selected attributes of cells
in other clusters in the set. Cell similarity may be judged and clustering may
done by any of the
techniques discussed above with respect to 220.
[0077] In 330, a montage of a first cell in the first cluster is created.
In some embodiments,
one or more processors, such as processors 102, 102', create the montage. The
montage
comprises a portion of at least some multiplexed images describing the first
cell's expression of
each of a plurality of biomarkers. Each portion of the at least some images
includes the first cell
and a small region of interest around the first cell.
[0078] In 340, the montage of the first cell in the first cluster is
displayed to enable a user to
understand a feature of the first cluster. In some embodiments, the montage is
displayed on
visual display device 122. The montage of the first cell displayed in some
embodiments of
method 300 comprises a series of juxtaposed portions of the at least some
images of a field of
view describing the first cell's expression of each of a plurality of
biomarkers. The montage of
the first cell displayed in other embodiments of method 300 comprises a series
of superimposed
portions of the at least some images of a field of view describing the first
cell's expression of
each of a plurality of biomarkers.
16
CA 02833804 2013-10-21
WO 2012/143562 PCT/EP2012/057395
[0079] Some embodiments of method 300 further include creating and
displaying a montage
of a second cell in the first cluster. The montage of the second cell
comprises a portion of at least
some images of a field of view describing the second cell's expression of each
of a plurality of
biomarkers. Each portion of the at least some images includes the second cell
and a small region
of interest around the second cell. FIG. 35 illustrates exemplary montages of
two cells in
accordance with embodiments taught herein. Specifically, FIG. 35 illustrates a
montage of a two
cells, both in cluster 15 of a set of 20 clusters, where the left cell is
taken from a normal field of
view (GLO) whereas the right cell is from a Gleason grade 3 field of view
(GL3). Some such
embodiments of method 300 further include displaying the montage of the first
cell in the first
cluster and the montage of the second cell in the first cluster simultaneously
to enable a user to
understand the feature of the first cluster. Similarly, montages of additional
cells in the first
cluster can be created and displayed.
[0080] FIG. 4 illustrates a method 400 of applying a modeled set of
clusters to new cell
profile data in accordance with embodiments taught herein. The modeled set of
clusters may be
stored, for example, in storage device 116 or network device 126. The modeled
set of clusters
may be developed, for example, through any embodiments of method 200 taught
herein.
[0081] Method 400 involves cell profile data relating to at least one field
of view of at least
one tissue sample from a patient. The cell profile data includes a multiplexed
biometric image
capturing the expression of a plurality of biomarkers. Individual cells in the
field of view are
delineated and segmenting into compartments. The resulting information is also
included in the
cell profile data. The method cell profile data may be stored, for example, in
storage device 116
or network device 126.
[0082] Some embodiments of method 400 further include obtaining the at
least one tissue
sample from the patient. Some embodiments of method 400 further include
staining and
imaging the at least one tissue sample from the patient. Some embodiments of
method 400
further include delineating individual cells of the at least one tissue sample
from the patient
based on multiplexed images capturing the expression of each of the plurality
of biomarkers.
Some embodiments of method 400 further include segmenting individual cells of
the at least one
17
CA 02833804 2013-10-21
WO 2012/143562 PCT/EP2012/057395
tissue sample from the patient into compartments based on multiplexed images
capturing the
expression of each of the plurality of biomarkers.
[0083] In 420, the cells in the field of view of the at least one tissue
sample are each assigned
to a single cluster among a plurality of clusters of similar cells in a
selected set of clusters. In
some embodiments, one or more processors, such as processors 102, 102', assign
the cells to the
appropriate clusters. Each cluster in the selected set of clusters comprises
cells having a plurality
of selected attributes more similar to the plurality of selected attributes of
other cells in that
cluster than to the plurality of selected attributes of cells in other
clusters in the set. Cell
similarity may be judged and clustering may done by any of the techniques
discussed above with
respect to 220. In some embodiments, analysis code 150 includes the clustering
algorithm. The
set of clusters may have been selected by any of the techniques discussed
above with respect to
method 200.
[0084] In 430, a proportion of the cells assigned to each cluster in the
selected set of clusters
is observed. In some embodiments of method 400, the observed proportion of
cells is the
observed proportion of the cells of each field of view assigned to each
cluster. In some
embodiments of method 400, the observed proportion of cells is the observed
proportion of the
cells of each patient assigned to each cluster.
[0085] In 440, the observed proportions are examined for an association
with a diagnosis, a
prognosis, or a response to treatment of a condition or a disease. The
association can be derived
from a known association of the selected set of clusters with at least one
piece of meta-
information including a field of view level assessment or a patient-level
assessment. The
association may become known, for example, through analysis in accordance with
an
embodiment of method 200. In some embodiments, the association is an
association with a
Gleason tissue grade. In some embodiments, the association is an association
with a disease or
condition survival time.
[0086] Some embodiments of method 400 further comprise examining the
observed
proportions in the selected set of clusters for a univariate association that
can be derived from a
known univariate association of the selected set of clusters. Other
embodiments of method 400
further comprise examining the observed proportions in the selected set of
clusters for a
18
CA 02833804 2013-10-21
WO 2012/143562 PCT/EP2012/057395
multivariate association that can be derived from a known multivariate
association of the
selected set of clusters.
[0087] FIG. 5 illustrates a method 500 of developing a model for
identifying a predictive set
of moments of cell features from a data set in accordance with embodiments
taught herein. The
method leverages a data set that may be stored, for example, in storage device
116 or network
device 126. The data set comprises cell profile data. The cell profile data
includes multiplexed
biometric images capturing the expression of a plurality of biomarkers with
respect to a plurality
of fields of view in which individual cells are delineated and segmenting into
compartments.
The cell profile data is generated from a plurality of tissue samples drawn
from a cohort of
patients having a commonality. The commonality may be, for example, that the
patients share a
disease or condition. Alternatively, the commonality may be, for example, that
the patients share
a preliminary diagnosis of the same disease or condition. The data set further
comprises an
association of the cell profile data with at least one piece of meta-
information including a field of
view level assessment or a patient-level assessment related to the
commonality. The patient-
level assessment may be, for example, survival time after surgery.
[0088] In 520, at least one cell feature is calculated based on the cell's
expression of each of
the plurality of biomarkers. Prior to calculating at least one cell feature,
the cell profile data may
be normalized. Some embodiments may normalize the measurement values to
determine the
mean and standard deviation of all the measurements associated with a given
biomarker in a
given study and subtract this mean value from each measurement value and then
to divide the
resultant difference by the standard deviation. In some embodiments, the
measurement values are
expressed on a log scale of the intensity of the expression of a biomarker in
the image. A
subtraction in measurement values expressed in the log scale in these
embodiments may
correspond to a division in the original raw measurement scale. Other
embodiments may
normalize the measurement values to determine the median intensity of a whole
cell's expression
for all cells within a batch of measurements and subtract this median value
from each
measurement value in the batch. Such median intensity may apply to the
expression of a specific
biomarker. This normalized or standardized value may be stored in the database
or generated as
part of the processing of the data set in the database.
19
CA 02833804 2013-10-21
WO 2012/143562 PCT/EP2012/057395
[0089] Prior to calculating at least one cell feature, some embodiments
filter a subset of the
cell profile data from further calculations. Such filtering may be done as a
quality control
measure. Such filtering may exclude cell profile data related to cells
comprising at least one
compartment represented by fewer than a threshold number of pixels in the
multiplexed image.
Filtering may also be done for reasons beyond quality control. Such filtering
may exclude the
expression of each of the plurality of morphological biomarkers from further
calculations.
Accordingly, in some embodiments taught herein, calculating at least one cell
feature involves
calculating at least one cell feature based on the cell's expression of each
of the plurality of non-
morphological biomarkers.
[0090] Some embodiments of method 500 involve calculating two, three, four,
or more cell
features based on the cell's expression of each of the plurality of non-
morphological biomarkers.
In some embodiments, one or more processors, such as processors 102, 102',
calculate the cell
features. In some embodiments, analysis code 150 includes a definition for
each cell feature.
Cell features in some embodiments include a nucleus intensity ratio defined by
subtracting half
of the sum of the median intensity of the membrane and the median intensity of
the cytoplasm
from the median intensity of the cell nucleus's expression of at least one of
the plurality of
biomarkers. Cell features in some embodiments include a membrane intensity
ratio defined by
subtracting half of the sum of the median intensity of the nucleus and the
median intensity of the
cytoplasm from the median intensity of the cell membrane's expression of at
least one of the
plurality of biomarkers. Cell features in some embodiments include cytoplasm
intensity ratio
defined by subtracting half of the sum of the median intensity of the membrane
and the median
intensity of the nucleus from the median intensity of the cell cytoplasm's
expression of at least
one of the plurality of biomarkers.
[0091] In 530, a first moment is calculated for each of the plurality of
fields of view from
each of the cell features. In some embodiments, one or more processors, such
as processors 102,
102', calculate the first moment of the cell feature. Embodiments taught
herein may further
involve calculating a second moment and/or a third moment for each of the
plurality of fields of
view from each of the cell features.
CA 02833804 2013-10-21
WO 2012/143562 PCT/EP2012/057395
[0092] In 540, a plurality of combinations of attributes are examined for
an association with
the at least one piece of meta-information including the field of view level
assessment or the
patient-level assessment related to the commonality. The plurality of
combinations of attributes
at least include the calculated first moments. An association between the
observed first moments
of all biomarkers in a field of view and a field of view level assessment or a
patient-level
assessment can be derived by fitting a classification model with the
assessment as the outcome
and the biomarker first moments as the predictors. Several classification
analysis frameworks
exist, including random forests, neural networks, and logistic regression. For
example, an
association between tissue grade and the observed first moments of all
biomarkers in a field of
view is derived, in some embodiments, by fitting a random forest
classification model with tissue
grade as the outcome and the biomarker first moments as the predictors. An
association between
tissue grade and the observed first moments of all biomarkers in a field of
view is derived, in
other embodiments, by fitting a neural network classification model with
tissue grade as the
outcome and the biomarker first moments as the predictors. In some
embodiments, the
association is an association with the field of view level assessment of the
sample, such a
specific Gleason grade. In other embodiments, the association is an
association with the patient-
level assessment, such as a disease or condition survival time.
[0093] In some embodiments, one or more processors, such as processors 102,
102', examine
the combinations. In embodiments that involve calculating a second moment,
examining in 540
involves examining a plurality of combinations of attributes comprising the
calculated first and
second moments for an association with the at least one piece of meta-
information including the
field of view level assessment or the patient-level assessment related to the
commonality. In
embodiments that involve calculating a third moment, examining in 540 involves
examining a
plurality of combinations of attributes comprising the calculated first and
third moments for an
association with the at least one piece of meta-information including the
field of view level
assessment or the patient-level assessment related to the commonality. Some
embodiments
further involve examining the calculated first, second and third moments.
[0094] In some embodiments, the examining in 540 involves examining the
calculated
moments for a univariate association with the at least one piece of meta-
information including
the field of view level assessment or the patient-level assessment related to
the commonality. In
21
CA 02833804 2013-10-21
WO 2012/143562 PCT/EP2012/057395
some embodiments, the examining in 540 involves examining the calculated
moments for a
multivariate association with the at least one piece of meta-information
including the field of
view level assessment or the patient-level assessment related to the
commonality. In embodiment
of method 500 in which second and/or third moments are calculated, the
calculated moments can
be examined for either a univariate or a multivariate association with the at
least one piece of
meta-information including the field of view level assessment or the patient-
level assessment
related to the commonality.
[0095] In some embodiments, the field of view level assessments are
grouped. In cohorts of
prostate cancer patients, for example, assessments resulting in a Gleason
score of 2 or 3 may be
grouped together. In these embodiments, the plurality of combinations of
attributes are examined
for an association with the grouped field of view level assessment related to
the commonality of
the patient cohorts. For example, combinations of attributes can be examined
for an association
with a low Gleason score where samples having a Gleason score of 2 or 3 are
grouped together.
Field of view level assessments of cohorts of other types of cancer may
involve assessments of
other types of tumors having their own relevant tumor grades. Other cancer
grading systems
include, for example, the Bloom-Richardson system for breast cancer and the
Fuhrman system
for kidney cancer. Whenever cancer or other diseases have assessments that may
fall within
more than two grades or categories, similar grades or categories may be
grouped in some
embodiments.
[0096] In 550, one of the plurality of combinations of attributes is
selected based on a
comparison of the performance of at least one model of the plurality of
combinations of
attributes. In some embodiments, visual display device 122 enables the
selection to be made.
Similar classification models can be created for each of the plurality of
combinations of
attributes. In some embodiments, one or more processors, such as processors
102, 102', create
the classification models. Each model predicts an assessment based on the
corresponding
combination of attributes. In some embodiments, for example, each model
predicts tissue grade
based on a corresponding set of attributes. The performance of the model of
each combination of
attributes can be evaluated by various metrics of predictive performance in a
test set of data not
used for developing the model. Performance metrics that can be used to compare
the
combinations of attributes based on the models include sensitivity,
specificity, and area under the
22
CA 02833804 2013-10-21
WO 2012/143562 PCT/EP2012/057395
receiver operating characteristic curve (also called concordance). The
combination of attributes
to be used may then be selected based on one or more of the model performance
metrics. For
example, in some embodiments, the combination of attributes associated with
the highest
concordance is selected. In other embodiments, the combination of attributes
associated with the
highest concordance is not selected due to apparent over-fitting of the data.
For example, some
embodiments involve selecting a combination of attributes based on a
performance of the at least
one model of the combination of attributes corresponding to a performance
metric greater than a
pre-defined threshold, which may be for example a concordance of 0.85 or
greater. Other
embodiments may involve selecting a combination based on the performance of a
model of that
combination in comparison with performance of models of other combinations.
The selected
combination of attributes comprises a predictive combination of attributes.
Embodiments of
method 500 may further include identifying at least one predictive non-
morphological marker
from the moments model.
[0097] FIG. 6 illustrates a method 600 of applying a model set of moments
to new cell
profile data in accordance with embodiments taught herein. The model set of
moments may be
stored, for example, in storage device 116 or network device 126. The model
set of moments
may be developed, for example, through any embodiments of method 500 taught
herein.
[0098] Method 600 involves cell profile data relating to at least one field
of view of at least
one tissue sample from a patient. The cell profile data includes a multiplexed
biometric image
capturing the expression of a plurality of biomarkers. Individual cells in the
field of view are
delineated and segmenting into compartments. The resulting information is also
included in the
cell profile data. The cell profile data may be stored, for example, in
storage device 116 or
network device 126.
[0099] Some embodiments of method 600 further include obtaining the at
least one tissue
sample from the patient. Some embodiments of method 600 further include
staining and
imaging the at least one tissue sample from the patient. Some embodiments of
method 600
further include delineating individual cells of the at least one tissue sample
from the patient
based on multiplexed images capturing the expression of each of the plurality
of biomarkers.
Some embodiments of method 600 further include segmenting individual cells of
the at least one
23
CA 02833804 2013-10-21
WO 2012/143562 PCT/EP2012/057395
tissue sample from the patient into compartments based on multiplexed images
capturing the
expression of each of the plurality of biomarkers.
[00100] In 620, at least one cell feature is calculated based on the cell's
expression of each of
the plurality of biomarkers. In some embodiments, one or more processors, such
as processors
102, 102', calculate at least one cell feature. In some embodiments, analysis
code 150 includes a
definition for each cell feature. The cell feature may be any cell feature
discussed with respect to
method 500. Some embodiments of method 600 further include calculating a
plurality of cell
features, which may include any combination of cell features discussed with
respect to method
500. The cell features may be calculated from the cell's expression of non-
morphological
biomarkers.
[00101] In 630, a first moment is calculated for each cell feature for each of
field of view. In
some embodiments, one or more processors, such as processors 102, 102',
calculate the first
moment of the cell feature. Like method 500, method 600 may further include
calculating a
second and/or third moment for each cell feature.
[00102] In 640, the calculated first moments is examined for an association
with a diagnosis, a
prognosis, or a response to treatment of a condition or a disease. The
association may be known
from the model set of moments based on the existing data set, for example,
such as described
with respect to method 500. In some embodiments, the association is an
association with a cell
grade, such a specific Gleason grade. In other embodiments, the association is
an association
with a disease or condition survival time.
[00103] In embodiments of method 600 that involve calculating a second moment,
examining
in 640 involves examining the calculated first and second moments for an
association with a
diagnosis, a prognosis, or a response to treatment of a condition or a
disease. In embodiments
that involve calculating a third moment, examining in 640 involves examining
the calculated first
and third moments for an association with a diagnosis, a prognosis, or a
response to treatment of
a condition or a disease. Some embodiments further involve examining the
calculated first,
second and third moments.
24
CA 02833804 2013-10-21
WO 2012/143562 PCT/EP2012/057395
[00104] In some embodiments, one or more processors, such as processors 102,
102', examine
the calculated first moments. In some embodiments of method 600, examining in
640 involves
examining the calculated first moments for a univariate association with a
diagnosis, a prognosis,
or a response to treatment of a condition or a disease. In other embodiments
of method 600,
examining in 640 involves examining the calculated first moments for a
multivariate association
with a diagnosis, a prognosis, or a response to treatment of a condition or a
disease. In
embodiment of method 600 in which second and/or third moments are calculated,
the calculated
moments can be examined for either a univariate or a multivariate association
with a diagnosis, a
prognosis, or a response to treatment of a condition or a disease.
Exemplary Analysis and Visualization
THE DATA SET
[00105] Analysis in accordance with exemplary methods taught herein was
performed using
information derived from tissue samples from a cohort of patients who had
prostate surgery for
cancer. Tissue samples may be defined as tissue cultures and include in vivo
samples. Prostate
tissue samples from 80 people were available for analysis. Of the contributing
population, 62
had prostate cancer. Of those 62 prostate cancer patients, 11 were still alive
at follow-up, 22 had
died of the disease, and the remaining 29 had died of other causes. Table 1
gives population
statistics for the contributing population on age, survival time and
pathologist derived Gleason
score for our data.
[00106] Table 1: Study Population Statistics
=
All(n=80) CaP (n=62) Died of CaP (n=22)
Age 70.9(10.2) 72.1(10.1) 76.2(11.9)
Surviirne 8.76(6.49) 7.64(6.35) 3.73(3.44)
Gleason 0 26(32%) 10(16%) 1(5%)
2-4 4(5%) 4(6%) 0
5-6 13(16%) (?) 12(19%) 1(5%)
7 10(12%) 10(16%) 4(18%)
8-10 20(25%) 20(32%) 13(59%)
Excluded 7(9%) 6(10%) 3(14%)
[00107] Other embodiments of the invention involve tissue samples from a
cohort of patients
sharing a different commonality. For example, one embodiment may involve
tissue samples
CA 02833804 2013-10-21
WO 2012/143562 PCT/EP2012/057395
taken from a cohort of patients to determine if they had another form of
cancer, such as breast
cancer. Another embodiment may involve tissue samples taken from a cohort of
patients to
determine if they had another disease, such as Parkinson's disease. Similarly,
other
embodiments of the invention involve larger or smaller cohorts of patients.
[00108] The tissue samples were processed using fluorescence-based multiplexed
immunohistochemistry. Fourteen biomarkers were used in the analysis. Five of
the 14
biomarkers were used for segmentation and compartmentalization of individual
cells:
NaKATPase, PCAD, DAPI, S6, and Keratin. The remaining markers were AR, pmTOR,
PI3Kp110a, PI3Kp85a, BetaCatenin, EGFR, CleavedCaspase3, pGSK3a, and
CleavedPARP. All
of the biomarkers passed a qualitative staining quality checks.
[00109] Other embodiments of the invention involve different biomarkers.
Similarly, other
embodiments of the invention involve more or fewer biomarkers.
[00110] After autofluorescence removal, illumination correction, and cell
segmentation, the
data included the median intensity for each protein image in the three
compartments of each
segmented cell in each field of view in all subjects. Cells were quality
controlled by applying the
following filters:
1. Cell does not overlap the background (edge areas of the image with
incomplete
marker data due to misregistration)
2. Cell has 2 or fewer segmented nuclei
3. Cell nucleus contains at least 50 pixels
4. Cell cytoplasm contains at least 50 pixels
5. Cell membrane contains at least 50 pixels
[00111] Other embodiments of the invention involve different quality control
features.
Similarly, other embodiments of the invention involve more or fewer quality
control features.
[00112] After imaging, segmentation, and quality control, 54 patient subjects
remained. The
number of fields of view per patient ranged from 6 to 90. Of a total of 1757
fields of view
imaged in the 54 subjects, 1349 fields of view contained sufficient tissue for
analysis. Each of
those 1349 fields of view were successfully graded by the team pathologist
(QL).
26
CA 02833804 2013-10-21
WO 2012/143562 PCT/EP2012/057395
[00113] In particular, Gleason scores were manually recorded for all fields of
view by the
team pathologist (QL) on a scale from 0 to 5. Due to scarcity of Gleason grade
2 data, the grade
2 fields of view were combined with Gleason grade 3 fields of view. Table 2
gives summaries of
the fields of view-level Gleason grades.
[00114] Table 2: FOV-level Gleason Grades
Died of Cancer No Yes
Age (years) 48-72 73-94 48-72 73-94
Survival Time (years) 0-6 7-21 0-6 7-21 0-6 7-21 0-6 7-
21
Spot Gleason Grade
0 64 304 99 29 7 18 63 36
2-3 32 54 36 10 9 3 13 9
4 34 73 24 1 8 11 125 38
11 3 3 0 0 6 120 20
[00115] Other embodiments of the invention may involve different field of view
level
assessments, which may be appropriate to the disease or condition affecting
the relevant cohort
of patients.
[00116] Subject samples were received and analyzed in 5 batches. Table 3 gives
the Gleason
score breakdown relative to the five batches, where entries are counts of
tissue samples. Due to
some subjects being analyzed in multiple batches, Table 3 includes 63 total
tissue samples from
the 54 unique subjects. Nine subjects had multiple tissue samples: 4 of these
subjects were run
in 2 batches, 2 were run in 3 batches, and 2 were run twice in a single batch.
The last subject was
run in 4 different batches.
[00117] Table 3: Subject-level Gleason scores in the 5 batches.
Gleason Score Batch 1 Batch 2 Batch 3 Batch 4 Batch 5 Total
0 1 0 1 4 4 10
2-4 3 0 0 0 1 4
5-6 4 4 3 2 1 14
7 3 1 3 2 0 9
8-10 4 7 9 4 2 26
Total 15 12 16 12 8 63
[00118] Disease-free survival was defined as time between surgery and death or
follow-up.
This measure was treated as right-censored if either the subject was alive at
follow-up or died of
a cause other than prostate cancer. Eighteen of the patient subjects died of
prostate cancer before
27
CA 02833804 2013-10-21
WO 2012/143562 PCT/EP2012/057395
follow-up. The available post-surgery survival time for each patient subjects
was also added to
the data set thereby completing the raw data set.
[00119] Other embodiments of the invention may involve different patient level
assessments,
which may be appropriate to the disease or condition affecting the relevant
cohort of patients.
[00120] Whole cell and compartment median intensities were normalized within
each batch
by subtracting the median of all whole-cell measurements for all cells in all
subjects in the batch.
For the 8 subjects who were analyzed in multiple batches, fields of view were
batch-normalized,
and then subsequently treated the same as subjects analyzed in a single batch.
Other
embodiments of the invention may involve more normalization, less
normalization, different
normalization, or no normalization of the data collected.
ADDITIONAL CELL FEATURES
[00121] Independently for each protein, four cell features were calculated
from the cell level
data. The four features, each defined on a log2 scale, were the median
intensity of the whole
cell, a nucleus intensity ratio, a membrane intensity ratio, and a cytoplasm
intensity ratio. The
three compartment ratios relate the median intensity of the expression of the
nucleus, membrane,
or cytoplasm to the average median intensity of the other two compartments.
The three
compartment ratios were defined as follows:
Rõ=1õ¨(1,n+I, )/ 2
R=1,n¨(I,,+ I, )/ 2
R,=1,¨(1,n+Iõ )/ 2
wherein In, Im, and I, are the median intensity on a log2 scale in the
nucleus, membrane, and
cytoplasm, respectively. The compartment marker expression levels, e.g.
membrane
NaKATPase, were interpreted as the ratio of one compartment to the average of
the other two as
described. Other embodiments of the invention may involve more, less, or
different cell features.
[00122] The data set described above was stored. Any additional cell features
that are
calculated may be added to the stored data set.
28
CA 02833804 2013-10-21
WO 2012/143562 PCT/EP2012/057395
THE CLASSIFICATION AND SURVIVAL MODELS
[00123] Two distinct types of analysis¨moments and cell cluster analysis¨were
conducted.
The results of each type of analysis was then independently compared to
classification and
survival models.
[00124] For the field of view level assessment models, embodiments of the
invention applied
a Random Forest classifier, such as described in L. Breiman's "Random Forests"
in Machine
Learning 45(1), 5-32 (2001), with features described above. The outcome was
two separate
models related to the field of view Gleason grades. The first model
distinguished Gleason grades
(i.e., 2, 3, 4, or 5) fields of view from fields of view with Gleason grade 0.
The second model
distinguished Gleason grades 4 or 5 fields of view from Gleason grades 2 or 3
fields of view. In
second model, fields of view with Gleason grade 0 were removed from analysis.
The random
Forest package (v. 4.5-36) for R (v. 2.11.0) was used with default settings.
Out-of-bag error rates
converged after 200 trees were constructed, so 500 trees were used for the
classifier. During
fitting, data was sampled and stratified by subject (using the strata argument
to random Forest) to
avoid overweighting subjects with an abundance of fields of view. Receiver
Operating
Characteristic (ROC) analysis were conducted by thresholding the predicted
class probabilities
from the out-of-bag predictions. The area under the ROC curve (AUC) was
estimated. Variable
importance results were based on decrease in classification accuracy when data
from a given
variable is scrambled. Variable dependence plots were based on predicted class
log probabilities.
Other embodiments of the invention may use more, less, or different field of
view level
assessment models.
[00125] For the association with survival (a patient-level outcome) an average
was recorded
of the spot-level features over the subject's invasive fields of view (Gleason
score > 0) and a
second average over the subject's normal fields of view. Subjects with no
fields of view of a
particular type had their marker feature data imputed by the population
median.
[00126] For the patient level assessment models, embodiments of the invention
applied a
random survival forest model, such as disclosed in H. Ishwaran et al.'s
"Random Survival
Forests" in the Ann. App. Statist. 2:841-860 (2008). The random Survival
Forest package (v.
3.6.3) for R (v. 2.11.0) was used with default arguments. Five thousand trees
were used to build
29
CA 02833804 2013-10-21
WO 2012/143562 PCT/EP2012/057395
the model. The error metric tabulated was one minus Harrell's concordance
index the probability
that, in a randomly selected pair of subjects, the subject that dies first had
a worse model-
predicted outcome. According to Harrell, F.E. et al. in "Evaluating the Yield
of Medical Tests,"
J. Amer. Med. Assoc. 247:2543-2546 (1982), 50% error is the random model, 0%
is a perfect
model. Other embodiments of the invention may use more, less, or different
patient level
assessment models.
[00127] This error metric was estimated on out-of-bag samples. Variable
importance results
were based on increase in concordance error for a given feature when random
daughter
assignments were used on tree nodes concerning a feature. Partial variable
dependence plots
were based on relative mortality, which is the predicted death rate in the
population as a function
of a given feature observed consistently in every subject in the population.
Further, 3 separate
binary classification models were fit to the survival data by setting a time
threshold at 3, 5, and
years, and classifying whether the patient died of prostate cancer before the
threshold.
MOMENTS ANALYSIS
[00128] In the moments-based analysis of embodiments of the invention, the
four cell level
features were summarized into field-of-view level statistics for association
with the FOV-level
Gleason grades. Based on the population of cells in the field of view, the
mean, standard
deviation, and skewness of all four expression-level features for all 14
markers were recorded.
For association with the FOV grade, all 14 markers, including structural and
target, were
considered as predictors. This resulted in three moments for each of the four
cell features for
each of 14 biomarkers¨for a total of168 FOV attributes. Other embodiments of
the invention
may involve more, less, or different field of view level attributes.
[00129] For example, the following cell morphological features from the single
cell
segmentation may be included in the moments-based models in various
embodiments:
Eccentricity_Cell, Solidity_Cell MajorAxisLength_Cell, MajorAxisAngle_Cell,
Perimeter_Cell,
Area_Cell, Area_Nuclei, Area_Mem, and Area_Cyto.
CA 02833804 2013-10-21
WO 2012/143562 PCT/EP2012/057395
PREDICTING FIELD OF VIEW ASSESSMENTS USING THE MOMENTS ANALYSIS
[00130] During the field of view assessment model building, three options were
considered
with respect to the FOV attributes:
(1) whether to include the features based on the fluorescence data;
(2) whether to include the cell morphological data; and
(3) which order of moments of the fluorescence data to include: mean (m1);
mean and standard deviation (m12); or mean, standard deviation, and
skewness (m123).
[00131] Other embodiments of the invention may consider more, less, or
different options
with respect to the field of view attributes.
[00132] Table 4 gives the performance of the classifiers comparing cancerous
(Gleason 2, 3,
4, or 5) versus normal grade (Gleason 0) fields of view based on different
moments-based feature
sets. Multiple combinations of FOV attributes were tried all including at
least one of the order of
moments (ml, m12, or m123). Some combinations included the fluorescence marker
data, and
some included the cell morphology features. The Area Under the ROC Curve (AUC)
was at least
98% for all models that included at least the first moment of the fluorescent
marker data. The
morphological features increased the AUC only slightly.
[00133] Table 4: Performance of Moments based classifiers on Cancer vs. Normal
Fields of
View
31
CA 02833804 2013-10-21
WO 2012/143562 PCT/EP2012/057395
Moments Fluorescence Morphological
AUC
Included Features Included Features Included
m12 Yes Yes 0.983
m1 Yes Yes 0.982
m123 Yes Yes 0.982
m123 Yes No 0.982
m12 Yes No 0.981
m1 Yes No 0.980
m12 No Yes 0.896
m123 No Yes 0.892
m1 No Yes 0.845
[00134] Table 5 gives the performance of the classifiers comparing high grade
(Gleason 4 or
5) versus low grade (Gleason 2 or 3) cancerous fields of view. Again, AUC
suffered in models
which did not include at least the first moment of the fluorescent marker
data.
[00135] Table 5: Performance of Moments based classifiers on high grade vs.
low grade
Cancer Fields of View
Moments Fluorescence Morphological
AUC
Included Features Included Features Included
m12 Yes No 0.929
m12 Yes Yes 0.928
m1 Yes No 0.928
m123 Yes Yes 0.928
m1 Yes Yes 0.926
m123 Yes No 0.926
m12 No Yes 0.834
m123 No Yes 0.817
m1 No Yes 0.781
[00136] The ROC curves for the top models are given in FIGS. 7 and 8.
[00137] The variable importance plots for the top models are given in FIGS. 9
and 10. In both
cases, the top features are related to NaKATPase, either being quantified
outside the membrane
or having high FOV-level standard deviation. The first morphological feature
in the cancer /
normal classifier is area of the nucleus at 24th on the list.
32
CA 02833804 2013-10-21
WO 2012/143562 PCT/EP2012/057395
PREDICTING PATIENT LEVEL ASSESSMENTS USING MOMENTS ANALYSIS
[00138] During patient level assessment model building, four options were
considered with
respect to the FOV attributes:
(1) whether to include the features based on the fluorescence data;
(2) whether to include the cell morphological data;
(3) which order of moments of the fluorescence data to include: mean (m1);
mean and standard deviation (m12); or mean, standard deviation, and
skewness (m123); and
(4) which fields of view from patient to include: invasive only, normal only,
all,
or the average in invasive tissues minus the average in normal tissues.
[00139] Other embodiments of the invention may consider more, less, or
different options
with respect to the field of view attributes.
[00140] Table 6 shows performance metrics for all the moments-based models
fitted to the
whole patient dataset. In the "FOVs included" column, the code "iv-norm" means
that the
feature used for the subject was the difference between the average seen in
their invasive fields
of view minus the average observed in their normal fields of view. In certain
instances, the
model with only age and Gleason score was fit 11 times and these rows are
highlighted in bold.
The different results for the 11 bold rows are related to random sampling
error inherent to the
random survival forest and random forest procedures.
[00141] The model with marker first moments in invasive fields of view and no
morphological features was the preferred model. Although there are models
which exceed it on
RSF concordance metric, this model has better 3 year and 10 year AUC, and is
only 0.8% less
than the model which includes first and second moments. Further, this model
increases the 5 year
AUC over the null model from 73% to 93%. None of the models strongly exceed
the null
model's RSF concordance.
33
CA 02833804 2013-10-21
WO 2012/143562 PCT/EP2012/057395
[00142] Table 7 gives the same performance metrics on models applied to the
patient dataset
excluding patients with Gleason scores greater than 0. The top model in Table
7, which includes
first moment of marker features in invasive Fields of view, strongly improves
on the null model
in RSF concordance (69% ->81%), 5 year AUC (68% -> 89%), and 10 year AUC (64% -
> 87%).
As in Table 6, the rows of Table 7 highlighted in bold are those for which
only age and Gleason
score were included.
[00143] The partial dependence plots for the top 4 features in the two top
models are given in
FIGS. 11 and 12.
[00144] Table 6: Performance metrics on all moments-based models applied to
the survival
data including all subjects.
34
CA 02833804 2013-10-21
WO 2012/143562 PCT/EP2012/057395
Moments Fluorescence Morphological 125F
FOVs Included 3YR AUC 5YR AUC
10YR AUC
Included Features Included Features Included Concordance
m12 Yes No inv 0.810 0.891 0.938 0.827
m123 Yes No i nv+norm 0.808 0.878 0.901 0.791
m12 Yes No i nv+norm 0.807 0.918 0.916 0.807
m1 Yes No i nv+norm 0.805 0.920 0.934 0.856
m123 Yes Yes inv 0.804 0.904 0.901 0.843
m1 Yes No inv 0.802 0.931 0.932 0.852
m12 Yes Yes inv 0.801 0.876 0.914 0.830
m12 Yes Yes i nv+norm 0.799 0.887 0.901 0.807
m1 Yes Yes i nv+norm 0.799 0.900 0.934 0.836
m123 Yes No inv 0.799 0.889 0.870 0.813
m123 Yes Yes i nv+norm 0.798 0.927 0.883 0.830
m1 Yes Yes i nv 0.793 0.898 0.927 0.856
m1 No No norm 0.776 0.893 0.744 0.706
m123 No No iv-norm 0.769 0.887 0.721 0.705
m1 No No iv-norm 0.769 0.871 0.741 0.711
m12 No No iv-norm 0.767 0.887 0.720 0.692
m1 No Yes iv-norm 0.766 0.869 0.786 0.751
m123 No No inv+norm 0.764 0.891 0.737 0.703
m123 No No inv 0.764 0.878 0.749 0.714
m1 No No inv 0.764 0.867 0.734 0.703
m12 No No inv+norm 0.763 0.882 0.722 0.710
m123 No No norm 0.763 0.878 0.741 0.704
m1 No No inv+norm 0.760 0.869 0.751 0.699
m12 No No inv 0.760 0.878 0.744 0.690
m12 No No norm 0.755 0.880 0.729 0.707
m1 No Yes inv 0.749 0.836 0.766 0.800
m12 No Yes iv-norm 0.735 0.847 0.697 0.740
m123 No Yes iv-norm 0.726 0.824 0.672 0.729
m1 No Yes norm 0.726 0.856 0.652 0.675
m1 No Yes i nv+norm 0.715 0.811 0.760 0.759
m123 No Yes inv 0.712 0.884 0.810 0.746
m12 No Yes inv 0.712 0.833 0.755 0.772
m12 No Yes norm 0.705 0.760 0.648 0.616
m1 Yes No norm 0.703 0.848 0.791 0.781
m123 No Yes i nv+norm 0.700 0.847 0.782 0.751
m12 No Yes i nv+norm 0.693 0.824 0.701 0.721
m1 Yes Yes iv-norm 0.686 0.887 0.793 0.731
m1 Yes Yes norm 0.682 0.773 0.745 0.724
m1 Yes No iv-norm 0.680 0.831 0.784 0.688
m12 Yes Yes iv-norm 0.671 0.822 0.755 0.678
m12 Yes No norm 0.670 0.698 0.777 0.656
m123 No Yes norm 0.668 0.744 0.608 0.559
m12 Yes No iv-norm 0.653 0.840 0.824 0.655
m123 Yes Yes iv-norm 0.651 0.829 0.663 0.649
m123 Yes No norm 0.651 0.744 0.701 0.631
m12 Yes Yes norm 0.627 0.638 0.672 0.622
m123 Yes No iv-norm 0.624 0.804 0.767 0.616
m123 Yes Yes norm 0.607 0.691 0.685 0.639
[00145] Table 7: Performance metrics on all moments-based models applied to
the survival
data including subjects with Gleason score > 0.
CA 02833804 2013-10-21
WO 2012/143562 PCT/EP2012/057395
Moments Fluorescence Morphological 125F
FOVs Included 3YR AUC 5YR AUC
10YR AUC
Included Features Included Features Included Concordance
m1 Yes No inv 0.812 0.869 0.892
0.875
m12 Yes No i nv+norm 0.802 0.883 0.901
0.843
m12 Yes Yes i nv+norm 0.800 0.831 0.870
0.790
m1 Yes No i nv+norm 0.800 0.886 0.897
0.875
m1 Yes Yes i nv 0.798 0.860 0.889
0.879
m123 Yes No i nv+norm 0.792 0.817 0.875
0.810
m12 Yes No inv 0.792 0.851 0.885
0.860
m12 Yes Yes inv 0.790 0.834 0.880
0.834
m1 Yes Yes i nv+norm 0.788 0.880 0.897
0.869
m123 Yes Yes i nv+norm 0.786 0.831 0.839
0.851
m123 Yes No inv 0.786 0.840 0.875
0.825
m123 Yes Yes inv 0.781 0.897 0.892
0.851
m1 No Yes i nv-norm 0.767 0.886 0.702
0.782
m12 No Yes i nv-norm 0.742 0.817 0.647
0.735
m1 No Yes inv 0.720 0.800 0.736
0.790
m123 No Yes iv-norm 0.713 0.814 0.615
0.724
m123 No No iv-norm 0.705 0.849 0.692
0.662
m1 No No norm 0.703 0.851 0.690
0.647
m12 No No iv-norm 0.701 0.857 0.656
0.644
m1 No No iv-norm 0.697 0.854 0.695
0.649
m123 No No inv+norm 0.697 0.849 0.695
0.640
m12 No No inv+norm 0.695 0.834 0.675
0.640
m1 No No inv 0.695 0.837 0.675
0.644
m123 No No norm 0.693 0.849 0.675
0.634
m1 No Yes i nv+norm 0.691 0.749 0.620
0.763
m12 No No inv 0.691 0.857 0.678
0.642
m12 No No norm 0.689 0.840 0.675
0.651
ml No No inv+norm 0.687 0.843 0.673
0.640
m123 No No inv 0.678 0.849 0.691
0.627
m123 No Yes inv 0.676 0.847 0.764
0.763
m12 No Yes inv 0.676 0.771 0.690
0.738
m1 Yes Yes iv-norm 0.654 0.866 0.728
0.696
m123 No Yes i nv+norm 0.650 0.786 0.757
0.744
m12 No Yes i nv+norm 0.649 0.760 0.584
0.642
m12 Yes Yes iv-norm 0.639 0.840 0.695
0.670
m1 No Yes norm 0.629 0.740 0.563
0.653
m123 Yes Yes iv-norm 0.621 0.800 0.650
0.610
m1 Yes No iv-norm 0.617 0.853 0.716
0.664
m123 No Yes norm 0.610 0.637 0.464
0.509
m12 No Yes norm 0.606 0.709 0.486
0.614
m12 Yes No iv-norm 0.594 0.820 0.728
0.677
m1 Yes No norm 0.588 0.740 0.739
0.698
m1 Yes Yes norm 0.579 0.691 0.690
0.657
m123 Yes No norm 0.569 0.667 0.685
0.700
m123 Yes No iv-norm 0.561 0.777 0.677
0.565
m123 Yes Yes norm 0.548 0.649 0.647
0.631
m12 Yes No norm 0.532 0.660 0.678
0.608
m12 Yes Yes norm 0.518 0.617 0.611
0.584
[00146] In the whole cohort analysis, PI3Kp110a, PCAD, and pGSK3a were the
most
predictive of the markers, as shown in FIG. 13. FIG. 14 shows that stronger
membrane
36
CA 02833804 2013-10-21
WO 2012/143562 PCT/EP2012/057395
abundance of PI3Kp110 and pGSK3a, as well as low whole cell PCAD abundance,
may be
associated with shorter survival. In the cohort of subjects with Gleason score
greater than 0, the
list of important features was similar, as seen in FIGS. 15 and 16.
[00147] All top features were checked for obvious batch effects, none were
found. See for
example FIG. 17 where only a slight differential is seen in batch 1.
CELL CLUSTER ANALYSIS
[00148] In the cell clusters analysis of embodiments of the invention, cells
were clustered into
K groups based on the 14 markers and the 4 cell-level features, a 56
dimensional marker space,
using K-medians clustering on 20,000 cells sampled from the whole cohort
stratified by subject.
The stepFlexclust function of flexclust library (v. 1.3-1) for R (v. 2.11.0)
was run with 20
replicates assuming K ranged between 2 and 50. Then every cell in the whole
cohort was
associated with one of the K clusters by computing distances from the cluster
centroids. This was
accomplished using the predict function in flexclust. FOV-level cell cluster
features were then
defined as the proportion of cells in the FOV belonging to each of the K
clusters. Separate
classification and survival models were fit for each of the sets of K groups
generated. Other
embodiments of the invention may use a different clustering algorithm, may
apply the algorithm
to a different set of cell attributes, may specify a different range of
clusters sets to generate, or
may identify specific numbers of clusters sets to generate.
PREDICTING FIELD OF VIEW LEVEL ASSESSMENTS USING CLUSTER ANALYSIS
[00149] The performance of both the cancer versus normal field of view and the
high grade
versus low grade cancer field of view classifiers stabilized after including
approximately 20 cell
clusters, as seen in FIGS. 18 and 19. At 20 cell clusters, the normal versus
cancer classifier
AUCs were 96.1% and 95.7% in training and test sets, respectively. At 20 cell
clusters, the high
grade versus low grade cancer classifier AUCs were lower: 88.0% in training
and 88.7% in test
sets. Morphological features were not included in these models.
[00150] The ROC curves for the 20 cell cluster models are given in FIGS. 20
and 21. In both
classifiers, cancer versus normal and high versus low grade cancer, the single
cluster 7 stands out
as being highly predictive of FOV grade, as shown in FIGS. 22 and 23. Cluster
7 is an indication
37
CA 02833804 2013-10-21
WO 2012/143562 PCT/EP2012/057395
of normal tissue as are the rest of the top 4 features in both models; see
FIGS. 24 and 25. The
pattern of lower abundance of cluster 7 cells in higher grade cancers was
evident in all 5 batches,
see FIG. 26.
[00151] The FOV proportions of cluster 7 cells were checked for batch effects
and none were
found.
[00152] The signature of cluster 7 is plotted in FIG. 27. Significant
features of this cluster are
increased nuclear and membrane abundance of both NaKATPase and beta Catenin
with
associated decrease in cytoplasmic abundance of both.
PREDICTING PATIENT LEVEL ASSESSMENTS USING CLUSTER ANALYSIS
[00153] In the whole cohort analysis, only later time survival prediction can
be improved
somewhat over the null model with age and Gleason score. This is shown in FIG.
28 where the
random survival forest concordance (RSF_CONC) and the AUC for classifying
death of prostate
cancer within 3, 5 and 10 years (AUC_*YR) are plotted vs. the number of
clusters included in
the model. Inclusion of invasive versus normal FOVs is differentiated by color
in the figure.
Models which may perform better than the null model are those which include
invasive features,
as these models showed improve survival predictions at 5 years and beyond. In
general, 6
clusters will provide good performance.
[00154] In the Gleason score greater than 0 cohort analysis, survival time
concordance metric
and 5- and 10-year death classification rates are better than the null model
when including at
least 5 cell clusters, see FIG. 29. Survival time concordance rises until
approximately 20 clusters
are included, whereas 5 year death is best classified with as few as 5
clusters. Including features
from normal FOVs does not generally improve model performance.
[00155] The variable importance plot for the model which included 6 clusters
in invasive
tissues applied to the whole cohort, in FIG. 30, shows that cluster 6 is much
more predictive than
any of the other 5 clusters in the model. Cluster 6 is associated with shorter
survival time, as
shown in FIG. 31.
38
CA 02833804 2013-10-21
WO 2012/143562 PCT/EP2012/057395
[00156] In the 20 cluster analysis of the Gleason score greater than 0 cohort,
two clusters are
relatively important in predicting survival time: 7 and 1. FIG. 32 is the
variable importance of the
survival model on the Gleason score greater than 0 cohort. Cluster 7 is
associated with longer
survival time, whereas cluster 1 is associated with shorter survival time.
FIG. 33 is the partial
dependence of the top four features in the 20 cluster model of the Gleason
score greater than 0
cohort
[00157] All top clusters were checked for batch effects and none were found.
[00158] The signatures of clusters 6/6 and 1/20 are given in FIG. 34. These
two clusters show
similar signatures which are marked by accentuated localization in NaKATPase,
S6,
BetaCatenin, PCAD, PI3Kp110a, and Keratin. They also show somewhat low whole
cell
NaKATPase, BetaCatenin, and Keratin.
[00159] While only certain features of the invention have been illustrated and
described
herein, many modifications and changes will occur to those skilled in the art.
It is, therefore, to
be understood that the appended claims are intended to cover all such
modifications and changes
as fall within the true spirit of the invention.
[00160] Although the claims recite specific combinations of limitations, the
invention
expressly encompasses each independent claim by itself and also in conjunction
with any
possible combination of limitations articulated in the related dependent
claims except those that
are clearly incompatible. For example, the invention expressly encompasses
independent claim
1 in combination with the limitations recited in each of the related dependent
claims except only
one of the two dependent claims requiring the application of a distinct
clustering algorithm.
39