Note: Descriptions are shown in the official language in which they were submitted.
CA 02866892 2014-09-09
WO 2014/003913 PCT/US2013/041806
PORE PRESSURE MEASUREMENT IN LOW-PERMEABILITY AND
IMPERMEABLE MATERIALS
Background
[0001] One of the outstanding problems in the study of shale gas (SG)
formations is the
in-situ pressure of the gas. This parameter is proportional to the amount of
gas that can be
recovered from the formation and thus has important economic implications.
Conventional
methods such as drawing fluid at known pressure differentials using a sampling
tool are not
effective in cases when the permeability is too low, such as in shale gas and
other formations
where the pores are generally not interconnected. Currently no method is
available for
making this measurement in either the borehole or the laboratory.
Summary
[0002] This summary is provided to introduce a selection of concepts that
are further
described below in the detailed description. This summary is not intended to
identify key or
essential features of the claimed subject matter, nor is it intended to be
used as an aid in
limiting the scope of the claimed subject matter.
[0003] According to some embodiments, a method is described for determining
pore
pressure in a porous formation, such as shale gas or tight gas, having
substantially
disconnected pore spaces. The method includes: processing a first signal
depending on pore
pressure at a first location in the formation at which the pore spaces are not
substantially
interconnected; processing a second signal depending on pore pressure at a
second location in
the formation at which the pore spaces are substantially interconnected;
inducing a known
change in pressure (e.g., by injecting fluids) at the second location while
processing a third
signal depending on pore pressure; and determining the pore pressure
associated with the first
location based on a comparison involving the first, second and third measured
signals and the
known pressure change.
[0004] According to some embodiments, a nuclear magnetic resonance
instrument is
used to measure the signals from which gas peak intensity can be calculated
and compared to
CA 02866892 2014-09-09
WO 2014/003913 PCT/US2013/041806
facilitate the computation of gas pressure at the first location. According to
some
embodiments, the signal measurements are performed using a borehole tool, such
as an NMR
logging tool, Nuclear logging tool, or sonic logging tool, deployed in a
wellbore. In such
cases the borehole tool can be deployed for example using a wireline or a
drillstring. In a
borehole, the second location may be artificially perturbed such as by the
drilling activity,
such that a plurality of micro fractures are formed which interconnect the
pore spaces.
[0005] According to some embodiments, when using a borehole tool, the tool
can be of a
type that allows for multiple depths of investigation while positioned in the
wellbore at a
single position. In such cases the measurement at the second (perturbed)
location can be at
shallower depths that have drilling-induced micro fractures, and the first
(unperturbed)
location can be at greater depths that do not have such fractures. According
to other
embodiments the tool uses a single depth of investigation and is moved to
multiple locations
(depths) within the borehole to obtain the measurements used for the pore
pressure
calculation.
[0006] According to some embodiments, the induced pressure change and
measurement
is used to derive a relationship between pore pressure and the measured
signal, which is then
used as a calibration curve for determining the pore pressure. According to
some other
embodiments, the pressure is increased so as to obtain a match or equivalent
value based on
the measurements.
[0007] According to some embodiments, a system is described for determining
pore
pressure in a porous formation, such as shale gas or tight gas, having
substantially
disconnected pore spaces. The system includes a borehole deployable
measurement tool,
such as an NMR tool, a nuclear tool, or a sonic tool, configured to measure
signals that
depend on pore pressure at locations in the formation, including a first
location that is
unperturbed having substantially disconnected pore spaces and a second
location that is
perturbed with a plurality of fractures that interconnect at least some of the
pore spaces; a
pressure inducer, such as gas injection system, configured to induce a known
pressure change
at the second location; and a processing system programmed and configured to
calculate a
pore pressure associated with the first location based at least in part on a
comparison of values
- 2 -
CA 02866892 2014-09-09
WO 2014/003913 PCT/US2013/041806
derived from processing at the first and second locations and the known
induced pressure
change.
[0008] According to some embodiments, a method is described for determining
pore
pressure within a porous material having substantially disconnected pore
spaces. The method
includes: processing a first signal depending on pore pressure in an
unperturbed portion of the
porous material at which the pore spaces are predominantly disconnected from
each other;
processing a second signal depending on pore pressure in a perturbed portion
of the porous
material at which a plurality of fractures interconnects at least some of the
pore spaces;
inducing a known change in pressure in the perturbed portion of the porous
material;
processing a third signal depending on pore pressure in the perturbed portion
of the material
while under the induced pressure change; and determining a pore pressure
associated with
unperturbed porous material based at least in part on a comparison involving
the first, second
and third measured signals and the known pressure change. According to some
embodiments,
the method is performed in one or more surface facilities and the porous
material is a core
sample of a subterranean formation brought to the surface.
[0009] According to some embodiments, an example of a porous formation
having
substantially disconnected pore spaces is a formation material having a
permeability below
0.1 mili-Darci.
Brief Description of the Drawings
[0010] The subject disclosure is further described in the detailed
description which
follows, in reference to the noted plurality of drawings by way of non-
limiting examples of
embodiments of the subject disclosure, in which like reference numerals
represent similar
parts throughout the several views of the drawings, and wherein:
[0011] Fig. 1 is a flow chart showing aspects of using NMR properties of a
shale gas
formation to determine the gas pressure, according to some embodiments;
[0012] Figs. 2A and 2B show an NMR tool, having multiple depths of
investigation
shells, which is being used in a borehole to determine gas pressure in a shale
gas formation,
according to some embodiments
- 3 -
CA 02866892 2014-09-09
WO 2014/003913 PCT/US2013/041806
[0013] Fig. 3 is a graph showing amplitude versus T2 or Ti plots for a
shallow shell and
a deep shell, according to some embodiments;
[0014] Fig. 4 is a plot showing an example of a derived calibration curve
relating gas
peak intensity to gas pressure, according to some embodiments;
[0015] Fig. 5 is a graph showing plots of gas peak intensity versus depth
of investigation,
according to some embodiments;
[0016] Fig. 6 shows an implementation of an inject-measure approach for
delivering gas
to downhole location, according to some embodiments;
[0017] Fig. 7 is a flow chart showing aspects of deriving connate gas
pressure of
subterranean formation material from a sample of the formation brought to the
surface,
according to some embodiments;
[0018] Fig. 8 is a diagram showing the use of 2D plots to separate the NMR
peak into its
components;
[0019] Fig. 9 shows a system for determining gas pressure in low
permeability
subterranean formation such as shale gas, according to some embodiments;
[0020] Fig. 10 is a flow chart showing aspects of a method for determining
gas pressure
in low permeability subterranean formations such as shale gas, according to
some other
embodiments.
Detailed Description
[0021] The particulars shown herein are by way of example and for purposes
of
illustrative discussion of the embodiments of the subject disclosure only and
are presented in
the cause of providing what is believed to be the most useful and readily
understood
description of the principles and conceptual aspects of the subject
disclosure. In this regard,
no attempt is made to show structural details of the subject disclosure in
more detail than is
necessary for the fundamental understanding of the subject disclosure, the
description taken
with the drawings making apparent to those skilled in the art how the several
forms of the
- 4 -
CA 02866892 2014-09-09
WO 2014/003913 PCT/US2013/041806
subject disclosure may be embodied in practice. Further, like reference
numbers and
designations in the various drawings indicate like elements.
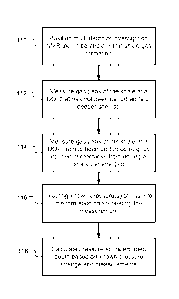
[0022] Fig. 1 is a flow chart showing aspects of using NMR properties of a
shale gas
formation to determine the gas pressure, according to some embodiments. In
block 110 an
NMR tool is positioned in a borehole within a shale gas formation. According
to some
embodiments, the NMR tool is of a type that provides multiple depths of
investigation from a
single tool position in the borehole. For example, according to some
embodiments, a multi-
frequency NMR tool such as Schlumberger's MR Scanner tool is used to provide
multiple
depths of investigation. In block 112 the NMR tool is used to make
measurements of the gas
peak of the shale at a depth and location that has not been perturbed by the
drilling process.
According to various embodiments, any combinations of the T2, Ti, or diffusion
can be used
as these depend on gas pressure. Ordinarily, the dependence of the gas peak
intensity on gas
pressure is not yet known, and therefore the pressure cannot yet be estimated.
In block 114,
according to some embodiments, the same NMR measurement used in block 112 is
performed
at shallower depths of investigation (DOI) where part of the gas has escaped
due to the
drilling process, for example. The perturbation due to drilling can be, for
example, induced
micro cracks. At the shallower DOI, where the formation has been perturbed,
the gas
pressure ordinarily will be reduced which leads to less gas peak intensity in
the NMR
measurement. In block 116, gas is then injected into the formation at known
pressure(s) and
the NMR measurement is repeated. The gas peak in micro cracked shale samples
will
increase depending on the gas pressure. Since both the gas pressure and gas
peak intensity at
the shallower DOI shell(s) are known, a calibration curve can be developed and
used to
estimate the pressure of the connate gas in the shale formation, as shown in
block 118.
[0023] In shales, the relaxation time (Ti or T2), is fast compared with
conventional
formations. This is due to the following reasons: (1) the porosity in shale
gas formations can
be low (1-15 pu) forcing gas molecules to be in close contact with the pore
wall and relaxing
faster; (2) the pore wall contains a large amount of clay and clays are known
to have relatively
large concentration of paramagnetic ions causing T2 decay to be faster than
conventional
formations (large relaxivity); and (3) some shales have the hydrocarbon source
(Kerogen)
embedded in the pores and part of the gas is trapped inside the Kerogen but is
in dynamic
- 5 -
CA 02866892 2014-09-09
WO 2014/003913 PCT/US2013/041806
equilibrium with the gas that is filling the pore. Kerogen itself has a very
short relaxation
time causing the magnetization of adsorbed or trapped gas to decay fast.
[0024] Although the relaxation time of the gas in shale gas formations is
shorter than
normal, it is still a measureable quantity by NMR logging tools. Further, the
gas peak can be
separated from the bound water peak. Although separating the gas and water
peak is not
necessary for the successful implementation of many of the embodiments
described herein,
having a measureable signal by NMR logging tools is still desirable in that it
does not
necessitate the use of NMR tools having faster inter-echo time (TE).
[0025] The T2 peak for gas is not commonly used for estimating the gas
pressure because
the drilling process tends to create micro cracks in the shale layer adjacent
to the borehole
wall allowing some of the gas to escape. In addition, a calibration curve to
relate the gas peak
to the gas pressure does not exist. Furthermore, as mentioned above the gas
peak may overlap
with the water peak, for example, and in some embodiments described herein it
is desirable to
avoid separating these peaks.
[0026] According to some embodiments an NMR logging tool with at least two
depths of
investigation (DOIs) is used, such as described in Fig. 1. The deeper DOI can
be used to
sample the shale gas that has not been perturbed by the drilling process and
contains the gas at
connate pressure. On the other hand the shallow DOI can be used to sample
shale gas that has
been perturbed by the drilling process, and has lost at least part of its gas.
The methods
described herein according to many embodiments, rely on micro cracks that have
been formed
in the shallow sample to inject gas back into the SG and measure its NMR
response.
[0027] Figs. 2A and 2B show an NMR tool having multiple depths of
investigation,
which is being used in a borehole to determine gas pressure in a shale gas
formation,
according to some embodiments. In Fig. 2A, NMR tool 226 is shown deployed in a
borehole
210 penetrating a subterranean shale gas formation 202. The NMR tool 226 in
this case is a
wireline deployed tool, although according to other embodiments an LWD
deployed tool can
also be used. According to some embodiments, the tool 226 is an MR Scanner
tool, from
Schlumberger. The MR, Scanner tool, for example has a shell 222 with 4" depth
of
investigation ("Shell 4") and another shell 220 with 1.5" depth of
investigation (Shell 1). The
- 6 -
CA 02866892 2014-09-09
WO 2014/003913 PCT/US2013/041806
shale gas in the range of investigation of shell 220 (Shell 1) is within a
perturbed zone 204
close to the borehole wall 212. Zone 204 is expected to be at least partly
damaged by the
drilling process. The micro cracks formed as a result of this provide a path
for the gas to
escape from zone 204. The shale gas in the range of investigation of shell 222
(Shell 4),
however, is outside of the perturbed zone 204 and is not expected to have gas
loss since that
region is far enough away from the borehole wall 212, and the drilling damage,
if any, is not
significant. As a result the shell 222 (Shell 4) should provide a larger gas
peak than shell 220
(Shell 1). Assuming the gas peak in shell 220 (Shell 1) is substantially
affected by the drilling
process and shell 222 (Shell 4) is not, the method described herein can be
used to calculate
gas pressure in the location of shell 222 (Shell 4) which is outside the
perturbed zone 204.
Note that although the boundary of the perturbed zone 204 is shown sharply in
Figs 2A and
2B for clarity, in practice the boundary will be more irregular and less well
defined in some
areas. Fig. 2B is a cross-section view along the line A-A' in Fig. 2A, of the
NMR tool 226
deployed in the borehole 210.
[0028] Fig. 3 is a graph showing amplitude versus T2 or Ti plots for a
shallow shell and
a deep shell, according to some embodiments. The shallow and deep shell plots
410 and 412
can be, for example the results of measurements of shells 220 and 222,
respectively, as shown
in Figs. 2A and 2B.
[0029] Having the gas peak under connate conditions in the deep shell (such
as shell 222
in Figs. 2A and 2B) provides a measurement that can be used to estimate gas
pressure.
However, the gas peak is strongly dependent on the formation and structure of
the shale,
including factors such as the nature and concentration of clays, the amount
and properties of
Kerogen, etc., which in general are not known. As a result, it is difficult to
relate the gas peak
intensity to the gas pressure. This is true even if the contribution from
other peaks to the gas
peak have been removed. The techniques described herein, according to some
embodiments,
provide a method for generating a calibration curve that relates the gas peak
to the gas
pressure without having to account for the overlapping peaks, type and amount
of clays, and
Kerogen.
- 7 -
CA 02866892 2014-09-09
WO 2014/003913 PCT/US2013/041806
[0030] The described techniques according to some embodiments take
advantage of the
micro cracks that have been induced by the drilling process, which are the
reason why at least
some of the gas has escaped from the shallow shell. Gas can be injected into
the shale to
restore the lost gas from that part of shale gas formation that falls in the
depth of investigation
of the shallow shell (such as shell 220 in Figs. 2A and 2B). While monitoring
the gas peak
with the NMR tool, the gas pressure can be varied until the gas peak from
shallow shell (shell
220 in Figs. 2A and 2B) becomes equal to that from the deeper shell (shell 222
in Figs. 2A
and 2B). The pressure of the gas in this case is known and is equal to the
pressure of the
connate shale gas. Although the use of shells 1 and 4 of Schlumberger's MR
Scanner tool are
described herein for demonstration purposes, according to some embodiments
other logging
tools can be used. Note that the peak intensity for different shells may not
have the same
sensitivity but they may be calibrated to remove the effect. In particular,
once the spectra are
represented in units of porosity the effect due to different DOIs on NMR
intensity has already
been removed. Note also, that according to some embodiments, one way of
comparing the
peaks is to compare the area under these peaks.
[0031] Fig. 4 is a plot showing an example of a derived calibration curve
relating gas
peak intensity with gas pressure, according to some embodiments. The
calibration curve 410
is shown. According to some embodiments, gas pressure is increased
incrementally and the
corresponding gas peak is measured. Using this data a calibration curve can be
generated by
plotting these parameters. According to some embodiments, the gas pressure is
increased to a
high enough level such that at least one data point has a gas pressure higher
than the connate
pressure. The calibration curve 410 may be linear but in general it can
deviate from linearity.
The derived calibration curve, such as shown in Fig. 4 has additional uses.
For example,
according to some embodiments during the production phase, this curve can be
used to
estimate the remaining gas reserve. Accordingly, if at some point in time
during production
phase a new NMR measurement is performed, the gas peak intensity can be used
in Figure 4
to estimate the current gas pressure.
[0032] To establish that the deeper NMR shell samples DOIs were in fact at
locations
where the gas is in its connate state, one may take advantage of the
intermediate depth shells.
Fig. 5 is a graph showing plots of gas peak intensity versus depth of
investigation, according
- 8 -
CA 02866892 2014-09-09
WO 2014/003913 PCT/US2013/041806
to some embodiments. When the gas peak intensity is plotted versus the DOI of
the shells, it
is expected to show smaller peak intensities at shallower shells and greater
peak intensities at
deeper shells. In the case of Fig. 5, gas peak intensity is plotted for four
depths, 510, 512, 514
and 516. The connate DOI is when this curve approaches an asymptotic, constant
value. In
the example shown in Fig. 5, the DOI 4 plotted at point 516, is clearly
indicated to be at
connate gas pressure. In general NMR tools with larger DOI may be used to meet
this
condition. If experience shows that a 4-inch DOI, for example, is not
sufficient, the DOI can
be increased by reducing the frequency of operation, as is known in the art of
designing NMR
logging tools. Any reduction in signal to noise ratio can be compensated by a
station log
where one signal averages the NMR signal for a longer period of time.
[0033] Fig. 6 shows an implementation of an inject-measure approach for
delivering gas
to downhole location, according to some embodiments. In this case two packers
610 and 612
are set in the borehole 210 above and below the zone of interest. The packers
610 and 612
allow the NMR tool 226 and a gas line 620 to both be in the zone of interest.
Initially, the
NMR tool 226 measures at multiple shells as a function of depth into the
formation 202. The
data is used to establish at least one shell with connate gas pressure. Next,
gas is introduced
at a known pressure (e.g., using a pressure gauge 622) and while the gas
pressure is
maintained, the NMR measurements are performed and recorded. The process is
then
repeated at other, higher pressures and is continued until the shells with
shallower DOI give
the same or higher intensities.
[0034] Care should be taken not to use excessive gas pressure that might
cause new
micro cracks in the formation. However, once the measurements are finalized
and a
satisfactory gas pressure is measured, according to some embodiments, the gas
pressure is
further increased far enough above the connate gas pressure to cause
fracturing the formation
if so desired. According to some embodiments, this process is done in steps
and at each step
an NMR measurement is performed to learn about the behavior of the shale gas
at high
pressures and/or to generate a correlation between such mechanical events and
the NMR
signal.
- 9 -
CA 02866892 2014-09-09
WO 2014/003913 PCT/US2013/041806
[0035] Fig. 7 is a flow chart showing aspects of deriving connate gas
pressure of
subterranean formation material from a sample of the formation brought to the
surface,
according to some embodiments. In block 708 an NMR measurement in the borehole
is made
at a DOI believed to be unperturbed. The gas peak from this measurement will
be compared
with laboratory measurements. In block 710, a core from the well bore or the
sidewall can be
obtained and brought to the surface. In block 712, the core plug can be cut
and placed in a
high-pressure and temperature container so that a desired gas pressure can be
applied to it
while the downhole pressure and temperatures are maintained on the core plug.
The container
should be made of materials that allow NMR measurement to be done while
holding the high
pressure. Materials such as fiberglass or Peek, or any other suitable non-
conductive material
can be used for this purpose. In block 714, an NMR measurement is performed on
the core
plug at different applied gas pressures and gas peak intensity is monitored to
match the
corresponding intensity found downhole. Alternatively the gas pressure can be
varied
incrementally and a calibration curve similar to that shown in Fig. 4 is
generated. In block
716, the measurements and/or the calibration curve is used to estimate the
connate gas
pressure. In this approach the measurement should be done under the same
temperature and
pressure as those downhole. In addition, if the laboratory instrument used to
measure NMR is
not the same as the downhole tool a sensitivity calibration between the two
instruments
should be done so that the two sets of data can be compared meaningfully.
[0036] According to some other embodiments, a combination of T2, Ti, and
Diffusion
measurements is used. These parameters can be used in parallel to complement
each other.
For example, Ti from shallow shell and deep shell are compared as a function
of gas pressure
to determine a connate gas pressure. The process is done on T2 as well and the
results are
compared to build confidence.
[0037] The techniques described herein are particularly useful when some
mud filtrate
has entered or invaded the pore space of the shale gas formation. In this case
the contribution
of the water peak to the apparent gas peak is not the same between different
shells. The shell
with shallowest DOI may have been affected more. In such cases, separating the
apparent gas
peak to the water and gas components eliminates the interfering effect of
invading water as
well as the connate water and improves the accuracy of gas pressure
prediction. This known
- 10 -
CA 02866892 2014-09-09
WO 2014/003913 PCT/US2013/041806
separation technique uses 2-dimensional plots of D-T2 for example. Fig. 8 is a
diagram
showing the use of 2D plots to separate the apparent gas peak into its
components. The
diffusion is measured using NMR and plotted on the vertical axis while the T2
is also
measured and plotted on the horizontal axis. In the upper part of the diagram,
lines 810, 812
and 814 are the normal water line, normal gas line and normal oil line
respectively as is well
known in the art. Since diffusion data is available, it is possible to use the
2D maps. The
added diffusion axis in this example separates the peak intensity into its
components, in this
case gas, water and Kerogen. The differences between the diffusion constants
of water and
gas separate the overlapping peaks from which individual components can be
measured and
subtracted from the apparent peak. This known method can further be used to
separate the T2
or Ti peaks of gas, Kerogen, and water. In the example shown in Fig. 8, the
lower part of the
diagram shows the peaks 830, 832 and 834 which are the water, gas and kerogen
peaks
respectively. In cases where this separation process is performed in the
shallow shell, the
same process should be performed as in the deep shell so that the comparison
of the peak
intensities, as described herein, is meaningful. Having separated the gas
contribution to the
peak, it is straightforward to monitor its intensity as a function of gas
pressure without any
contamination from other fluids in the pore.
[0038] Fig. 9 shows a system for determining gas pressure in low
permeability
subterranean formation such as shale gas, according to some embodiments. At
wellsite 900 is
a wireline truck 920 that is deploying an NMR tool 226 in wellbore 210 (such
as shown in
greater detail in Figs. 2A and 2B). The tool is making NMR measurements in a
shale gas
formation 202 that has a perturbed zone 204 (also as shown in greater detail
in Figs. 2A and
2B). According to some embodiments the location of deployment of NMR tool 226
is
isolated via packers and a gas line is present (as shown in Fig. 6), although
the packers and
gas line are not shown in Fig 9 for simplicity and clarity. The measurements
910 from the
NMR tool 226 at the unperturbed location, and at the perturbed location under
two or more
known pressures is transmitted to a data processing center 950, which can be
located in the
wireline truck 920 or at another location local or remote to the wellsite 900.
Alternatively, the
data may be processed downhole, by a microprocessor that can be provided or is
in the NMR
tool. The processing unit 950 includes a storage system 942, communications
and
input/output modules 940, a user display 946 and a user input system 948. Data
processing
-11-
CA 02866892 2014-09-09
WO 2014/003913 PCT/US2013/041806
unit 950 is programmed and configured to carry out the calculations such as
described with
respect to block 118 in Fig. 1, and thereby yields the connate pore pressure
914.
[0039] In another embodiment of the subject disclosure, the perturbed and
unperturbed
zones may be found at a different depth along the length of borehole instead
of radially into
the formation. Fig. 10 is a flow chart showing aspects of a method for
determining gas
pressure in low permeability subterranean formations such as shale gas,
according to some
other embodiments. According to these embodiments, the pressure of the shale
gas can be
determined using NMR tools using a single depth of investigation. In block
1010, the NMR
tool is positioned in the borehole within the shale gas formation. In block
1012, NMR
measurements are taken at a number of different locations (depths) and in
block 1014 the gas
peaks are analyzed for locations likely to be perturbed (having a less intense
gas peak due to
gas loss through micro fractures) and unperturbed (have a more intense gas
peak due to gas
being in connate form). In block 1016, if suitable locations are not yet
found, further
measurements and gas peak analysis is made in an effort to find suitable
locations. When
locations for both perturbed and unperturbed material have been found, then in
block 1018,
gas is injected at known pressures into the formation at the perturbed
location, while gas peak
measurements are repeated. In block 1020, the unperturbed pressure is
calculated based on
the known pressure changes and the gas peak intensities, as has been described
herein (e.g.,
block 118 of Fig. 1). For example, the pressure can be increased until the gas
peaks for the
perturbed location matches that of the unperturbed location, or alternatively
a calibration
curve can be developed to estimate the connate gas pressure. Note that if an
unperturbed
location cannot be found or conveniently used, according to some embodiments
the gas
pressure alone, or other techniques can be used to induce micro fractures.
[0040] It is possible to encounter cases wherein all the shells in an NMR
tool show the
same gas peak intensity. In this case it is not immediately obvious if the
shells are not
perturbed at all, or all of them are perturbed to the same extent. According
to some
embodiments the gas peak intensity as a function of applied gas pressure is
used to decide
whether or not the formation is perturbed. According to one embodiment,
already described
above, the DOI of NMR shell(s) is increased until the deeper shells show a
constant gas peak
intensity. However, if the gas peak intensity does not increase even at deeper
DOIs, it may be
- 12 -
CA 02866892 2014-09-09
WO 2014/003913 PCT/US2013/041806
either because even the shallow shells are not perturbed, or the unperturbed
DOI is too deep.
These two cases can be decided by the behavior of a calibration curve such as
shown in Fig.
4. According to some embodiments, in the case where the formation is not
perturbed, micro
factures can be induced by applying high gas pressures. While monitoring the
gas peak
intensity, gas pressure is increased and a calibration curve is obtained. If
micro fractures do
not exist already, the initial gas pressures will not have an effect on the
gas peak intensity
until at relatively high gas pressures. Fig. 11 is a graph of a calibration
curve, according to
another example embodiment. The calibration curve 1110 is an example showing
lack of
dependence on initial gas pressure, and is characteristic of a formation that
is not perturbed.
Once higher gas pressure is used to induce micro fractures, the gas pressure
can be removed
and the above method is applied to generate a calibration curve of the type
shown in Fig. 4
and used to estimate the connate gas pressure.
[0041] The alternate case wherein all shells have similar gas peak
intensities and the
calibration curve resembles curve 410 of Fig. 4 rather than curve 1110 of Fig.
11, then all the
shells are perturbed and there is a need to determine an unperturbed gas peak
intensity.
According to some embodiments, this can be done by pushing the DOI of the NMR
tool until
the peak is not changing. Alternatively, one can seek to find a higher gas
peak intensity by
measuring adjacent depth along the borehole to find particular depth(s) where
the formation is
not perturbed and is within the DOI of the NMR instrument. Even if these
attempts fail, the
calibration curve, such as curve 410 of Fig. 4, is still useful as it provides
a lower limit to the
true gas pressure.
[0042] According to some embodiments non-NMR measurement types are used or
combined with the techniques described herein to determine pore pressure in
low-
permeability materials. In general, measurement types that are suitable are
those that are
influenced by gas pressure and have depths of investigation likely to reach at
least some
unperturbed locations. According to some embodiments, for example, sonic
measurements
can be used. In these embodiments, the sonic measurement is used in an
analogous method to
that described in Fig. 10 for the NMR tool having a single DOI. In particular,
a number of
sonic measurements are taken to find locations for perturbed or unperturbed
shale. Injecting
gas while making sonic measurement in a perturbed location and comparing to an
unperturbed
- 13 -
CA 02866892 2014-09-09
WO 2014/003913 PCT/US2013/041806
location, and calculating the pore pressure either using a calibration curve
or direct matching,
as described herein. Other examples of suitable measurement methods and/or
tools include:
Nuclear logging (neutron and gamma ray), which are common in the oil well
logging. The
measurements from these two techniques may cross over in a gas zone and the
intensities can
be used to quantify the gas pressure.
[0043] According to some embodiments the techniques described herein are
applied to
materials other than shale gas formations. For example pore pressures in other
low-
permeability formations such as other shale formations, or tight gas
formations can be
determined using the inject/measurement techniques described herein Also,
although many of
the embodiments described herein pertain to gas pressures, in general the
techniques will
work for any determination of pore pressure. Furthermore, the techniques
described herein
can be readily applied to non-oilfield applications for measuring pore
pressure in any low
permeability or impermeable material. According to some embodiments, one such
material is
foam materials such as closed-cell solid foam
[0044] While the subject disclosure is described through the above
embodiments, it will
be understood by those of ordinary skill in the art that modification to and
variation of the
illustrated embodiments may be made without departing from the inventive
concepts herein
disclosed. Moreover, while the preferred embodiments are described in
connection with
various illustrative structures, one skilled in the art will recognize that
the system may be
embodied using a variety of specific structures. Accordingly, the subject
disclosure should
not be viewed as limited except by the scope and spirit of the appended
claims.
- 14 -