Note: Descriptions are shown in the official language in which they were submitted.
CA 02882486 2015-02-23
A HIERARCHICAL WORKSPACE SYSTEM FOR COLLABORATION AND
REVENUE DISTRBUTION, IN SERVICING REQUESTS ON A COMPUTING
PLATFORM
BRIEF DESCRIPTION
Field of the Invention
The invention relates to the application of information and communication
technology to a semi-
open source business system for servicing requests, with emphasis on service
provider integration,
collaboration and development and as an alternative to prevalent open-source
business systems.
Background
Business model evolution is a natural consequence of the advances in
information and
communication technology, as is evident in the prevalence of open-source or
decentralised market
services which are expanding access to service provision. Nevertheless,
challenges remain as for
example, in support of the Digital Agenda for Europe, the European Commission
has been seeking
information and new ideas relating to the enabling of job growth by
information and
communications technology (ICT). Somewhat related to this job growth challenge
is the facilitation
of entry level employment, primarily in sophisticated sectors, as companies
seek to maximise
efficiencies and as skill needs change in response to new innovation and
market evolution. An Eco
Canada (2010) report and periodic media reports and media discussions have
referred to these
challenges to worker integration and development.
Society will be well served by decentralised market services that support
choice engagements and
the integration and development of its participants, while remaining an
effective competitor in the
facilitation of service provision. Critical to the establishment of such
decentralised service are
structural support, the conglomeration of interrelated skills, enhanced
collaboration, development
opportunities and the mitigation of remuneration risks. Although some
decentralised markets have
been providing some support to the aggregation of niche services, their roles
remain limited, as they
currently lack the added benefits that minimal hierarchies can provide to
facilitate standardised
outputs and support professional assimilation and development, primarily in
the provision of
sophisticated services. Decentralised market services are also deficient in
structures that provide
significant support for skill development and skill evolution and that can
aggregate the material
resources essential for providing aspects of sophisticated services.
1
CA 02882486 2015-02-23
Minimal hierarchical structures incorporated into marketplaces for
professional services can
enhance the quality and reliability of service provision and diminish the need
to have service
requesters manage service provision, primarily in sophisticated areas of work.
Minimal hierarchies
can add a project or service coordination level that can guide and quality
control service provision
and a revenue accumulation unit to pool operational cost for software
services, operating equipment
and limited office accommodation and with these facilities contribute to the
expansion of service
delivery.
Decentralised markets often provide payment mechanisms, but they have also not
optimised revenue
distribution among collaborating teams to facilitate impartiality and improve
the mitigation of
remuneration risk. For fixed price projects, billed time presents challenges
to the objective
compensation of collaborating individuals, more so where these collaborators
have a wide variety of
skills and variation in skill levels, while arbitrary agreements of percentage
compensations for
portions of work done can be self-serving. The incorporation of universally
applied task valuation
methodologies can better serve collaboration on fixed-priced project work in
semi-open source
markets.
Summary of the Invention
The computer implemented semi-open source hierarchical workspace invention
targets sector
focused collaboration on a platform structured to organise individuals to
function at levels at which
most participants are at least periodically assimilated into some aspect of
service provision, even as
choice collaboration predominates. This entails fostering the growth and
development of service
providers, through minimum novice inclusivity prescriptions and through
performance based
promotional opportunities. Consequently, semi-independent service providers
participating in this
hierarchical workspace negotiate, supervise and execute projects which are
coordinated by more
experienced participants. The semi-independence of these service providers and
coordinators relates
to their voluntary participation in projects and their compensation directly
connected with personal
production on a per-project basis, all subject to the participation,
collaboration and revenue
distribution rules of the hierarchical workspace. Service providers may
qualify for promotion to
these coordinator positions in which they will oversee multiple projects.
Project oversight and skill
improvement through guidance serve to ensure quality outputs and timeliness as
a group
responsibility.
2
CA 02882486 2015-02-23
In effect the hierarchical workspace is a semi-open source for projects and
services that
accommodates same-sector service providers operating in persisting groups and
transient sub-
groups, in various sub-sector focus areas. The semi-open nature involves entry
controls, guided by
automated assessments of the potential for new recruits to become reasonably
engaged in the short
term. This entry into the hierarchical workspace will be from a mix of
queueing, competition and
project needs.
For each project, the hierarchical workspace system has revenue allocations
declining at
progressively higher levels, commencing from service provision and advancing
to service
coordination, operational funding and shareholding, where each revenue
allocation constrains the
funds distributed to compensate individuals. Nevertheless, fewer individuals
function at the higher
levels, consequently for multiple projects involving different lower-level
participants, individual
incomes increase at higher hierarchy levels.
At the service provision level, individual compensation is assessed from
activity weights and the
task fractions contributed to project or service negotiation, supervision
and/or execution. At the
coordination level compensation is based on the coordinators' personal project
or service oversight
values. Service provider and project coordinator compensations are further
adjusted for regional
costs of living differences, to preserve equity in the spending value of the
incomes distributed to
dispersed collaborators. The operating fund allocation facilitates shared
costs for software services,
operating equipment and limited office accommodation.
In another aspect of the invention, as a strategy to incentivise project
sourcing, the service provider's
compensation for negotiating projects is enhanced as project scarcity
increases and incomes
decrease.
Brief Description of the Drawings
The hierarchical workspace process, is described in modules, each associated
with an aspect of the
innovated algorithm, hence figure numbers align with those of relevant
components of this
underlying algorithm e.g. Figures 1(1) and 1(2) are associated with algorithm
component A-1, while
Figure 3 is associated with algorithm component A-3.
Figure 1(1) represents the innovated hierarchical workspace, with occupancy
levels and revenue
fractions for allocating project income to the various hierarchy levels for
specific purposes.
3
CA 02882486 2015-02-23
Figure 1(2) has a description of the process innovated for assigning revenue
fractions to levels in the
hierarchical workspace.
Figure 2 depicts the process innovated to estimate the admissible number of
service providers.
Figure 3 describes the process innovated for obtaining the service values that
determine the
eligibility of service providers for promotion.
Figure 4(1) describes the process innovated for utilizing service fractions
and project weights to
distribute service incomes to collaborating service providers working on fixed-
price projects.
Figure 4(2) describes the process innovated for generating the service
fractions that determine the
service incomes of collaborating service providers working on fixed-price
projects.
Figure 5 describes the process innovated for generating project weights that
vary with project
availability and earnings.
Figure 6 indicates the process innovated for assigning coordinator income on
the basis of their
project oversight and performance.
4
CA 02882486 2015-02-23
DETAILED DESCRIPTION OF THE PRESENTLY PREFERRED EMBODIMENTS
The hierarchical workspace system is a computer implemented process, described
in modules, each
associated with an aspect of the innovated algorithm, hence figure numbers
correspond with the
numbers assigned to relevant components of this underlying algorithm e.g.
Figures 1(1) and 1(2) are
associated with algorithm component A-1 while Figure 3 is associated with
algorithm component A-3.
For convenience and effectiveness, descriptions may commence from the end
point or from the
beginning of any given flow chart representing a module. Within each such
module flow the numbers
assigned to elements of the process increase as they follow the descriptions.
Between flow charts,
process elements are connected by square-bracketed numbers. Examples conclude
the description
details, and these examples are also numbered in association with modules A-1
to A-6 of the
underlying innovated algorithm.
The Revenue Distribution Hierarchy
The hierarchical workspace invention fosters transparency and consistency in
the distribution of
revenue generated in service provision. Rvenue fractions constrain revenue
distribution at each
hierarchy level as these revenue fractions, and where they exist participant
numbers, decline at higher
levels. Each project may involve a different group of service providers,
resulting with fewer higher
level service coordinators having multiple project engagements. Consequently,
for a single project, the
total income allocated to participants decreases at higher levels, but for
multiple projects this total
income trend is inverted. The revenue fractioning at hierarchy levels is based
on the module, A-1, of
an innovated algorithm, that together with its accompanying modules, A-2 to A-
6, facilitate
hierarchical workspace automation.
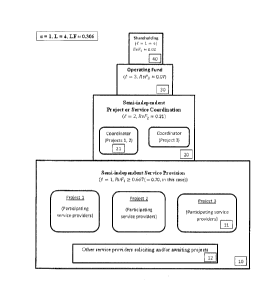
Figure 1(1) depicts the revenue distribution levels, -e, totaling, L,
innovated for this hierarchical
workspace system. Here, these levels commence from 1' = 1 at the base and are
sequentially indexed
to a maximum I' = 4 at the top. As the numbers assigned to the levels
increase, the revenue fraction,
RI)Fe (A-1a), assignments decline, giving in this specific case, RvFi (P.--
0.70) > RvF2 (,=-== 0.21) >
RvF3 0.07) > RvF4
0.02). The revenue fractions determine the allocation of the total project
values (incomes) after expenses toward service provision at E =1 (10),
project, or service coordination
at, 1' = 2 (20), operation funding at, I' =,3 (30), and shareholding at, I' =
L = 4 (40). At the level -I' =1
(10), the service providers may be participating in a project (11), or
soliciting and/or awaiting projects
CA 02882486 2015-02-23
(12), while at e = 2 (20) the coordinators (21) may be coordinating one or
more projects, or otherwise
seeking projects to coordinate.
Figure 1(2) is a flow chart of the process invented for evaluating revenue
allocations to levels in the
hierarchical workspace, while Examples 1(1) to 1(4) demonstrates its
application. As innovated, this
RvEe (A-1a) structure has a number of levels, L (101), the first being the
base level, 1' = 1, at which the
largest revenue fraction, Rf2F1 (102) extracts the largest proportion of the
project value after expenses.
A shared level fraction, LF (< 1, 103), powered by the level number, (104),
the latter elevated to a
power a (105), is then utilised to generate the revenue fractions RvFe (A-la,
106) of each level. These
revenue fractions decline progressively as the level numbers increase. The
numbering of levels in
association with revenue fractions is a convenience which, in other
embodiments, may be reversed or
avoided in descriptions of equivalent structures.
Hierarchical workspace management negotiates the base-level, or service
provision revenue fraction,
RvFi, with service providers as a group, and this RvFi is then set for all
projects done in a given period
of time. As a boundary and guide to this negotiation, for preserving fairness
in compensating service
providers, the base-level revenue fraction has the limitation RvFi > 0.667,
for all values of the
configuring variables, L, LF and a. This RvFi.
0.667 is a value set by considering the non-base
levels as a management block, for coordination, operational funding and
shareholding, with 1
functional superior, as assumed, overseeing a minimum of 2 subordinates in the
service provision
block, and with equivalent revenue sharing among these individuals, as a
fairness prescription. With
this assumption, any added subordinate increases the revenue allocated to the
management block above
that of the subordinate or base level.
The hierarchical workspace system can be customized to compromise the needs of
service providers,
management and shareholders. As indicated above, the revenue proportions
assigned to levels of the
hierarchical workspace system can be adjusted by changing at least 1 of 3
parameters i.e. L, LF and/or
a, and these changes will impact the entire system while conserving revenue.
The parameter L,
changes the number of levels, while LF sets the base-level revenue fraction,
RvFi, connected with
service provider compensation and, a, skews the revenue fraction profile to
enhance either its lower
level or its upper level values. The revenue fractions adjust slightly to
accommodate any number of
added levels and as a consequence, theoretically there can be a near infinite
number, L, of levels,
6
CA 02882486 2015-02-23
however with RvFi > 0.667, then as L increases the smallest revenue fraction,
RvFL, rapidly
approaches zero.
Preferred is the a = 1.0 hierarchical workspace embodiment, with RvFi > 0.667
and L? 4, where, at
the base level, f, = 1, the revenue fraction, RvFi, compensates service
provision, while at progressively
higher levels, RvF2, compensates service coordination, RvF3, accumulates the
operational funds, and
RvF4 to RvFL, compensate shareholders. As f, increases with departure from the
RvFi base value, this
a = 1.0 configuration produces reasonable RvFe decreases at all levels,
although with RvFi unchanged,
an increase in the number, L, of levels accelerates the RvFE diminutions,
primarily at higher levels, to
facilitate the added level(s). As a result of these characteristics, adding
levels with the aggregation of
the uppermost and adjacent revenue fractions is a preferred means of
accelerating investor returns, with
minimal impact on revenue fractions at the non-shareholding levels.
In other embodiments, with L > 4 the revenue fractions, RvF3, to RvFL, can be
used to facilitate some
mix of operation funding and shareholding. In other less favoured embodiments,
with L> 4, for very
large establishments the revenue fraction, RvF3, may be utilised to remunerate
managers of
coordinators, while the operating fund is shifted to the higher level of
revenue fraction, RvF4. In yet
other less favoured embodiments with a 1.0, setting, a > 1.0, skews revenue
fractions to enhance
their larger or lower-level values, while setting, a < 1.0, skews these
fractions to enhance their smaller
or upper-level values. Changing a skews the hierarchical workspace profile and
this significantly
enhances the difference between funding capacities at adjacent levels, with
notable consequences to
inter-level operations.
In the preferred a = 1.0, RvF, > 0.667, L > 4 embodiments, the operating fund
derived from the
revenue fraction, RvF3, serves first to defray the cost of running the
hierarchical workspace including
expenditure for software and other services, but once these costs are met,
funds are allocated towards
acquisition and maintenance of limited office space and equipment, with these
costs shared by
hierarchical workspace participants, on a pay as you earn basis. As a basic
analysis of this funding
capability, the $25 monthly subscription often applied for individual use of
project/accounting software
equates to approximately 1 % of an annual individual income of $30,000.00,
then with L = 4 and
RvF3 0.07, this 1 % software expenditure leaves the remaining RvF3
0.06 for other expenditure.
7
CA 02882486 2015-02-23
Another feature of the invented hierarchical workspace system is the
allocation of shares to significant
contributors to revenue generation, consequently in addition to founders,
investors and other
shareholding partners, a proportion of shares is allocated to coordinators as
participating managers and
if economically viable to eligible service providers. With a = 1.0, L = 4,
RvFi 0.70, in the specific
Figure 1(1) example, there is the accumulation of revenue fractions RvFi +
RvF2 + RvF3 =-=-; 0.98,
which has service providers and coordinators as a group benefiting from 98 %
of the revenue they
generate in addition to their shareholding entitlements.
In preferred applications, hierarchical workspace participants operate from
geo-fenced groups bound by
Geography and service sector. Nevertheless these geo-fenced participants do
have options to interact
across groups to locate and share clients. In other applications, hierarchical
workspace participants
may choose to operate in geo-neutral groups, bound only by service sector. Geo-
fenced and/or geo-
neutral groups generate and manage their own RvF3 operating fund and their
RvFL shareholding
entitlements, in compliance with hierarchical workspace agreements.
Specifying Recruitment Numbers to Optimise Participation Numbers
In compromising the best interests of shareholders, project coordinators,
service requesters and service
providers, an objective of the hierarchical workspace invention is to
integrate new recruits into project
activities and facilitate their career development with minimal impact on
choice collaboration and
service quality, all aimed for with guidance by artificial intelligence.
Consequently, another aspect (A-
2) of the innovated algorithm limits recruitment numbers, from among qualified
applicants, in
association with minimal individual income targets and project availability.
Figure 2 indicates the process innovated to estimate the number of service
providers to be recruited,
while Examples 2(1) to 2(3) demonstrates its application. For any given short-
term period such as one
day indexed, t, the permissible number of service provider recruits, NR t
(201, A-2a), is assessed as a
running mean to minimise short-term fluctuations. The short-term NR t (201, A-
2a) value has as its
constituents one component, NRt(LQRR) (202, A-2b), weighted RW, evaluating
income adequacy
and another, NRt(PSvR) (203, A-2c), evaluating project adequacy.
Qualified applicants enter the hierarchical workspace from a mix of
competition, queuing and project
needs. A competition queue complements a chronological queue, while eligible
service providers with
pending and/or active projects are accorded accelerated entry. Experts can
leverage the services of
8
CA 02882486 2015-02-23
novices, who will benefit from this expert guidance, nevertheless the
preservation of minimum
participation levels internally requires an upper limit, NNRXt (A-2d), on the
admission of
chronologically queued novices. This novice recruitment ceiling incorporates
the reality that each past
or historic project involved a total number, NSHt (204), of service providers,
of which, NNHt, were
novices or supervised individuals and NEHt were experts or unsupervised
individuals. The ratios of
NNHt to NSHt are averaged over the long term to provide a value that
proportions, NR t (A-2a), to
determine, NNRXt (A-2d). This expert and novice labelling, for any given
historic project, is specific
to the service provider's role in that project, consequently self-supervised
participants are also
considered transient experts.
For projects numbering, P, the innovated lower quartile remuneration ratio,
LQRRt (A-2e), constituent
of NRt(LQRR) compares the average income receipts, ALQEt (205, A-2f), among
the lower quartile of
ranked earners numbering NLQt (A-2g), against a minimum individual earning
target, TMEt (206, A-
2i), set for all service providers currently listed, numbering, NSLCt. Here
NLQt is a proportion or
lower quartile weight, LQW (= 0.25), of NSLCt, the latter being an aggregate
of current expert, NELCt,
and novice, NNLCt, listings. In other embodiments LOW may be replaced by other
proportions of
NSLCt.
The targeted minimum earning, TMEt, is an agreed minimum collaboration
fraction, MCFt (207, A-2i),
of the average of Sifit,i, j (208, A-4a), which represents the incomes of
currently listed service
providers. The MCFt specification facilitates an objective of the hierarchical
workspace invention to
integrate new entrants into service provision with minimal impact on choice
collaboration and service
quality. In this integration strategy while all service providers are expected
to utilize their knowledge,
skills, and initiative to elevate their project participation and earnings,
sub-TMEt service providers are
identified to grant their participation in a MCFt of service provision with
equivalent compensation. In
preferred embodiments this MCFt disbursement is mandatory for each project,
but in other
embodiments it is discretionary.
The innovated project to service ratio, PSvRt (A-2j), constituent of
NRt(PSvR), serves as an indicator
of project availability for service providers' continued occupation. Exploited
for this assessment are
the balanced relationships between project numbers, project values and service
provider numbers,
maintained by entry controls and attrition. Consequently, PSvRt, compares
current ratios of totals with
historic or long term averages of corresponding ratios of totals, in two
components. Component 1
9
CA 02882486 2015-02-23
weighted LW, has for its current ratio, the number of pending and active
projects, NPLCt (209),
relative to the number of service providers listed, NSCLt (209), and for its
historic ratio, the number of
projects done, NPHt (209), relative to the number of service providers listed
at that time, NSLHt (209).
Component 2 has for its current ratio, the pending and active project value,
PVC t (209), relative to the
number of service providers listed, NSCLt, and for its historic ratio, the
project value done, PVHt
(209), relative to the number of service provider listed at that time, NSLHt
(209).
In the objective to support career development within the hierarchical
workspace, competent service
providers may be promoted to service coordinator positions, in which they will
oversee multiple
projects at any given point in time and receive level t = 2 income.
Systematic, but sustainable service
provider promotion requires consistency between the number of coordinators, NC
t (210, A-2k), and the
number of service providers listed, NSLCt. This consistency is maintained by
use of a coordination
number fraction, CNFt > 0.333, (A-21. 211), set permanently, or for extensive
periods of time, which
together with the ratio, RF2, to RFI. (212, A-la), of revenue fractions, and
NSLCt, determines NC. The
lower CNFt > 0.333 limit was determined with similar consideration as for the
lower RvFi (A-1b)
0.667 limit. The coordination number fraction is set by management, usually
below its upper bound
(= 1.0, A-21) to maintain the average of coordination earnings above the
average of service provision
earnings.
The coordination number fraction associates additional service provider
listings with additional
promotions. The service provider additions are influenced by income adequacy
via LQRRt, and project
availability via PSvRt, which these service providers can impact thorough
their own efforts. In return,
the service providers' successes in their endeavours to increase project
sourcing and project incomes
will increase their eligibility for promotion. In another aspect of this
interconnectivity, while income
and project inadequacy diminishes recruitment numbers, these inadequacies
incentivise project
sourcing through the LQRRt and PSvRt influenced enhancements of the project
negotiation weight,
PNWp (A-5a), used in service provider income calculations.
Service Provider Performance Evaluation
Service provider promotions are based on their performance evaluations, in
terms of the extent of their
project involvement, their quality of work and their support for novices.
Consequently, for this aspect
of the innovation, over an assessment period, T, involving projects indexed,
p, the performances of
CA 02882486 2015-02-23
service providers indexed, j, are evaluated by their service values,
accumulated over a long enough
period to blend time-in with superior performance.
In preferred applications service values are
evaluated as running totals or running means over 5 years, while in other
embodiments shorter-term or
longer-term evaluation periods can be assigned. Nevertheless, providing that
level f = 2 has the
capacity to accommodate additional Loordinators, service providers with
relatively higher service
values can be promoted to one of these level à = 2 coordinator positions at
any time during the
assessment period.
Figure 3, follows the process of establishing service values, while Example
3(1) demonstrates its
application. Each service value, SvI71,, (301, A-3a), is a weighted average of
the dollar values from the
service provider's roles in project or service negotiation, supervision and
execution as represented by
variables, SvNIILT, SvSVix, and, SvEllt, (302, A-3b), respectively, with the
relative importance of
these roles, in the assessment, being determined by service weights SW1 and
SW2.
The service negotiation, supervision and execution values, SvNI/, SvSVj,
SvEVi,,, have as inputs,
the corresponding project role incomes, PN/Opj,,, PS/Opj,, PE/Opj,, (303, A-
4d), of service
providers. However, weighted by SW4, these PN/Omj,,,
PE/Opj,, influences are moderated
by the service provider's work quality evaluations, WEvp (304, A-3e), while
weighted by SW3 the
PS/Opj influence is elevated by the service provider's adherence, MCALT (305,
A-3c), to the
minimum collaboration fraction MCF, (A2-j), of work and earnings, specified as
a disbursement to
support novice integration and development.
The service provider's assessed adherence, MCAL, (305, A-3c), to this minimum
collaboration fraction,
MCP,- (306, A2-j), is validated by his/her collaboration participation score,
MCPThix (306, A-3d), which
together with a generally applied collaboration constant, C (> 1, A-3g), as a
multiple, boosts the service
provider's supervision value, SvSyi, and consequently their service value,
SvVjx. In preferred
embodiments MCPpj = 0, 1 for non-participation and participation,
respectively, while in other
embodiments, a larger value e.g. 2 can be assigned to reflect the greater risk
in collaborating with
service providers ranked closer to the bottom of the earning spectrum.
The work quality evaluation, WEvpix, has an external or client evaluation
component, XEvpix (307),
weighted by SW5 against an internal evaluation component, /Ev.
The internal evaluation
11
CA 02882486 2015-02-23
=
component, /Evmj (308, A-3f), has a subordinate evaluation sub-component,
/BEvmimix, weighted by
variable, SW6, against a supervisor evaluation sub-component, /UEvmixx, where
subscript, m, counts
evaluating subordinates, while subscript, n, counts evaluating supervisors.
Revenue Distribution, for Service Provision, with the Hierarchical Workspace
System
A significant aspect of the process innovated to optimise the occupation and
collaboration objectives of
the hierarchical workspace, involves ease and consistency in the allocation of
fixed price project
revenue to compensate the semi-independent service provision associated with
the service providers'
choice engagements. Service providers are contracted by service requesters at
an agreed price. The
service providers self-organise to service the request, subject to the
engagement and oversight rules and
revenue distribution format of the hierarchical workspace. Service providers
participating in any given
project are compensated portions of the fixed-price project earning, based on
the relative values of their
tasks.
The service provided by individuals is valued from an innovated algorithm
module, (A-4), devised for
a proportionate pay structure with base level revenue fraction, RvFi (102),
constraints and involving
service tasks associated with project negotiation, supervision and/or
execution roles. A cost of living
variable is incorporated into the formulae, to maintain equity in compensating
service providers
operating across global economic regions, by considering the relative country
or regional value in
utilizing the incomes shared in service provision.
Figures 4(1) and 4(2) represent the process for determining service incomes
for collaborating service
providers utilizing the hierarchical workspace process while Examples 4(1) to
4(6) demonstrate its
application.
The regionalised service income with cost of living incorporated and the non-
regionalised service
income, Sy/mix (401, A-4a), and, Sv/Omi (401, A-4b), respectively, are each
the corresponding service
income fraction, Sv/Fmix (402, A-4e), Sv/F0mi (402, A-4f), of the level
revenue fraction, RvFi (403),
subdividing the project value, PVp (403), after expenses. Here, Sv/m
Si2/0mix, may each also be
expressed in terms of aggregated regional, non-regional project income
components for negotiation,
PN/mix (404, A-4c), PN/Omj (404, A-4d), supervision, PS/mix, PS/Omj, and
execution, PEIThir,
PE1073,l-
12
CA 02882486 2015-02-23
As constituents of Sv/Thp. (A-4a), Sv/Opj (A-4b), each Sv/Fmix (A-4e), Sv/F0pj
(A-4f), has
components for service negotiation, SvNFp,kr. (405), SvNFOThi (405),
supervision, SvSFpjx, SvSF0p,1,
and execution, SvEF
SvEFOThi, representing the service provider's proportion of corresponding
weights allocated for their project negotiation, PNWp (406, A-5a),
supervision, PSWp, and/or
execution, PEW, roles. Consequential to cost of living considerations, in
preferred application only
the regionalised service incomes, Sv/mix, are allocated to service providers,
in association with their
individually generated service income fraction, Sv/Fmjx, which is also
applicable to homogenous
economic region(s), where it generates values that are equivalent to those of
Sv/F0pj.
In effect the non-regional role-related service fractions, SvNFOThi (A-4h),
SvSFOThi, SvEFOpj
represent the portions of work actually done in the negotiation, supervision
and execution categories,
hence each regional role-related service fraction, SvNFThix (407, A-4g),
SvSFp,j,,, SvEFThjy, is
devised using its non-regional counterpart with regional cost of living, COLnj
(408), modifications
included, to elevate the incomes of participating service providers resident
in higher cost regions, as a
regional spending equity provision, for equivalent work done.
The non-regionalised role-related service fractions, SvNFON, SvSFON, SvEFON,
(409, A-4h) consist
of homogenous activity or sub-activity weights, AWTha (410, A-4i ), indexed,
a, that are subdivided by
the service provider's role-related task fractions, TNFpj,,,
TEFpj,, (411, A-4n), which
represent their contributions to service negotiation, supervision and
execution, respectively. In its
application, any given service provider with TSFpj,a = TEFpj,,, is self-
supervised, otherwise with 0 <
TSFpj,õ < TEFpj,,, the individual is partially supervised and with TSFThix, =
0, the service provider is
fully supervised, while with TSFpj,a > TEFThi,a, the service provider is
supervising himself and a
colleague.
The weight, AWTha (A-4i), of a unit of homogeneous activity is its innovated
standard activity weight,
AStVVp,, (412, A-4j), extended by its magnitude, AMma (413, A-4i), the latter
being its standard
completion time, AStTp,a (414, A-4i), repeated by the use of a frequency
number Afp,a (A-4k).
Standard activity weights are modal values forming a quasi-permanent spectrum,
from independent
professional value rankings of homogeneous project or service activities. In
their determination,
standard activity weights, AStWma (A-4j), are evaluated in the dexterity,
DxWp,õ risk, RiWp,a and
13
CA 02882486 2015-02-23
exertion, ExWp,õ categories, currently numbering, NAW = 3, although other
activity weight categories
can be added in the future. The dexterity weight, DxWma (A-4/), is an average
of its physical and
mental components, DxPWTh,õ and, DxMWThõ, respectively. Similarly the exertion
weight, ExWma (A
4m), is an average of its physical and mental components, ExPWp,õ and, ExMWpg.
Standard activity times, AStTp,a, are modal values from professional time
estimates for the completion
of a unit of a given homogeneous activity, while activity frequencies, Afp,,,
(415, A-4k), are the time
repetitions that generate the total activity time. Service negotiation,
supervision and execution, are
aspects of the same activity, consequently for each of these roles the
activity time accumulates to the
same total.
Another objective of this innovation for service income allocation is to
facilitate the pre-project
estimate and post-project determination of service provider contributions, to
fixed-price projects tasks,
with options for service provider self-valuation of their contribution.
Consequently, the task fractions,
TNFThi,a, TSFThi,, and TEFpj,, (A-4n), for project negotiation, supervision
and execution activities
respectively, are normalised proportions of corresponding preliminary informed
estimates, TNFOThj,a,
TSFOThi,a and TEFOpj,, (416, A-4o), provided by service providers.
The preliminary role-related task fractions, TNFOThi,,õ TSFOThic, and TEFOThim
(A-4o), consist of
corresponding individual service provider role-related activity repetitions or
frequency numbers,
ANfp,j,õ, ASfpja, AEfpjx, (417), which are compared with the comprehensive
activity frequency
number, Afp,õ (415, A-4k), to generate the task fractions. For more simplistic
estimates, or otherwise
for activities lacking identifiable repetitive tasks, the comprehensive
activity frequency Afpõ,õ is
assigned the value 1.0 and the role-related activity frequency numbers,
ANfpj,,, ASfp,b,õ
are assigned as role-related activity fractions.
Significant anomalies or errors, eTNFOThj,õ, eTSFOThi,õ, eTEFOpj,õ (418, A-
4p), in self-determined
role-related task fractions, TNFOThi,õ, TSFOThim, TEFOThixõ indicate service
provider disagreements
with respect to their task accomplishments, and these are flagged for their
review and reassignment,
while persisting disputes are adjudicated by coordinators.
In effect with the hierarchical workspace system, after the project value is
negotiated, software
generates values for revenue distribution and earnings, using: (a) the
negotiated project value after
14
CA 02882486 2015-02-23
expenses (b) the revenue fractions assigned to various levels (c) the current
regional cost of living
values (d) the static weights and parameters assigned by management (e) the
standard activity weights
provided by service providers (f) the standard activity times provided by
service providers and (g) the
agreed task fractions provided by service providers. Consequently, with this
hierarchical workspace
system, archived standard activity weights and standard activity times serve
to simplify and standardise
the revenue distributed in collaborative work. Service providers simply supply
the negotiated project
value and their task fractions for their negotiation, supervision and
execution activities, from which the
software generates their earnings, and their contributions to the hierarchical
workspace sustenance and
management.
Project Weights for Revenue Distribution in Service Provision
As described earlier, in an aspect of the hierarchical workspace process
invented to evaluate service
provider compensation for fixed price project work, weights for project
negotiation, PNWp (A-5a),
supervision, PSWp (A-5d), and execution, PEWp (A-5e), are service fractioned
by corresponding role-
related variables, SvNFON, SvSFOThi, SvEFON, (409, A-4h), representing the
extent of the service
provider's participation in the given project role.
The project negotiation weight has been designed to vary with project
availability and income, while
the project supervision and execution weights undergo compensatory changes to
conserve revenue. In
this weight variation, project sourcing is encouraged and rewarded through the
elevation of project
negotiation income in periods of project scarcity. Consequently, weighted by
variable, QW, between
assessments of income adequacy via LQRRt (202, A-2e), and project adequacy via
PSvRt (203, A-2j),
the innovated project negotiation weight, PNWp (A-5a), can increase
exponentially to a value limited
by, 13 (> 1.0). The project supervision weight, PSWp (A-5d), is initially
prescribed, while the project
execution weight, PEWp (A-5e), is initially determined as a residual.
Figure 5 provides the process innovated for generating project weights that
vary with project
availability and earnings and that contribute to determining the income of
collaborating service
providers operating in the hierarchical workspace, while Examples 5(1) to 5(3)
demonstrate its
application.
CA 02882486 2015-02-23
Specifically, commencing with QW = 1.0 and LQRRt = 0, or with QW = 0 and PSvRt
= 0, the upper
boundary for the project negotiating weight, PNWp (501, A ¨ Sa)
¨fl, is set by assigning a value to
the parameter 13. This project negotiation weight, PNWp (= PNW1 (502, A-5b)),
is then valued at the
income and project adequacy thresholds, which occur at LQRRt = 1.0 and PSvRt =
1Ø At this income
and project adequacy threshold, the project negotiation weight, PNW1 (502, A-
5b), and a management
specified project supervision weight, PSW1 (503, A-5c), serve to determine the
initiating project
execution weight, PEW1 (504, A-5c), as a residual.
To minimise excesses in setting the project supervision weight, this PSW1 1-
PNW1
3 __________________________________________________________________ , A ¨
derives its upper boundary from the premise that each project supervisor, NSP1
is allowed a minimum
of two subordinates, NSB2, with non-PNW1 income divided equally among these
three persons, as a
fairness prescription. In a case with, 13 = 3.3, there are, PNWp 0.3, and PNW1
= 0.11, giving PSW1
0.297, approximately.
Once the initiating weights for project negotiation, PNW1, supervision, PSW1,
and execution, PNW1,
are determined, the project negotiation weight, PNWp (506, A-5a), is allowed
to vary in response to
project and income availability (505), then to conserve revenue the weights
for project supervision,
PSWp (507, A-5d), and execution, PEWp (507, A-5e), also vary proportionately.
Revenue Distribution for Project Coordination
When the number of service providers listed, NSLCt, is adequate, the more
competent ones are
promoted to add to the number, NC, (210, A-2k), of coordinator positions, in
which they have duties
that include providing advice on issues, adjudicating disputes, setting task
timelines and when
necessary redistributing tasks to ensure timely project completion. These
coordinators share the level,
f (= 2), revenue fraction, RvF2 (A-1a), of the total value of projects done,
but their individual incomes
are assessed form personal production. Since these coordinators have
responsibility for outcomes, their
incomes are also impacted by work quality evaluations.
Figure 6 provides a summary of the process innovated for determining the
coordinators' incomes,
while Example 5(1) displays some simulated results. Over an assessment or
revenue generation period,
> t, any given coordinator indexed, i, has income
(601, A-6a), regionalized via cost of living
inserts. Nevertheless, for comparison, the coordinator's income may be
evaluated as a non-
16
CA 02882486 2015-02-23
regionalized value, C/0i (602, A-6b). These coordinator incomes,
C/0i,, are each their
corresponding coordination fraction, CRvFix (603, A-6c)õ CRvF01 (604, A-6d),
of the level-2
revenue fraction, RvF2 (605, A-la), subdividing each project value, PVpir
(605).
Both CRvF (A-6c) and CRvF0,,, (A-6d), are essentially the coordinator's
project oversight value,
OsVi (606, A-6d), relative to that of all of his or her colleagues, but only
CRvFi,,, is actually utilised,
as it incorporates regional cost of living, COL,,i (607), influences, to
preserve spending equity, in
distributing incomes,
to dispersed participants. This oversight value, OsVix, is the sum over the
period, T, of the coordinator's project value, CPVp,i,T (608), overseen, but
moderated by the
coordinator's work performance evaluation, WEvoir (609, A-6e), as weighted by
CW1.
The work quality or performance evaluation, WEvp,i (A-6e), has an internal
evaluation component,
(610, A-6f), and an external or client evaluation component, XEvp,i (611),
weighted by CW2.
This internal evaluation component, JEv
(A-6f), has a supervisor evaluation sub-component,
and a subordinate evaluation sub-component, iBEVpjmy, weighted by, CW3. Here,
subscript, n, counts evaluating supervisors while subscript, m, counts
evaluating subordinates.
In preferred embodiments, from superior earnings over a given period of time,
a lead coordinator is
assigned to represent the group. This lead coordinator is privileged with
superior share value relative
to that of his colleagues, as compensation for performing this added duty.
17
CA 02882486 2015-02-23
A HIERARCHICAL WORKSPACE SYSTEM FOR COLLABORATION AND
REVENUE DISTRBUTION, IN SERVICING REQUESTS ON A COMPUTING
PLATFORM
Examples
a = 1, L = 4, LF = 0.306
4
3 filiciatij
0.1 0.2 0.3 0.4 0.5 0.6 0.7
RvF(e)
Example 1(1) has a plot of revenue fractions, RvEe (106, A-la), generated for
levels numbered, -e, with
the a = 1.0, L = 4, LF 0.306, hierarchical workspace configuration. As the
level numbers increase,
the revenue fractions, RvFe, generated decline, commencing from service
provision RvFi 0.70 and
advancing to project or service coordination RvF2 0.21, operation funding
RvF3 :=-; 0.07, and
shareholding RvF4=-== 0.02.
Example 1(2) provides revenue fractions, RvEe (106, A-la), and the associated
revenue, Rye, allocated
to levels numbered, -e , connected with an assumed project value, PVp
(=$100,000.00), for a hierarchical
workspace configured by variables a = 1.0, L = 4 and LF 0.343 giving, RvFi
0.667, RvF2 =-=-1
0.228, RvF3 0.078, and RvF4==--, 0.027.
PV L f LF LF(er [1LF(11 RvFe R12,e
$ 100,000.00 4 1 0.34251 0.342509 1.946418 0.666666 $
66,666.58
2 0.117312 0.228339 $ 22,833.90
3 0.040180 0.078208 $ 7,820.82
4 0.013762 0.026787 $ 2,678.70
Sum 0.513764 1.000000 $100,000.00
1
CA 02882486 2015-02-23
a = 1, L = 5, LF = 0.336
4
g 3
2
1 011111:""--111.001.11
0 0.1 0.2 0.3 0.4 0.5 0.6 0.7
RF(e)
Example 1(3) is a plot of revenue fractions, RvFe (106, A-la), generated for
levels numbered, -P, with
the hierarchical workspace configuration a = 1.0, L = 5, LF = 0.336. Comparing
these L = 5, revenue
fractions with those for L = 4 in Example 1(2), here there are, RvFi 0.667 (0
%), RvF2 P--
0.224 (-1.75 %), RvF3 0.075 (-3.85 %), RvF4 0.025 (-7.41 %), RvF5 = 0.009, but
RvF4 +
RvF5 0.034 (+25.93 %). The effect of changing from L = 4 to L = 5 is to reduce
the number of
coordinators, NC t (A-2k), by just 2 %, approximately. The addition of levels
also accelerates the RvFe
declines at the upper levels. Consequently, adding levels with the aggregation
of upper level revenue
fractions is a preferred means of accelerating investor returns, with minimal
impact on revenue
fractions at the non-shareholding levels.
2
CA 02882486 2015-02-23
a = 0.723, L = 4, IF = 0.178
4 L
3 j
2
1 1.1111µ111
0.0 0.1 0.2 0.3 0.4 0.5 0.6 0.7 0.8
RvF(e)
Example 1(4) is a plot of revenue fractions, RvFe (105, A-la), generated for
levels numbered, f, with
the hierarchical workspace configuration, a = 0.723, L = 4, LF z-; 0.178. For
this a < 1.0 configuration,
a and LF were manipulated to achieve the same shareholder returns, RvF4, as
for a = 1.0, L = 5, LF
0.336 in Example 1(3). Comparing these a < 1.0 associated revenue fractions,
with those for a = 1.0 in
Example 1(2), here there are, RvFi 0667 (0 %), RvF2 0.217 (-4.82 %), RvF3
0.082 (+5.13
%), RvF4 r-z-, 0.034 (+25.93 %). For a 25.93 % increase in shareholding
benefits, the effect of
changing from a = 1.0 to a = 0.723 is to reduce the number of coordinators, NC
(A-2k), by as much as
%, approximately, a value more than twice that obtained when keeping a = 1.0
and changing from L
= 4 to L = 5. Changing a skews the hierarchical workspace profile and this can
have significant impact
on the revenue allocation between levels and on the associated functional
capacities.
3
CA 02882486 2015-02-23
¨41¨NR --01¨NNRX
45
35
5 30
a,
ce 25
"6
d 20
10
5 74.
0 = =
$2,000.00 $4,000.00 $6,000.00 $8,000.00 $10,000.00 $12,000.00
ALQE
Example 2(1) is a plot showing that among the lower quartile of ranked
earners, as the average of their
earnings, ALQEt (205, A-2f), increase, the number of potential recruits, NR t
(201, A-2a), and the cap
on the permissible number of chronologically queued novice recruits, NNRXt (A-
2d) also increase.
The NR t values are influenced by the lower quartile remuneration ratio, LQRRt
(202, A-2e), assessing
income adequacy, which is weighted RW (= 0.5), against the project to service
ratio, PSvRt (203, A-
2j), assessing project adequacy. The lower quartile remuneration ratio, LQRRt,
is the ratio of the
average of lower quartile earnings, ALQEt relative to the targeted minimum
earning, TMEt (206, A-2i),
the latter being the minimum collaboration fraction, MCFr (207, A-2i), of the
average of all current
service incomes, Sifit,p,i (208, A-4a). Meanwhile, NNRXt (A-2d), is the
proportion of NR t (A-2a),
derived using the longer-term average of the number of novice, NNHt, relative
to the total number of
service provider, NSHt (204), participants, in historic projects.
4
CA 02882486 2015-02-23
50
re
2' 30
10
0
1.00 1.20 1.40 1.60 1.80 2.00
LQRR
Example 2(2) is a plot that demonstrates the increasing number of potential
recruits, NRt(LQRR), A-
2b, evaluated from the perspective of the lower quartile remuneration ratio,
LQRRt (202, A-2e).
Weighted RW (= 0.5), these NRt(LQRR) values partially contributed to the NI?,
(201, A-2a), values in
Example 2(1). The lower quartile remuneration ratio, LQRRt, indicates income
adequacy as assessed
from the average of lower quartile earnings, ALQEt relative to the targeted
minimum earning, TMEt
(206, A-2i), which is the minimum collaboration fraction, MCFt (= 0.1 here,
207, A-2i), of the average
of all service incomes, Sv/t,p) (208, A-4a). This MCFt (= 0.10, here) is a
project work disbursement to
foster novice integration and development. With more than adequate lower
quartile earnings, LQRRt >
1.0, these NRt(LQRR) values are supportive of additional recruitment.
5
CA 02882486 2015-02-23
45
35
cc
't 25
Z 20
10
5
0
1.00 1.20 1.40 1.60 1.80 2.00
PSyll
Example 2(3) is a plot that demonstrates the increasing number of potential
recruits, NRt(P51,R) (203,
A-2c), evaluated from the perspective of the project to service ratio, PSvRt
(203, A-2j). These
NRt(P512R) values partially contributed to the NR t (201, A-2a), values in
Example 2(1). The project
to service ratio, PSvRt (A-2j), serves as an indicator of project availability
for service providers'
continued occupation as assessed from its 2 components. Component 1, weighted
LW ( = 0.5, here),
has the number of pending and active projects, NPLCt (209), relative to the
number of service
providers, NSCLt (209), both currently listed, compared with the historic or
longer-term average of the
number of projects done, NPHt (209), relative to the number of service
providers listed, NSLHt (209),
Component 2 has, the comprehensive pending and active project value, PVC t
(209), relative to the
number of service providers, NSLCt, both currently listed, compared with the
historic or longer-term
average of the project value done, PVHt (209), relative to the number of
service providers listed,
NSLHt. With more than adequate project work available, PSvRt > 1.0, these
NRt(PSvR) values are
also supportive of additional recruitment.
6
CA 02882486 2015-02-23
Example 2(4) is a table of the number of coordinators, NC t (210, A-2k),
allowed in association with the
number of service providers listed, NSLCt, for a hierarchical workspace a =
1.0, L = 4, LF ,=-= 0.343
configuration, with a project value, (=$100,000.00), as in Example 1(2). As
formulated, for given
values of the revenue fractions RvF2 and RvFi (212, A-la), the coordination
number fraction, CNFt>
0.333 (211, A-2k) limits the number of coordinators, NC, to keep the average
of their earnings,
Avg(C1), at least equivalent to the level C = 1 average of service provider
earnings, Avg(Svkpix).
Nevertheless individual coordinator earnings, CI, (601, A-6a), and individual
service provider
earnings, Svit,Thir (401, A-4a), are dependent on their personal productions.
Reconciliation gives,
RvFi x PVp = $66,666.58, which balances NSLC, x Avg(SvIt,Thix), and RvF2 x PVp
= $22,833.90,
which balances NC t x Avg (Cl).
RvF2 RvEl CNFt RvF21RvE1 NSLCt NC t
Avg(CIi,r) Avg(Sv1,-,p,1,r)
0.228 0.6667 1.00 0.342509 50 17 $ 1,333.33 $
1,333.33
0.67 0.342509 50 11 $ 1,990.05 $ 1,333.33
0.50 0.342509 50 9 $ 2,666.66 $ 1,333.33
0.33 0.342509 50 6 $ 4,040.40 $ 1,333.33
7
CA 02882486 2015-02-23
Example 3(1) is a table of simulated service values, SvI/L, (301, A-3a), for
service providers indexed, j
(= 1, 2, 3), involved in a project indexed, p (= 1), valued PVp = $100,000.00,
of which $70,000.00 is
distributed among the service providers as in Example 4(1) and for the period
indexed, T = 1. Each
SvVi,, is a weighted average of its components for negotiation, SvNI/j,,,
supervision, 5v5V, and
execution Sv
(302, A-3b), which are calculated form corresponding project income
components,
PN/Opj,,-, PS/01, PE/O
(303, A-4f), and work quality evaluations, WeVpj,, (304, A-3e). The
project incomes, PN/Opj,,, PSIOPJr, PE/01, result when the service
negotiation, supervision and
execution fractions, SvNFO, SvSFOThi,,, SvEFO
(A-4h), of the corresponding project weights,
PNWp, PSWp PEWp (406, A-5a,d,e), subdivide the revenue fraction, RvFi (102, A-
la), of the project
value Pt/n. Here SW3 = 0.20, weighs mandatory collaboration adherence, MCALT
(305, A-3c), while
SW4 = 0.40 places a little more emphasis on work quality evaluation, WEvpi
(304, A-3e), and SW2
= 0.50 gives priority to service supervision, SvSyi,,, over its negotiation,
SvNyi, and execution
SvEVi counterparts. Cost of living, COL,J, differences are never considered in
these service value
calculations. In these results, consequential to superior work quality,
despite less earnings, Sv/Op
than service provider 2, service provider 1 with the largest service value,
SvV.L.õ, is favoured for
promotion.
Variables Values Variables Svc Pro(1)
Svc Pro(2) Svc Pro(3) Summation
PV $ 100,000.00 j 1 2 3
RvFi 0.70 r 1 2 3
PVp x RvFi $ 70,000.00 COL,4 19.8 460 64
PNW 0.20 SvNFOThi,, 0.49 0.51 0.00
1.00
PSW 0.30 SvSFOThi,, 0.44 0.56 0.00
1.00
PEWp 0.50 SvEF0p,1,, 0.33 0.38 0.29
1.00
PN/Opj,, $ 6,922.22 $ 7,077.78 $ -
$14,000.00
$ 9,333.33 $11,666.67 $ - $21,000.00
$ 11,666.67 $13,125.00 $10,208.33 $35,000.00
1.00 Sv/0p1
$27,922.22 $31,869.44 $10,208.33 $70,000.00
MCF 0.10 MCP 1 1 0
SW3 0.20 MCA 1.105 1.105 1.000
SW4 0.40 WeVp,L, 0.900 0.500 0.748
SW1 0.30 SvNI/j,, $ 6,645.33 $ 5,662.22 $
SW2 0.50 SvSV
J,T $ 9,156.32 $ 9,578.73 $
SvEVL, $ 11,200.00
$10,500.00 $ 9,179.33
SvV=) $ 8,811.76 $ 8,588.03
$ 1,835.87
,T
8
CA 02882486 2015-02-23
Example 4(1) is a table of simulated level f (= 1), non-regionalised and
regionalised service incomes,
Sv/Op j (401, A-4b) and Sv/p,p. (401, A-4a), respectively, for service
providers indexed, j (= 1, 2, 3),
involved in a project indexed, p (= 1), valued at P171 = $100,000.00, with
$70,000.00 shared among the
service providers, while the remaining $30,000.00 is allocated to the higher
MIFF levels f = 2, 3, 4.
The service incomes, Sv/Op j, Sv/pj,r, are the corresponding service income
fractions, Sv/F0p1,
Sv/Fpjx, of the revenue fraction, RvFi, subdividing the project value, PI71.
Each, SvIFOpj, Sv/Fmt,
has components for negotiation, SvNFOpj,,, SvNFpj (405), supervision,
SvSFOpjx, SvSFThi, and
execution, SvEFOThi,,, SvEFThi, which subdivide corresponding project weights
PNVIip (406, A-5a),
PSWp, and, PEW. In effect the non-regional role-related service fractions
represent the portions of
work actually done. Hence each regional role-related service fraction is
devised using its non-regional
counterpart with a regional cost of living, COLni (408), modification, applied
to elevate the incomes of
service providers resident in higher cost regions. Utilised here is the
Expatistan Cost of Living Index,
coded from the November, 2014 values as COL,J = 198, 160, 69 for the regions
Toronto (r = 1), Rio
De Janiero (r = 2) and Delhi (r = 3), respectively.
Variables & Values Variables Values for Service Providers (j)
Sum
within Regions (r)
PV, $100,000.00 j 1 2 3
RvFi 0.70 r 1 2 3
PV x
P
RvFi $70,000.00 COL,J 198 160 69
PNWp 0.20 SylVFOThi 0.49 0.51 0.00 1.00
SvNFOpj x COL.rj 97.90 80.89 0.00
178.79
SvNFPi,r 0.55 0.45 0.00 1.00
PSWp 0.30 SvSFON 0.44 0.56 0.00 1.00
SvSFON x CO/iv 88.00 88.89 0.00
176.89
SvSF14,7" 0.50 0.50 0.00 1.00
PEWp 0.50 SvEFOpj 0.33 0.38 0.29 1.00
SvEFOpj x COL, 66.00 60.00 20.13
146.13
SrEFp,j,r 0.45 0.41 0.14 1.00
SvIFOi 0.399 0.455 0.146 1.00
P
SvIFp,j,r 0.48 0.45 0.07 1.00
Sv/0 $27,922.22 $31,869.44
$10,208.33 $70,000.00
Pi
Srii,7. $33,921.64 $31,258.00
$4,820.36 $70,000.00
P
9
CA 02882486 2015-02-23
Example 4(2) is a table displaying the non-regional service fractions
generated for service negotiation,
SvNFON, supervision, SvSFON, and execution, SvEFON, (405, 409, A-4h) and
utilised in Example
4(1) for service providers, j (= 1, 2, 3), involved in aspects of the project
activities, a (= 1, 2, 3, 4).
These service fractions derive from the corresponding task fractions, T N
Fp,i,a, TSFAJ,,, TEFThj,,, (411,
A-4n), in Example 4(5) and from the activity weights, AWTha (410, A-4i), in
Example 4(3).
Service Activities
Activity weights
Data Data Data Process Service
by Task Fractions
Entry QC Analysis Modelling Fractions
(I)%ba) (a = 1) (a -2) (a = 3) (a = 4)
Sum (p,j)
AWma X TN Fp,i,,, 0.072 0.089 0.000 0.333 0.49 SvNFO 79,1
AWma x TN1'
p,2,õ 0.108 0.133 0.264 0.000 0.51 SvNF0A2
AWp,õ x TN Fp,3,a 0.000 0.000 , 0.000 0.000 0.00 SvNF0P,3
Sum 0.181 0.222 0.264 0.333 1.00
_....
AWma X TSFp,i,a 0.000 0.111 0.000 0.333 0.44 SvSFO )9,1
AWp,,, x T51'
A2,, 0.181 0.111 0.264 0.000 0.56 SvSF0th2
AWp,õ X TSFA3,, 0.000 0.000 0.0000000 000 SvSFO
.. 73,3
Sum 0.181 0.222 0.264 0.333 1.00
AWA, x TEFp," 0.000 0.000 0.000 0.333 0.33 SvEFOmi
AWA, x TE1'
p,2,, 0.000 0.111 0.264 0.000 0.38 SvEF0A2
A Wp,õ x TEFTh3,,, 0.181 0.111 0.000 0.000 0.29 SvEF0A3
Sum 0.181 0.222 0.264 0.333 1.00
Example 4(3) is a table of standard weights, AStWma (411, A-4j), standard
times, AStTma (414) and
the frequency numbers, Afma (415), for units of homogeneous activities,
utilized to generate the
activity weights, AW7,,,, (410, A-4i), in Example 4(2) for the project
indexed, p (= 1), with
homogeneous activities, a (= 1, 2, 3, 4).
Activity Unit Times, Frequencies Activities Sum
and Weights
Data Process
Data Entry Data QC Analysis Modelling
(a =1) (a = 2) (a = 3) (a = 4)
AStWma 0.22 0.27 0.32 0.40 1.20
AStTpx, 0.25 0.25 1,000.00 1,000.00
Afm, 4,000.00 4,000.00 1.00 1.00
AStWma x AStTma x Afp,a 216.667 266.667 316.667
400.00 1,200.00
AW =
AStWma XAStTp,a XAfp,a
n
--a Ea AStWma XAStTma XAfp,a 0.181 0.222 0.264 0.333
1.00
CA 02882486 2015-02-23
Example 4(4) is a table of the values used to generate the standard activity
weights AStWma (411, A-
4j), in Example 4(3), for the project, p (= 1), with activities a (-= 1, 2, 3,
4), utilising components of
weights for dexterity, DxWma (A-41)), risk, RiWp,,õ and exertion, ExWma (A-
4m).
Activities
Data Process
Entry Data QC Data Analysis Modelling
Aspects of Activity Weights (a = 1) (a -2) (a = 3)
(a = 4)
DxWma 0.25 0.35 0.45 0.65
RiWpx, 0.10 0.10 0.10 0.10
,
ExWma 0.30 0.35 0.40 0.45
DxWP'a + RiWP + ExW
pa
AStWma = 3 0.22 0.27 0.32 0.40
Example 4(5) is a table of the task fractions for service negotiation, TN
Fpj,,õ supervision, TSFpj,a, and
execution, TEFp,j,, (411, A-4n), assigned to service providers, j (= 1, 2, 3),
involved in aspects of
project activities a (= 1, 2, 3, 4). These task fractions were utilized in the
generation of the
corresponding service fractions in Example 4(2).
Activities
Task
Fractions Data Entry Data QC Data Analysis Process Modelling
(14a) (a = 1) (a -2) (a = 3) (a = 4) Sum
TNFp,i,a 0.40 0.40 0.00 1.00 1.80
TNFp,2,õ 0.60 0.60 1.00 0.00 2.20
TNFp,3,a 0.00 0.00 0.00 0.00 0.00
Sum 1.00 1.00 1.00 1.00
4.00
TSFp,L, 0.00 0.50 0.00 1.00 1.50
TSFp,2,, 1.00 0.50 1.00 0.00 2.50
TSF",a 0.00 0.00 0.00 0.00
0.00
Sum 1.00 1.00 1.00 1.00
4.00
TEFp,i,a 0.00 0.00 0.00 1.00 1.00
TEFp,2,a 0.00 0.50 1.00 0.00 1.50
TEFp,3,,, 1.00 0.50 0.00 0.00 1.50
Sum 1.00 1.00 1.00 1.00
4.00
11
CA 02882486 2015-02-23
--10¨Svl(p,j,r) -46¨Sv10(p,j)
$35,000.00
$30,000.00
$25,000.00
8 $20,000.00
13.)
.`=' $15,000.00
$10,000.00
$5,000.00
$-
1 2 3
Regions
(1 - Toronto, 2 - Rio De Janiero, 3 - Delhi)
Example 4(6) is a plot which compares the service incomes, Sv/Op j (401, A-4b)
non-regional, and
Sv/pdx (401, A-4a) regional, each totaling $70,000, distributed among 3
collaborating service
providers with equivalent service income fractions, Sv/F0pj (402, A-4f), but
resident in the 3
economic regions, r, listed. Here Sv/pj,, incorporates the Expatistan Cost of
Living Index, coded from
the November, 2014 values as COL,J = 198, 160, 69 for the regions Toronto (r =
1), Rio De Janiero
(r = 2) and Delhi (r = 3), respectively, while Sv/Opj does not. Consequently,
Sv/pix values are higher
for service providers operating from higher COL,J regions. Using these
numbers, for additional
rudimentary analysis, the equivalent total service income after expenses for a
similar project based in
India would be $24,393.94, with each participant earning $8,131.31, which is
28 % less than the
$11,311.48 awarded to the Indian participant in the Toronto project, as
assumed. Consequently, as an
added benefit, the cost of living variable contributes regional variations in
incomes that support the
lowering of project pricings with the outsourcing of aspects of project
activities to colleagues resident
in lower cost regions. Otherwise such outsourcing enhances the incomes of
individuals in higher and
lower cost regions.
12
CA 02882486 2015-02-23
= PNW El PSW = PEW
0.80 i _1 _ _
M &MME111;111111 ii'
0.70 I 111101 111111111:1110111111111111111111 All
Il mil Ill dmirmostm a gaga - 1
0,0 1 .1 la III millim.....1.111 Ilimilli 1 .
,0,0 iiiiiiiiiiIIIIIIIIIIiii ii111111 IIII Iiii lid
I
i? 0.40 I
m 1111111191 1111111111 1111111111111 1111 lir
u
tv
'-=
o 11 111111 M 1 1111:111,111
MI 1101 I-
a: 0.30 1.-10111 -f' 6 --Pm 1111141 .111 = !I it
Ito ir _ '
020 1 III I I I lb 1 III I II
1..1 a, . .1 ...m.-Ems=MEM MOMMM M=MENA
0.10 mmm mama 0 MI=MOM M -
dn."lihnian
IIIIIIIII IiiiielliliiiihillinigliM Im ='
MEE MM MEN E MMEMM WM=MUM M EWE=EimM ' MI_ MIL:
0.00 '
0.0 0.2 0.4 0.6 0.8 1.0 1.2 1.4 1.6 1.8
2.0
LQRR
Example 5(1) is a plot of the variation of project weights for negotiation,
PNWp (506, A-5a),
supervision, PSWp (507, A-5d), and execution, PEWp (507, A-5e), with the lower
quartile
remuneration ratio, LQRR (202, A-2e). Assigned were f3 (A-5a) = 3.3,
restricting PNWp to a maximum
value of 0.30, also assigned were PSW1 (503, A-5c) = 0.25 and the project to
service ratio, PSYR (203,
A-2j) = 1.0, the latter indicating project adequacy. Here, at income adequacy
there is LQRR = 1.0 at
which PNWp = PNW1 (502, A-5b) = 0.11, PSWp = PSW1 (503, A-5c) = 0.25, and PEWp
= PEW1
(504, A-5c) = 0.64.
13
CA 02882486 2015-02-23
=PNW PSW = PEW
0.80
IP gm :MOON M.EAMOMEN OM- 21 MINN -CIMMI 1
1'3 1111111111 1111111111111111111111,11Wirli
0.60 I-
11 111111111 III NIP UP
0.50I
Nur MO AM 01111 Noma maim mm M MI m
1 A 11111 111111111 III 1111 III 111 I
2- .3 iir Mu.. . -õ
17,7
PI
0.20 1414!" Ps
&IPA liglinAMASUrlm IAD pm .
010 TNT Illimm Hong g
1 01' .1= 11
0.00
0.0 0.2 0.4 0.6 0.8 1.0 1.2 1.4 1.6 1.8
2.0
LQRR
Example 5(2) is a plot of the variation of project weights for negotiation,
PNWp (506, A-5a),
supervision, PSWp (507, A-5d), and execution, PEWp (507, A-5e), with the lower
quartile
remuneration ratio, LQRR (202, A-2e). Assigned were 1 (A-5a) = 3.3,
restricting PNWp to a maximum
value of 0.30, also PSW1 (503, A-5c) = 0.25 (as above), but the project to
service ratio, PSyR (203, A-
2j) = 0.5, was reduced to indicate project inadequacy. At income adequacy
there is LQRR = 1.0 at
which these values when compared with those in Example 5(1), give, PNWp = 0.14
(+21 %), PSWp
(507, A-5d) = 0.24 (-4 %) and PEWp (507, A-5e) = 0.62 (-3 %). With the 50 %
project inadequacy
prescribed here, project negotiation carried a greater weight to incentivise
project sourcing.
14
CA 02882486 2015-02-23
-4*-PSW
0.80
0.70
= = = = = = = =
0.60
:g.0 0.50
1) 0.40
41
- 0.30
õ
0.20
0.10
0.00
1.0 1.2 1.4 1.6 1.8 2.0 2.2
LQRR
Example 5(3) is a plot of the project weight responses to the unfulfilled
recruitment needs in Example
2(1); circumstances which enhance incentives for project execution via
increases in the project
execution weight, PEWp (507, A-5e), rather than enhance incentives for project
sourcing.
CA 02882486 2015-02-23
Example 6(1) is a table of simulated regionalised and non-regionalised
coordinators' incomes,
(601, A-6a), and, C/0i,T (602, A-6b), respectively, for coordinators, i (= 1,
2, 3), resident in economic
regions r (= 1, 1, 3), each overseeing aspects of projects p (= 1, 2, 3),
valued at PV, = $100,000.00,
$300,000.00, $100,000.00, all done over some given period indexed, 7- (= 1),
These coordinator
incomes, CI, C/0 i,2- are each their corresponding individual coordination
fraction, CRvF (603, A-
6c)õ CRvF0i (604, A-6d), of the revenue fraction, RvF2 (605, A-la),
subdividing P177,,, (605). Each
CRvFi- (A-6c), CRvF0i (A-6d), is the coordinator's project coordination value,
CPV, (608), but
moderated (CW1 = 0.40) by his/her work performance evaluation, WEvp,o_ (609, A-
6e) and assessed
relative to that of his/her colleagues. The regionalised income, Cur, is
actually used as it involves
regional cost of living, COLrj (607), values incorporated into CRvFo. to
preserve local spending
equity, in compensating dispersed participants. Utilized here is the
Expatistan Cost of Living Index,
coded from the November, 2014 values as COL,J = 198, 69 for Toronto (r = 1)
and Delhi (r = 3).
Variables Values.Sum
Variables Values for Coordinators ()
( 7") (p, i,r) within Regions
(r)
1 2 3
1 1 3
198 198 69
PVLT $100,000.00 CPV1o. $100,000.00
0.00 0.00 $100,000.00
PV2,T $300,000.00 CPV2,1,1
0.00 $210,000.00 $90,000.00 $300,000.00
PV3,T $100,000.00 CFV3,41
$25,000.00 $ 0.00 $75,000.00 $100,000.00
Ep P VAT $5 00 ,0 0 O. 00
Ep CP17p,i,T $125,000.00 $210,000.00 $165,000.00 $500,000.00
0.55
WEvzi,T 0.60 0.80
WEV3,i,T 0.70 0.90
CW1 0.40 OsVcr
$103,920.00 $176,400.00 $154,800.00 $435,120.00
CRvF00- 0.24 0.41 0.36
1.00
CRvFOcT X C01,,,i 47.29 80.27 24.55
152.11
RvF2 0.21 CRvFi,i. 0.31 0.53 0.16
1.00
RVF2 X
Ep PVp,r $105,000.00 C/00- $25,077.22
$42,567.57 $37,355.21 $105,000.00
CI
$32,643.52 $55,411.05 $16,945.43 $105,000.00
16
CA 02882486 2015-02-23
A HIERARCHICAL WORKSPACE SYSTEM FOR COLLABORATION AND
REVENUE DISTRBUTION, IN SERVICING REQUESTS ON A COMPUTING
PLATFORM
Algorithm
A-1 The Revenue Distribution Hierarchy
a ism"
RvFe = ism"
b E,==1 RvFe = 1.0
RvEe < 1.0
2
< RVF1 < 1.0
LF < 1.0
oc > 0
L < 00
A-2 Specifying Recruitment Numbers to Optimise Participation Numbers
a NR t = RW x NR(LQRR) + (1¨ RW) x NR,(PSvR)
b NRt(LQRR) = (LQRRt- 1) x NSLCr
c NRt(PSvR) = (PSvRi_ ¨1) x NSLCt
¨T,T,p
NNRXt = [7. x ta3 T'P ( NNHt,p)1
1 ENSHt X NR, = [7:x 2õõ
p NNH NEHT +NNH )1 X NRt
e LQRRt = ATLL2EEt
f ALQEt = A7¨,Qt1 X XpP:7LQ
g NLQt = LQW x NSLCt = 0.25 x (NELCt + NNLCt)
TMEt = MCFt x 1 x zP,AISLCtsvit,pi
NSLCt "
NPCt/NSLCt
PSvRt = 1 Tp X LW + (1¨ LW) x pvctiNsLct
7x ET "pP Pi I Ht,p NSLHt,P
X NPHt,p/Nsukp
k NC t = {CNFt x 121-.2 x NSLCt]
RF,
m LQRRt > 1.0
PSvRt > 1.0
1
CA 02882486 2015-02-23
MCFto <1.0
LW < 1.0
- < CNFt < 1.0
3_
A-3 Service Provider Performance Evaluation
a SvVix = SW1 x SvNI/L, + SW2 x SySVL, + [1 ¨ (SW1 + SW2)] x SvE1,0,,
b SvNI/L, = EpiPN/Op x [(1 ¨ SW4) + SW4 x WEvp j}1
SySVL, = Ep[PS/Opjj x [(1 ¨ SW3 ¨ SW4) + SW3 x MCApjj + SW4 x WEvp,J,T11
SvE17LT = Ep[PEiop x {(1 ¨ SW3) + SW4 x WEvp,i,T
MCielthix = ec x MCP = x MCF
ALT T
MCP =0 1 2
WEvp,i,T = (1 ¨ SW5) x /Evpd + SW5 x XEvp,j,T
E71 = IB ,m,r
I EVp = (1¨ SW6) x lUEv
NPJJLT + SW6 x Ev pj
0 5_ SvVix RvFL x Ep Pl7p,1T
C? 1.0
0 < < 1.0
0 < 1.0
0 < XEv1. < 1.0
0 lUEvp,i,,,,T 5_ 1.0
0 5_ IBEvmom, < 1.0
0 < [SW1, SW2, SW3, SW4, 5W51 <1.0
0 < (SW1 SW2) < 1.0
A-4 Revenue Distribution for
Service Provision
a Sv/p,i,, SVIFThi,r X RVFL X PVp
= PNI +PSI + PEJp,j,r
b Sv/O = Sv/F0pix x RvFL x P1Ip
Sv/Omix = PN/Omix + PS/O. + PE/Omix
C PN/mix = PNWp x SvNFThix x RvFL x PVp
PSIpix = PSWp x SvSFpix x RvFL x PVp
PEIThix = PEWp x SvEFThix x RvFL x PVp
2
CA 02882486 2015-02-23
d PN/Opj = PNWp x SvNFOThj x RvFL x PVp
PSIOpj = PSWp X SvSFOpj x RvFL x PVp
PElOpi = PEWp x SvEFOThi x RvFL x PVp
e Sv/Fmix = PNWp x SvNFThix + PSWp x SvSFThix + PEWp x SvEFThp.
f Sv/F0"=,, = PNWp x SvNFOThi,, + PSWp x SvSFOAL, + PEWp x SvEFOthiy
g SvNFThix svNFopj coL,, svsFopj x coc,õ
= SvSF = =
=
pd,r
Erd SvNFO" X COL,,} svsFop, x
svEFopj x
SvEFThj,,
SvEF0m) x
SVNFON = Ea( A Wma X TNFpj,a); SvSFON = Ea( AWmax TSFp,j,õ)
SvEFON = Ea( AK,õ X TEFp j,a)
i
A WTha = AStWp,a X AMp,a AStWp,a X AStTp,aX Afp,a
Za AStWp,a X AMp,a Ea AStWma X AStTp,aX Afp,a
AStWma = DXWp,a + RiWp,a + EXWp,a
j
NAW
k Afma = ANfm.ba =E)ASfpv,a = E.IAEfmj,a
DxWma = DxPWp,a + DxMWp,a
2
m Ex Wma = ExPWp,a + EXMWp,a
2
p
TSF0,j,a
TNFOp TEFO",a
n TNFP,La = Ej TNE0p,),a TSFP'j'a = E.) TSF07, õLa j TEFP'j'a =
TEFOALa
ANf a AS f p,),a AE f p,j,a TNFOThi,a= ; TSFOThig=
TEFOpj,a =
Afp,a Afp,a Afp,a
E AN f a ¨ Afp,a E = Asf a ¨ Afp,a
P eTNFOThba= j eTSFOp =
Afp,a Afp,a
Ej AE f,b
pa ¨ Alma
eTEFO =
p,j,a
Afp,a
q EL,Sv/mix = RvFL x PVp
EjSvI0p,j,, = RvFLx PVp
j,rS121Fp,j,r = 1.0
E = svIF = = 1.0
73,1
EL, svNFpj,õ. = 1.0; EL, svsFpõ = 1.0; ELT. svEFpj,õ. = 1.0
PNWp + PSWp+ PEWp = 1.0
EpjAPN/pix + Psrpjõ + PE/mix] = RvF, x Ep PVp
3
CA 02882486 2015-02-23
Emi[FMOThi + FS/Op j -F FE/Omil = RVFL X Ep PVp
Ej SvNFON = 1.0; Ej SvSFON = 1.0; Ej SvEFOThi = 1.0
0 < AWTha <1.0
0 < AStVlIma 1.0
0 < AMTha < 1.0
0 < DxWma < 1.0; 0 < RiWp,a < 1.0; 0 < ExWma < 1.0
0 5_ DxPWTha < 1.0; 0 < ExPWTha < 1.0
0 < DxPWTha < 1.0; 0 < ExMWTha < 1.0
0 < AUTTha < 00
0 Afp,a <co
AWp,a = 1.0
0 < Ea <
Ea AMTha = 1.0
0 < TNFThix, 1.0; 0 < TSFpj,a 1.0; 0 < TEF < 1.0
¨
E j TN Fp,i,a = 1.0; Ei TSFpj,a = 1.0; E j TEFpj,a = 1.0
0 TNFpjx, <A; 0 TSFAJA <A; 0 TEFALa <A
Eji:AaTNFp,j,a = A; a TSFp ,J,01 = A; Ya TEFAL, = A
0 < AN fpi,a Afp,a; 0 ASfp,i,a < Afp,a; 0 AE fp,j,a
Afp,a
E j AN fp,j,, = Afp,a; Ej AN fp,i,a = Afp,a; EjANfpj,, =
Afp,a
A-5 Project Weights for Service Revenue Distribution
a P NWp = x e- [(1.' - Qw) x P SvR + QWx LQRRI
b PNW1 = ( < e
PEW1 = 1 ¨ PNW1 ¨ PSW1
d PSWp = P SW1 X (11_pPNNwwPi)
e PEWp = PEW1 x (11_,,PNNwWPD
f PNVVp
4
CA 02882486 2015-02-23
PSW1 [
r(1-pNwi) x NSP1 = (1-PNW1)1
[NSP1 + NSB2] 3 1
13 1.0
A-6 Revenue Distribution for Project Coordination
a = CRvF1, x x Ep Pvp,T
b CIO = CRvF01,1 X RvFL_i X Ep
CRvF. = CRvF0 X COL,
I'T cRvFoi,T X coLni
CRvF0 = x fa-cwi) + x wEvp,i,r)]
-
1'T Ei osviõ EpAcpvp,iõ x
{(1-cw1) + cwi x wEv)]
= (1¨ CW2) x + CW2 X XEvp,i,T
ENvm,õ
lu = /BEvo,,n,r
lEv = = (1¨ CW3) X
g CI
p,t,T CW3 x
= RvF,,_, x EmT Pl/m,
0 < CR-oFi- <1.0
0 5 OsVi EpCPVpj
O PV0,,
0 < WEvi <1.0
0 <
0 < 5_1.0
0 < WEvp,i,õ;,- <1.0
= 0 < < 1.0
CA 02882486 2015-02-23
Acronyms
AEf ¨ Frequency or repetitions, or otherwise fraction, associated with the
execution of a unit
of homogeneous activity
Af ¨ Frequency or repetitions of a unit of homogeneous activity, required
to constitute the
activity
ALQE ¨ Average of lower quartile ranked earnings
AM ¨ Activity magnitude
ANf ¨ Frequency or repetitions, or otherwise fraction, associated with the
negotiation of a
unit of homogeneous activity.
ASf ¨ Frequency or repetitions, or otherwise fraction, associated with the
supervision of a
unit of homogeneous activity.
AStT ¨ Standard time associated with the completion of a unit of
homogeneous activity
AStW ¨ Standard weight given to a unit of homogeneous activity
AW ¨ Activity weight
CI ¨ Coordinator's income
CNF ¨ Coordinator number fraction facilitating service provider promotion
COL ¨ Relative cost of living indicator of a region or country
CPV ¨ Coordinator's personal project oversight value
CRvF ¨ Coordinator's regionalised revenue fraction impaction their income
CRvF0 ¨ Coordinator's non-regionalised revenue fraction, which excludes
cost of living
considerations
CW1, CW2, CW3 ¨ Weights utilized in assessing coordinator's performance
DxMW ¨ Mental dexterity weight assigned to a project activity
DxPW ¨ Physical dexterity weight assigned to a project activity
DxW ¨ Comprehensive dexterity weight assigned to a project activity
eTEFO ¨ Error in assigning the preliminary task execution fraction
eTNFO ¨ Error in assigning the preliminary task negotiation fraction
eTSFO ¨ Error in assigning the preliminary task supervision fraction
ExMW ¨ Mental aspect of the exertion weight assigned to a project activity
ExPW ¨ Physical aspect of the exertion weight assigned to a project
activity
ExW ¨ Comprehensive exertion weight assigned to a project activity
1
CA 02882486 2015-02-23
IBEv ¨ Subordinate's evaluation of a supervisor's performance
IEv ¨ Internal evaluation of performance
IUEv ¨ Supervisor's evaluation of subordinate's performance
LF ¨ Shared level fraction
LQRR ¨ Remuneration ratio for the lower quartile of earners,
LQW ¨ Lower quartile weight
LW ¨ Project to service listing weight
MCA ¨ Minimum collaboration adherence
MCF ¨ Minimum collaboration fraction
MCP ¨ Minimum collaboration participation score
NC ¨ Number of coordinators in the hierarchical workspace
NEH ¨ Number of experts participants in historic projects
NELC ¨ Number of experts currently listed
NLQ ¨ Number of lower quartile ranked earners.
NNLC ¨ Number of novices currently listed
NNLH ¨ Number of novices listed in historic periods
NNRX ¨ Maximum number of novice recruits
NPC ¨Number of projects currently listed
NPH ¨ Number of historic projects
NR ¨ Number of recruits
NSLC ¨ Number of Service Providers listed currently
NWC ¨ Number of weight categories utilized in assessing the standardized
activity weights
OsV ¨ Coordinator's personal project oversight value with work quality
evaluation as added
influence
PEI ¨ Project execution income
PEIO ¨ Project execution income that excludes cost of living
considerations
PEW ¨ Project execution weight
PEW1 ¨ Project execution weight, when LQRR = 1.0 and PSvR = 1.0
PNI ¨ Project negotiation income
PNIO ¨ Project negotiation income that excludes cost of living
considerations
PNW ¨ Project negotiation weight
PNW1 ¨ Project negotiation weight, when LQRR = 1.0 and PSvR = 1.0
2
CA 02882486 2015-02-23
PSI ¨ Project supervision income
PSI() ¨ Project supervision income that excludes cost of living
considerations
PSvR ¨ Project to service ratio
PSW ¨ Project supervision weight
PSW1 ¨ Project supervision weight, when LQRR = 1.0 and PSvR = 1.0
PV ¨ Project value, after expenses
PVC ¨ Value of currently listed projects
PVH ¨ Value of historic or done projects
QW ¨ Weight assigned to the LQRR influence on PNW
RiW ¨ Risk weight assigned to a project activity
RvF ¨ Revenue fraction assigned to a given level of the hierarchy
RW ¨ Weight assigned to LQRR influence on recruitment numbers
SvEF ¨ Service execution fraction which includes relative cost of living
influences
SvEFO ¨ Non-regionalised service execution fraction, which excludes
relative cost of living
influences
SvEV ¨ Service execution value for service provider's performance
evaluation
SvI ¨ Service income or service provider income, which includes relative
cost of living
influences
SvIO ¨ Non-regionalised service provider income
SvIF ¨ Service income fraction, which includes relative cost of living
influences
SvIFO ¨ Non-regionalised service income fraction, which excludes relative
cost of living
influences
Syl\IF ¨ Service negotiation fraction, which includes relative cost of
living influences
SvNFO ¨ Non-regionalised service negotiation fraction, which excludes
relative cost of living
influences
SvNV ¨ Service negotiation value for service provider's performance
evaluation
SvSF ¨ Service supervision fraction, which includes relative cost of
living influences
SvSFO ¨ Non-regionalised service supervision fraction, which excludes
relative cost of living
influences
SySV ¨ Service supervision value for service provider's performance
evaluation
SIN ¨ Service value for service provider's performance evaluation
SW1, 5W2, 5W3, SW4, SW5 ¨ Weights utilized in evaluating service provider's
performance
3
CA 02882486 2015-02-23
TEF ¨ Task execution fraction
TEFO ¨ Preliminary estimate of task execution fraction
TME ¨ Targeted minimum earnings
TNF ¨ Task negotiation fraction
TNFO ¨ Preliminary estimate of the task negotiation fraction
TSF ¨ Task supervision fraction
TSFO ¨ Preliminary estimate of the task supervision fraction
WEv ¨ Work or performance evaluation
XEv ¨ External or client evaluation component of WEv
1502 Subscripts
a ¨ Power of the level difference
a ¨ Activity number index
¨ Constant (> 1.0), constraining the projecting negotiation weight
e ¨ Level number, in the hierarchical workspace
L ¨ Largest level number
P ¨ Total number of projects
i ¨ Coordinator number index
j ¨ Service Provider's number index
n ¨ Number index for evaluating supervisors
N ¨ Number total for evaluating supervisors
in ¨Number index for evaluating subordinates
M ¨Number total for evaluating subordinates
p ¨ Project number index
r ¨ Economic region number index
T ¨ Term or revenue generation period number index
4