Note: Descriptions are shown in the official language in which they were submitted.
I
SENSOR SYNCHRONIZATION APPARATUS AND METHOD
TECHNICAL FIELD
[0002] This disclosure relates to the field of railway track inspection and
assessment
systems.
BACKGROUND
[0003] Rail infrastructure owners are motivated to replace the time consuming
and
subjective process of manual crosstie (track) inspection with objective and
automated
processes. The intent is to improve rail safety in a climate of increasing
annual rail traffic
volumes and increasing regulatory reporting requirements. Objective,
repeatable, and
accurate track inventory and condition assessment also provide owners with the
innovative capability of implementing comprehensive asset management systems
which
include owner/region/environment specific track component deterioration
models. Such
rail specific asset management systems would yield significant economic
benefits in the
operation, maintenance and capital planning of rail networks.
[0004] A primary goal of such automated systems is the non-destructive high-
speed
assessment of railway track infrastructure. Track inspection and assessment
systems
currently exist including, for example, Georgetown Rail (GREX) Aurora 3D
surface
profile system and Ensco Rail 2D video automated track inspection systems.
Such
systems typically use coherent light emitting technology, such as laser
radiation, to
illuminate regions of the railway track bed during assessment operations.
[0005] An important factor limiting the speed at which railway inspections and
assessments can be accomplished is the performance of the measurement hardware
being
used to scan the railway. For example, SICK [VP Industrial Sensors of Sweden
produces
one of the highest speed three dimensional sensors available, capable of
producing
railway track measurements every 6 millimeters at 100 kilometers per hour
(4600 profiles
Robic Docket No 17271-0002
CA 2893007 2019-07-30
2
per second). Although the nominal longitudinal sample spacing resolution using
a single
sensor is acceptable, higher performance systems would be beneficial,
increasing analysis
capabilities and resulting in improved condition assessments.
[0006] What is needed, therefore, is a means to increase the survey speed of
shorter
longitudinal sample interval railway track inspections and assessments using
sensors with
limited measurement speed performance.
SUMMARY
[0007] A system for inspecting railway track infrastructure at high speed and
high
resolution is disclosed wherein the system includes a power source (e.g., a
gas powered
engine providing electrical power, a generator or a battery); a light emitting
apparatus
powered by the power source for emitting light energy toward a railway track;
and a data
storage apparatus. The system further includes a first sensor directed to a
first viewing
area for sensing reflected light that was emitted from the light emitting
apparatus and
acquiring three-dimensional image data of the railway track to be stored in
the data
storage apparatus. The image data is preferably elevation (or range) and
intensity data
gathered using a 3D sensor. The system further includes a second sensor
substantially
collinear and adjacent with the first sensor and directed to the first viewing
area for
.. sensing reflected light that was emitted from the light emitting apparatus
and acquiring
three dimensional image data of the railway track to be stored in the data
storage
apparatus. The system also includes a high resolution distance measuring
encoder for
providing longitudinal sample pulse distance data. The system also includes at
least one
processor in communication with the data storage apparatus, the first sensor,
the second
sensor, and the distance measuring encoder wherein the at least one processor
is
configured the processor for sequencing the timing of operation for the first
sensor and
the second sensor in a cascading, repeating manner such that the first sensor
is triggered
for operation while the second sensor is on standby and wherein the second
sensor is
triggered for operation while the first sensor is on standby, and wherein
multiplexed data
gathered by the first sensor and the second sensor are combined and
demultiplexed to
Robic Docket No. 17271-0002
CA 2893007 2019-07-30
3
generate a higher resolution resultant three dimensional image data of the
railway track
than if only a single sensor were used.
100081 In one example the longitudinal resolution of the system includes a
fixed distance
interval between samples ranging from about 2 millimeters to about 3
millimeters when
the system travels longitudinally at a speed ranging from about 70 kilometers
per hour to
about 110 kilometers per hour wherein the first sensor and the second sensor
are each
configured to take a maximum of from about 4500 samples per second to about
5500
samples per second.
100091 In a related example, a system for inspecting railway track
infrastructure at high
speed and high resolution is disclosed wherein the system includes a power
source; a
light emitting apparatus powered by the power source for emitting light energy
toward a
railway track; and a data storage apparatus. The system further includes a
first sensor for
sensing reflected light that was emitted from the light emitting apparatus and
acquiring
three dimensional image data of the railway track to be stored in the data
storage
apparatus; and a second sensor substantially collinear with and adjacent to
the first sensor
and directed to the first viewing area for sensing reflected light that was
emitted from the
light emitting apparatus and acquiring three dimensional image data of the
railway track
to be stored in the data storage apparatus. The system also includes a high
resolution
distance measuring encoder for providing longitudinal sample pulse distance
data. The
system further includes an Nth sensor substantially collinear with and
adjacent to the first
sensor and the second sensor and directed to the first viewing area, wherein N
is a set of
one or more ordinal numbers each of which equals a different integer of 3 or
greater, for
sensing reflected light that was emitted from the light emitting apparatus and
acquiring
three dimensional image data of the railway track to be stored in the data
storage
apparatus. For example, N may equal "third" (3rd). In a related example. N may
equal
"third" (3rd) and "fourth" (4th). In yet another example, N may equal "third",
"fourth" and
"fifth" (5th). The system further includes at least one processor, wherein the
processor is
configured for sequencing the timing of operation for the first sensor, the
second sensor,
the Nth sensor and the distance measuring encoder, in a cascading, repeating
manner such
that the first sensor is triggered for operation while the second sensor and
the Nth sensor
Robic Docket No. 17271-0002
CA 2893007 2019-07-30
4
are on standby, wherein the second sensor is triggered for operation while the
first sensor
and the Nth sensor are on standby, and wherein the Nth sensor is triggered for
operation
while the first sensor and the second sensor are on standby, wherein
multiplexed data
gathered by the first sensor, the second sensor and the Nth sensor are
combined and
demultiplexed to generate a higher resolution resultant three dimensional
elevation and
intensity data of the railway track bed than if only two sensors were used.
[0010] If N equals 'third" and "fourth", the third sensor is activated while
the first,
second and fourth sensors are on standby, and the fourth sensor is activated
while the
first, second and third sensors are on standby. If N equals "third", "fourth"
and "fifth",
the fifth sensor is activated while the first, second, third and fourth
sensors are on standby
and the fifth sensor is on standby whenever the first, second, third or fourth
sensors are
activated.
[0011] In addition to the system disclosed herein, a method is disclosed of
inspecting
railway track infrastructure at high speed and high resolution. The method
includes the
steps of emitting a light source toward a railway track bed; receiving
longitudinal sample
pulse distance data from a high resolution distance measuring encoder;
sequencing the
timing for activation of a first sensor and a second sensor directed in the
same viewing
area, in a repeating pattern so that the first sensor is activated during a
time period when
the second sensor is on standby and the first sensor is on standby during a
time period
when the second sensor is activated, wherein the first sensor is collinear
with and
adjacent to the second sensor; detecting light reflected from the railway
track bed using
the first sensor while the first sensor is activated; and detecting light
reflected from the
railway track bed using the second sensor while the second sensor is
activated.
[0012] In one example, the sequencing step further comprises using a processor
to trigger
sensors and multiplex data based on the number of sensors used to detect light
reflected
from the railway track bed.
100131 In another example, the method further includes the steps of compiling
a data set
of first elevation data based on the light detected by the first sensor; and
compiling a data
set of second elevation data based on the light detected by the second sensor.
The method
Robic Docket No. 17271-0002
CA 2893007 2019-07-30
5
preferably further includes storing the first elevation data on a data storage
apparatus and
storing the second elevation data on a data storage apparatus. The method
preferably
further includes the step of combining the first elevation data and the second
elevation
data to compile a total elevation data set. In one embodiment, the total
elevation set has a
longitudinal resolution ranging from about 0.002 meters between samples to
about 0.004
meters between samples while the first sensor and the second sensor are
traveling at a
speed ranging from about 70 kilometers per hour to about 110 kilometers per
hour. The
method preferably further includes the step of analyzing the total elevation
data set to
inventory components of the railway track infrastructure and to assess the
condition of
the railway track infrastructure.
100141 In a different example, the sequencing step further comprises using a
multiplexed
trigger processor and an encoder to generate different timing phases to
trigger the
activation of a first sensor based on the first phase and triggering the
activation of a
second sensor based on the second phase trigger signal from the processor.
[0015] In another example, the sequencing step further includes sequencing the
timing
for activation of a third sensor so that the third sensor is activated during
a time period
when the first sensor and the second sensor are on standby; and detecting
light reflected
from the railway track bed using the third sensor while the third sensor is
activated. The
method may further include the step of a data set of third elevation data
based on light
detected by the third sensor. A further step may include combining the first
elevation
data, the second elevation data and the third elevation data to compile a
total elevation
data set. In one embodiment, the total elevation data set may have a
longitudinal
resolution ranging from about 0.001 meters between samples to about 0.003
meters
between samples while the first sensor, the second sensor and the third sensor
are
traveling at a speed ranging from about 70 kilometers per hour to about 110
kilometers
per hour. The sequencing step may further include the step of triggering the
activation of
the third sensor based on a third phase signal from the multiplexed trigger
processor.
Robic Docket No. 17271-0002
CA 2893007 2019-07-30
6
100161 In yet another example, the method further includes the steps of
storing the first
sensor elevation and intensity data on a data storage apparatus; and storing
the second
sensor elevation and intensity data on the data storage apparatus.
100171 In a different example, the method further includes the step of
combining the first
elevation and intensity data and the second elevation and intensity data to
generate total
elevation and intensity data. The method may further include the step of
analyzing the
total data sets to assess the condition of the railway track.
According to another aspect, a system for inspecting railway track
infrastructure at high
speed and high resolution is provided. The system comprises a power source; a
light
emitting apparatus powered by the power source for emitting light energy
toward a
railway track bed; a data storage apparatus; a first sensor; a second sensor
and a high
resolution distance measuring encoder. The first sensor is directed to a first
viewing area
for sensing reflected light that was emitted from the light emitting apparatus
and
acquiring three dimensional elevation and intensity data of the railway track
bed to be
stored in the data storage apparatus; the second sensor is directly adjacent
with the first
sensor and directed to the first viewing area for sensing reflected light that
was emitted
from the light emitting apparatus and acquiring three dimensional elevation
and intensity
data of the railway track bed to be stored in the data storage apparatus. The
high
resolution distance measuring encoder provides longitudinal sample pulse
distance data.
The system also comprises at least one processor in communication with the
data storage
apparatus. the first sensor, the second sensor, and the distance measuring
encoder. The at
least one processor is configured for sequencing the timing of operation for
the first
sensor and the second sensor in a cascading, repeating manner such that the
first sensor is
triggered for operation while the second sensor is on standby and wherein the
second
sensor is triggered for operation while the first sensor is on standby, and
wherein data
gathered by the first sensor and the second sensor are combined to generate a
higher
resolution resultant three dimensional elevation and intensity data of the
railway track
bed than if only a one or two sensors were used.
Robic Docket No. 17271-0002
CA 2893007 2019-07-30
6a
Yet according to another aspect, a method of inspecting railway track
infrastructure at
high speed and high resolution using a synchronization processor is provided.
The
method comprises the steps of: emitting light from a light source toward a
railway track
bed; receiving longitudinal sample pulse distance data from a high resolution
distance
measuring encoder; receiving maximum sensor sampling rate data; receiving
maximum
survey speed data; sequencing the timing for activation of a first sensor and
a second
sensor directed in the same viewing area in a repeating pattern based on the
received
longitudinal sample pulse distance data, the received maximum sensor sampling
rate data,
and the received maximum survey speed data so that the first sensor is
activated during
time periods when the second sensor is on standby and the first sensor is on
standby
during time periods when the second sensor is activated and wherein the first
sensor is
directly adjacent to the second sensor; detecting light reflected from the
railway track bed
using the first sensor while the first sensor is activated; and detecting
light reflected from
the railway track bed using the second sensor while the second sensor is
activated.
[0018] The summary provided herein is intended to provide examples of
particular
disclosed embodiments and is not intended to limit the scope of the invention
disclosure
in any way.
BRIEF DESCRIPTION OF THE DRAWINGS
[0019] Further features, aspects, and advantages of the present disclosure
will become
better understood by reference to the following detailed description, appended
claims,
and accompanying figures, wherein elements are not to scale so as to more
clearly show
the details, wherein like reference numbers indicate like elements throughout
the several
views, and wherein:
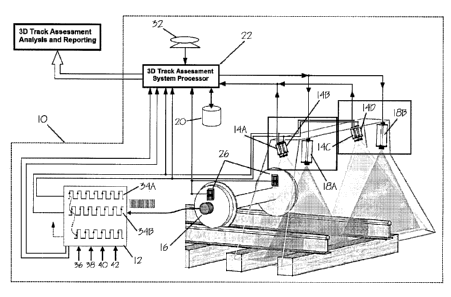
[0020] FIG. 1 shows a schematic diagram of a railway track infrastructure
inspection and
assessment system;
Robic Docket No. 17271-0002
CA 2893007 2019-07-30
6b
[0021] FIG. 2 shows a graphical representation of the multiplexed trigger and
sensor
activation sequencing for a two sensor system configuration.
[0022] FIG. 3 shows a schematic view of a sensor multiplex and synchronization
system.
[0023] FIG. 4 shows a schematic view including data collection and data de-
multiplexing
for a two sensor system.
[0024] FIG. 5A shows a visual representation of data from a first sensor in a
two sensor
system.
[0025] FIG. 5B shows a visual representation of data from a second sensor in a
two
sensor system.
Robic Docket No. 17271-0002
CA 2893007 2019-07-30
CA 02893007 2015-05-29
7
[0026] FIG. 5C shows a visual representation of data combined from the image
of FIG.
5A and the image of FIG. 5B.
[0027] FIG. 6 shows a detailed flow chart for a multiple sensor de-
multiplexing system.
[0028] FIG. 7 shows the preferred sensor orientation and location with respect
to the
track bed rails.
[0029] FIG. 8 shows a somewhat schematic view of data being collected,
distortion and
real world coordinate corrected and merged from two enclosures, each with two
sensors.
[0030] FIG. 9A shows an image of pixel elevation data of the left side of a
railway track
bed.
[0031] FIG. 9B shows an image of pixel elevation data of the right side of a
railway track
bed.
[0032] FIG. 10A shows a close-up image of detailed pixel elevation data of the
left side
of a railway track bed.
[0033] FIG. 10B shows a close-up image of detailed pixel elevation data of the
right side
of a railway track bed.
[0034] FIG. 11 shows a full track bed width 3D elevation map combining the
data shown
in FIGS. 9A and 9B.
[0035] FIG. 12 shows a close-up view of a portion of the full track bed width
3D
elevation map from FIG. 11.
[0036] FIG. 13 shows a flow chart that illustrates steps involving an
elevation distortion
correction method with an output of true elevation data.
[0037] FIG. 14 shows a schematic view of how elevation distortion is corrected
based on
measured elevation (Zn) and lateral offset (Xn) values.
Robic Docket No. 17271-0002
CA 02893007 2015-05-29
8
100381 FIG. 15 shows a flowchart of steps of combining left and right 3D track
data and
merging the data into a single 3D elevation data matrix.
[0039] FIG. 16 shows a flow chart that illustrates steps involving left and
right data
streams merging and a conversion of data to real-world coordinates.
[0040] FIG. 17 shows a schematic view of a step pyramid based calibration
block
positioned at various positions within a sensor field of view.
[0041] FIG. 18 shows a graphical representation of the detailed multiplexed
trigger
timing for a two sensor system configuration; and
[0042] FIG. 19 shows a sensor array with N sensors, demonstrating that
multiple sensors
may be used to increase system resolution.
[0043] The figures are provided to illustrate concepts of the invention
disclosure and are
not intended to limit the scope of the invention disclosure to the exact
embodiments
provided in the figures.
DETAILED DESCRIPTION
100441 Various terms used herein are intended to have particular meanings.
Some of
these terms are defined below for the purpose of clarity. The definitions
given below are
meant to cover all forms of the words being defined (e.g., singular, plural,
present tense,
past tense). If the definition of any term below diverges from the commonly
understood
and/or dictionary definition of such term, the definitions below control.
[0045] "Track", "Railway track" or "track bed" is defined herein to mean a
section of
railway including the rails, ties, components holding the rails to the ties,
and ballast
material.
[0046] "Sample" or "profile" is defined herein to include a discrete
measurement of
reflected light during a specifically defined time period.
Rabic Docket No. 17271-0002
CA 02893007 2015-05-29
9
[0047] A "processor" is defined herein to include a processing unit including,
for
example, one or more microprocessors, an application-specific instruction-set
processor,
a network processor, a vector processor, a scalar processor, or any
combination thereof,
or any other control logic apparatus now known or later developed that is
capable of
performing the tasks described herein, or any combination thereof.
[0048] The phrase "in communication with" means that two or more devices are
in
communication with one another physically (e.g., by wire) or indirectly (e.g.,
by wireless
communication).
[0049] The collection of track surface elevation data for use in railway track
bed
inventory and condition assessment is possible using a comprehensive track
measurement
system 10 including a variety of sensors, processors and data storage devices
as shown in
FIG. 1. The ability to collect high longitudinal resolution (small
longitudinal
measurement interval) track surfac,? elevation models is achieved using an
innovative 3D
sensor multiplexed trigger and synchronization system 12 and a plurality of
readily
available commercial-off-the-shelf 3D sensors 14 (including a first sensor 14A
and a
second sensor 14B) to collect and store 3D track elevation data at any fixed
longitudinal
measurement interval at any survey speed. This triggering system uses a high
resolution
distance measuring encoder 16 that preferably operates with a sufficient
number of pulses
per wheel revolution to produce a longitudinal sample pulse distance of
approximately
0.25 mm per pulse. A first light line projector 18A (e.g. a laser) projects
light on a
railway track bed and some of the light is reflected off of the track bed and
detected by
the 3D sensors 14. The data from the 3D sensors 14 is preferably stored on one
or more
high speed data storage apparatus 20.
[0050] The 3D track measurement system 10 preferably includes a 3D track
assessment
system processor 22 and a trigger and synchronization processor 24. The high
resolution
distance measuring encoder 16, the plurality of 3D sensors 14 and preferably a
plurality
of axle accelerometers 26 are in communication with and controlled by the
assessment
system processor 22. The assessment system processor 22 is in communication
with the
Robic Docket No. 17271-0002
CA 02893007 2015-05-29
high speed data storage apparatus 20 and is configured to direct data from the
3D sensors
14 to the high speed data storage apparatus 20.
[0051] Intensity and elevation data is gathered by the 3D sensors 14 and such
data is
stored in the high speed storage apparatus 20. The resolution of the system 10
is
5 improved using a plurality of sensors 14 triggered in a cascading fashion
to produce a
combined data collection rate which exceeds the data collection rate of any
single sensor.
The data gathered by the group of sensors 14 is ultimately interlaced and
stored together,
thereby creating a data set having a smaller longitudinal interval between
samples
(resulting in higher resolution 3D data) than if a single 3D sensor was used.
If two
10 sensors are used, for example, the first sensor 14A is activated while
the second sensor
14B is on standby as shown in block 28 and the second sensor 14B is activated
while the
first sensor 14A is on standby as shown in block 30 of FIG. 2. What is meant
by "on
standby" is broadly defined as not actively gathering data but could include
activities
such as compiling and transmitting data. Any number of sensors may be
sequentially
triggered thereby increasing the system resolution as shown for example in
FIG. 3.
[0052] In addition to elevation and intensity data, each measurement is
referenced by the
encoder 16, and such reference values are preferably linked to geospatial
coordinates
associated with the location of the system 10 when each measurement is taken.
The
geospatial coordinates are provided by a Global Positioning System (or Global
Navigation Satellite System (GNSS)) device 32 in communication with the
assessment
system processor 22. These position reference values are stored in the high
speed storage
apparatus 20 for later analysis.
[0053] Based on implementation specific configuration parameters provided by
the
system processor 22 as inputs into the 3D sensor multiplexed trigger and
synchronization
processor 12, any number of equal distance (synchronized to the high
resolution
displacement encoder) and multiplexed sensor trigger signals can be generated.
An
example embodiment uses two separate multiplexed 3D sensor trigger signals 34
as
shown for example in FIG. 1. The required inputs for the trigger and
synchronization
processor 12 include Encoder Longitudinal Pulse Interval (distance) 36,
Maximum
Robic Docket No. 17271-0002
CA 02893007 2015-05-29
11
Sensor Sample Rate (samples per second) 38, Desired Longitudinal Sample
Interval
(distance) 40, and Maximum Survey Speed (velocity) 42 as shown for example in
FIG. 1
and FIG. 3. Sensor trigger signals are generated and sent to the respective
sensors
including a first sensor trigger signal 34A, a second sensor trigger signal
34B, a third
sensor trigger signal 34C, and an Nth sensor trigger signal 34D.
[0054] FIG. 4 presents a schematic view showing the de-multiplexed data 44
from a two
sensor system. During data collection, the trigger and synchronization system
12
produces signals which trigger the two sensors 14A and 14B to alternately
collect
elevation profiles. In this example, the rising edge of each trigger channel
(first sensor
34A trigger and second sensor 34B trigger in FIG. 4) initiates the collection
of single
instantaneous elevation profiles at uniform fixed longitudinal distances along
the survey
path. The odd trigger pulses (46, 48, and 50 in FIG. 4) initiate data
collection for the first
sensor 14A to provide first sensor first sample data 52, first sensor second
sample data
54, and first sensor third sample data 56; and the even trigger pulses (58, 60
and 62)
initiate data collection for the second sensor 14B to provide second sensor
first sample
data 64, second sensor second sample data 66, and second sensor third sample
data 68.
The multiplexed 3D elevation data is stored in the data storage apparatus 20
as a separate
data file for each sensor. Linea,- position references are logged for each
recorded
elevation profile (Enclosure #, Sensor #, encoder count #). This linear
referencing
information from all sensors is preferably logged in a single file.
[0055] During data de-multiplexing the logged linear position reference
preferably is
used to correctly sequence and combine elevation/intensity scans from
individual sensors
into a single consolidated file. The linear reference count identifies any
sensor collection
errors (missing scans from any sensor) and allows correctly de-multiplexing
the input
sensor data files even in the event that scan errors have occurred.
100561 FIG. 5A, FIG. 5B and FIG. 5C show the visual results of de-multiplexing
two
separate sensor channels (visual representation of data 70A from the first
sensor 14A
shown in FIG. 5A and visual representation of data 70B from the second sensor
14B
shown in FIG. 5B) into a consolidated 3D data file 72 shown in FIG. 5C. In
this example
Robic Docket No. 17271-0002
CA 02893007 2015-05-29
12
the first and second input sensor data 70 have a longitudinal sample
separation of 6 mm,
and the resulting de-multiplexed output data file 72 has an effective
longitudinal sample
separation of 3 mm.
[0057] FIG. 6 shows a detailed flow chart for a multiple sensor de-
multiplexing system.
The approach includes sensor data file size determination, data de-
multiplexing and data
error recovery. The method is applicable for use with any number of
multiplexed
sensors. The first step determines the size of data from each sensor (step
74). Individual
sensor data sizes are compared to ensure they are of equal size (step 76). If
the sensor
files are equal size, the de-multiplexed output file is created (step 78) by
selecting the
same numbered sample from each multiplexed sensor data file in sequential
order (step
80). This process is repeated for each sample contained in all individual
sensor data files
(step 82).
[0058] If any of the data files are found to differ in size (representing a
sensor error
condition), the magnitude of the size difference is compared against the
maximum
permissible difference threshold (step 84). Any sensor file size differences
which exceed
the maximum difference thresholcl- (step 84) result in the termination of all
processing
(step 86). In cases where all detected file size differences are less than the
maximum
permissible difference threshold (step 84), processing is initiated, and the
de-multiplexed
output file is created (step 88) by testing the validity of each multiplexed
sensor data
sample (step 90). If the current sensor data sample is valid (step 90), it is
copied to the
de-multiplexed output file (step 88), if the sample is invalid an approximated
sample
fabricated and this infill sample is copied to the de-multiplexed output file
(step 88). This
process is repeated for each sample contained in all individual sensor data
files (step 92).
[0059] Two separate sensor measurement positions are used to maximize the
elevation
and intensity data collection coverage on both sides of each rail. These
sensor enclosure
positions are as shown in FIG. 7. A first sensor enclosure 102A measurement
position is
centered above a left rail 104A and a second sensor enclosure 102B measurement
position is centered above a right rail 104B. Multiple synchronized sensors at
each
enclosure are used to improve sample rate performance. For example, sensors
14A and
Robic Docket No. 17271-0002
CA 02893007 2015-05-29
13
14B are contained in the first enclosure 102A with the first light line
projector 18A and a
third sensor 14C and a fourth sensor 14D are contained in the second enclosure
102B
with a second light line projector 18B as shown for example in FIG. 7. First
multiplexed
elevation/intensity data 106A and 106B gathered from the first enclosure 102A
and
second multiplexed elevation/intensity data 107A and 107B gathered from the
second
enclosure 102B are de-multiplexed to produce a left rail data file 108A and a
right rail
data file 108B. The left rail data file 108A and the right rail data file 108B
are then lens
distortion corrected as shown in block 110A for the left rail data and block
110B for the
right rail data. The left rail data file 108A and the right rail data file
108B are also real
world elevation corrected as shown in block 112A for the left rail data and
block 112B
for the right rail data. The data files are then finally merged to produce a
full width 3D
elevation map 114 as shown in FIG. 8.
[0060] FIG. 9A shows left side sensor pixel elevation data 116A including the
left rail
104A and a plurality of ties 118. FIG. 9B shows right side sensor pixel
elevation data
116B including the right rail 104B and the plurality of ties 118. The
individual sensor
pixel elevation data files 116 represent a railway track bed section about 30
meters long
and about 1.6 meters wide. A detailed close-up view of a portion of the left
side pixel
elevation data 116A is shown in FIG. 10A and a detailed close-up view of a
portion of
the right side sensor pixel elevation data 116B is shown in FIG. 10B. The
sensor pixel
elevation data 116 are corrected for lens spherical and other sensor
distortions 110, and
converted from pixel elevation to real-world coordinates 112 and then merged
to form a
full width elevation map 114 as shown in FIG. 8. A full width sensor pixel
elevation data
file 120 is shown in FIG. 11. A close up view of a first portion of the full
width sensor
pixel elevation data file 122 is shown in FIG. 12.
[0061] FIG. 13 shows a flowchart of the sequence of steps in creating the 3D
elevation
maps including combining left and right sensor data (step 128), correcting for
sensor and
lens distortion (step 130), and real world coordinate conversion (step 132) to
provide a
3D elevation data matrix (step 134) representing elevation and intensity data
for a
specified area of track, preferably having a size of about 30 meters by about
3.2 meters.
Robic Docket No. 17271-0002
CA 02893007 2015-05-29
14
[0062] The sensor and lens distortion correction method uses a lookup table
(LUT) to
remove distortion effects in the measured elevation profile. Separate sensor
and lens pair
elevation correction lookup tables (LUTuls-r) return scalar vertical elevation
correction
values (AZõ) for each raw elevation profile (X, Z) location 136 as shown in
FIG. 14
where X is the lateral offset and Z is the measured pixel elevation.
100631 Lookup tables are also used to determine the correct merge points for
each
corresponding left and right channel scan lines. As shown in FIG. 15, the
track
assessment system processor 22 accesses left rail elevation data (step 138)
and right rail
elevation data (step 140). The data size of the left rail elevation data is
verified (step 142)
and the data size of the right rail elevation data is verified (step 144). If
the left and right
elevation scan lines are the same size (step 146) then the left channel scan
line end merge
point is determined based on the distance from the left sensor to the track
bed surface
(step 148), and the right channel scan line start merge point is determined
based on the
distance from the right sensor to the track bed surface (step 150). The
individual left
(ELEVL) and right (ELEVR) scan lines are then merged based on the left channel
end
point and the right channel start point (step 152). This process is repeated
for all scan
lines in the elevation map (step 154).
[0064] Two separate lookup tables are used to convert from 3D sensor pixel
elevation
coordinates to engineering units (real world coordinates). FIG. 16 shows an
elevation
distortion correction method flow chart with an output of true elevation data.
Using the
de-multiplexed sensor pixel elevation data files as input (step 160), sensor
specific lens
distortion lookup tables LUTnisri are used to produce the distortion corrected
de-
multiplexed scan lines (NoDistDeMux) (step 162). Each corrected sensor pixel
unit
based NoDistDeMux scan line is then real world coordinate corrected using the
LUTRwc
lookup table (step 164). The result is the true elevation profiles (step 166).
This process
is preferably completed for all elevation map files. Once merged, the full
width 3D
elevation map files represent an accurate 3D model of the surveyed track bed,
as shown
for example in FIG. 11.
Robic Docket No. 17271-0002
CA 02893007 2015-05-29
[0065] 3D sensor distortion and coordinate calibration can be accomplished for
example
using a step pyramid based calibration block 168 positioned at various
positions within
the sensor field of view as shown for example in FIG. 17. The resulting
referenced
elevation measurements are made both above and below the nominal design sensor
5 standoff distance and can provide distortion and real world elevation
corrections for
objects in the entire field of view of the sensor. The calibration block edges
(16 corners
for the block used in this example) are detected and the sensor measured
elevations
calculated for each position as the block 168 is moved from a Start position
170 to an End
position 172 producing reference elevation locations throughout the sensor
transverse
10 field of view. The relationships between the measured and the reference
elevations are
then calculated for each sensor/lens combination. The individual sensor lookup
tables
embody these measured to actual elevation conversion relationships.
[0066] Although two sensors per rail are described in the foregoing examples,
the number
of sensors can vary, and a higher number of sensors will decrease the
longitudinal
15 spacing between samples of the final merged elevation data files for the
same survey
speed. The number of sensors required (and therefore the number of trigger
signals) is
determined by Equation 1 below as follows:
Equation 1:
Survey Speed
NSensors = ceil (Sensor Rate X Sample Interval)
Where;
NSensors = the number of 3D measurement sensors required to achieve the
desired measurement interval
Survey Speed = the target track inspection and assessment speed
Sensor Rate = the nominal maximum measurement rate of the 3D sensor
Sample Interval = the target fixed longitudinal sample (measurement) interval
cell( ) = is the mathematical Ceiling function (next largest integer)
Robic Docket No. 17271-0002
CA 02893007 2015-05-29
16
[0067] For example, for an embodiment which uses 3D sensors with a Maximum
Sampling Rate of 5000 samples/second, and a Maximum Survey Speed of 27
meters/second (97 kph), and a Desired Longitudinal Sample Interval of 0.003
meter/sample, the number of sensors would be as follows:
Equation 2:
27 m/sec
Nsensoõ = ceil
5000 samples/sec x 0.003 m/sample) = 2
[0068] The trigger and synchronization processor 24 calculates the correct
encoder
divider using Equation 3 below as follows:
Equation 3:
Sample Interval x N
Sensors
NDivide Encoder = Encoder Interval
Where;
NDivideE.der = the division factor required to convert the displacement
encoder interval to the desired measurement interval
Sample Interval = the target fixed longitudinal sample (survey measurement)
interval
NSensors = the number of 3D measurement sensors being employed
Encoder Interval = the longitudinal sample interval of the displacement
encoder
[0069] For example, in an embodiment described herein, using a longitudinal
survey
sample interval of 0.003 m, a displacement encoder longitudinal sample
interval of
0.00023 m and 2 sensors, using Equation 4, the trigger and synchronization
processor 24
would determine the following:
Equation 4:
Robic Docket No. 17271-0002
CA 02893007 2015-05-29
17
(0.003 m x 2)
= 26
NDivideEncoder = round ________________________
0.000231 m
[0070] Given the Nsensors and NDivideEncoder parameters, a sensor per channel
multiplexer
delay can be calculated by the trigger and synchronization processor 24 using
Equation 5
below as follows:
Equation 5:
NDivideEncoder x (ChannelNuni ¨ 1)
DelaYChannel
NSensors
Where;
Delaychannel = the number of displacement encoder pulses required to ensure
that each 3D sensor measurement is synchronized and equally
spaced along the survey path
NDivideEncõdõ = the division factor required to convert the displacement
encoder interval to the desired measurement interval
ChannelNum = the 3D sensor channel number (ranging from 1 to Nsensors)
NSensors = the number of 3D measurement sensors being employed
[0071] In the example two sensor per rail embodiment above the sensor per
channel
multiplexer delay, (delay defined in terms of input encoder pulse numbers)
would be as
defined below using Equation 6:
Equation 6:
26 x ({1, 2) ¨ 1)
{Delayi , Delay2} = _____________________ 2 = {0, 13)
Where;
Delay' = the number of displacement encoder pulses required to synchronize
and delay the first 3D sensor (for example 14A)
Delay2 = the number of displacement encoder pulses required to synchronize
and delay the second 3D sensor (for example 14B)
Robic Docket No. 17271-0002
CA 02893007 2015-05-29
18
100721 A trigger and synchronization system block diagram is provided for
example in
FIG. 3. The trigger and synchronization system 12 uses quadrature encoder
inputs from
wheel encoder 16, inputs for Encoder Longitudinal Pulse Interval 36, Maximum
Sensor
Sample Rate 38, Desired Longitudinal Sample Interval 40, and Maximum Survey
Speed
.. 42 and includes the trigger and synchronization processor 24 capable of
determining the
correct sensor timing and synchronization requirements given the available
inputs, a
programmable delay component 174 to generate any arbitrary time delayed
trigger signal
which can be routed to any of N external sensors by a multiplexer 176. For the
example
embodiment configuration presented above the trigger and synchronization
system 12
.. would generate two sensor trigger signals 34A and 34B, each with a
longitudinal distance
separation of 6mm (representing 26 input encoder pulses, regardless of survey
speed),
and with the second sensor trigger delayed by 3mm (or 13 input encoder
pulses), ensuring
the two sensors 14A and 14B were producing 3D scan measurements which were 6mm
apart and equally spaced. This is shown graphically in FIG. 18.
[0073] The methods used by the trigger and synchronization system 12 described
herein
provide the ability to determine the number of sensors required to attain any
required
longitudinal resolution at any survey speed, given the system sensor data
collection rate.
Once the operational design specifications are defined and calculated, the
trigger and
synchronization processor 24 generates correct duration and correctly
multiplexed trigger
.. signals for all required sensors.
[0074] The sensor trigger and synchronization processor 24 also preferably
produces
motion status and laser interlock signals based on the signals sensed from the
displacement encoder 16 and analyzed by a velocity analyzer 178 as shown in
FIG. 3. In
order to produce these control outputs, the trigger and synchronization
processor 24
requires a quadrature input encoder stream capable of providing both
displacement
(movement) and direction (quadrature phase arrival time sequence) information
inputs.
The trigger and synchronization processor 24 includes methods and algorithms
to
calculate both a STOPPED_TRUE signal 180 (TRUE when the displacement encoder
forward or reverse direction motion is less than a predefined programmable
threshold)
.. and a LASER_ENABLE signal 182 (TRUE when continuous and sustained forward
or
Robic Docket No. 17271-0002
CA 02893007 2015-05-29
19
reverse direction motion is detected). A velocity analysis algorithm
accumulates encoder
motion counts (displacement) and direction (quadrature input phase arrival
timing) over
fixed time intervals to determine the effective encoder velocity vector
(direction x
displacement/time). The consistency of the velocity is assessed to eliminate
non-uniform
or erratic calculated velocities typically caused by wheel or chassis
vibration while in an
otherwise stopped or static state. When the magnitude of the effective
instantaneous
velocity vector is uniform in direction and exceeds an internal Minimum Valid
Motion
Velocity threshold (programmable) STOPPED TRUE = FALSE, STOPPED_TRUE =
TRUE otherwise. When the magnitude of the velocity vector exceeds the Minimum
Laser Enable Velocity threshold (programmed) LASER_ENABLE is set to TRUE,
otherwise LASER_ENABLE is set to FALSE. These signals are preferably generated
continuously and in real-time and are provided to the track assessment system
processor
22 to be distributed to other safety and data collection processes.
100751 FIG. 19 shows an embodiment with a first sensor 184A, a second sensor
184B and
an Nth sensor 184C wherein N equals an ordinal number, and illustrates how any
number
of sensors may be used to increase the resolution of the track measurement
system 10.
FIG. 3 shows a schematic view of a wheel encoder 16 and at least three
sequential sensor
trigger signals including a first trigger signal phase controlling a first
sensor trigger
output signal fimetion 34A, a second trigger signal phase controlling a second
sensor
trigger output signal 34B, and an Nth sensor trigger signal phase controlling
the Nth sensor
trigger output signal 34D wherein the trigger rate is a function of encoder
rotation rate. In
this example embodiment, the use of a number of optically aligned and
sequentially
triggered 3D sensors 184 produ..;es higher resolution (closer longitudinal
spacing)
elevation profiles at higher speeds. Competitive systems are limited to
approximately
5000 profiles per second (with 6mm/0.25in between samples at 100kph/60mph).
The
high density and high resolution 3D surface profiles produced by the track
measurement
system 10 described herein improve the feature classification and parameter
measurement
accuracy capabilities and can provide a resolution of 5,000 profiles per
second (with
3mm/0.125in between samples at 100 kph/60 mph for a two sensor per rail
configuration,
or better for an increased number of sensors).
Robic Docket No. 17271-0002
CA 02893007 2015-05-29
100761 For a longitudinal travel speed of the system ranging from 70 km/h to
about 110
km/h, longitudinal resolutions can range from about 2 mm per profile (between
samples)
to about 3 mm per profile (between samples) with two sensors. The resolution
increases
while using three or more sensors. For example, using three synchronized
sensors, the
5 .. longitudinal resolution at a system speed of 100 km/h can reach
approximately 1.9 mm
between samples or closer to 1 mm between samples at slower speeds. The use of
this
synchronized and multiplexed sensor methodology allows a track measurement and
assessment system to operate faster than competitive systems that employ a
single sensor
for the same longitudinal sampling resolution.
10 100771 The foregoing description of preferred embodiments of the present
disclosure has
been presented for purposes of illustration and description. The described
preferred
embodiments are not intended to be exhaustive or to limit the scope of the
disclosure to
the precise form(s) disclosed. Obvious modifications or variations are
possible in light of
the above teachings. The embodiments are chosen and described in an effort to
provide
15 .. the best illustrations of the principles of the disclosure and its
practical application, and to
thereby enable one of ordinary skill in the art to utilize the concepts
revealed in the
disclosure in various embodiments and with various modifications as are suited
to the
particular use contemplated.
Robic Docket No. 17271-0002