Note: Descriptions are shown in the official language in which they were submitted.
CA 02895389 2015-06-16
WO 2014/105940 PCT/US2013/077783
TECHNIQUES FOR MEASURING VIDEO PROFIT
[0001] This application claims the benefit of the filing date of U.S.
Provisional Patent Application
Serial No. 61/746,092, filed December 26, 2012, the disclosure of which is
hereby incorporated
herein by reference in its entirety for all purposes.
BACKGROUND
Field
[0002] This disclosure relates generally to electronic commerce and, more
specifically, to
techniques for optimizing the impact of video content on electronic commerce
sales.
Related Art
[0003] The term electronic commerce (e-commerce) is used to refer to an
industry where the
buying and selling of products or services is conducted over electronic
systems, such as the Internet
and other computer networks. E-commerce may employ various technologies, e.g.,
mobile
commerce, electronic funds transfer, supply chain management, Internet
marketing, online
transaction processing, electronic data interchange, inventory management
systems, and automated
data collection systems. Today, e-commerce typically employs the World Wide
Web at least at one
point in a transaction lifecycle, although e-commerce may encompass a wider
range of
technologies, e.g., electronic mail (email), mobile devices, social media, and
telephones. E-
commerce is generally thought to include the sales aspect of e-business and
normally includes the
exchange of data to facilitate the financing and payment aspects of business
transactions.
1
CA 02895389 2015-06-16
WO 2014/105940 PCT/US2013/077783
SUMMARY
[0004] A technique for measuring a video profit for a product includes
performing an A/B test for a
product while monitoring for customer conversion. In this case, at least one
of 'A' and 13'
correspond to video. A unique number of visitors to a product webpage that
viewed a call-to-action
for a video of the product is determined based on the test. A gain that
accounts for customer bias is
determined based on the test. A non-viewer conversion rate is determined based
on the test. A
video view rate is determined based on the test. A video conversion lift is
determined based on the
test. An abandonment factor is determined based on the test. Finally, an
incremental video profit
for the product is determined based on the unique number of visitors, the
gain, the non-viewer
conversion rate, the video view rate, the video conversion lift, and the
abandonment factor.
2
CA 02895389 2015-06-16
WO 2014/105940 PCT/US2013/077783
BRIEF DESCRIPTION OF THE DRAWINGS
[0005] Embodiments of the present invention are illustrated by way of example
and are not limited
by the accompanying figures, in which like references indicate similar
elements. Elements in the
figures are illustrated for simplicity and clarity and have not necessarily
been drawn to scale.
[0006] FIG. 1 is a graph depicting viewing and purchasing behavior of video
viewers.
[0007] FIG. 2 is a view of an exemplary video player.
[0008] FIG. 3 is a view of an exemplary A/B test using a video presenter (A)
and video voiceover
(B).
[0009] FIG. 4 is a diagram of an exemplary data processing system that is
configured to evaluate
videos according to the present disclosure.
[0010] FIGS. 5-13 depict a process for transforming a data structure
represented as a decision tree
of arbitrary complexity into reduced complexity decision trees.
[0011] FIG. 14 includes Table 3, which provides a comparison of parameters for
various categories
of retail products and shows the results of these parameters being used to
populate a database for
different product categories to determine statistical results for each
category.
[0012] FIG. 15 is a flowchart of a process for measuring video profit
according to an embodiment
of the present invention.
[0013] FIG. 16 is a flowchart of a process for estimating video profit via a
database of statistical
values for each category of profit without requiring an A/B test, according to
an embodiment of the
present invention.
[0014] FIG. 17 is a view of an exemplary video player that is configured to
include links to offer
different products that are determined by a recommendation/optimization engine
that accesses a
database product category information and/or personalized information,
according to an
embodiment of the present invention.
3
CA 02895389 2015-06-16
WO 2014/105940 PCT/US2013/077783
DETAILED DESCRIPTION
[0015] In the following detailed description of exemplary embodiments of the
invention, specific
exemplary embodiments in which the invention may be practiced are described in
sufficient detail
to enable those skilled in the art to practice the invention, and it is to be
understood that other
embodiments may be utilized and that logical, architectural, programmatic,
mechanical, electrical
and other changes may be made without departing from the spirit or scope of
the present invention.
The following detailed description is, therefore, not to be taken in a
limiting sense, and the scope of
the present invention is defined only by the appended claims and their
equivalents. As may be used
herein, the term 'coupled' encompasses a direct electrical connection between
elements or
components and an indirect electrical connection between elements or
components achieved using
one or more intervening elements or components.
[0016] Embodiments of the present disclosure are generally directed to the
field of Internet
electronic-commerce (e-commerce) and business services where video or other
dynamic media is
presented to a user based on optimized predictions of behavior in view of
estimates of customer
purchase behavior. E-commerce has evolved from presenting static images and
text to potential
customers to presenting videos to potential customers. While e-commerce
websites have presented
potential customers with videos related to products and/or services, little
has been done to
determine the best types of videos for converting customer behavior into
desired actions (e.g.,
purchases). Aspects of the present disclosure are directed to techniques for
measuring customer
behavior, building a predictive behavioral model, and then using the predicted
behavioral model to
enhance video performance based on measured parameters.
[0017] A number of articles have reported that video has a positive impact on
sales in e-commerce.
Typical reported results for the impact of video in increasing sales range
from 3 to 30 percent. In
this case, assuming sales of $1,000,000 per year without video, one would
expect to increase sales
between $30,000 to $300,000 per year with video. Increased sales results due
to video have usually
been reported based on single case studies. Moreover, a single comprehensive
report on video
impact on sales in e-commerce that aggregates a wide variety of customers in
detail has not
traditionally been available. As disclosed herein, a single report is
generated that provides data on
over thirty different customers with detailed studies and performance ranges.
The standard method
of video/no-video testing has traditionally only provided an overall
performance measurement and
has not provided insight on how to improve video performance. As is disclosed
herein, different
elements of video performance are dissected into a video profit equation (VPE)
that accounts for
certain elements that impact video yield so that the impact of video on sales
may be better
4
CA 02895389 2015-06-16
WO 2014/105940 PCT/US2013/077783
understood. The different elements of video performance may then be examined
and optimized to
improve video performance.
[0018] Video in e-commerce is growing rapidly. For example, only a few years
ago it was rare to
see video on e-commerce websites. Today, however, most e-commerce websites
employ video. In
general, the number of videos on retailer websites has grown. In fact, it is
not unreasonable to
assume that just about every picture and text description of a product will be
augmented or replaced
with a video on most e-commerce retail websites in the near future. One of the
reasons for the
increase in the popularity of videos in e-commerce is that videos increase
conversion. For example,
a study reported in comScore Video Metrix 2.0 in June of 2010 reported that
retail website visitors
who also view video are sixty-four percent more likely to purchase. The study
also indicates that
retail site visitors that view video also spend two minutes longer on a
website per visit.
[0019] From the study, one may assume that the reason for the explosive growth
in video in e-
commerce is that videos work to improve sales. Typically, a video return-on-
investment (ROI) may
be measured in months. For example, an investment of $50,000 in video may
increase sales by
more than $500,000 within a year. While quality videos generally provide
positive results, money
can be wasted on bad videos that yield poor results. Based on the above trends
and projections,
millions of videos will be created for e-commerce over the coming years. In
this case, video will
represent a relatively large investment of time and money for retailers. To
make sound business
decisions, it is important for retailers to understand the tradeoff of the
price of production of the
video versus the added revenue yield as a result of the video. In general,
retailers should avoid
investing in bad videos and only invest in good videos, i.e., videos that
produce high yields.
[0020] Depending on the total annual sales of a product, it may make sense to
spend more or less
money on a video for the product. For example, if the annual sales are
$1,000,000/year, it may
make sense to spend up to, for example, $10,000 on a video (if a conversion
lift warrants the
expenditure). On the other hand, if the annual sales of a product are only
$10,000, it clearly would
not make sense to spend $10,000 for a video (unless somehow the video could
more than double
total sales of the product). However, it might be reasonable to spend around
$100 for a video on a
product with $10,000 in sales. In order to make sound business decisions on
expenditures related to
video, it is desirable to be able to accurately measure the impact of video on
product sales.
[0021] The present disclosure provides techniques for measuring the impact of
video on product
sales, in terms of video conversion lift (VCL), and provides approaches for
separating out customer
5
CA 02895389 2015-06-16
WO 2014/105940 PCT/US2013/077783
bias (i.e., customers that would have bought with or without video, but
happened to watch the
video). According to aspects of the present disclosure, measurements and
calculations are used to
demonstrate how much impact, and thus, how much profit can be expected from a
given video. The
determined impact can then serve as a foundation for sound business decisions
on investing in
video. According to one or more embodiments of the present disclosure, a video
profit equation for
calculating the expected profit from videos is derived.
[0022] In a typical e-commerce webpage with video, the number of people that
view a video and
convert versus the number of people that do not watch the video and convert
can be tracked. For
example, conversion may correspond to taking a step in a buying funnel (e.g.,
add-to-cart (ATC),
checkout (buy), or signing up for a trial or other product-related
interaction). To simplify the math,
conversion may be based on ATC (which is the most common first step after
watching a video). A
standard method of measuring yield increase is to perform a video/no-video
test (i.e., an A/B test)
where a no-video control group is not provided the option of viewing a video
(e.g., typically by
removing a video call-to-action (CTA) from the website for, say, fifty percent
of website visitors).
In one or more embodiments, for the video/no-video test the total ATC events
and purchase (buy)
events are measured for the customers on each branch of the test. The
conversion rates for the
video/no-video tests are then compared to calculate the impact of videos.
[0023] Conversion rate may then be found by counting how many people converted
(added-to-cart
or buy conversions) divided by the total number of unique people that had the
opportunity to
convert. To calculate conversion, all of the unique customers that visit a
webpage may be divided
into two groups, i.e., a video branch and a non-video branch. The video branch
customers are given
the opportunity to watch the video by having the video CTA displayed. The non-
video branch
customers do not have a video CTA displayed on the page. The conversion rate
may be defined as:
conversion rate = (# of people in the group that converted)/(# of people in
the group). The ATC
conversion rate on the video branch CvB may be given by:
CvB ¨ AVB/IVB
where AvB is the total number of visitors on the video branch that converted
(e.g., added-to-cart)
and IvB is the number of page impressions of (unique) website visitors on the
video branch.
[0024] Similarly, for the non-video branch, the ATC conversion rate for the
non-video branch CNB
may be given by:
CNB ¨ ANB/INB
6
CA 02895389 2015-06-16
WO 2014/105940 PCT/US2013/077783
where ANB is the total number of visitors on the no-video branch that
converted (e.g., added-to-cart)
and 'NB is the number of webpage impressions of (unique) website visitors on
the no-video branch.
It should be appreciated that the conversion rates do not depend on the split
ratio of the two
branches. For example, a split of visitors to each branch could be 50/50 or
the split of visitors to
each branch could be 75/25 (or some other ratio), but the conversion rates
should be the same
(within statistical fluctuations based on sample size).
[0025] To compare the two conversion rates, a video branch conversion
improvement 4B may be
calculated. The video branch conversion improvement (video branch lift (VBL))
4B is given by
Equation 1:
Equation 1: 2wu ¨ (Cvu - CNB)/ CNB
In general, Equation 1 provides a fair unbiased measure of how much better
videos perform, as
contrasted with no videos, in a controlled manner. For example, if the
conversion rates are equal on
both branches, then 4B = 0 (meaning that videos have no impact). As another
example, for 4B =
0.1, videos result in ten percent more conversions. It should be appreciated
that the ATC
conversion rate for the video branch and the ATC conversion rate for the non-
video branch should
be determined at the same time in order to avoid impact of seasonal
fluctuations (i.e., seasonal
fluctuations in buying patterns are reflected equally in both groups).
Moreover, the approach
eliminates any bias that customers may have on each branch (i.e., if customers
that watched a video
would have bought anyway, the measurement approach eliminates the customer
bias).
[0026] Results of a number of video/no-video experiments are set forth in
Table 1.
Video branch Non-video branch Video branch
lift
Client Category Buy rate C_VB Buy rate C_NB (C_VB-
C_NB)/C_NB
Retailer 8 Specialty 1.48% 1.46% 1.43%
Retailer 13 Shoes 1.51% 1.47% 2.72%
Retailer 20 Apparel 3.20% 3.06% 4.58%
Retailer 28 Apparel 0.29% 0.26% 11.79%
Retailer 30 Electronics 0.20% 0.19% 9.34%
Retailer 32 Sports 1.71% 1.26% 35.56%
Aggregate Average 2.72% 1.28% 10.90%
TABLE 1
In Table 1, the video branch conversion improvement (or video branch lift) 4B
ranges from about
7
CA 02895389 2015-06-16
WO 2014/105940 PCT/US2013/077783
1.4 to about 35.6 percent, with an average of about 10.9 percent. On average,
for the sample set of
Table 1 there is about 11 percent more product sold with video than without
video. While the
results in Table 1 are only for a half-dozen customers, which is not a large
sample set, the sample
set is large enough to provide some feel for a few items of note. The sample
set shows that the
overall average video branch conversion improvement is about 11 percent. An 11
percent overall
average video branch conversion improvement for a retailer with an average
revenue of
$1,000,000/year will add on average $110,000/year.
[0027] Table 1 shows a wide variance between the lowest lift of 1.4 percent
and the highest lift of
35.6 percent. Variance in the apparel category indicates about a 7.2 percent
variance between
lowest and highest lifts. The variance may be, for example, attributable to
customers watching
videos at different rates on the different retailer websites, more customer
bias for certain categories,
or that videos are just not very good on some retailer websites. Typical state-
of-the-art testing
provides a gross level of information, but no way of drilling down into
details to understand the
factors involved. In fact, there is no indication in the above numbers that
any customer even
watched a video. That is, there is no proof of causality of the impact of
video at all, as customers
were on one branch or the other branch and the results were compared.
Conventional approaches
provide no process for understanding the factors that affect lift and, thus,
provide no information
that can be used to improve and optimize video performance with respect to
increased sales.
[0028] According to one or more embodiments, a mathematical framework (i.e., a
video profit
equation (VPE)) is disclosed that facilitates a better understanding of
performance components and
their impact on video profit. To get at the causal components of video,
customers may be grouped
into different categories based on their observed behavior. For customers that
had the opportunity
to watch a video (e.g., on a video branch of an experiment or on a website
where there is video but
no experiment present), behavior of the people that watched the video
(viewers) can be tracked and
compared to people that had the opportunity to watch the video but did not
view the video (non-
viewers). To measure the difference in behavior between viewers and non-
viewers, the total
number of unique visitors that visited a page with a video CTA can be counted
as impressions 'I'
and divided into a viewer group and a non-viewer group, designating each by a
subscript of 'V' and
'N', respectively. According to one embodiment of the present disclosure, the
ATC conversion rate
for people that viewed the video (viewers) Cv is given by:
Cv = Av/V
where 'Ay' is the number of viewers that converted (e.g., added-to-cart), 'V'
is the number of
8
CA 02895389 2015-06-16
WO 2014/105940 PCT/US2013/077783
(unique) customers that viewed the video, V = rI, and 'r' is the view rate of
the video. Similarly,
the ATC rate of non-viewers CN is given by:
CN ¨ AN/ IN
where 'AN' is number of non-viewers that converted, 'IN` is the number of
(unique) customers that
received impressions of the webpage that contained the video CTA but did not
view the video, and
IN V = I or IN = (1-r)I. The total add-to-cart AT may be written as:
AT = ICT = INCN VC v = I(1 - r)CN + IrCv
[0029] Based on the conversion rates for the two groups of visitors, a
determination of how well
videos are working to increase sales may be undertaken. A determination of how
well videos are
working to increase sales may be made under the assumption that there is no
bias in the groups of
visitors. For example, one can first look at the case where customers that are
inclined to add-to-cart
are equally likely to watch the video versus those that are not. Bias can be
measured via a fair
video/no-video test (e.g., an A/B test) as illustrated in Table 1. Ignoring
customer bias is
tantamount to stating that if the video was not present, the customers that
watched the video would
have added to cart at the same rate as the customers that did not watch the
video. Thus, for the
number of viewers 'Tr' that added to cart at the rate Cv one would expect the
number of cart adds to
be equal to IrCN if there was no video available for the customers to watch.
According to an
embodiment of the present disclosure, the expected total add-to-cart with no
video present AE is
given by:
AE = I(1- r)CN + IrCN = ICN
[0030] In other words, if there were no videos present (and no bias factored
in), the expectation is
that customers would add-to-cart at the rate of non-viewers (from the
definitions). A forecasted
incremental ATC AF may be determined from the difference between the expected
ATC AE without
video and the actual value with video. According to at least one embodiment,
the forecasted
incremental ATC AF is given by:
AF ¨ AT -AE
AF = I(1 - r)CN + IrCv¨ [I(1- r)CN + IrCN]
AF = IrCv - IrCN
(Equation 2) AF = IrCNL
where '1_,' is the video conversion lift (VCL) which is given by:
(Equation 3) L = (Cv-CN)/CN
[0031] As used herein, video conversion lift may be referred to herein as
simply 'lift' for brevity,
9
CA 02895389 2015-06-16
WO 2014/105940 PCT/US2013/077783
where the context is clear. VCL should not be confused with the lift
calculation associated with the
video branch conversion improvement or VBL defined above, as the two lifts are
different by
definition and are also different in magnitude (e.g., often by a factor of 10
or more). VCL is used to
directly measure how well a video is working and is defined as the increased
probability that
someone who watches a video will convert. That is, VCL indicates the increased
likelihood that a
customer that watched a video will convert versus someone that did not watch
the video. Thus, if
the VCL is 100 percent, then a person that watched the video is twice as
likely to convert than a
person that did not watch the video. Similarly, a VCL of 200 percent indicates
that the person is
three times more likely to convert. If the rate of conversion of viewers is
the same as non-viewers,
VCL is zero and the videos are not contributing to increased conversion.
[0032] While VCL is an important indicator in how well a video is performing,
the total impact of
video on conversion is also determined by how many people watch the video. For
example, the
VCL for a video might be very high, but if very few people watch the video the
overall sales impact
or yield may be small. To find the overall sales impact, one should take into
account the view rate
as well. The forecasted number of people that add-to-cart due to watching a
video, or forecasted
yield YF may be derived from:
AF = ICNYF
where YF = rL. Given that 'I' and CN are values independent of the video, the
yield is a direct
measure of the forecasted impact of video. A forecasted video profit PF may be
derived from:
PF = MICNYFa; or
(Equation 4) PF = MICNrLa
where `M' is the profit margin of the product, a=(1-a), and 'a' is the cart
abandonment rate.
Equation 4 provides the non-bias adjusted forecasted video profit. Equation 4
may be used to
calculate the expected profit (ignoring bias) of a product given the measured
values of view rate,
non-viewer conversion rate, and VCL.
[0033] With respect to the margin `M' of a product, there is nothing that a
video does that can
influence the margin `M', but clearly it is easier to make more profit off of
higher margin products.
Impressions 'I' corresponds to the unique number of visitors that see the call-
to-action (CTA) of the
video. Normally, one would assume that 'I' is just the number of people that
come to the product
page and are not influenced by video, but this ignores the impact that the
video can have on search
engine optimization (SEO). Having a video on a page and getting the page
indexed can increase the
CA 02895389 2015-06-16
WO 2014/105940 PCT/US2013/077783
number of visitors significantly. Indexing with video often results in first
page search engine results
page (SERP) results which can lead to a significant increase in the traffic to
a product webpage and
increase 'I' by perhaps as much as a few percentage points. Since this is top-
of-funnel, this
translates directly to increased sales by the same fraction. In general,
videos dramatically increase
first page SERP results. It has been reported that having video on a webpage
increases the
probability of first page SERP results by fifty-three times.
[0034] Ignoring bias, the non-viewer add-to-cart rate CN is the baseline rate
of conversion to cart
adds for customers that do not watch video (bias changes the baseline and is
addressed below).
Typical baseline ATC rates range from 10 percent to 30 percent. The video view
rate 'r' is a factor
of the placement of the CTA on the webpage. If the CTA is below the fold,
small or otherwise
difficult to locate, the view rate 'r' is correspondingly low. View rate can
be increased by smart
merchandising, e.g., moving the CTA to a more prominent location on the page,
and can range from
as little as one percent for a poorly designed CTA to as high as thirty
percent or higher for a very
prominent CTA. The VCL 'I,' is the one and only factor in Equation 4 that
directly measures how
effective video content is at influencing purchase behavior. VCL measures the
increased
probability of a customer that watches a video will add-to-cart. Typical
values for VCL range from
sixty percent or so on the low end to as high as five-hundred percent, meaning
that customers are
six times more likely to convert if they watch the video (e.g., for an
InvodoTM produced video). The
abandonment factor a is equal a = (1-a), where 'a' is the cart abandonment
rate which is normally
about the same for people that watch the video versus people that do not watch
the video, but there
is often a slightly lower abandonment rate (about 5 percent) bonus for people
that watch the video.
[0035] The yield is a measure of overall impact and is the product of the VCL
and the view rate. A
forecasted yield of three percent means that the forecasted impact on sales is
three percent. A yield
of thirty percent provides a thirty percent impact on sales. From all of the
above factors, the most
important to impact yield are VCL and view rate. One can have an exceptional
video in terms of
VCL, but if only one percent of customers watch the video the yield is not
nearly what it could be if
the view rate is in the ten to twenty percent range. For example, if the VCL
is three-hundred
percent but the view rate is only one percent, the yield is only three
percent. The same video with a
view rate of ten percent provides a thirty percent impact on sales. It should
be appreciated that VCL
and view rate need to be high to maximize profit. In general, VCL is the only
direct measure of the
efficacy of video content. Good video content has very high VCL, whereas bad
video content can
have poor (even negative) VCL. It should be appreciated that A/B testing of
different types of
video can help determine which videos produce the best VCL. For example, the
impact of having a
11
CA 02895389 2015-06-16
WO 2014/105940 PCT/US2013/077783
human presenter in the video versus no presenter may in the video can have a
relatively large
impact on VCL. While the cost of a presenter is generally greater, most often
the added cost is
justified with higher VCL. Other factors that influence VCL include the length
of the video and the
order of presentation of features. It should be appreciated that video
evaluation art is rich and deep
knowledge of what works for a particular type of product is what
differentiates good video
performance from bad video performance.
[0036] One drawback of Equation 4 is that it does not account for bias. It is
expected that some
customers that would have purchased anyway are more likely to watch the video
than customers not
inclined to buy. To measure bias, the results with video from the baseline may
be compared with
the control case of no video using a video/no-video test. The profit that is
generated from a website
without video may be used as a baseline. If the number of impressions (unique
visitors) to the
product webpage per month is 'I' and CB denotes the average add-to-cart rate
of (baseline)
customers, then baseline profit for the non-view branch PNB may be given by:
PNB ¨ MCNBIaNB
where 'NC denotes the profit margin for the product, CNB is the baseline
conversion rate for the non-
viewer branch, and aNB is the abandonment factor for the non-viewer branch.
[0037] For example, if 1,000 visitors come to the product page in one month,
10 percent add-to-
cart, and 70 percent abandon the cart, then the total number of units sold of
that product is 30. If the
profit margin is $100/product, then the baseline profit for that product is
PNB = $3,000/month. To
find the impact of video, we measure the performance against the baseline in a
randomized
video/no-video test over the same time interval. Let AvB denote the number of
units added-to-cart
on the test video branch and ANB denote the total ATC rate of customers on the
baseline no-video
branch. The incremental number of units added to cart on the video test branch
AI is given by:
AI = AvB ¨ ANB ¨ I(CVB ¨ CNB)
The incremental profit PI is the actual yield of incremental sales due to
video multiplied by the
margin of each product sold influenced by the video may be given by:
(Equation 5) Pi = MICNBYANB
where Ya is the actual rate of incremental sales due to the video and is given
by:
Ya ¨ (CvB/CNB) -1 ¨ (CvB ¨ CNB)/CNB ¨ X,VB
12
CA 02895389 2015-06-16
WO 2014/105940 PCT/US2013/077783
[0038] Equation 5 can be used to measure video profit. However, it should be
pointed out that
Equation 5 does not capture everything. For example, Equation 5 does not
capture the impact that
videos can have on reducing returned items. Nor does Equation 5 capture the
overall impact that
videos may have on a brand or adequately capture the impact of video on SEO.
Moreover, in a
"click-and-mortar" business, Equation 5 does not capture the true impact video
has on buyers that
do research online then purchase in the store. Nevertheless, Equation 5 is a
good fair test of the
impact of video on online sales.
[0039] To derive actual yield Ya, values should be measured in a fair test
over a same time period.
It would not be fair, for example, to test the amount purchased during the
holiday season with the
amount purchased prior to the holiday season. Rather, a fair video/no-video
test with, e.g., a 50/50
split, should be performed over the same time interval. Given that performing
a test can decrease
sales, customers may opt to not perform tests (and many companies balk at
testing during peak sales
seasons) and select a less intrusive approach to estimating incremental profit
due to video. For
example, incremental profit due to video may be estimated by calculating VCL
of a video and a
gain factor that accounts for customer bias. In this case, an incremental
video profit equation can be
written as:
(Equation 6) PI = MICNBYaaNB = MKNYFaVB
where YF is the forecasted yield and 7 is the gain (i.e., an adjustment that
accounts for customer
bias). The gain 7 can be written as:
(Equation 7) 7 = MI7CNYFaNB/MICNBYaavB
The incremental video profit equation can then be written as:
(Equation 8) Pi = MKNrLavB
[0040] Examining the terms of Equation 8 (i.e., the video profit equation) it
should be apparent that
Equation 8 only differs from Equation 4 (i.e., the forecasted video profit
equation) by the gain y.
Thus, gain y accounts for bias and adjusts the forecasted profit to match the
measured profit.
Equation 8 is particularly useful as the equation decomposes the profit into
individual terms that can
be independently measured. Moreover, Equation 8 provides focus on how to
improve overall
performance. As previously stated, video conversion lift
is the only term that is a direct
measure of the efficacy of a video. Equation 8 is particularly useful in that
it can be used to perform
different A/B tests with different videos to optimize performance (i.e.,
increase profit). Testing one
13
CA 02895389 2015-06-16
WO 2014/105940 PCT/US2013/077783
video versus another video, all else being equal, the only item in Equation 8
that will change is the
video conversion lift 'L'. The gain y, by definition, does not change as gain
measures the bias of
people that would have bought anyway and that population is invariant based on
the video used.
[0041] Performing a video/no-video test (i.e., an A/B test) is expensive in
that because videos
increase profit every time you perform one of the experiments profit is
reduced. By employing
Equation 8 to measure profit, once a statistically significant measure of gain
y is established, no
further video/no-video experiments are required and focus can be shifted to
other parameters to
achieve better videos performance.
[0042] Referring back to Table 1, there are many factors that can impact
overall video performance.
One of the more important factors is the view rate 'r'. The view rate is not a
function of the video,
but a function of the placement of the CTA on the page. If the CTA is "below
the fold", or
otherwise not prominent, then the view rate can be very small. Rather than
focusing on better
videos, a retailer may be encouraged to use "smart merchandising" to increase
the view rate.
[0043] According to various aspects of the present disclosure, the performance
of video may be
optimized by: picking a category (or several categories) of products to
produce videos for a retail
site; performing a video/no-video (A/B) experiment to obtain a gain factor for
each category;
examining the results and comparing the results to average results (presented
below); using "smart
merchandising" to increase the view rate; and using A/B tests on other videos
within a category to
increase VCL. In general, qualitative and quantitative information can be used
in the process to
produce more effective videos. Examples of suggested A/B testing with
different videos include:
voiceover versus presenter, wherein a live presenter is used rather than just
video of the product;
documentary versus conversational style (style and tone of presenter); short
versus long videos; pets
or no pets; children or no children; feature order in the video; on-site video
versus in-studio video;
white-screen versus set video; including motion graphics in the video versus
no motion graphics in
the video; and including in-video shopping or calls-to-action within the video
versus no calls-to-
action. The above tests, as well as other A/B tests, can be performed and
using Equation 8 only the
VCL of each video needs to be compared to determine which video has better
performance. In
addition, behavior of the customers that are watching the video may be
examined to gain further
insights into viewing and purchase behavior, an example of which is shown in
Figure 1.
[0044] With reference to Figure 1, an example graph 30 of a watch metrics
report for a video is
illustrated. The report shows the number of unique viewers line 32 that viewed
a video to a certain
14
CA 02895389 2015-06-16
WO 2014/105940 PCT/US2013/077783
time in the video (x-axis), and the number of frames viewed line 34. As such,
if some viewers
viewed more than once, the viewers in the line 34. The cart add events are
shown in line 36 and
purchases in line 38. The watch metrics report includes a wealth of
information regarding customer
viewing and buying patterns. The information, along with the analytic
information from the profit
equation combined with ratings and comments (qualitative information), can be
used to optimize
the performance of a video. For example, the drop-off in view rate at the end
of the video comes
from "boilerplate" company information that has little to do with the product.
An A/B test can be
performed in this example with a shorter video.
[0045] To understand how different retailers perform in different categories,
results of over thirty
companies were measured with different categories of products. The results are
presented below in
Table 2. The results are useful in understanding performance by comparing
measured results of a
new customer to industry averages. The results are compiled from different
studies and
experiments over varying timeframes from 2011 to 2012. Typically, each of the
data sets in the
study included over 90 days of data for the video/no-video results and 30-60
days of data for the
A/B test results.
CA 02895389 2015-06-16
WO 2014/105940 PCT/US2013/077783
Avg. Conf
Interval
Parameter Avg. STDEV (95%)
Cart Add Lift 209% 175% 65.2%
View rate 9.0% 8.6% 3.2%
Forecasted Yield: Non bias
adjusted incremental ATC
via video (ATC Yield) 19.2% 30% 11.0%
Non-viewer ATC rate CN 11.9% 20% 7.3%
Viewer ATC rate CV 32.1% 49% 18.1%
Total (viewer/
nonviewer ATC rate) CVB 14.4% 22% 8.2%
Non-viewer exp.
Branch ATC rate CNB* 7.7% 7.0% 5.8%
Measured ATC delta
(CVB-CNB)/CNB 7.18% 11% 8.8%
ATC Gamma 72% 18% 16.9%
Purchase Lift 289% 236% 95.2%
Non-bias adjusted incremental
Buys via video (Forecasted Yield) 26.1% 15% 6.1%
Non-viewer Buy Rate BN 2.49% 5.7% 2.3%
Viewer Buy Rate BV 6.39% 14% 5.7%
Total buy rate BVB 2.72% 6.0% 2.4%
Non-viewer abandon rate 79.45% 16% 6.5%
viewer abandon rate 75.15% 19% 7.7%
Total Abandon Rate 78.80% 16% 6.4%
Video branch abandon rate
Non-video branch buy rate * 1.28% 1% 1.1%
Measured ATC delta
(BVB-CNB)/CNB 10.90% 13% 13.3%
Buy Gamma 71.79% 16% 16.5%
TABLE 2
[0046] With respect to Table 2, tabulated parameter averages for 32 retailer
datasets are illustrated.
The average values can be used in the profit equation to help predict
performance and compare
against industry averages. The standard deviation (SDEV) of the dataset is
provided as well as the
95 percent confidence interval for the average calculation. Averages for these
values were
calculated only for video/no-video experiments (7 for ATC and 6 for purchase).
From Table 2 a
number conclusion can be reached. For example, people that watch video are 209
percent more
likely on average to add to cart than people that do not watch video (ignoring
bias).
16
CA 02895389 2015-06-16
WO 2014/105940 PCT/US2013/077783
[0047] From Table 2, the average view rate of videos is 9 percent and the
average increase in ATC
due to videos is 19 percent (video ATC yield, ignoring bias). As illustrated
by Table 2, average
gamma (gain factor) is 71 percent, meaning that, on average, the actual
measured yield will be
seventy-two percent of the forecasted yield. In other words, bias decreases
the forecasted yield by
about 28 percent. From Table 2, people that watch the video are on average 289
percent more
likely to purchase (ignoring bias) and the purchase gamma is also around 72
percent. People that
watch the video are on average about 5 percent less likely to abandon their
cart (5 percent more
likely to complete a purchase). The average purchase increase due to videos is
26 percent (video
buy yield, ignoring bias). Taking bias into account, the expected ATC and buy
yield are calculated
as 13.7 percent and 18.7 percent, respectively (72 percent times the yields),
to get a bias-adjusted
result. In general, one would expect the measured results to be close to this
on average. These
results are averages over a relatively large population, but it is worthwhile
to note that there is
significant variance in the yield. Much of the variance in yield comes from
the wide range of view
rates. Additionally, there is variance among the categories of retail
products.
[0048] With reference to Figure 14, Table 3, which includes values for a
number of different
categories, is illustrated. Table 3 provides comparison of parameters for the
various categories of
retail products. In Table 3, blank cells indicate no data available and `*'
indicates that the A/B test
was only performed over a subset of data available. By examining Table 3,
reasons for why there is
a large variance in the measured video/no-video yield improvement for the
retailers may be
determined. In the Table 3, `Furniture/Toys' has a VCL comparable to 'Shoes',
but the view rate of
'Shoes' is less than one-fourth the view rate of `Furniture/Toys'.
Correspondingly, the forecasted
ATC yield impact is about one-fourth. Even if everything else is equal, one
would expect a much
lower yield impact from a test. This is an excellent example of where a
recommendation to the
'Shoe' retailers would be to increase the views of video on the pages by
making the CTA more
prominent, as the videos seem to be fine.
[0049] Actual yield ranges from about 1 percent on the low end to as high as
35 percent. A one
percent yield may not seem like a lot, but if you have a large number of
customers coming to your
website the impact on sales can be appreciable. In one customer case, a one
percent yield translated
to over $250,000 in annual sales due to the large number of customers coming
to the website. Thus,
a small yield times a large volume translates to an excellent profit increase.
Similarly a large yield
with a smaller volume on a high-margin product can translate into a high
profit. As shown in Table
3, the low-end results are usually due to low view rates. For customers with
reasonable CTAs, the
low-end yield value is three percent. To calculate the expected monthly profit
for adding video to
17
CA 02895389 2015-06-16
WO 2014/105940 PCT/US2013/077783
your product pages, the ranges will be in the low/high range of 3 percent to
30 percent times the
margin times the visitors/month.
[0050] With reference to Table 4, examples of expected monthly profit for low
and high estimates
of yield and varying visitors to the product page/month are illustrated.
ig:MOMAIRMIng 1111.190forsaiWO.Ageaim
iieININIMMOMMINMEMMINIMENIMMMIVittifittOnGMEMtaveragt.)MEMiiiiiiivrofitinwainNa
i:i:i:
...............................................................................
..................... ..............................................
..............
........................................................................
state
$1,000 10,000 $300,000 $1,800,000 $3,000,000
$100 10,000 $30,000 $180,000 $300,000
$100 1,000 $3,000 $18,000 $30,000
$10 100,000 $30,000 $180,000 $300,000
$10 1,000 $300 $1,800 $3,000
In Table 4, profit range is relatively large and the actual yield varies
significantly based on a
number of important factors discussed above. Nevertheless, Table 4 provides
guidance on what can
be expected from a profit standpoint. Expected profit can help focus in on
which products to
choose for video campaigns. In general, video campaigns should have a
relatively high ROI and
pay for themselves in a few months. Typically, focusing on the top 20 percent
of margin
contribution of products on a website is a good rule-of-thumb. It should be
pointed out that some
videos may even have a negative impact, and the impact may be different on
different segments of
the population, as detailed here: http://searchengineland.comithe-ecommerce-
product-video-tbat-
increases-revenue22pr-visit-133565. The link points out the importance of good
video content. In
general, not all content works the same and different types of videos can
provide very different
results. According to the present disclosure, the Video profit equation is
employed to dissect the
impact of the videos on profit and take measurements of what converts to the
best profit. The
derived information is then fed back into the content production process to
make the content even
more effective.
[0051] In general, to calculate the actual yield one must perform a fair
video/no-video test.
Performing video/no-video tests are straightforward with the appropriate
testing software. However,
once the gain is well established for a product category, video/no-video tests
are often not needed
all the time (although periodic checks are recommended to track gain drift).
No tracking gain frees
up a testing engine to concentrate on other factors that improve the
performance without
significantly decreasing the value of video on a website. It should be noted
that every time a 50/50
split video/no-video test is performed, the available profit increase from
video is being decreased by
18
CA 02895389 2015-06-16
WO 2014/105940 PCT/US2013/077783
50 percent.
[0052] One of the other important factors in the video profit equation
(Equation 8) is the
impressions 'I', which is the total number of unique visitors to a product
page. Videos have an
excellent impact on the impressions if the videos result in indexing of videos
on the product pages.
According to an aspect of the present disclosure, dynamic tags may be inject
into product pages via
an InPlayer. In general, injecting dynamic tags in product pages in
conjunction with video site map
submission has shown excellent results for product page indexing with high-
ranking SERP results.
As noted above, a report indicated a 53 times higher likelihood of first page
search results with
video than without. A more reasonable and realistic impact on top-of-funnel is
probably in the 1
percent to 10 percent range which would likely translate into a similar
increase in sales. However,
this factor is not measured in a video/no-video A/B test, as if a page is
indexed with a video on the
page there is no way to factor that out in a standard video/no-video test. In
this case, the impact of
video with SE0 and search engine indexing will usually be greater than what is
measured in a
standard video/no-video test.
[0053] Aspects of the present disclosure have provided a detailed mathematical
formalism on how
to measure the impact of videos on e-commerce sales. The disclosed techniques
go beyond the
standard video/no-video testing to break down the components that impact
profit so as to
understand and optimize the performance of video. According to the disclosure,
the factors of lift,
view rate, and bias have been demonstrated as being relatively important in
increasing profit. In
general, the overall ROI shows that videos work extremely well and will become
an increasingly
important part of e-commerce. In fact, videos typically provide an ROI in only
a few months.
There are very few investments in e-commerce that can return $500,000 for a
$50,000 investment,
but that is commonplace with videos. As the ROI of videos becomes more widely
accepted, the next
major problem in the e-commerce industry will be how to produce a large number
of effective
videos for large retail sites. Effectiveness of the videos may be measured in
terms of the video
conversion lift, and as more A/B tests are performed it is anticipated that
the disclosed video profit
equation will provide an invaluable tool in developing and optimizing video
strategy.
[0054] To optimize the performance of video, a video lift calculation may be
performed for each
video, with the lift for each video compared to determine which video is more
effective. As stated
above, there are many things that can impact the performance of a video. The
content of videos is
of paramount importance, yet is notoriously difficult to quantify. Just as
there may be hit
performances at the theater, the creativity, talent, editing and production of
the performance is just
19
CA 02895389 2015-06-16
WO 2014/105940 PCT/US2013/077783
as important as the script. By measuring lift on different videos, one can
discern what works and
what does not work for different targeted audiences. In a standard A/B test,
video 'A' is tested
versus video 13' and video lift for each video is measured to determine which
video is better. As
noted above, examples of suggested A/B testing with different videos include:
voiceover versus
presenter, wherein a live presenter is used rather than just video of the
product; documentary versus
conversational style (style and tone of presenter); short versus long videos;
pets or no pets; children
or no children; feature order in the video; on-site video versus in-studio
video; white-screen versus
set video; motion graphics in video versus no motion graphics; and in-video
shopping or calls-to-
action within the video versus no calls-to-action.
[0055] Behavior can be tracked from one video to another video, as well as sub-
segments of the
viewers, to determine an effectiveness of various videos. For example, one can
test whether a
shorter video may work better for a mobile platform versus a longer video. As
another example,
one can test female presenters versus male presenters and test which works
better for a female
shopper. As yet another example, one may test a young or old presenter for
different age-
segmented targets. Other items that can be targeted based on personalized
information include: the
use of different accents on actors in different videos based on geographic
location information; the
use of different race of actors in videos based on known ethnicity; the use of
different actors based
on income; the use of motion graphics based on age or sex; and different
videos based on user
agent, mobile, or browser.
[0056] The video production process is also complex and involves many
different elements. The
elements that can be tracked in a database and optimized to produce the most
profit include: script
writer; talent (actors/type of actor); producer; set; and editor. The video
can be placed on an e-
commerce webpage using a common scripting language, e.g., Javascript. The
Javascript can be
configured to receive personalized information from a personalized information
database or other
source, such as using an Internet protocol (IP) or known geographic location
information of the
user, using the user-agent information to determine if the customer is on a
mobile platform or what
type of browser. The video can be displayed in a video player.
[0057] An exemplary video player 100 is illustrated in Figure 2. Video player
100 may include:
custom branding or promotion 110, customizable player controls and skin
(color, position, and
style) 120, shopping cart integration 130, multiple video clip navigation 140,
social sharing
capabilities 150, video quality adjustments 160, and options, e.g., ratings
and comments 170.
Ratings and comments from customers can be fed back into a production database
and production
CA 02895389 2015-06-16
WO 2014/105940 PCT/US2013/077783
process to optimize the performance of the video.
[0058] Different videos can be tested within the video player 100 on a webpage
180 in response to
call-to-action 190, as is shown in Figure 3. In Figure 3, video 'A' (which
includes a presenter 210)
or video 13' (which includes voiceover) may be presented in the video player
100. Add-to-cart 200
may be employed by a viewer to purchase a product in response to video 'A' or
13'. The video
player 100 may be incorporated into a full system as is illustrated in Figure
6. In Figure 4, the
components of the video player 100, embedded in a webpage 180, are shown with
an add-to-cart
button 200. The player 100 is loaded with Javascript or some other convenient
language (such as,
Ajax, php, etc.) into the webpage 180 which allows for conditional processing
based on
personalized information. A player call-to-action button 190 can be managed
(to be shown or not
shown) based on experiment management engine 350 rules that are put into
Javascript files 370 on
video hosting system 360. Javascript loader 380 and player 100 are configured
to dynamically run
experiments based on the personalization information either from browser/user
agent/network/geographic information that is available and/or from
personalization information
database 390.
[0059] In addition the player 100 and the Javascript loader 380 are configured
to track customer
behavior (such as, page views, video views and conversion events, e.g., add-to-
cart 200 and/or
purchase events (not shown)). The events are sent to a conversion tracking
results database 340 and
the calculations of the data are performed in recommendation/optimization
engine 290.
Specifically, lift 300, view rate 310, bias 320, and abandonment 330 are some
of the performance
indicators that are calculated. The recommendation/optimization engine 290 is
then configured to
change the Javascript files (with loading targets) 370 to optimize the
performance (profit) of the
video. Different videos are produced by different steps in the production
process including (but not
limited to) product selection 230, script writing 240, talent selection 250,
production 260, and
editing 270. All of these production steps are tracked in production database
280 and the
recommendation/optimization engine 290 is configured to feedback credit for
each of the different
components. For example, if there are two different script writers working on
two different videos
in an A/B test, the video with the higher video lift will credit the script
writer that worked on that
video. The credit may then be used as a preference for that script writer for
future video production.
A similar mechanism for optimization can be performed on each of the
components of production.
[0060] With reference to Figures 5-13, a process is illustrated for
transforming a data structure
representing a decision tree of arbitrary complexity into one that is more
compact and readily
21
CA 02895389 2015-06-16
WO 2014/105940 PCT/US2013/077783
traversed at decision time. Any sequence of decisions can be represented as a
tree, with nodes
representing each decision to be made, and paths leading from one decision
node to the next,
ultimately leading to final decision branches. The outcome of some decisions
are based on
contextual or environmental information, while the outcomes of other decisions
are based on
probability of a random occurrence, such as whether a generated random number
is greater or less
than a certain value. The process transforms the tree in such a way that all
contextual and
environmental decisions can be made first, and then a single probabilistic
decision can be
determined, thus reducing the number of decisions that are required to be
processed.
[0061] The process comprises two phases of processing: a tree transformation
phase (phase 1, see
Figure 5); and a subtree compaction phase (phase 2, see Figure 12). The tree
transformation phase
proceeds by performing an operation comprising examining a node in the tree
and performing a
series of zero or more transformations to the subtree(s) underneath it, and
then selecting one of the
adjacent nodes to perform the same operation again in a recursive manner. The
operation
performed on a node consists of first examining the node. If the node
represents a non-probabilistic
decision (e.g., a contextually or environmentally based decision), then the
process traverses the
links to each child node beneath it in turn (in no deterministic order) and
performing the same
operation. If the node represents a probabilistic decision, then the operation
prescribes a depth-first
search down each of the child branches to find a non-probabilistic node.
[0062] If a non-probabilistic node is found, the search is halted. The non-
probabilistic node is
detached from its parent node, as is the probabilistic node currently being
operated on. The non-
probabilistic node is also detached from each of its child nodes. The non-
probabilistic node is then
attached to the (former) parent of the probabilistic node being operated on.
The subtree rooted at
the probabilistic node is duplicated as many times as the non-probabilistic
node had children (which
are all now detached subtrees). Each duplicated subtree rooted at the
probabilistic node is made a
child of the non-probabilistic node such that the same decision criteria that
would have led to
traversing the branch to the original child will now lead to the (possibly
copy of the) probabilistic
node, and the corresponding original child node is made the child of the
parent node from which the
non-probabilistic node was originally detached.
[0063] This final step is repeated for each detached copy of the subtree
rooted at the probabilistic
node (copy) that is being operated on, and the corresponding detached subtree
rooted at the node
formerly a child of the non-probabilistic node until all copied subtrees and
detached subtrees rooted
at former children of the non-probabilistic node are all re-connected,
resulting in a single tree with
22
CA 02895389 2015-06-16
WO 2014/105940 PCT/US2013/077783
no detached nodes or subtrees. Once all subtrees are re-connected, the
operating is repeated,
beginning at the non-probabilistic node that was just re-inserted into the
decision tree, repeating the
process until all nodes in the tree have been traversed, at which point there
are no probabilistic
nodes higher in the tree than a non-probabilistic node. Every decision tree
has a single root node,
representing the first decision to be made. The initial operation of phase one
begins at that node.
[0064] The second phase consists of compacting all purely probabilistic
subtrees. Each
probabilistic node represents a decision with two or more outcomes. Each
outcome has a fixed
probability between zero and one. Each outcome may lead to another
probabilistic decision node
with its own set of probable outcomes. These children may be compacted into
the parent by
replacing the link to the child in the tree with as many links as there are
possible outcomes of the
child. The probabilities assigned to the new links are equal to the product of
the original probability
of the outcome leading to the child with each of the probabilities of the
outcomes of the child
decision, respectively. This process is repeated recursively until all
probabilistic decision nodes
have no decision node children, and every outcome links to a final decision
branch.
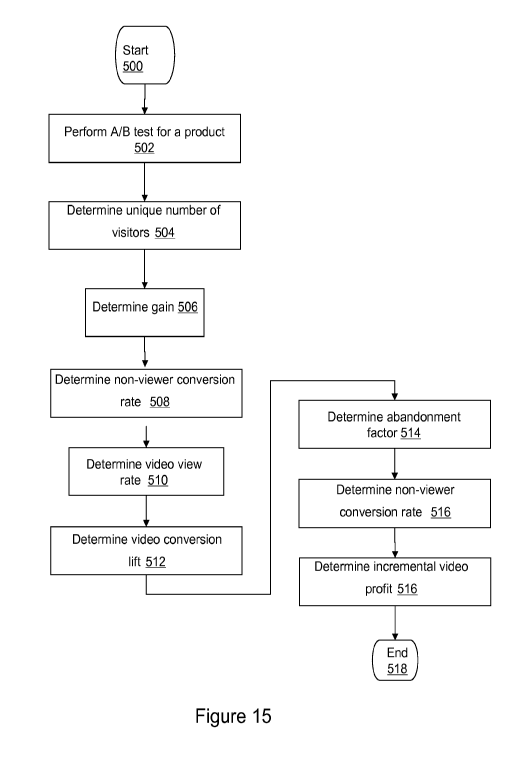
[0065] With reference to FIG. 15, a flowchart of a process for measuring video
profit, according to
an embodiment of the present invention, is illustrated. The process is
initiated in block 500, at
which point control transfers to block 502 where an A/B test for a product is
performed (e.g., by
experiment management engine 350) while monitoring for customer conversion. In
this case, at
least one of 'A' and 13' correspond to video. Next, in block 504, a unique
number of visitors to a
product webpage that viewed a call-to-action for a video of the product is
determined based on the
test (e.g., by recommendation/optimization engine 290). Then, in block 506, a
gain that accounts
for customer bias is determined based on the test (e.g., by
recommendation/optimization engine
290).
[0066] Next, in block 508, a non-viewer conversion rate is determined based on
the test (e.g., by
recommendation/optimization engine 290). Then, in block 510, a video view rate
is determined
based on the test (e.g., by recommendation/optimization engine 290). Next, in
block 512, a video
conversion lift is determined based on the test (e.g., by
recommendation/optimization engine 290).
Then, in block 514, an abandonment factor is determined based on the test
(e.g., by
recommendation/optimization engine 290). In block 516, an incremental video
profit for the
product is determined based on the unique number of visitors, the gain, the
non-viewer conversion
rate, the video view rate, the video conversion lift, and the abandonment
factor (e.g., by
recommendation/optimization engine 290). Following block 516, control
transfers to block 518
23
CA 02895389 2015-06-16
WO 2014/105940 PCT/US2013/077783
where the process terminates.
[0067] With reference to FIG. 16, a process (executed on a data processing
system) for estimating
video profit via a database of statistical values for each category of product
without requiring an
A/B test, according to an embodiment of the present invention, is illustrated.
The process is
initiated in block 600, at which point control transfers to block 602 where a
database is accessed for
a related category A/B test conversion rate and bias results for a product.
Next, in block 604, a
unique number of visitors to a product webpage that viewed a call-to-action
for a video of the
product is determined. Then, in block 606, a gain that accounts for customer
bias is determined.
[0068] Next, in block 608, a non-viewer conversion rate is determined. Then,
in block 610, a video
view rate is determined. Next, in block 612, a video conversion lift is
determined. Then, in block
614, an abandonment factor is determined. Next, in block 616 a non-view
conversion rate is
determined. Then, in block 616, an incremental video profit is estimated from
related category bias
results. Following block 616, control transfers to block 618 where the process
terminates. The
main idea behind the process depicted in Figure 16 is that once a database of
a category of a
company's products are established, A/B testing does not always have to be
performed to determine
an estimated profit for a product. That is, an estimated profit for a product
can be derived using the
video profit equation with average category results.
[0069] With reference to FIG. 17, an exemplary video player that is configured
to include links to
offer different products that are determined by a recommendation/optimization
engine that accesses
a database product category information and/or personalized information,
according to an
embodiment of the present invention, is illustrated. As is shown, a
recommendation/optimization
engine 704 receives information from personalization database 700 and category
conversion and
bias database 702. Based on the information received from personalization
database 700 and
category conversion and bias database 702, recommendation/optimization engine
704 provides a
personalized list of optimal related products 706 of which two product links
710 and 712 are
displayed on video player 708. The main idea behind the embodiment of Figure
17 is that the video
player experience can be personalized with personalization/product category
information databases
via an optimization engine that optimizes estimated profit.
[0070] Accordingly, techniques have been disclosed herein that advantageously
optimize the
targeting of video content using one or more disclosed video profit equations.
[0071] Although the invention is described herein with reference to specific
embodiments, various
24
CA 02895389 2015-06-16
WO 2014/105940 PCT/US2013/077783
modifications and changes can be made without departing from the scope of the
present invention
as set forth in the claims below. Accordingly, the specification and figures
are to be regarded in an
illustrative rather than a restrictive sense, and all such modifications are
intended to be included
with the scope of the present invention. Any benefits, advantages, or solution
to problems that are
described herein with regard to specific embodiments are not intended to be
construed as a critical,
required, or essential feature or element of any or all the claims.
[0072] Unless stated otherwise, terms such as "first" and "second" are used to
arbitrarily distinguish
between the elements such terms describe. Thus, these terms are not
necessarily intended to
indicate temporal or other prioritization of such elements.