Note: Descriptions are shown in the official language in which they were submitted.
CA 02896243 2015-06-22
WO 2014/107656 PCT/US2014/010328
DEVICE AND METHOD FOR DETECTING IRREGULAR PLACEMENT OF AN
EXTRACORPOREAL VASCULAR ACCESS NEEDLE
TECHNICAL FIELD
[0001] Embodiments relate to devices and methods for detecting failure in
dialysis systems
based on pressure measurements.
BACKGROUND
[0002] Proper functioning of the vascular system is essential for the
health and fitness of
living organisms. The vascular system carries essential nutrients and blood
gases to all living tissues
and removes waste products for excretion. The vasculature is divided into
different regions
depending on the organ systems served. If vessels feeding a specific organ or
group of organs are
compromised, the organs and tissues supplied by those vessels are
deleteriously affected and can
even fail completely.
[0003] Vessels, especially various types of arteries, not only transmit
fluid to various locations,
but are also active in responding to pressure changes during the cardiac
cycle. With each contraction of
the left ventricle of the heart during systole, blood is pumped through the
aorta and then distributed
throughout the body. Many arteries contain elastic membranes in their walls
that assist in expansion of
the vessel during systole. These elastic membranes also function in smoothing
pulsatile blood flow
throughout the vascular system. The vessel walls of such arteries often
rebound following passage of the
systolic pressure waveform.
[0004] In autoregulation, cerebral blood vessels maintain constant
cerebral blood flow by either
constricting or dilating over a certain mean arterial blood pressure range so
that constant oxygen delivery
is maintained to the brain. Vascular failure occurs when the pressure drops
too low and the oxygen
delivery starts to fall. If the blood pressure gets too high and the vessels
can no longer constrict to limit
flow, then hyperemia breakthrough or loss of autoregulation can occur. Both of
these conditions are
pathologic states, and have been described in the literature in terms of mean
arterial pressure and cerebral
blood flow velocity, but there are others that cannot be explained based on
that model. The failure of the
1
CA 02896243 2015-06-22
WO 2014/107656 PCT/US2014/010328
model is that it relies upon systemic blood pressure. The pressure of blood in
the brain itself is not being
measured directly. The resultant pressure curve has an S-shaped curve.
[0005] The force applied to the blood from each heartbeat is what drives
the blood forward.
In physics, force is equivalent to mass times acceleration. But when blood is
examined on a beat-to-
beat variation, each heartbeat delivers about the same mass of blood, unless
there is severe loss of
blood or a very irregular heart rhythm. Therefore, as a first approximation,
the force of flow on the
blood at that particular moment is directly proportional to its acceleration.
[0006] Diseased blood vessels lose the ability to stretch. The elasticity
or stretch of the
blood vessel is very critical to maintaining pulsatile flow. When a muscle is
stretched, it is not a
passive relaxation. There is a chemical reaction that happens within the
muscle itself that causes a
micro-contracture to increase the constriction, so that when a bolus of blood
comes through with
each heartbeat, it stretches the blood vessel wall, but the blood vessel then
contracts back and gives
the kick forward to maintain flow over such a large surface area. This
generates a ripple of waves,
starting in the large vessel of the aorta and working its way through the rest
of the vessels. As
vessels become diseased, they lose the ability to maintain this type of
pulsatile flow.
[0007] Further, if vessels are compromised due to various factors such as
narrowing or stenosis
of the vessel lumen, blood flow becomes abnormal. If narrowing of a vessel is
extensive, turbulent flow
can occur at the stenosis resulting in damage to the vessel. In addition,
blood cannot flow adequately
past the point of stenosis, thereby injuring tissues distal to the stenosis.
While such vascular injuries can
occur anywhere throughout the body, the coronary and cerebral vascular beds
are of supreme importance
for survival and well-being of the organism. For example, narrowing of the
coronary vessels supplying
the heart can decrease cardiovascular function and decrease blood flow to the
myocardium, leading to a
heart attack. Such episodes can result in significant reduction in cardiac
function and death.
[0008] Abnormalities in the cerebral vessels can prevent adequate blood
flow to neural
tissue, resulting in transient ischemic attacks (TIAs), migraines, and stroke.
The blood vessels that
supply the brain are derived from the internal carotid arteries and the
vertebral arteries. These
vessels and their branches anastomose through the great arterial circle, also
known as the Circle of
Willis. From this Circle arise the anterior, middle and posterior cerebral
arteries. Other arteries such
2
CA 02896243 2015-06-22
WO 2014/107656 PCT/US2014/010328
as the anterior communicating artery and the posterior communicating artery
provide routes of
collateral flow through the great arterial circle. The vertebral arteries join
to form the basilar artery,
which itself supplies arterial branches to the cerebellum, brain stem and
other brain regions. A
blockage of blood flow within the anterior cerebral artery, the posterior
cerebral artery, the middle
cerebral artery, or any of the other arteries distal to the great arterior
circle results in compromised
blood flow to the neural tissue supplied by that artery. Since neural tissue
cannot survive without
normal, constant levels of glucose and oxygen within the blood and provided to
neurons by glial
cells, blockage of blood flow in any of these vessels leads to death of the
nervous tissue supplied by
that vessel.
[0009] Strokes result from blockage of blood flow in cerebral vessels due
to constriction of the
vessel resulting from an embolus or stenosis. Strokes can also arise from
tearing of the vessel wall due to
any number of circumstances. Accordingly, a blockage can result in ischemic
stroke depriving neural
tissue distal to the blockage of oxygen and glucose. A tearing or rupture of
the vessel can result in
bleeding into the brain, also known as a hemorrhagic stroke. Intracranial
bleeding exerts deleterious
effects on surrounding tissue due to increased intracranial pressure and
direct exposure of neurons to
blood. Regardless of the cause, stroke is a major cause of illness and death.
Stroke is the leading cause
of death in women and kills more women than breast cancer.
[0010] Currently, more than three-quarters of a million people in the
United States
experience a stroke each year, and more than twenty-five percent of these
individuals die.
Approximately one-third of individuals suffering their first stroke die within
the following year.
Furthermore, about one-third of all survivors of a first stroke experience
additional strokes within the
next three years.
[0011] In addition to its terminal aspect, stroke is a leading cause of
disability in the adult
population. Such disability can lead to permanent impairment and decreased
function in any part of the
body. Paralysis of various muscle groups innervated by neurons affected by the
stroke can lead to
confinement to a wheelchair, and muscular plasticity and rigidity. Strokes can
leave many patients with
little or no ability to communicate either orally or by written means. Often,
stroke patients are unable to
think clearly and have difficulties naming objects, interacting well with
other individuals, and generally
functioning within society.
3
CA 02896243 2015-06-22
WO 2014/107656 PCT/US2014/010328
[0012] Despite the tremendous risk of stroke, there are presently no
convenient and accurate
methods to access vascular health. Many methods rely on invasive procedures,
such as arteriograms, to
determine whether vascular stenosis is occurring. These invasive techniques
are often not ordered until
the patient becomes symptomatic. For example, carotid arteriograms can be
ordered following a
physical examination pursuant to the appearance of a clinical symptom.
Performing an arterio gram is
not without risks due to the introduction of dye materials into the vascular
system that can cause allergic
responses. Arteriograms also use catheters that can damage the vascular wall
and dislodge intraluminal
plaque, which can cause an embolic stroke at a downstream site. It would
therefore be useful to develop
a noninvasive or limited invasive procedure for assessing vascular health.
[0013] Further, in the field of hemodialysis and other techniques where
blood is removed from a
patient for processing and then returned, it is important to periodically
assess the blood flow rate through
an arteriovenous fistula, graft, or catheter to monitor the onset of stenosis.
This is often accomplished by
the reading of access pressures through the venous and arterial access
needles. Early detection of
stenosis associated with the placement of a fistula, graft, implantable port,
or a catheter can permit low
cost repairs to be made. On the other hand, if these problems are ignored or
not detected, the cost of the
revision or replacement of the fistula, graft, implantable port, or catheter
can be very high and
burdensome to the patient.
[0014] There have been several devices that have been developed to
determine pressure inside a
dialysis machine or during hemodialysis. For example, as disclosed in U.S.
Patent No. 5,454,374 to
Omachi, access pressures can be determined through volumetric manipulations
involving the
determination of a pressure head height of blood in a visual manner. The blood
line going to the dialysis
machine is used to measure pressure and the problem is one of determining the
height between the
transducer and the patient's access site.
[0015] U.S. Patent No. 4,710,163 to Levin et al. discloses a method and
system for
continuously monitoring patient heart rate and mean arterial blood pressure
during hemodialysis and
for automatically controlling fluid extraction rate and/or dialysate sodium
concentration in the event
that blood pressure and/or heart rate indicate onset or impending onset of a
patient hypotensive
episode. There are three separate machines for performing these functions: an
automated blood
pressure monitor, an automated patient heart rate monitor, and the
hemodialysis machine. The blood
4
CA 02896243 2015-06-22
WO 2014/107656 PCT/US2014/010328
pressure monitor is essentially a device for measuring blood pressure based on
the blood in the
patient's arm, i.e. a cuff that inflates and deflates automatically to read
the diastolic and systolic
blood pressure readings. This device merely takes the place of an actual
technician to take a blood
pressure reading. The blood pressure readings are derived from a standard
blood pressure cuff on
the patient's arm and not from the intravascular blood near the access site
for an extracorporeal
circuit.
[0016] U.S. Patent No. 6,623,443 to Polaschegg discloses a device that
measures and
compares the amplitude of pressure pulses within an extracorporeal circuit to
determine whether a
stenosis has occurred therein. The peak-to-peak amplitude of the pressure
waves created by
variations in the patient's blood pressure and variations in pressure created
by the extracorporeal
blood pump are used to indicate the presence of an obstruction in the circuit.
A deviation in the
peak-to-peak amplitude of the pressure signal from a predetermined standard
value indicates a
stenosis or loss of occlusion of the roller pump. No standard is defined to
indicate a stenosis that
represents a significant risk to the patient. No measurements or calculations
of intravascular blood
pressure occur.
BRIEF DESCRIPTION OF THE DRAWINGS
[0017] FIGURE 1 shows a dialysis circuit used to determine the
relationship between blood flow
and hemodialysis machine venous drip chamber pressure with hematocrit varied
from 38.4% to 18.2%;
[0018] FIGURE 2 shows the venous drip chamber pressure versus blood flow
in a hemodialysis
machine blood circuit for a range of hematocrit values, including a single
curve showing venous needle
pressure at a hematocrit of 29.1%, wherein venous needle pressure is 0 mmHg
when Qb=0 because the
transducer and the venous needle are at the same height, and venous drip
chamber pressure is
approximately -17 mmHg when Qb=0 because the venous needle is 17 centimeters
below the height of
the drip chamber transducer;
[0019] FIGURE 3 shows the receiver-operating characteristic (ROC) curves
for the January
1999 VAPRT for grafts (117) and fistulas (23) combined and grafts alone, an
area of 1 represents an
CA 02896243 2015-06-22
WO 2014/107656 PCT/US2014/010328
ideal test, an area of 0.5 indicates the test has only a 50% probability
determining the correct
outcome, and an area from 0.80 to 0.90 implies a good test;
[0020] FIGURE 4 shows the distribution of access pressure ratio values
within the four
possible test groups: true positive, true negative, false positive, and false
negative for patients with
grafts;
[0021] FIGURE 5 shows the access pressure ratio test results for three
separate months of
testing, wherein patients were followed for six months after each test for an
access failure event;
[0022] FIGURE 6 is a graph showing the relationship between coefficient B
in the equation
for venous drip chamber pressure with zero venous access pressure VDP0 =
0.00042329*Qb2 +
B*Qb 17.325 and hematocrit (Hct);
[0023] FIGURE 7 is a flow chart depicting the inner workings of a device
and algorithm used to
determine the venous access pressure ratio (VAPR) and monitor for significant
variations in VAPR from
treatment to treatment according to an embodiment;
[0024] FIGURE 8 is a photograph of a percutaneous transluminal
angioplasty;
[0025] FIGURES 9A and B are photographs depicting dialysis machines for
use in
conjunction with the device in accordance with an embodiment;
[0026] FIGURE 10 is a flowchart depicting a method of detecting a
dislodged needle during
hemodialysis according to an embodiment.
[0027] FIGURE 11 is a graph depicting venous access pressure ratio (VAPR)
versus
monitoring time in months, wherein incidences of poor needle placement and the
moving average of
VAPR are indicated; and
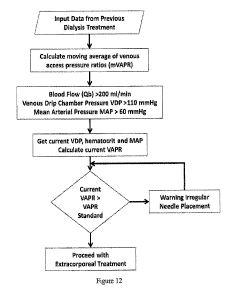
[0028] FIGURE 12 is a flowchart illustrating an algorithm for determining
irregular needle
placement, wherein after starting the blood flow in the extracorporeal circuit
the current venous
access pressure ratio is determined and compared to a predetermined standard.
DETAILED DESCRIPTION
6
CA 02896243 2015-06-22
WO 2014/107656 PCT/US2014/010328
[0029] As required, detailed embodiments of the present invention are
disclosed herein;
however, it is to be understood that the disclosed embodiments are merely
exemplary of the
invention that may be embodied in various and alternative forms. The figures
are not necessarily to
scale; some features may be exaggerated or minimized to show details of
particular components.
Therefore, specific structural and functional details disclosed herein are not
to be interpreted as
limiting, but merely as a representative basis for teaching one skilled in the
art to variously employ
the present invention.
[0030] Generally, according to embodiments, a detection device and method
are provided for
detecting variations in intravascular pressure that indicate irregular blood
flow, i.e. a suspected blood
flow restriction or other blood flow problem, especially when a needle of a
hemodialysis device has
become dislodged from a patient. The device includes an analyzer for
automatically analyzing
intravascular pressure upstream of the suspected location of irregular blood
flow and comparing the
intravascular pressure to a standard, whereby variations in the intravascular
pressure during multiple tests
is indicative of a blood flow restriction.
[0031] U.S. Patent No. 7,597,666 to Frinak et al. disclosed for the first
time a method of
detecting an irregular intravascular pressure by measuring extracorporeal
pressure taken from a patient
and analyzing the extracorporeal pressure with an algorithm to determine
intravascular pressure. The
intravascular pressure is compared to a standard in order to determine if the
patient is at risk of
developing a stenosis. Variation of the calculated intravascular pressure
multiple times with the standard
indicates irregular blood flow and risk of stenosis.
[0032] Dialysis is a very complicated procedure that must be carried out
by a team of trained
professionals who are responsible for delivering safe and effective care to
the patient. It can also be self-
administered by a patient in their home, but only after the patient has
undergone extensive training.
There are many ways that complications can arise during a dialysis session.
Many of these potential
issues are constrained by alarm circuits and other safeguards built into the
dialysis machine.
[0033] Hemodialysis machines utilize two needles, one to remove blood
from the patient
(arterial) and one to put the dialyzed blood back into the patient (venous
needle). The venous needle can
become dislodged from the patient, such as accidentally pulled out of the
access, which then allows the
7
CA 02896243 2015-06-22
WO 2014/107656 PCT/US2014/010328
blood being pumped back into the patient to run onto the floor. Because of the
relatively high blood
flows of the dialysis machines (300 to 500 ml of blood per minute), if this
dislodgement goes unnoticed
the patient can bleed to death in a short amount of time. For example, an
average male patient can lose
40% of their blood supply in 8 minutes. Even in a hospital or clinical
setting, dislodgement can
sometimes occur without any visual detection by a medical staff because a
blanket can cover the
bloodlines. This issue is even more of a concern when a patient is dialyzed
overnight. This can be more
convenient for patients who do not want to spend the day in the hospital, with
the hemodialysis
procedure performed while they are asleep. However, overnight dialysis poses
even more of a risk that
the dislodgement of the venous line needle during the procedure will go
unnoticed. For example, if the
patient rolls over during sleep or otherwise significantly moves in the
hospital bed, this can cause needle
dislodgement. A large quantity of blood can be lost and death can result in
many cases. It has been
estimated that between 40 and 136 patients die each year in the US due to
losing sufficient blood because
of needle displacement.
[0034] The current method of detecting dislodgement of a needle is visual
monitoring by staff
that must instruct the patient not to cover venous lines with a blanket. While
many hemodialysis
machines do include some sort of alarm to indicate pressure changes in the
venous and arterial
bloodlines, dislodgement of needles generally do not trigger an alarm, so the
dislodgment is often not
detected until too late. The reason for this is that small gauge needles that
are used to minimize pain to
patients create back-pressures that continue to be detected by the machine
when the needle is dislodged.
This sufficient back-pressure created in the tubing and needle masks the
pressure drop at the tip of the
needle if it becomes dislodged, such that the drop in the pressure caused by
the removal of the needle
from the arm, and hence the loss of the pressure required to push the blood
into the patient's arm, is not
high enough to show a significant change in the pressure as measured by the
venous drip chamber
transducer, especially if the range of alarm is not set correctly on the
machine. Thus, sufficient pressure
remains in the circuit between the tubing and the needle so that the measured
venous drip pressure does
not drop significantly, and no alarm is set off. There is a need for a more
reliable method of detecting
dislodgement of venous needles from a patient as well as an alarm system to
turn off the blood pump on
the dialysis machine and alert medical personnel in time to save a patient's
life.
[0035] According to an embodiment, a method is provided for detecting a
dislodged needle
in a hemodialysis procedure by measuring venous drip pressure in a patient,
analyzing the venous
8
CA 02896243 2015-06-22
WO 2014/107656 PCT/US2014/010328
drip pressure and deriving intravascular blood pressure at the location of
needle placement in the
patient. The actual pressure may be calculated as seen at the tip of the
venous needle, which when
dislodged, dramatically decreases to zero or near zero. Hence, the radical
change in this calculated
pressure when a needle is dislodged allows for the determination that
something is wrong with the
venous needle and should be investigated. According to another embodiment, a
method is also
provided of shutting down the dialysis machine and alerting medical personnel
of a dislodged needle
in a hemodialysis procedure.
[0036] The "detection device" as disclosed herein is intended to include,
but is not limited to,
any device that is able to detect variations in intravascular pressure that
indicate irregular blood flow.
In one embodiment, the intravascular pressure is venous pressure that is
upstream of the suspected
area or location of a blood flow restriction. An example of such a device is a
hemodialysis machine.
[0037] The "analyzer device" as used herein is intended to include a
device that is capable of
automatically analyzing the intravascular pressure. Such an analyzer device
can be computer-driven.
For example, the analyzer can include a device that is associated with a
hemodialysis machine, such
that it automatically assesses intravascular pressure during hemodialysis. The
analyzer can then
equate and compare the intravascular pressure to a standard. An equation is
used that estimates
pressure inside a blood access site and is then used to detect irregular blood
flow. In one
embodiment, this equation is an algorithm that calculates the ratio between
venous blood pressure
and mean arterial pressure.
[0038] The term "variation" is intended to include an increase or
decrease in the derived
intravascular pressure. Any deviation from the standard can be indicative of a
problem. Depending
upon whether there is an increase or decrease in intravascular pressure, the
detection of the deviation
helps determine what the problem is at the access site. For example, if there
is an increase in
intravascular pressure, the problem potentially is something that blocks
normal blood flow
downstream of the measurement site. The blockage represents a narrowing of a
blood vessel that
increases the risk for an access failure, a stroke, or a heart attack. If
there is a decrease in
intravascular pressure, this is indicative of a blockage of normal blood flow
upstream of the
measurement site.
9
CA 02896243 2015-06-22
WO 2014/107656 PCT/US2014/010328
[0039] The term "communication device" as used herein is intended to
include a device
operably connected to the detecting device for communicating a warning when
the detecting device
indicates an irregularity of blood pressure of at least two uses of said
device. The communicating
device can be selected from, but is not limited to, electronic communications,
a facsimile, a
telephone, a cable modem, and a Ti connection.
[0040] The term "algorithm" as used herein is intended to encompass any
computation that
enables an individual to ascertain the information necessary for detecting
irregular intravascular pressure.
In one embodiment, the algorithm is computer driven and follows the general
function shown in FIGS.
7A through D. The algorithm can be used as part of an integrated circuit. This
circuit enables the
algorithm to be more easily incorporated into a dialysis machine. The circuit
can be created using
technology known to those with skill in the art.
[0041] The methods described herein may be practiced with the following
device. The
device includes a detection device for detecting irregular intravascular
pressure, the device including
an analyzer for automatically monitoring intravascular pressure upstream of
the suspected location
of irregular blood flow, and a device for comparing intravascular pressure to
a standard, whereby
variation in the intravascular pressure during multiple tests is indicative of
irregular blood flow. As
disclosed above, the device may be affixed to a hemodialysis machine; however,
the device can be
affixed to any other device with blood flow. The analyzer is a computer-driven
device and may
include an algorithm that analyzes intravascular pressure, hemodialysis venous
access pressure, and
blood pump flow data to identify patients at-risk for access dysfunction,
either for thrombosis
requiring percutaneous transluminal angioplasty, or surgery to maintain access
patency.
[0042] Alternatively, the device can be included as part of a hand-held
device. In this
embodiment, the device may replace the pressure gauge with a hand-held
microprocessor controlled
device that measures and records the pressure measurements. An algorithm in
the device calculates
the average pressure over a predetermined sampling period. The device may also
contain a
computer database to recall individual patient information and to record
current pressure
measurements in the patient's database record. Data from the device can be
transferred via a
communication port to a larger computer system with a more extensive patient
database.
CA 02896243 2015-06-22
WO 2014/107656 PCT/US2014/010328
[0043] Generally, according to at least one embodiment, a method and
device may be
provided for monitoring and/or detecting failure in a system based on pressure
measurements. The
present invention has numerous applications which can include, but is not
limited to, mechanical,
chemical, and biological arts. For instance, in chemical processes, the
present invention is useful
where pressure changes are indicative of system failure. Additionally, the
method and device of the
present invention can be used for detecting any variation in blood pressure
and forwarding via the
communicating device a warning regarding this variation. The device and method
therefore can be
used in detecting potential access failure, risk of stroke, risk of heart
attack, risk of stenosis, and risk
of aneurysm.
[0044] More specifically, a method is provided for detecting a dislodged
needle in a
hemodialysis procedure by measuring venous drip chamber pressure in a patient,
analyzing the
venous drip pressure and deriving intravascular blood pressure at a location
of the venous needle
insertion into the patient, comparing the derived intravascular blood pressure
to a standard which
may have been developed from prior calculations during that particular
session, and repeating the
measuring, analyzing and deriving, and comparing steps to determine if the
derived intravascular
blood pressure is within a specified range of the standard, which may
indicated that a needle has
been dislodged in the hemodialysis procedure. The steps of this method are
generally depicted in
FIGURE 10.
[0045] The venous drip chamber pressure (VDP) is the pressure that is
actually measured in
the extracorporeal circuit (outside the body), and is further described below.
The intravascular blood
pressure is calculated by analyzing the venous drip pressure and the deriving
venous access pressure
(VAP) in proximity of a location of venous needle's point of access on the
body. These steps are
further described below. The derived intravascular blood pressure (VAP) is
compared to a standard
that can be set for the device or derived from prior measurements of VAP
during the session or from
prior sessions for the patient as further described below. Each of the
measuring, analyzing and
deriving, and comparing steps may be repeated multiple times during the
session when the medical
device is in use. More specifically, multiple VAP values are determined over
multiple time periods.
It may be advantageous from a safety point of view to make these measurements
frequently.
11
CA 02896243 2015-06-22
WO 2014/107656 PCT/US2014/010328
[0046] Once the intravascular pressure (VAP) has been determined to be
within a specified
range of the standard, possibly indicating that the needle has become
dislodged, an alarm circuit may be
activated that then communicates via a communication device a command to alert
the medical staff
and/or turns off the blood pump of the hemodialysis machine, so that the
patient does not continue to lose
blood.
[0047] The device may include an alarm that is activated and alerts
medical personnel to a
problem with the patient. The alarm may provide a warning if the patient's
needle came out of the
access, i.e. became dislodged. Thus, the venous drip chamber pressure is equal
to or close to venous
drip chamber at zero access pressure for an alarm to occur. Currently,
dialysis machines cannot
detect an opening of the venous return line and incidents of severe bleeding
have been reported when
the venous needle has come out of the access site during dialysis. By
detecting a drop in the
intravascular pressure of the patient, an alarm can be activated on the
detecting device that alerts
medical personnel to the patient's condition so that the needle can be
replaced and the patient's life
can be saved from unnecessary blood loss. The alarm can also wake up the
patient if asleep so that
the patient can alert medical personnel, and can include a vibrating portion
attached to the patient to
assist in waking up or alerting the patient.
[0048] The algorithm according to an embodiment calculates the actual
pressure as seen at the
tip of the needle by removing the pressure caused by the needle and tubing
(VDP0) from the measured
VDP, which leaves VAP. By building the algorithm into the dialysis machine so
that VAP is calculated
often, an alarm can be sounded when VAP drops to zero or near zero, thus
indicating that the venous
needle probably has dislodged. This alarm determination can then a) turn off
the machine so that the
patient does not lose more blood, and b) sound an alarm to notify either the
medical staff or the home
care patient that a problem exists.
[0049] The algorithm can be utilized as an alarm system in any device
that transports blood
from a patient to an extracorporeal circuit and returns the blood to the
patient. The algorithm
determines the pressure at the point of insertion of the blood into the body
based on a pressure
reading in the extracorporeal blood circuit along with the rate of fluid flow
through the device, the
physical properties of the fluid transported through the device and a
determination of the pressure
inherent in the external circuit beginning from the pressure measuring device
to the end of the needle
12
CA 02896243 2015-06-22
WO 2014/107656 PCT/US2014/010328
at the point of insertion into the body. The algorithm allows the alarm level
to vary with the rate of
fluid flow through the device. The device can be utilized as an alarm in
plasmapheresis, heart lung
machines and any extracorporeal blood treatment or infusion technology
circuits. Alarm systems
based on the device are not limited to medical applications but can be
developed for any fluid
transporting device. Alarm levels can be set at any pressure value that
provides safe operation of the
device.
[0050] The alarm can be a wireless alarm or a hardwired alarm. More
specifically, a
wireless alarm can send wireless signals to a handheld monitor/device that is
carried by medical
personnel or to a central monitoring area, such as by the Internet or through
communication
mechanisms that include, but are not limited to electronic communications,
facsimile, telephone,
cable modem, and Ti connection. A hardwired alarm can send signals to any
device that is in
electrical connection with the detecting device of the present invention, such
as a central monitoring
area. The alarm can also be an audible warning or other similar signal that
sends a command to the
medical device (such as turn off) and/or wakes up the patient and alerts
medical personnel.
[0051] Thus, by performing the method according to disclosed embodiments,
if a needle
should become dislodged by the patient's movement during sleep or otherwise,
the patient's life can
be saved by turning off the machine and alerting medical personnel in time.
[0052] A method is also provided for alerting medical personnel of a
dislodged needle in a
hemodialysis procedure by detecting a drop in intravascular pressure derived
from measured venous
drip pressure, detecting a dislodged needle, and alerting medical personnel of
the dislodged needle.
Each of the steps of this method is described above.
[0053] The detection device can be used to monitor any type of patient
blood access site for
increased blood pressure and subsequently reduced blood flow. The types of
blood access sites that can
be monitored include, but are not limited to, fistulas, grafts, catheters, or
any type of permanent blood
access port. In catheters and permanent blood access ports, the plastic
materials used to construct the
devices become coated with layers of protein and fibrous substances that
reduce the internal diameter of
the blood pathway or these devices may induce the formation of a vascular
stenosis downstream of the
implantation site. Any reduction in internal diameter of the blood pathway
that results in an increase in
13
CA 02896243 2015-06-22
WO 2014/107656 PCT/US2014/010328
pressure upstream of the catheter or permanent blood access port can be
detected by the algorithm in the
device and a warning can be issued once an appropriate alarm level is
exceeded.
[0054] Additionally, the disclosed device and method can be applied to
monitor the arterial
line supplying the dialysis machine. A significant increase in the negative
pressure created by the
dialysis machine blood pump removing blood from the patient can be used to
indicate the presence
of an arterial stenosis or an obstruction of the arterial line. Further, the
device and method can be
utilized to describe the relationship between blood flow, pressure, and
hematocrit in any type of
system that removes blood from a patient and returns the same blood to the
patient. Thus, it can be
used in conjunction with a heart-lung machine to determine alarm parameters
for blood withdrawal
and reinfusion.
[0055] The detection device can be used with intravenous infusion systems
to determine the
pressure profile for fluid infusion through a known tubing set and needle. A
significant increase in
the infusion pressure at the specified fluid viscosity and flow rate can be
used to determine alarm
conditions and prevent infusion of fluid into the tissue if the needle is not
inside the lumen of the
vein. Further, any industrial system that requires regulation of infusion
pressure can utilize the
present invention to develop a monitoring system based on the analysis of
infusion pressure.
[0056] Occasionally, when a medical professional cannulates a patient,
the needle may not
be centered in the blood vessel. Instead, the needle tip may end up against
the side of the vessel,
which results in one of the openings at the needle tip being up against the
vessel wall. This
unintended misplacement results in less blood being able either pulled into
the machine (arterial
side) or less blood able to be re-introduced into the body (venous side).
These are termed 'poor
needle sticks' or just 'bad sticks'. In order to fix the problem, the medical
professional only needs to
reposition the needle to get the tip away from the vessel wall. However, first
they must be made
aware of the problem. At present, there is no easy way for medical staff to
know there is an issue
and, as a result, the patient undergoes the dialysis session at decreased
efficiency.
[0057] Therefore, in addition to the embodiments described above, there
is a need for a
system that enables health care providers to determine the reliability and
safety of a patient's
vascular access connection to an extracorporeal circuit that is used for
therapeutic intervention, and
14
CA 02896243 2015-06-22
WO 2014/107656 PCT/US2014/010328
to prompt the modification of said connection when irregular placement of an
extracorporeal
vascular access needle is detected. Irregular access pressures can occur at
the vascular access site
where blood is removed from the access, creating high negative pressures and
low blood flow
through the extracorporeal circuit which could compromise the patient's
therapy. Irregular access
pressures that occur, due to irregular placement of a vascular access needle,
at the site where blood is
returned to the patient result in high venous return pressures in the
extracorporeal circuit and can
result in mechanical destruction of red bloods cells causing anemia in the
patient. Therefore,
extracorporeal circuits employ pressure limits that restrict the level of
venous return pressure in the
circuit. In the case where high venous return pressure is caused by irregular
placement of the access
needle, the pressure can be reduced to a normal level if the healthcare
provider identifies the
situation and repositions the venous access return needle. If the irregular
placement of the access
needle is not detected by the healthcare provider, the blood flow through the
extracorporeal circuit
will have to be reduced to comply with the limits set for the venous return
pressure, which could
compromise the patient's therapy if treatment time is not extended.
[0058] Accordingly, a detection device and method are provided for
recognizing irregular,
abnormal, or outlying intravascular pressures as an indicator of irregular
placement of an
extracorporeal vascular access needle. The device includes an analyzer for
automatically
determining intravascular pressure at the location of needle placement, and a
comparing device that
correlates the recorded intravascular pressure to a standard, whereby
variation in the expected
intravascular pressure during needle placement is indicative of irregular
placement of an
extracorporeal vascular access needle. Also disclosed is a system for
providing a warning of an
irregular placement of an extracorporeal vascular access needle that can cause
potential health
problems. Embodiments include a detecting device as set forth above and a
communicating device
operatively connected to the detecting device for communicating a warning when
the device
indicates an irregularity of intravascular pressure during the placement of
the extracorporeal vascular
access needle. Other aspects of the device and method described above for
detecting venous needle
dislodgement may also be applicable to the device and method for detecting
irregular intravascular
pressures due to needle placement.
[0059] With reference to FIG. 7, for the assessment of irregular needle
placement, the
determination of pressures above a threshold is not as relevant. Instead, the
pressures may be
CA 02896243 2015-06-22
WO 2014/107656 PCT/US2014/010328
determined over the past X trials and then a metric calculated that averages
the pressures and may
account for trends up or down over time. In one embodiment, the pressure
should be calculated as
soon as possible after the start of the session, after the patient is
cannulated and the pump started. If
that pressure is some factor Y greater than the previous "average", then a
medical professional
should be alerted to reposition the needle. In one embodiment, the factor Y
may be at least two
standard deviations above the average, although the factor is not limited to
this value. The factor
could also be adjustable, for example, the factor may be lowered following
testing to provide for
increased sensitivity of the irregular needle placement indication.
[0060] Although irregular needle placement will present as an increase in
the pressure above
the average, a decrease below the average could be due to a change in the
access site (i.e., the site
was repaired, the patient is now using a new access site, or is using a
catheter). Changes in the
patient's access site are often made without updating information in a patient
database. In one
embodiment, the warning for an irregular needle placement could include an
override for a change in
the patient's access site.
[0061] A graph of venous access pressure ratio (VAPR) versus monitoring
time is depicted
in FIG. 11, wherein a moving average of VAPR and instances of irregular or
outlying VAPR are
indicated. The embodiments disclosed herein for detection irregular placement
of an extracorporeal
vascular access needle use measurements of irregular, abnormal, or outlying
intravascular pressures
to detect irregular placement of extracorporeal access needles. The data
points marked "Poor Needle
Placement" on the graph are from individual patient treatments where the VAPR
greatly exceeded
the moving average of the VAPR. The fact that the VAPR values was very close
to the moving
average of the VAPR for the treatments before and after the single extremely
high value of VARP
indicates irregular placement of the extracorporeal vascular access needle.
[0062] FIG. 12 is a flowchart depicting an algorithm for determining
irregular needle
placement. Vascular access pressure data is input from previous dialysis
treatments, and a moving
average of venous access pressure ratios (mVAPR) is calculated. In one
embodiment, blood flow
(Qb) is greater than 200 ml/min, venous drip chamber pressure (VDP) is greater
than 110 mmHg,
and mean arterial pressure (MAP) is greater than 60 mmHg. The current VDP,
hematocrit, and
MAP are determined, and the current VAPR is calculated. If the current VAPR is
greater than a
16
CA 02896243 2015-06-22
WO 2014/107656
PCT/US2014/010328
standard VAPR, then a warning is provided that needle placement may be
irregular. If the current
VAPR is not greater than a standard VAPR, then extracorporeal treatment can
proceed. Of course,
the algorithm could also be used on the arterial side by evaluating the
arterial access pressure ratio
(AAPR). Still further, the algorithm can be used to detect the non-optimal
placement of any
catheter, and is not limited to indicating irregular placement of an access
needle.
[0063] Hemodialysis access monitoring programs that measure access flow
or intra-access
pressure have been developed for early detection of evolving stenotic lesions
(1-8). Studies have
shown that early detection of stenotic lesions followed by timely corrective
procedures reduces the
thrombosis rate and improves hemodialysis access survival (1, 3, 9, 10).
Access monitoring
programs are costly because they require equipment, personnel, data storage,
and analysis. The
method according to an embodiment includes an inexpensive technique known as
the venous access
pressure ratio test (VAPRT), and obviates these encumbrances.
[0064] During hemodialysis, blood is drawn from the vascular access
through the arterial needle
by the hemodialysis machine blood pump. After passage through the dialyzer,
the blood traverses the
venous drip chamber and returns to the access through the venous needle. The
pressure required to
infuse blood back into the access through the venous tubing and access needle
and to overcome the
pressure within the access is recorded as the venous drip chamber pressure
(VDP). One component of
VDP is the access pressure at the venous needle site (hereafter, termed
"venous access pressure" (VAP)).
Another component of VDP is the combined pressure required to overcome the
resistance to flow
through the tubing distal to the drip chamber (low) and through the venous
return needle (high). VDP is
also a function of needle size, tubing length and blood viscosity, represented
by hematocrit. If the
venous pressure within an access at the needle site is 0 mmHg, VDP can be
defined as VDP0, i.e., the
venous drip chamber pressure when the access pressure is zero. Consequently,
VDP0 can be calculated
for a given hemodialysis machine, tubing set, and needle size when the blood
flow rate and hematocrit
are measured. Once VDP0 is determined, VAP can be calculated from the measured
VDP.
[0065] VAP = VDP - VDP0
Equation (1)
[0066] An elevation of VAP indicates stenosis in the venous outflow of
the access and is
associated with increased access failure probability (6, 8, 11, 14). To
normalize variations in VAP
17
CA 02896243 2015-06-22
WO 2014/107656
PCT/US2014/010328
attributed to changes in mean arterial pressure (MAP), the venous access
pressure ratio (VAPR) is
calculated by dividing VAP by MAP.
[0067] VAPR = VAP/MAP
Equation (2)
[0068] The data that yields the determination of VDP0 is contained within
a central database
repository that holds dialysis laboratory data and parameters acquired from
hemodialysis machines
that directly communicate with computers in the dialysis units. The VAPRT
algorithm utilizes an
empirical formula to calculate VAP from a dynamic measurement of VDP obtained
at treatment and
digitally recorded. The VAPRT algorithm analyzes monthly VAPR values and
identifies individuals
with consistently elevated intra-access pressures at risk for access failure.
To eliminate treatment
errors such as needle reversal or suboptimal needle placement that cause
elevated VDP, an abnormal
VAPRT was operationally defined as VAPR>0.55 at three treatments.
[0069] Analysis of the data for the hemodialysis machine circuit yielded
the following second
order polynomial equation, henceforth referred to as Equation (3):
[0070] VDP0=0.00042 * Qb2+(0 .62116*Hct2+0 .01203 *Hct+0 .12754)Qb-17
.32509 (3)
[0071] Equation (3) can be used to calculate VDP0 for any Qb at known
Hct. For example, at
Qb=500 ml/min and Hct 18.2%, VDP0 is 163 mmHg and increases to 200 mmHg when
Hct=38.4%.
VAP can be calculated from VDP recorded at HD by Equation (1) and VAPR is
calculated by
Equation (2). At Hct 38.4%, Qb 500 ml/min, VDP 265 mmHg, VDP0 200 mmHg, and
MAP 100
mmHg, VAPR=0.65=(265-200)/100. In the case where blood flow (Qb) is equal to
zero in Equation
(3), the following occurs:
[0072] VDP0=0+0-17.32509 = 17.32509
[0073] Venous access pressure (VAP) is then calculated using Equation
(1).
[0074] VAP=VDP-VDP0 VAP=VDP +17 .32509) VAP=VDP+17 .32509
[0075] The constant (-17.32509) is determined by the dialysis machine
type and the level of
the patient's access site. Clinical studies have shown that the venous drip
chamber pressure recorded
18
CA 02896243 2015-06-22
WO 2014/107656 PCT/US2014/010328
by the machine and corrected for the height difference between the drip
chamber transducer the
patient's access gives an accurate value for venous access pressure (8, 22).
The algorithm can
therefore be incorporated into the dialysis machine. The dialysis machine
therefore automatically
records the readings. Additionally, a sensor can be placed on the hemodialysis
machine to determine
the height difference between the venous drip chamber transducer and the level
of the patient's
access site.
[0076] The VAPRT relies on a nonlinear regression formula to calculate
VDP0 for specific
hemodialysis blood tubing set and access needle when the patient's
hemodialysis blood pump flow
(Qb) and hematocrit are known. The formula was developed from data analysis
obtained during in
vitro sham hemodialysis. FIG. 1 shows a diagram of the experimental
hemodialysis system. The
dialysis machine (Fresenius 2008H, Lexington, Mass., U.S.A.) blood pump was
calibrated prior to
experiments using the standard maintenance procedure. The exact flow was not
measured during the
in vitro experiment as the intention a priori was to design a monitoring
system that utilized routine
dialysis data obtained from each dialysis treatment. The reservoir is filled
with 500 ml of human
whole blood obtained from the hospital blood bank. The blood pump transports
blood from a
reservoir through the dialyzer and the venous drip chamber and then to a 15
gauge, 1-inch backeye
access needle. The venous access needle is inserted into a section of large-
bore tubing that is open at
both ends. One end of the tubing returns blood to the reservoir and the other
end is elevated to
prevent blood from escaping. This section of the circuit is not designed to
simulate an actual access,
but to avoid any resistance to flow at the tip of the venous access needle
that can be recorded as an
increase in VDP. The access needle is positioned 17 cm below the venous drip
chamber transducer
to simulate the average location of an angioaccess relative to the transducer
during a typical
hemodialysis treatment. The drip chamber transducer monitors the pressure
created by the blood
flowing through the circuit. VDP0 readings are obtained directly from the
hemodialysis machine. A
sample of blood is obtained for hematocrit determination from the reservoir.
VDP0 is recorded as
Qb is increased from 0 to 600 ml/mm in 50 ml/mm increments. A separate
transducer, placed
directly behind the access needle, measures the pressure created by the access
needle's intrinsic
resistance. The blood is then diluted with matched human plasma to lower
hematocrit by
approximately 4%. Blood is permitted to circulate at 500 ml/mm for 5 minutes
to ensure uniform
mixing with the additional plasma before the next sample is obtained for
hematocrit measurement.
19
CA 02896243 2015-06-22
WO 2014/107656 PCT/US2014/010328
VDP0 measurements are repeated for Qb from 0 to 600 ml/mm. The circulated
blood is diluted five
times, reducing the original hematocrit by approximately 20 percentage points.
VDP0 measurements
were conducted at each of the five dilutions.
[0077] The test monitors for a persistent elevation of the VAPR to
identify an access that
requires additional evaluation. The algorithm calculates VAPR from VDP and
blood pump flow
data that is routinely collected during hemodialysis and stored in a computer
database. The
algorithm determines whether a persistent increase in VAPR is present during
sequential treatments.
[0078] To limit variability intrinsic to differences in needle gauge,
patients with less than 48
hemodialysis treatments were eliminated from analysis because a smaller gauge
needle is frequently used
when initially cannulating a new or poorly developed angioaccess. The program
extracts the most recent
hematocrit and individual treatment data from the computer database and
analyzes data for those patients
who receive treatments via a graft. The VAPR is calculated each time the blood
pressure is measured
during hemodialysis, given the following criteria: Qb>200 ml/mm, VDP>20 mmHg
and MAP>75
mmHg. Data from the last hour of hemodialysis is excluded to eliminate the
effect of ultrafiltration on
hematocrit (elevated blood viscosity), blood pressure, and changes in systemic
and vascular access
resistances. The algorithm then calculates the mean VAPR for each hemodialysis
treatment using all
available data. In the majority of cases three or four measurements are
available. Patients with <10
hemodialysis treatments during a month were excluded. The VAPRT is considered
positive when,
starting with the eighth treatment of the month; the program determines that
the VAPR exceeds the
specified cutoff value during three consecutive treatments.
[0079] The invention is further described in detail by reference to the
following experimental
examples. These examples are provided for the purpose of illustration only,
and are not intended to
be limiting unless otherwise specified. Thus, the invention should in no way
be construed as being
limited to the following examples, but rather, should be construed to
encompass any and all
variations that become evident as a result of the teaching provided herein.
[0080] EXAMPLES
[0081] Example 1
CA 02896243 2015-06-22
WO 2014/107656 PCT/US2014/010328
[0082] Criterion for the Venous Access Pressure Ratio Test
[0083] To determine the VAPR cutoff value most predictive of access
failure, test data and
follow up data were analyzed from 117 patients with grafts who received
hemodialysis treatment at
three hemodialysis facilities during January 1999. VAPR in these patients were
correlated with the
presence or development of access dysfunction, stenosis requiring intervention
by angioplasty or
surgical revision to maintain access patency, or the occurrence of thrombosis
within the six months
of follow up observation. A six month observation period was selected because
data reported
showed that primary unassisted patency for grafts at six months is 64% and
secondary assisted
patency is 70% at six months, which is in accordance with data from Sparks
(15) showing a primary
patency for grafts of 64% at a median of seven months. The data from these
studies indicates that in
any six month period 30 to 36% of all grafts can fail. The VAPRT is being used
to try and identify
grafts in this group before they fail.
[0084] A receiver operator curve (ROC) for VAPRT was constructed with
cutoff ratios of 0.2,
0.3, 0.4, 0.45, 0.5, 0.55, 0.6 and 0.8 while other test parameters were held
constant. The respective
sensitivities and specificities were calculated at each VAPR cutoff level.
Areas under the receiver
operator (ROC) curves were calculated using Mathcad Plus 6.0 (MathSoft Inc.,
Cambridge, Mass.,
U.S.A.). Clinical results were analyzed with StatView for Windows v. 5.0 (SAS
Institute, Inc., Cary,
N.C., U.S.A.) and DeltaGraph 4.0 (SPSS, Inc., Chicago, Ill., U.S.A.). Grouping
variables for unpaired t-
tests were true positive (TP; test predicted intervention or access clotting),
true negative (TN; test
correctly predicted the absence of an access event), false positive (FP; test
falsely predicted an access
event would have occurred) and false negative (FN; test falsely predicted that
an access event would not
occur). The hypothesized difference between groups for all comparisons was
zero.
[0085] Clinical Application of Venous Access Pressure Ratio Test
[0086] A total of 359 VAPRT were acquired from ESRD patients in three
Greenfield Health
System hemodialysis units over a three month interval following the
determination of the optimal
VAPR=0.55. The same population's data was retrospectively analyzed from
January (n=112),
February (n=113) and March (n=134) of 1999. Medical records were examined to
identify those
individuals who required intervention for an access event, defined as an
obviously low access flow
21
CA 02896243 2015-06-22
WO 2014/107656
PCT/US2014/010328
(<250 ml/mm), an inability to provide adequate dialysis within the
predetermined treatment time or
surgical or angioplasty intervention to maintain access patency, from stenosis
or thrombosis.
[0087] RESULTS
[0088] In vitro Modeling of VAPo
[0089] Derivation of the Mathematical Model
[0090] Results of the sham dialysis study are shown in FIG. 2.
Mathematical modeling of
VDP0 data is shown in FIG. 2. The data in FIG. 2 was analyzed by fitting each
individual curve with
an equation of the form:
[0091] VDP0=A*Qb2+B*Qb+C
Equation ( 1 a)
[0092] The constant C represents the value of VDP when Qb=0 and the
average value of -
17.325 mmHg was used during further analysis of the data. Because coefficient
A varied minimally
from 0.0004232 to 0.0004327, an increase of only 1.5 mmHg in VDPQ at Qb=400, a
mean value of
0.00042329 was used. Coefficient B varied the most with hematocrit from
0.145289 to 0.231968.
The raw data was then fit with Equation (2a).
[0093] VDP0=0.00042329*Qb2+B*Qb-17.325
Equation (2a)
[0094] B coefficients were obtained for each hematocrit value. FIG. 6
displays the plot of
Coefficient B versus hematocrit and Equation (3a) was fit to the data.
[0095] B=0.62116*Hct2+0.01203*Hct+0.12754
Equation (3a)
[0096] Equations (2a) and (3a) were combined to yield Equation (4a) that
relates VDP0 to Qb
and Hct.
[0097] VDP0=0.00042*Qb2+ (0.62116*Hct2+0.01203*Hct+0.12754)*Qb-17.32509
(4a)
[0098] Equation (4a) was evaluated for accuracy using a nonlinear
regression program
(DataFit, Oakdale Engineering, Oakdale, Pa., U.S.A.). The adjusted coefficient
of multiple
22
CA 02896243 2015-06-22
WO 2014/107656 PCT/US2014/010328
determination r2=0.99982 validated that Equation (4a) represents an accurate
mathematical model of
the pressure data for access monitoring by dynamic VAPRT.
[0099] Application of the Mathematical Model
[0100] Analysis of the experimental data for the hemodialysis machine
circuit yielded the
following second order polynomial equation, henceforth referred to as Equation
(3):
[0101] VDP0=0.00042*Qb2+ (0.62116*Hct2+0.01203*Hct+0.12754)*Qb-17.32509
(3)
[0102] The common average intercept, -17.35, was established empirically
and is related to
the 17 cm difference in height between the needle and drip chamber transducer
at Qb=0. When
pressure is measured from the transducer proximal to needle, the offset
becomes zero, and the
relationship between pressure and flow remains curvilinear (FIG. 2, venous
needle pressure at
Hct=29.1). Thus, VDP0 increases in relationship to increasing Qb and
hematocrit.
[0103] Equation (3) can be used to calculate VDP0 for any Qb at known
Hct. For example,
at Qb=500 ml/min and Hct 18.2%, VDP0 is 163 mmHg and increases to 200 mmHg
when
Hct=38.4%. VAP can be calculated from VDP recorded at HD by Equation (1) and
VAPR is
calculated by Equation (2). At Hct 38.4%, Qb 500 ml/min, VDP 265 mmHg, VDP0
200 mmHg, and
MAP 100 mmHg, VAPR=0.65=(265-200)/100. In the case where blood flow (Qb) is
equal to zero
in Equation (3), the following occurs:
[0104] VDP0=0.00042*Qb2+(0.62116*Hct2+0.01203*Hct+0.12754)*Qb-17.32509
[0105] When Qb=0 venous access pressure (VAP) is then calculated using
Equation (1).
[0106] VDP0=0+0-17.32509=-17.32509
[0107] VAP=VDP-VDP0 VAP=VDP+17.32509) VAP=VDP+17.32509
[0108] The constant -17.32509 is determined by the dialysis machine type
and the height of
the patient's access site. Clinical studies have shown that the venous drip
chamber pressure recorded
by the machine and corrected for the height difference between the drip
chamber transducer the
patient's access gives an accurate value for venous access pressure. The
algorithm can therefore be
23
CA 02896243 2015-06-22
WO 2014/107656 PCT/US2014/010328
incorporated into the dialysis machine. The dialysis machine therefore can
automatically take the
readings. Additionally, a sensor can be placed on the machine to determine the
height difference
between the venous drip chamber transducer and the level of the patient's
access site.
[0109] Receiver Operator Curve (ROC) Evaluation
[0110] Patients with grafts (N=117) included during the January 1999 test
period and whose
data were used for ROC analysis had mean treatment blood flows 438 61 ml/mm,
hematocrit
34.0 4.2% MAP 102 14 mmHg, VDP values ranging from 48 to 430 mmHg (mean 214 43
mmHg), and mean VAPR 0.64 0.35.
[0111] The receiver operator curve (ROC) is shown in FIG. 3. The area
under the curve
corresponds to the probability (0.82) of correctly ranking the two test
alternatives, persistence of
access patency or occurrence of access failure within six months (16, 17). The
VAPR cutoff of 0.55
was selected for further clinical testing as it provided a rational compromise
between sensitivity
(75%) and specificity (83%).
[0112] FIG. 4 shows the distribution of individual treatment mean VAPR
values for all
patient observations with grafts in January 1999. The monthly mean VAPR for
each patient was
calculated from the VAPR values obtained at each treatment. Patients who had a
TP test by VAPRT
had a median VAPR 0.89 (mean 0.91 0.24). This value was significantly
different from the other
three possibilities, FP, TN, and FN (Table 1). Patients with TN tests had a
median VAPR of 0.48
(mean 0.52 0.15), which differed from FP (median VAPR 0.70, mean 0.70 0.13
P<0.0001) but not
from FN (median VAPR 0.57, mean 0.62 0.23). All test groups had VAPR values
greater than 1.0,
in this case VDP-VDP0 exceeds the mean arterial pressure for the data obtained
during treatment and
can indicate a problem with needle placement or needle reversal.
[0113] Assessment of the VAPRT
[0114] FIG. 5 shows the study results of three months of VAPRT for
January, February, and
March of 1999. In January 26 out of 112 patients (23%) had a positive VAPRT.
During the next
three months, thirteen of these patients (50%) experienced access failure, by
month six the number
increased to nineteen (73%) in the positive test group. For the January test,
eight patients that tested
24
CA 02896243 2015-06-22
WO 2014/107656 PCT/US2014/010328
negative went on to experience access failure (FN, 7% of population tested).
The statistical analysis
of the VAPRT are shown in Table 2 and represent the average at three and six
months after each test.
For the three month follow-up period, the mean test sensitivity of VAPRT was
70 8% while the
specificity was 88 2%. These improved to a mean sensitivity of 74 5% and
specificity of 96 3%
for the six month follow-up period. The VAPRT positive predictive value was 84
10% and the
negative predictive value 92 3% for the six month follow-up period.
[0115] DISCUSSION
[0116] The location of an access stenosis, in part, determines the
ability of a monitoring
system to detect the lesion. In most grafts, a stenotic lesion develops in the
region of the venous
anastomosis (10, 11, 12, 13). A stenosis in this region or in the central vein
impedes blood flow
through the access and increase VAP, which is observed as an increase in VDP.
VDP measured
during treatment is the sum of three components; the pressure created by blood
flowing through the
tubing and the needle (VAN, the static pressure created by the difference in
height between the
access site and the venous pressure transducer in the dialysis machine and
VAP. VDP varies with
treatment Qb, VAP, and hematocrit. The difference in height between the access
site and the venous
pressure transducer also varies, but, in most cases, does not differ by more
than 5 cm from the value
of 17 cm used in the model. This results in a 5.1 mmHg variation in VAP and
at MAP=100 mmHg
a 0.05 variation in VAPR. VAP also varies with the MAP and changes in MAP are
reflected in
VDP. Mapping of the access pressure gradient from the arterial to the venous
anastomosis has
shown that the slope of the mid graft pressure gradient increases with the
development of a stenosis
(11). Therefore, VDP increases with increasing distance between the venous
needle and venous
anastomosis.
[0117] Initially it appears that values of VAPR exceeding 1.0 are
biologically impossible;
however, all tests groups had some VAPR values>1.0, reflecting that
physiologically calculated
VAP exceeded MAP. For the VAPR data presented in FIG. 4, 9.8% of all values
were >1.0, with
27.9% of these in the TP group. Several conditions lead to higher than
expected VAPR values.
Reversal of arterial and venous needles is probably the most common and occurs
in as many as 25%
of treatments (18). If a smaller diameter needle is used, without indicating
the change in the patient's
treatment data, the VAPR values will be falsely elevated. It can also be noted
that the small
CA 02896243 2015-06-22
WO 2014/107656 PCT/US2014/010328
diameter of the venous needle creates turbulent flow in the access that
increases resistance to flow
through the access. The degree of turbulent flow increases when access flow is
reduced due to a
venous stenosis and results in increased flow resistance and increased VAP.
Lodgment of the
venous needle against or partially in the access wall (reduces the needle
orifice) or a venous line
obstruction produces an increase in the measured VDP and results in episodic
high VAPR values.
Finally, a difference in MAP in the access extremity from that of the non-
access arm that is typically
used to monitor blood pressure during hemodialysis (19), which results in an
increase in VAPR.
[0118] To reduce errors in the VAPRT, patient VAPR values must exceed
0.55 for three
consecutive treatments. Initial dynamic access pressure testing developed by
Schwab used three
consecutive treatments that exceeded predefined limits to indicate a positive
test. Dialysis
treatments at the end of the month were selected for evaluation because the
test results were included
in a monthly dialysis patient report and patients may have had an access
intervention during the early
part of the month. The objective was to maintain a minimal false positive rate
to prevent
unnecessary further evaluation of the patient's access.
[0119] FIG. 2 illustrates the problems that must be resolved when using
dynamic
measurements of VDP to monitor access pressure. As blood flow increases VDP
increases,
primarily attributed to augmented resistance created by the venous needle.
Elevation of hematocrit
also increases VDP. The variability in VDP values from Qb and hematocrit can
be reduced if the
measurements are made at a fixed, relatively low, blood flow, as demonstrated
by Schwab et al (1).
However, the appropriate warning level for VDP varies among individuals
depending on the MAP
and hematocrit. For example, with a 15 gauge needle and Qb=200 ml/mm, VDPQ is
33 mmHg at
hematocrit 20% and 42 mmHg at hematocrit 36%. Using the criteria that a
patient is at risk when
the access pressure ratio >0.55, a patient with a MAP of 120 mmHg requires an
access pressure >66
mmHg (66/120=0.55) to receive a warning for that treatment. Therefore at
Qb=200 ml/mm, the
VDP warning level is between 99 (=33+66) mmHg and 108 (=42+66) mmHg for a
patient when
hematocrit varies between 20% and 36%. Applying the same criteria, a patient
with MAP=75
mmHg needs a VDP warning level between 74 and 83 mmHg. It then becomes
difficult to select a
single VDP warning value for patients at risk for VDP between 74 and 108 mm
Hg. By using
Equation (2) to calculate VAPR, the VAPRT adjusts the VDP warning level for
each access pressure
measurement in relationship to Qb, hematocrit and MAP. Notably, this absolute
pressure range of
26
CA 02896243 2015-06-22
WO 2014/107656 PCT/US2014/010328
74 to 108 mm Hg is significantly lower than that originally reported by Schwab
et al (1). The major
reason for this difference is needle gauge, 15 gauge for the present invention
versus 16 gauge for the
Schwab investigation. The component of VDP due to flow through the needle is
expected to be
significantly greater with a 16 gauge needle (6). Presently, the algorithm is
limited to 1 inch 15
gauge needles for cannulation until investigation of other needle gauges has
been carried out.
[0120] An alternative method of determining the VAPR is to monitor static
venous pressures
and calculate a static venous access pressure ratio (SVPR) to test for a
functionally significant
stenosis (8). SVPR is an accurate method for access monitoring, however this
method involves
training of hemodialysis staff and ongoing monitoring to ensure the validity
of the data. The
VAPRT does not require specific training and the algorithm examines data
currently entered in the
patient database and evaluates the patient's access for each dialysis
treatment. Finally another
method measures static intra-access pressures directly prior to hemodialysis
using a hydrophobic
filter (22).
[0121] A stenosis on the arterial input side of the access or within the
access itself is not detected
by the VAPRT because this type of lesion reduces access flow and venous access
pressure
simultaneously. It is feasible to detect an arterial stenosis by developing a
model that examines pre-pump
arterial drip chamber pressure (ADP) for values more negative than usual. It
is also possible to determine
the existence of intra-access lesions if arterial intra-access pressure and
VAP can be determined. In this
regard, Polaschegg and colleagues (20) described a method for detecting and
locating an access stenosis
using dynamic arterial and venous access pressure measurements.
[0122] Access flow measurements performed within the dialysis unit can
determine whether
there is a clinically significant reduction of access flow, indicating the
necessity for intervention.
However, the location of the flow obstruction cannot be definitively
identified. The disadvantages
of flow measurements are that they require costly equipment, trained personnel
and dialysis time for
setup and measurement. Studies by Paulson et al. (17, 21) indicate that a
single access flow
measurement is a relatively poor indicator of graft failure. To achieve a
sensitivity of 80% for
predicting thrombosis requires an unacceptably high FP rate of 58%. The FP
rate is so high because
the threshold access blood flows that are used to predict graft failure often
include many grafts that
27
CA 02896243 2015-06-22
WO 2014/107656 PCT/US2014/010328
function at low blood flows, on the other hand, some grafts with good flows
inexplicably thrombose
without any warning.
[0123] Analysis of the data demonstrated that at a sensitivity of 80% the
FP rate was 34% for
testing grafts. A low FP rate (20% for grafts) was maintained in order not to
produce a large number
of evaluations that results in interventions by either vascular surgeons or
interventional radiologists.
It has been suggested that trend analysis can be a better predictor of access
failure when using access
flow. Trend analysis requires more frequent flow measurements and greatly
increases the cost of
access flow measurements. The VAPRT calculates a VAPR for each dialysis
treatment, rendering it
ideal for trend analysis. The current VAPRT models the VAPR trend after the
eighth treatment of a
month. To minimize spurious alarms, a triplet rule was imposed whereby three
consecutive
treatments with VAPR>0.55 were necessary to elicit a warning of impending
graft failure, and this
rule is currently being applied to generate an end-of-month report to assist
clinicians in identifying
patients with grafts at risk for dysfunction. It is possible to improve the
VAPRT test if trend analysis
of the all data is included in the algorithm. Greater emphasis can be placed
on temporal trends or
data filters imposed to exclude clearly erroneous measurements. In addition,
analysis of data from
two or more consecutive months can increase the power to detect access
dysfunction.
[0124] The results of this study demonstrate that the VAPRT is a useful
noninvasive
screening test that identifies a population of dialysis patients that is at
risk for access failure. The
key component in implementing this system is computer access to the required
treatment and
laboratory data. The software algorithm to analyze hemodialysis data is
incorporated as a standard
end-of-month report and as an Internet-based accessible vascular access
monitoring system. All
patients exhibiting a warning status are flagged and a database trigger is
available on-demand to
create a report for any location or time period. Access intervention can be
tracked along with
warning status, thus permitting immediate follow-up and timely cost-saving
interventions.
[0125] Example 2
[0126] An alternative method is provided for measuring access pressure
through an access
needle that is flow-connected to the vascular system of a patient. The method
comprises the steps
of: connecting one end of pressure tubing to the outer end of the access
needle tubing, with a
28
CA 02896243 2015-06-22
WO 2014/107656 PCT/US2014/010328
membrane blocking the flow of blood while permitting the passage of air
through to a pressure
gauge. The membrane suppresses or dampens the pressure pulses or oscillations
through the tubing.
Thus, upon opening the access needle tubing to the vascular system, blood
flowing into the tubing
compresses the air in the pressure tubing, plus the connected gauge, causing
pressure from the
vascular system to be readable by the gauge while the pressure pulses are
attenuated in a simple,
nonelectronic manner.
[0127] The "membrane" mentioned above may be a microporous membrane,
typically a
microporous block or plug positioned within or adjacent to the pressure tubing
and capable of
providing the damping or attenuation of the pulsatile nature of the pressure
from the patient's
cardiovascular system at the gauge.
[0128] According to an aspect of the present invention, the internal
volume of the pressure
tubing is less than the internal volume of the access needle tubing. As the
result of this, pressurized
blood entering the empty access needle tubing as the pressure is read does not
advance completely to
the level of the membrane, but is halted by compression of the initial air in
the tubing, as well as the
residual volume of air within the pressure gauge. This can be accomplished by
providing pressure
tubing that has a connector at each end, the tubing having a single lumen of
reduced diameter from
normal flexible tubing, which lumen diameter is typically no more than about
one third of the outer
diameter of the tubing. Thus, the internal volume of the pressure tubing can
be less than the internal
volume of the first tube even if the length of the pressure tubing is greater
than the length of the first
tube, this situation is preferred so that there is adequate tube length to
conveniently hold a pressure
gauge and to position it at approximately the level of the patient's heart and
to read it with ease, and
also to reduce the chance that the access needle connection to the patient's
access is disturbed as the
pressure gauge is connected and handled.
[0129] The set that defines the pressure tubing may carry a microporous
member that is
capable of preventing the passage of bacteria therethrough. This can be a
second microporous
member if desired, above and beyond the microporous plug described above that
suppresses pressure
oscillations through the pressure tubing, thus attenuating the pressure
pulses. A conventional 0.2
micron bacterial filter can be used. This uniquely provides both flow blocking
and aseptic conditions
with commercially available materials.
29
CA 02896243 2015-06-22
WO 2014/107656 PCT/US2014/010328
[0130] Alternatively, the microporous member can be a plug that has a
bacteria blocking
capability similar to conventional 0.2 micron bacterial filters. Also, a
membrane-type bacterial filter
can have pores that are small enough to provide the desired attenuation of
pressure pulses through
the pressure tubing, to facilitate reading of the gauge.
[0131] Also, if desired, the pressure tubing can have a bore that is
sufficiently narrow and of
a length to provide the desired pressure pulse attenuation through the tubing
without the need for a
porous plug so that, typically, only a bacteria blocking filter membrane is
provided, as needed, to
protect the patient from bacterial contamination through connection to a
nonsterile pressure gauge.
[0132] Further development of the device includes replacement of the
pressure gauge with a
handheld microprocessor controlled device that measures and records the
pressure measurements.
An algorithm in the device calculates the average pressure over a
predetermined sampling period.
The device also contains a computer database to recall individual patient
information and to record
current pressure measurements in the patient's database record. Data from the
device can be
transferred via a communication port to a larger computer system with a more
extensive patient
database.
[0133] Example 3
[0134] This example demonstrates the case where blood flow (Qb) is equal
to zero in
Equation (3). The constant term (-17.32509 in Equation (3)) needed to correct
for the difference in
height between the venous drip chamber and the level of the patient's access
site was calculated for
three different dialysis machines and clinical data was evaluated to
demonstrate the effectiveness of
the system.
[0135] The measurement of venous intra-access pressure (VAP) normalized
by mean arterial
blood pressure (MAP) facilitates detect venous outlet stenosis and correlates
with access blood flow.
General use of VAP/MAP is limited by time and special equipment costs.
Bernoulli's equation
relates differences between VAP (recorded by an external transducer as PT) and
the venous drip
CA 02896243 2015-06-22
WO 2014/107656 PCT/US2014/010328
chamber pressure (VDP) at zero blood pump flow, the difference in height (AH)
between the
measuring sites and fluid density determine the pressure due to the difference
in height APH-VAP-
VDP. They were therefore correlated VDP and PT measurements at six different
dialysis units each
using one of three different dialysis machines. Both dynamic (i.e. with blood
flow) pressures and
static pressures were measured. Validation studies showed that changes in mean
blood pressure,
zero calibration errors, and hydrostatic height between the transducer and
drip chamber accounted
for 90% of the variance in VDP with APH=-1.6+0.74*AH (r=0.88, p<0.001). The
major
determinant of static VAP/MAP was access type and venous outflow problems. In
grafts, flow
averaged 555 45 mL/min for VAP/MAP>0.5 and 1229 112 mL/min for VAP/MAP<0.5.
APH
varied from 9.4 to 17.4 mm Hg among the six centers and was related to AH
between the drip
chamber and the arm rest of the dialysis chair. Concordance between the values
of VAP/MAP
calculated from PT and from VDP+PH was excellent. It was concluded that static
VDP
measurements corrected by an appropriate APH can be used to prospectively
monitor prosthetic
bridge grafts for stenosis.
[0136] Throughout this application, various publications, including
United States patents, are
referenced by author and year and patents by number. Full citations for the
publications are listed below.
The disclosures of these publications and patents in their entireties are
hereby incorporated by reference
into this application in order to more fully describe the state of the art to
which this invention pertains.
[0137] While exemplary embodiments are described above, it is not
intended that these
embodiments describe all possible forms of the invention. Rather, the words
used in the
specification are words of description rather than limitation, and it is
understood that various
changes may be made without departing from the spirit and scope of the
invention. Additionally, the
features of various implementing embodiments may be combined to form further
embodiments of
the invention.
31
CA 02896243 2015-06-22
WO 2014/107656
PCT/US2014/010328
TABLE 1
Comparison of Monthly Mean Graft VAPR Values for the Different Test Groups
Count Mean Std. Dev. Std. Err
True Positive 27 0.909 0.237 0.046
True Negative 67 0.515 0.149 0.018
False Negative 9 0.616 0.215 0.072
False Positive 14 0.698 0.125 0.033
Mean Difference p-Value
True Positive, True Negative 0.394 <0.0001
True Positive, False Negative 0.293 0.0024
True Positive, False Positive 0.211 0.0036
True Negative, False Positive -0.183 <0.0001
True Negative, False Negative -0.102 0.0734
False Positive, False Negative 0.082 0.2595
32
CA 02896243 2015-06-22
WO 2014/107656
PCT/US2014/010328
TABLE 2
Statistical Analysis of Venous Access Pressure Ratio Test for Grafts
Showing Mean Values for Three Months of Testing
Test Period
0 ¨ 3 mo 0 ¨ 6 mo
Sensitivity (%) 70 8 74 5
Specificity (%) 88 2 96 3
Positive Predictive Value (%) 52 10 84 10
Negative Predictive Value (%) 94 2 92 3
False Positive rate N 12 2 4 3
33
CA 02896243 2015-06-22
WO 2014/107656 PCT/US2014/010328
References
1. Schwab SJ, Raymond FR, Saeed M, Newman GE, Dennis PA, Bollinger RR:
Prevention of
hemodialysis fistula thrombosis. Early detection of venous stenosis. Kidney
lnt 36:707-711, 1989.
2. Strauch BS, O'Connell RS, Geoly KL: Forecasting thromboses of vascular
access with Doppler
color flow imaging. Am J Kidney Dis 19:554-557, 1992.
3. Levy SS, Sherman RA, Nosher JL: Value of clinical screening or detection
of asymptomatic
hemodialysis vascular access stenoses. Angiology 43:421-424, 1992.
4. Van Stone JC, Jones M, Van Stone J: Detection of hemodialysis access
outlet stenosis by
measuring outlet resistance. Am J Kidney Dis 23:562-568, 1994.
5. Rehman SU, Pupim LB, Shyr Y, Hakim R, lkizler TA: lntradialytic serial
vascular access flow
measurements. Am J Kidney Dis 34:471-477, 1999.
6. Besarab A, Sullivan KL, Ross R, Moritz M: The utility of intra-access
monitoring in detecting
and correcting venous outlet stenoses prior to thrombosis. Kidney int. 47:1364-
1373, 1995.
7. Koksoy C, Kuzu A, Erden I, Turkcapar AG, Duzgun I, Anadol E: Predictive
value of color
Doppler ultrasonography in detecting failure of vascular access grafts. Brit J
Surg 82:50-55, 1995.
8. Besarab A, Al-Saghir F, Alnabhan N, Lubkowski T, Frinak S: Simplified
measurement of intra-
access pressure. ASAIO J 42:M682-M687, 1996.
9. Sands JJ, Miranda CL: Prolongation of hemodialysis access survival with
elective revision. Clin
Nephrol 44:334-337, 1995.
10. Palder SB, Kirkman RL, Whittemore AD, Hakim RM, Lazarus JM, Tilney NL:
Vascular access
for hemodialysis. Patency rates and results of revision. Ann Surg. 202:235-
239, 1985.
34
CA 02896243 2015-06-22
WO 2014/107656 PCT/US2014/010328
11. Sullivan KL, Besarab A, Bonn J, Shapiro MJ, Gardiner GA, Moritz MJ:
Hemodynamics of
failing dialysis grafts. Radiology 186:867-872, 1993.
12. Beathard GA, Percutaneous transvenous angioplasty in the treatment of
vascular access stenosis.
Kidney International. 42(6):1390-7, 1992.
13. Kanterman RY, Vesely TM, Pilgram TK, Guy BW, Windus DW, Picus D:
Dialysis access
grafts: anatomic location of venous stenosis and results of angioplasty.
Radiology. 195(1):135-9, 1995.
14. Besarab A, Dorrell 5, Moritz M, Michael H, Sullivan K: Determinants of
measured dialysis
venous pressure and its relationship to true intra-access venous pressure.
Trans Am Soc Artif Intern
Organs 37:M270-M271, 1991.
15. Sparks SR, VanderLinden JL, Gnanadev DA, Smith JW, Bunt TJ: Superior
patency of
perforating antecubital vein arteriovenous fistulae for hemodialysis. Annals
of Vascular Surgery.
11(2):165-7, 1997.
16. Metz CE: Basic principles of ROC analysis. Semin Nuclear Med. 8:283-98,
1978.
17. Paulson WD, Ram SJ, Birk CG, Work J: Does blood flow accurately predict
thrombosis or
failure of hemodialysis synthetic grafts? A meta-analysis. Am J Kidney Dis
34(3):478-85, 1999.
18. Shapiro W, Gurevich L: Inadvertent reversal of hemodialysis lines ¨ A
possible cause of
decreased hemodialysis efficiency. [Abstract] J Am Soc Nephrol 8:172A, 1997.
19. Besarab A, Lubkowski T, Yu A, Frinak S. Determinants of vascular access
flow. ASAIO J
47(5):501-506, 2001.
20. Polaschegg HD, Techert F, Wizemann V: Dynamic pressure measurement for
detection of blood
access stenosis. Edtna-Erca J 24(4):39-44, 1998.
CA 02896243 2015-06-22
WO 2014/107656 PCT/US2014/010328
21. Paulson WD, Ram SJ, Birk CG, Zapczynski M, Martin SR, Work J: Accuracy
of decrease in
blood flow in predicting hemodialysis graft thrombosis. Am J Kidney Dis 35(6):
1089-1095, 2000.
22. Besarab A, Lubkowski T, Frinak 5: A simpler method for measuring intra-
access pressure. J Am
Soc Nephrol. 11 :202A, 1999.
36