Note: Descriptions are shown in the official language in which they were submitted.
CA 02900607 2016-12-20
DESCRIPTOR-BASED METHODS OF ELECTROCHEMICALLY MEASURING AN
ANALYTE AS WELL AS DEVICES, APPARATUSES AND SYSTEMS
INCOPORATING THE SAME
TECHNICAL FIELD
This disclosure relates generally to mathematics and medicine, and more
particularly, it relates to methods of electrochemically measuring an analyte
in a fluidic
sample based upon an algorithm incorporating across- and within-pulse
descriptors
derived from AC and/or DC response information of an electrical test sequence.
BACKGROUND
Significant benefits can be realized from electrochemically measuring analytes
in fluidic samples (i.e., biological or environmental). For example,
individuals with
diabetes can benefit from measuring glucose. Those potentially at-risk for
heart
disease can benefit from measuring cholesterols and triglycerides among other
analytes. These are but a few examples of the benefits of measuring analytes
in
biological samples. Advancements in the medical sciences are identifying a
growing
number of analytes that can be electrochemically analyzed by, for example,
determining analyte concentrations in a fluidic sample.
The accuracy of current methods of electrochemically measuring analytes
such as glucose can be negatively affected by a number of confounding
variables
including variations in reagent thickness, wetting of the reagent, rate of
sample
diffusion, hematocrit (Hct), temperature, salt and other confounding
variables. These
confounding variables can cause an increase or decrease in an observed
magnitude
of, for example, a current that is proportional to glucose, thereby causing a
deviation
from the "true" glucose concentration.
Current methods and systems provide some advantages with respect to
convenience; however, there remains a need for new methods of
electrochemically
measuring an analyte in a fluid sample even in the presence of confounding
variables.
1
CA 02900607 2016-12-20
BRIEF SUMMARY
In view of the disadvantages noted above, the disclosure describes methods
of electrochemically measuring an analyte in a fluidic sample such as a body
fluid.
The methods are based upon an inventive concept that includes building within-
and
across-pulse descriptors derived from information obtained from an electrical
test
sequence having at least one DC block, where the at least one DC block
includes a
sequence of at least one excitation potential and at least one recovery
potential under
a closed circuit. For example, information such as current response, shape
and/or
magnitude of the excitation pulses and/or recovery pulses can be used to
determine
the effects of Hct, salt concentration and/or temperature on the analyte
concentration.
This information can be built into descriptors for use in algorithms for
determining an
analyte concentration such as a glucose concentration. The inventive concept
therefore provides certain advantages, effects, features and objects when
compared
to known methods of measuring an analyte concentration (or value) in a fluidic
sample.
In one aspect, an electrochemical analysis method is provided for measuring,
determining, calculating or otherwise predicting an analyte concentration in a
fluidic
sample that has been applied to an electrochemical biosensor. The method can
include at least a step of providing a test sequence of at least one DC block
to the
fluidic sample, where the test block is designed to elicit specific
information about Hct,
salt concentration and/or temperature effects, where the DC block includes at
least
one excitation potential and at least one recovery potential, and where a
closed circuit
condition of an electrode system of the biosensor is maintained during the DC
block.
The method also can include a step of measuring response information to the
test
sequence or obtaining response information therefrom.
In some instances, the at least one DC block is pulsed as a continuous,
unipolar excitation waveform (i.e., the potential is applied and controlled
throughout
the DC block in a closed circuit), which is in contrast to some pulsed
amperometric
methods that employ an open circuit between excitation pulses. The DC block
includes a plurality of short-duration excitation pulses and recovery pulses
optimized
for detecting an analyte such as glucose, the optimization pertaining to pulse
duration,
ramped transitions between the excitation pulse and recovery pulse, number of
current responses measured during each pulse, and where in each pulse current
2
CA 02900607 2016-12-20
response measurements are taken. The DC block can be from at least one (1)
pulse
to about ten (10) pulses at a potential that alternates between about 0 mV to
about
+450 mV in a closed circuit. Each of the DC pulses can be applied for about 50
msec
to about 500 msec. Moreover, the ramp rate can be from about 10 mV/msec to
about
50 mV/msec.
In some instances, the test sequence also can include at least one AC block.
In other instances, the test sequence also can include a second DC block. In
still
other instances, the test sequence includes both the at least one AC block and
the
second DC block.
In addition, the method can include a step of building at least one within-
pulse
descriptor and/or at least one across-pulse descriptor that is based upon
response
currents to the excitation and/or recovery potentials of the DC block to
correct and/or
compensate for Hct, salt concentration and/or temperature effects on the
analyte
concentration. The descriptors encode magnitude and shape information of
current
responses to the test sequence.
Advantageously, by using and applying the descriptors, analyte concentration
varies only by 10% or less for sample Hct varying from about 20% to about
70%,
sample salt varying from about 140 mg/dL to about 180 mg/dL, and/or sample
temperatures varying from about 6 C to about 44 C.
In view of the foregoing, devices, apparatuses and systems used in
connection with electrochemical analysis are provided that incorporate one or
more of
the descriptor-based measurement methods disclosed herein. These devices,
apparatuses and systems can be used to determine concentration of analytes
including, but not limited to, amino acids, antibodies, bacteria,
carbohydrates, drugs,
lipids, markers, nucleic acids, peptides, proteins, toxins, viruses and other
analytes, as
well as combinations thereof. In certain instances, the analyte is glucose.
In certain embodiments of the invention described herein, there is provided a
method of electrochemically measuring an analyte in a fluid sample, the method
comprising the steps of:
applying an electrical test sequence to an electrochemical biosensor, the
biosensor comprising:
3
CA 02900607 2016-12-20
an electrode system,
a reagent in electrical communication with the electrode system, and
a receptacle configured to contact the fluid sample provided to the
biosensor,
with the fluid sample in fluidic contact with the reagent, wherein the test
sequence
comprises at least one DC block, the at least one DC block includes at least
one
excitation potential pulse and at least one recovery potential pulse, each
potential
configured to produce response information to the test sequence, and wherein a
closed circuit condition of the electrode system is maintained during the at
least one
DC block;
measuring the response information from the test sequence; and
building descriptors encoding magnitude and shape characteristics of the
response to the test sequence; and
determining an analyte concentration of the fluid sample based upon the
descriptors.
In this method the descriptors may encode transformed slope information and
transformed intercept information of the excitation current response
information and
the transformed recovery current response information.
In further embodiments of the method, the transformed slope information and
the transformed intercept information may pertain to an x-y coordinate system,
wherein x = In(time) and y = In(current). In this embodiment, the determining
the
analyte concentration step, may comprise determining an effective current. For
example, the effective current may be determined in accordance with the
following
equation:
i=1\I
Ieff = (Ci,m *p r Co * Po )
i= 1
wherein leff designates the effective current, i designates a pulse number in
the test
sequence of potential pulses, N designates a total number of pulses in the
test
sequence, Poi designates a slope of two current measurement points within
pulse i,
Po designates an intercept of two current measurement points within pulse i,
and c,,m
and ci,b designate weighting constants. In a further embodiment of this
example, N = 9
4
CA 02900607 2016-12-20
and pulses i = 1, 3, 5, 7, and 9 comprise excitation potentials. In yet
another
embodiment, the analyte concentration may be a glucose concentration and the
fluid
sample is blood.
In further embodiments, the analyte concentration may vary by +/- 10% or less
for
sample hematocrit varying from about 20% to about 70%.
In further embodiments, the analyte concentration may vary by +/- 10% or less
for
sample salt varying from about 140 mg/dL to about 180 mg/dL.
In further embodiments, the analyte concentration may vary by +/- 10% or less
for
sample temperatures varying from about 6 C to about 44 C.
In further embodiments, the analyte concentration may vary by +/- 10% or less
for
sample hematocrit varying from about 20% to about 70%, sample salt varying
from
about 140 mg/dL to about 180 mg/dL, and sample temperatures varying from about
6 C to about 44 C.
In further embodiments of the method, the magnitude and shape of the
excitation
current response information and the response current response information may
be
defined by points in an x-y space, wherein x = In(time) and y = In(current).
In further embodiments of the method, the test sequence may further comprise
an
alternating current (AC) block.
In further embodiments of the method, the analyte concentration may be a
glucose
concentration, wherein the glucose concentration is determined in accordance
with the
following equation:
Predglu = a0 + (b0 + exp(b1+ b2leff + Peff Yeff))*(leff),
wherein a0, b0, b1, and b2 are constants, Peff is an effective phase and Yeff
is an
effective admittance. In this embodiment, Peff may be determined in accordance
with
the equation:
Peff = bp2*(p11*cos(a) + p12*sin(a)) + bp3*(-p11*sin(a) + p12*cos(a)),
5
CA 02900607 2016-12-20
wherein a = arctan(1), p11 is a 20 kHz AC phase, p12 is a 10 kHz AC phase, and
bp2
and bp3 are weighting terms. In this embodiment, Ye may be determined in
accordance with the equation:
Yeff = by2*(y11*cos(a) + y12*sin(a)) + by3*(-y11*sin(a) + y12*cos(a)),
wherein a = arctan(1), y11 is a 20 kHz AC admittance, y12 is a 10 kHz AC
admittance,
and by2 and by3 are weighting terms.
There is also provided an analyte concentration measuring device configured to
perform the method of any of the above embodiments. For example, the device
may
be a blood glucose meter.
There is also provided an analyte concentration determining system configured
to perform the method of any of the above embodiments. For example, the system
may be a self-monitoring blood glucose (SMBG) system.
Also provided herein is a method of electrochemically measuring an analyte in
a fluid sample, the method comprising the steps of:
applying an electrical test sequence to an electrochemical biosensor, the
biosensor comprising:
an electrode system,
a reagent in electrical communication with the electrode system, and
a receptacle configured to contact the fluid sample provided to the
biosensor,
with the fluid sample in fluidic contact with the reagent, wherein the test
sequence
comprises at least one DC block, the at least one DC block includes at least
one
excitation potential pulse and at least one recovery potential pulse, each
potential
configured to produce response information to the test sequence, and wherein a
closed circuit condition of the electrode system is maintained during the at
least one
DC block;
measuring the response information from the test sequence; and
determining an analyte concentration of the analyte based at least in part
upon
transformed excitation current response information and transformed recovery
current
response information.
6
CA 02900607 2016-12-20
The above method may, in an embodiment, further comprise the step of
transforming the excitation current response information and the recovery
current
response information from a first x-y space, where x = time and y = current to
a
second x-y space where x = In(time) and y = In(current).
In the above method, the determining the analyte concentration step may use
descriptors encoding magnitude and shape characteristics of the transformed
excitation current response information and the transformed recovery current
response information.
In the above method, the determining the analyte concentration step may be
based upon an effective current determined based upon the transformed
excitation
current response information and the transformed recovery current response
information.
In the above method, the analyte concentration may be a predicted glucose
concentration, Predglu, determined in accordance with the equation:
Predglu = a0 + (b0 + exp(b1 + b2leff + Peff Yeff))*(leff),
where a0, b0, b1, and b2 are constants, Peff is an effective phase and Yeff is
an
effective admittance, wherein Peff is determined in accordance with the
equation:
Peff = bp2*(p11*cos(a) + p12*sin(a)) + bp3*(-p11*sin(a) + p12*cos(a)),
where a = arctan(1), p11 is a 20 kHz AC phase, p12 is a 10 kHz AC phase, and
bp2
and bp3 are weighting terms, and wherein Yeff is determined in accordance with
the
equation:
Yeff = by2*(y11*cos(a) + y12*sin(a)) + by3*(-y11*sin(a) + y12*cos(a)),
where a = arctan(1), y11 is a 20 kHz AC admittance, y12 is a 10 kHz AC
admittance,
and by2 and by3 are weighting terms.
In the above method, 95% of analyte concentrations may fall within 10 mg/dl
of a reference at concentrations less than about 75 mg/dL, and 95% of analyte
concentrations may fall within 10% of the reference at concentrations
greater than or
equal to about 75 mg/dL.
7
CA 02900607 2016-12-20
In the above method, the analyte concentration may be a standard deviation of
normalized error (SDNE) of 5% or less.
In the above method, the analyte concentration may have a total system error
(TSE) of 10% or less.
There is also provided an analyte concentration measuring device configured to
perform the above method. In one embodiment, the device may be a blood glucose
meter.
There is also provided an analyte concentration determining system configured
to perform the above method. In an embodiment, the system is a self-monitoring
blood glucose (SMBG) system.
These and other advantages, effects, features and objects of the inventive
concept will become better understood from the description that follows. In
the
description, reference is made to the accompanying drawings, which form a part
hereof and in which there is shown by way of illustration, not limitation,
embodiments
of the inventive concept.
BRIEF DESCRIPTION OF THE DRAWINGS
The advantages, effects, features and objects other than those set forth above
will become more readily apparent when consideration is given to the detailed
description below. Such detailed description makes reference to the following
drawings, wherein:
FIG. 1 shows an exemplary analyte test system comprising a meter and a
biosensor.
FIG. 2 shows a simplified circuit diagram for an exemplary analyte
measurement system.
FIG. 3 is a graph of an exemplary test sequence of an analyte measurement
system.
8
CA 02900607 2016-12-20
FIG. 4 is a graph of an exemplary response of an analyte measurement
system to the test sequence of FIG. 3.
FIG. 5 is an enlarged view illustrating portions of the test sequence of FIG.
3
and the response of FIG. 4.
FIG. 6 is a graph illustrating current responses for test samples with varying
Hct concentrations, constant temperatures, and constant glucose
concentrations.
FIG. 7 is a graph illustrating current responses for test samples with varying
temperatures, constant Hct concentrations and constant glucose concentrations.
FIG. 8 is a graph illustrating recovery current response information for test
samples with varying temperatures and varying Hct concentrations.
FIG. 9 is a graph illustrating excitation current response information for
test
samples with varying temperatures and varying Hct concentrations.
FIG. 10 is a flow diagram illustrating an exemplary method.
While the inventive concept is susceptible to various modifications and
alternative forms, exemplary embodiments thereof are shown by way of example
in
the drawings and are herein described in detail. It should be understood,
however,
that the description of exemplary embodiments that follows is not intended to
limit the
inventive concept to the particular forms disclosed, but on the contrary, the
intention is
to cover all advantages, effects, features and objects falling within the
spirit and scope
thereof as defined by the embodiments above and the claims below. Reference
should therefore be made to the embodiments above and claims below for
interpreting
the scope of the inventive concept. As such, it should be noted that the
embodiments
described herein may have advantages, effects, features and objects useful in
solving
other problems.
DESCRIPTION OF PREFERRED EMBODIMENTS
The methods, devices, apparatuses and systems now will be described more
fully hereinafter with reference to the accompanying drawings, in which some,
but not
all embodiments of the inventive concept are shown. Indeed, the methods,
devices,
apparatuses and systems may be embodied in many different forms and should not
be construed as limited to the embodiments set forth herein; rather, these
9
CA 02900607 2016-12-20
embodiments are provided so that this disclosure will satisfy applicable legal
requirements.
Likewise, many modifications and other embodiments of the methods,
devices, apparatuses and systems described herein will come to mind to one of
skill in
the art to which the disclosure pertains having the benefit of the teachings
presented
in the foregoing descriptions and the associated drawings. Therefore, it is to
be
understood that the methods, devices, apparatuses and systems are not to be
limited
to the specific embodiments disclosed and that modifications and other
embodiments
are intended to be included within the scope of the appended claims. Although
specific terms are employed herein, they are used in a generic and descriptive
sense
only and not for purposes of limitation.
Unless defined otherwise, all technical and scientific terms used herein have
the same meaning as commonly understood by one of skill in the art to which
the
disclosure pertains. Although any methods and materials similar to or
equivalent to
those described herein can be used in the practice or testing of the methods,
devices,
apparatuses and systems, the preferred methods and materials are described
herein.
Moreover, reference to an element by the indefinite article "a" or "an" does
not
exclude the possibility that more than one element is present, unless the
context
clearly requires that there be one and only one element. The indefinite
article "a" or
"an" thus usually means "at least one."
Overview
Analyte measurement methods are disclosed herein that use information
derived from DC current responses to provide an analyte concentration in a
reliable
manner. These measurement methods also can be used to reduce the effects of
confounding variables such as Hct, salt concentration, temperature and/or
variations
in reagent thickness, thereby providing a more "true" analyte concentration.
The measurement methods disclosed herein largely utilize amperometry;
however, it is contemplated that the methods can be used with other
electrochemical
measurement methods (e.g., coulometry, potentiomerty or voltammetry).
Additional
details regarding exemplary electrochemical measurement methods are disclosed
in,
for example, US Patent Nos. 4,008,448; 4,225,410; 4,233,029; 4,323,536;
4,891,319;
CA 02900607 2016-12-20
4,919,770; 4,963,814; 4,999,582; 4,999,632; 5,053,199; 5,108,564; 5,120,420;
5,122,244; 5,128,015; 5,243,516; 5,288,636; 5,352,351; 5,366,609; 5,385,846;
5,405,511; 5,413,690; 5,437,999; 5,438,271; 5,508,171; 5,526,111; 5,627,075;
5,628,890; 5,682,884; 5,727,548; 5,762,770; 5,858,691; 5,997,817; 6,004,441;
6,054,039; 6254736; 6,270,637; 6,645,368; 6,662,439; 7,073,246; 7,018,843;
7,018,848; 7,045,054; 7,115,362; 7,276,146; 7,276,147; 7,335,286; 7,338,639;
7,386,937; 7,390,667; 7,407,811; 7,429,865; 7,452,457; 7,488,601; 7,494,816;
7,545,148; 7,556,723; 7,569,126; 7,597,793; 7,638,033; 7,731,835; 7,751,864;
7,977,112; 7,981,363; 8,148,164; 8,298,828; 8,329,026; 8,377,707; and
8,420,404, as
well as RE36268, RE42560, RE42924 and RE42953.
Advantageously, the methods described herein can be incorporated into
SMBG devices, apparatuses and systems to more accurately and quickly report an
analyte concentration, such as a glucose concentration, especially a blood
glucose
concentration.
Moreover, the measurement methods can be implemented using advanced
microprocessor-based algorithms and processes that result in dramatically
improved
system performance. These measurement methods also offer flexibility and
number
of ways to create algorithms that can achieve improved performance such as
10/10
performance. As used herein, "10/10 performance" means that a measured bG
value
is within about 10% of the actual bG value for bG concentrations >100 mg/dL,
and
within 10 mg/dL of the actual bG value for bG concentrations <100 mg/dL.
Details regarding additional electrochemical measurement methods that may
be useful in performing the methods disclosed herein can be found in the
following co-
filed and co-pending patent applications titled: "METHODS OF SCALING DATA
USED TO CONSTRUCT BIOSENSOR ALGORITHMS AS WELL AS DEVICES,
APPARATUSES AND SYSTEMS INCORPORATING THE SAME" Applicant Docket
No. 31518; "METHODS OF ELECTROCHEMICALLY MEASURING AN ANALYTE
WITH A TEST SEQUENCE HAVING A PULSED DC BLOCK AS WELL AS DEVICES,
APPARATUSES AND SYSTEMS INCORPORATING THE SAME" Docket Nos. 31519
and 31521; "METHODS OF FAILSAFING ELECTROCHEMICAL MEASUREMENTS
OF AN ANALYTE AS WELL AS DEVICES, APPARATUSES AND SYSTEMS
INCORPORATING THE SAME" Docket No. 31520; "METHODS OF USING
INFORMATION FROM RECOVERY PULSES IN ELECTROCHEMICAL ANALYTE
11
CA 02900607 2016-12-20
MEASUREMENTS AS WELL AS DEVICES, APPARATUSES AND SYSTEMS
INCORPORATING THE SAME" Docket No. 31522; and "METHODS OF DETECTING
HIGH ANTIOXIDANT LEVELS DURING ELECTROCHEMICAL MEASUREMENTS
AND FAILSAFING AN ANALYTE CONCENTRATION THEREFROM AS WELL AS
DEVICES, APPARATUSES AND SYSTEMS INCORPORTING THE SAME" Docket
No. 31524.
Analyte Measurement Devices, Apparatuses and Systems
Prior to, and in connection with, describing the inventive measurement
methods, FIG. 1 shows an exemplary analyte measurement system including a
device
such as a test meter 11 operatively coupled with an electrochemical biosensor
20
(also known as a test element). Meter 11 and biosensor 20 are operable to
determine
concentration of one or more analytes in a fluidic sample provided to the
biosensor 20.
In some instances, the sample may be a body fluid sample such as, for example,
whole blood, plasma, serum, urine or saliva. In other instances, the fluidic
sample
may be another type of sample to be tested for the presence or concentration
of one
or more electrochemically reactive analyte(s) such as an aqueous environmental
sample.
In FIG. 1, the biosensor 20 is a single use test strip removably inserted into
a
connection terminal 14 of meter 11. In some instances, biosensor 20 is
configured as
a blood glucose test element and includes features and functionalities for
electrochemically measuring glucose. In other instances, biosensor 20 is
configured
to electrochemically measure one or more other analytes such as, for example,
amino
acids, antibodies, bacteria, carbohydrates, drugs, lipids, markers, nucleic
acids,
peptides, proteins, toxins, viruses, and other analytes.
Meter 11 includes an electronic display 16 that is used to display various
types
of information to the user including analyte concentration(s) or other test
results, and
user interface 50 for receiving user input. Meter 11 further includes a
microcontroller
and associated test signal generating and measuring circuitry (not shown) that
are
operable to generate a test signal, to apply the signal to the biosensor 20,
and to
measure one or more responses of the biosensor 20 to the test signal. In some
instances, meter 11 can be configured as a blood glucose measurement meter and
includes features and functionalities of the ACCU-CHEK AVIVA meter as
12
CA 02900607 2016-12-20
described in the booklet "Accu-Cheke Aviva Blood Glucose Meter Owner's
Booklet"
(2007), portions of which are disclosed in US Patent No. 6,645,368. In other
instances, meter 11 can be configured to electrochemically measure one or more
other analytes such as, for example, amino acids, antibodies, bacteria,
carbohydrates,
drugs, lipids, markers, nucleic acids, proteins, peptides, toxins, viruses,
and other
analytes. Additional details regarding exemplary meters configured for use
with
electrochemical measurement methods are disclosed in, for example, US Patent
Nos.
4,720,372; 4,963,814; 4,999,582; 4,999,632; 5,243,516; 5,282,950; 5,366,609;
5,371,687; 5,379,214; 5,405,511; 5,438,271; 5,594,906; 6,134,504; 6,144,922;
6,413,213; 6,425,863; 6,635,167; 6,645,368; 6,787,109; 6,927,749; 6,945,955;
7,208,119; 7,291,107; 7,347,973; 7,569,126; 7,601,299; 7,638,095 and
8,431,408.
One of skill in the art understands that the measurement methods described
herein can be used in other measurement, devices, apparatuses, systems and
environments such as, for example, hospital test systems, laboratory test
systems and
others.
It shall be understood that the meter and biosensor can include additional
and/or alternate attributes and features in addition to or instead of those
shown in FIG.
1. For example, the biosensor can be in the form of a single use, disposable
electrochemical test strip having a substantially rectangular shape. It shall
be
appreciated that the biosensors can include different forms such as, for
example, test
strips of different configurations, dimensions or shapes, non-strip test
elements,
disposable test elements, reusable test elements, micro-arrays, lab-on-chip
devices,
bio-chips, bio-discs, bio-cds or other test elements. Additional details
regarding
exemplary biosensors configured for use with electrochemical measurement
methods
are disclosed in, for example, US Patent Nos. 5,694,932; 5,762,770; 5,948,695;
5,975,153; 5,997,817; 6,001,239; 6,025,203; 6,162,639; 6,245,215; 6,271,045;
6,319,719; 6,406,672; 6,413,395; 6,428,664; 6,447,657; 6,451,264; 6,455,324;
6,488,828; 6,506,575; 6,540,890; 6,562,210; 6,582,573; 6,592,815; 6,627,057;
6,638,772; 6,755,949; 6,767,440; 6,780,296; 6,780,651; 6,814,843; 6,814,844;
6,858,433; 6,866,758; 7,008,799; 7,063,774; 7,238,534; 7,473,398; 7,476,827;
7,479,211; 7,510,643; 7,727,467; 7,780,827; 7,820,451; 7,867,369; 7,892,849;
8,180,423; 8,298,401; 8,329,026, as well as RE42560, RE42924 and RE42953.
13
CA 02900607 2016-12-20
FIG. 2 shows a simplified circuit diagram 400 of an exemplary analyte
measurement system including a biosensor 420 operatively coupled with a meter
410
to provide electrical communication between biosensor 420 and meter 410.
Biosensor
420 includes a test cell 421 having a working electrode 422 and a counter
electrode
423 in contact with a combined reagent and sample 422. Working electrode 422
is in
electrical communication with the negative input of amplifier 414 of meter
410.
Counter electrode 423 is in electrical communication with a virtual ground or
reference
potential of meter 410.
Meter 410 includes a microcontroller 411, which is operable to generate and
output a test control signal at output 412. The test control signal drives
amplifier 413
to output a test potential to the positive input of amplifier 414. This test
potential also
is seen at the negative input of amplifier 414 due to a virtual short between
the
positive input and negative input of amplifier 414. The test potential present
at the
negative input of amplifier 414 provided to working electrode 422. Thus, the
test
control signal output by microcontroller 411 is operable to control the test
potential
applied to the working electrode 422. The test control signal provided at
output 412
and test potential provided to working electrode 422 may include a number
features
such as AC components, preconditioning components, and DC pulse sequences
including excitation potentials and closed circuit recovery potentials,
examples of
which are further described herein below.
The test potential applied to working electrode 422 produces a current
response 450 that is provided to the negative input of amplifier 414.
Amplifier 414 is
configured as an IN converter and outputs a voltage to input 460 of
microcontroller
411 that is proportional to current response 450. Microcontroller 411 detects
the
voltage at input 460 and determines the current response 450 by dividing the
voltage
seen at input 460 by the value of gain resistor 415. The current response 450
may
include responses to test potentials including AC components, preconditioning
components, and DC pulse sequences including excitation potentials and closed
circuit recovery potentials, examples of which are further described herein
below.
It shall be appreciated that additional exemplary analyte measurement
systems may include a number of features in addition to or as alternatives to
those
illustrated in simplified circuit diagram 400. For example, microcontroller
411 also may
be operatively connected to other components of meter 410 such as one or more
14
CA 02900607 2016-12-20
digital memories, displays and/or user interfaces, such as those illustrated
and
described above in connection with FIG. 1, as well as controller and driver
circuitry
associated therewith. In FIG. 2, output 412 is an analog output connected to a
D/A
converter internal to microcontroller 412, and input 460 is an analog input
connected
to an ND converter internal to microcontroller 412. In other instances, output
412 may
be a digital output connected to an external D/A converter and input 460 may
be a
digital input connected to an external ND converter. In FIG. 2, test cell 421
is a two-
electrode test cell; however, other test cells can be three-electrode test
cells, or other
electrode systems.
In FIG. 2, a test potential can be applied to a working electrode to provide a
potential difference between the working electrode and a counter electrode.
Alternatively, a test potential other than virtual ground or reference
potential can be
provided as a counter electrode to provide a potential difference between the
working
electrode and a counter electrode. It shall be appreciated that the foregoing
and a
variety of other additional and alternate test cell, electrode, and/or
circuitry
configurations operable to apply a test signal to an electrode system in
contact with a
combined sample and reagent and measure a response thereto may be utilized.
Measurement Methods
As noted above, the measurement methods described herein are based upon
an inventive concept that includes using information derived from DC responses
to a
test sequence having at least one DC block, where the block is designed to
provide
specific information about aspects of a sample and/or biosensor.
The methods generally include applying to a fluidic sample, such as a body
fluid, an AC block in connection with a pulsed DC sequence and measuring the
AC
and DC current responses. As shown in FIGS. 3-4, one trace illustrates the
applied
DC potential, and the other trace illustrates the AC and DC current responses,
respectively. The applied DC potential can be fixed at about 0 mV between
pulses to
provide a recovery pulse, thus making it a generally continuous, unipolar
excitation
waveform. This is in contrast to a test sequence from known methods that
prescribe
the use of an open circuit between positive DC pulses, thereby excluding the
possibility of collecting and analyzing the current between positive pulses.
CA 02900607 2016-12-20
As used herein, "recovery pulse" means an about zero-potential pulse applied
for an adequately long recovery period in which the electrochemical reaction
with the
analyte of interested (e.g., glucose) is turned "off," thereby allowing the
system to
return to a fixed starting point before subsequent interrogation with another
more
positive DC pulse.
The test sequence thus generally includes a block of low-amplitude AC
signals followed by a controlled, DC block.
With respect to the AC block, it can include a plurality of AC segments such
as, for example, from about 2 segments to about 10 segments, from about 3
segments to about 9 segments, from about 4 segments to about 8 segments, from
about 5 segments to about 7 segments, or about 6 segments. In other instances,
the
AC block can include about 2 segments, about 3 segments, about 4 segments,
about
5 segments, about 6 segments, about 7 segments, about 8 segments, about 9
segments, or about 10 segments. In still other instances, the AC block can
have more
than 10 segments, that is, about 15 segments, about 20 segments, or about 25
segments. In yet other instances, the AC block can include 1 segment, where
the
segment has multiple low-amplitude AC signals applied simultaneously.
One of skill in the art understands that the number of AC segments will be
limited by the complexity of the response, the associated frequency range and
time
available to perform the measurements. Higher frequencies generally require
high
bandwidth electronics and faster sampling, whereas lower frequencies take
longer and
typically are noisier. The maximum number of segments therefore will be a
compromise of these parameters, choosing the minimum count and frequency span
needed to discriminate the sample and environmental and/or confounding factors
of
interest.
As used herein, "about" means within a statistically meaningful range of a
value or values such as a stated concentration, length, molecular weight, pH,
potential, time frame, temperature, voltage or volume. Such a value or range
can be
within an order of magnitude, typically within 20%, more typically within 10%,
and
even more typically within 5% of a given value or range. The allowable
variation
encompassed by "about" will depend upon the particular system under study, and
can
be readily appreciated by one of skill in the art.
16
CA 02900607 2016-12-20
The frequency of each signal in each segment of the AC block can be from
about 1 kHz to about 20 kHz, from about 2 kHz to about 19 kHz, from about 3
kHz to
about 18 kHz, from about 4 kHz to about 17 kHz, from about 5 kHz to about 16
kHz,
from about 6 kHz to about 15 kHz, from about 7 kHz to about 14 kHz, from about
8
kHz to about 13 kHz, from about 9 kHz to about 12 kHz or from about 10 kHz to
about
11 kHz. In other instances, the frequency of each segment in the AC block can
be
about 1 kHz, about 2 kHz, about 3 kHz, about 4 kHz, about 5 kHz, about 6 kHz,
about
7 kHz, about 8 kHz, about 9 kHz, about 10 kHz, about 11 kHz, about 12 kHz,
about 13
kHz, about 14 kHz, about 15 kHz, about 16 kHz, about 17 kHz, about 18 kHz,
about
19 kHz, or about 20 kHz. In still other instances, the frequency of each
signal in each
segment of the AC block can be more than 20 kHz, that is, about 30 kHz, about
40
kHz, or about 50 kHz. In some instances, one or more of the segments can have
the
same frequency, whereas in other instances each segment has a distinct
frequency
from the other segments. Four frequencies, however, generally is adequate. The
exact frequencies employed can be readily generated by simple integer division
of a
measurement system clock's maximum frequency.
A maximum frequency limit for a signal in a segment of the AC block,
however, can be up to about 100 kHz for an inexpensive, battery-powered
handheld
instrument. Beyond that, the increasing demands on analog bandwidth, sampling
rate, storage and processing speed quickly add up, while the imaginary portion
of a
typical biosensor response becomes increasingly smaller with frequency. Lower
frequencies have longer periods and take longer times to sample with
comparable
accuracy.
The AC block typically includes at least two different low-amplitude signals.
For example, the AC block can include two (2) segments at two (2) frequencies
such
as, for example, about 10 kHz or about 20 kHz followed by about 1 kHz or about
2
kHz. In other instances, the AC block includes a plurality of low-amplitude
signals.
For example, the AC block can have five (5) segments at four (4) frequencies
such as,
for example, about 10 kHz, about 20 kHz, about 10 kHz, about 2 kHz and about 1
kHz. Alternatively, the AC block can have four (4) segments at four (4)
frequencies
such as, for example, about 20 kHz, about 10 kHz, about 2 kHz and about 1 kHz.
Alternatively, the AC block can have four (4) frequencies applied
simultaneously at
about 10 kHz, about 20 kHz, about 10 kHz, about 2 kHz and about 1 kHz.
Alternately
17
CA 02900607 2016-12-20
still, the AC block can have a multi-frequency excitation waveform that
simultaneously
applies the desired low-amplitude AC signals. The AC frequencies may be
applied
sequentially, or combined and applied simultaneously and analyzed via Fourier
Transform.
The AC block can be applied for about 500 msec to about 1.5 sec, about 600
msec to about 1.25 sec, about 700 msec to about 1000 msec, or about 800 msec
to
about 900 msec. Alternatively, the AC block can be applied for about 500 msec,
about 600 msec, about 700 msec, about 800 msec, about 900 msec, about 1000
msec, about 1.25 sec or about 1.5 sec. In particular, the AC block can be
applied for
about 100 msec to about 300 msec.
One of skill in the art, however, understands that the number, frequency,
duration and order of the AC segments can be varied.
AC current response information can be obtained at any time during a test
sequence. Impedance results at lower frequencies may be influenced by analyte
concentration if obtained after an electrochemical cell is DC polarized. In
some
instances, a series of AC current response measurements can be obtained early
in
the test sequence. Measurements taken shortly after a fluidic sample is
applied to a
biosensor will be influenced by diffusion, temperature and reagent solubility.
In other
instances, the AC response current measurements can be obtained at a
sufficient time
after an adequate sample has been applied to allow the response to stabilize,
and
avoid the transient response in the first second. Likewise, response current
measurements can be made at one or more frequencies. Due to their capacitive
nature, multiple AC measurements separated by a frequency octave or decade may
offer different sensitivities or easier manipulation.
Additional details regarding exemplary AC blocks in electrochemical
measurement methods are disclosed in, for example, US Patent Nos. 7,338,639;
7,390,667; 7,407,811; 7,417,811; 7,452,457; 7,488,601; 7,494,816; 7,597,793;
7,638,033; 7,751,864; 7,977,112; 7,981,363; 8,148,164; 8,298,828; 8,377,707
and
8,420,404.
With respect to the DC block, it can include a plurality of pulses such as,
for
example, from about 2 pulses to about 10 pulses, from about 3 pulses to about
9
pulses, from about 4 pulses to about 8 pulses, from about 5 pulses to about 7
pulses,
18
CA 02900607 2016-12-20
or about 6 pulses. In other instances, the DC block can include about 2
pulses, about
3 pulses, about 4 pulses, about 5 pulses, about 6 pulses, about 7 pulses,
about 8
pulses, about 9 pulses, or about 10 pulses. In still other instances, the DC
block can
have more than 10 pulses, that is, about 15 pulses, about 20 pulses, or about
25
.. pulses. As used herein, "pulse" means at least one excitation and one
recovery
period.
The DC block typically includes a constantly applied potential difference that
alternates between about 0 mV and about +450 mV potential difference, or other
slowly time-varying potential difference that can be analyzed by traditional
DC
.. electrochemical methods. One of skill in the art, however, understands that
the range
for the applied potential difference can, and will, vary depending upon the
analyte and
reagent chemistry used. As such, excitation pulse potential can be greater-
than, less-
than or equal to about +450 mV. Examples of excitation potentials include, but
are not
limited to, 50 mV, 75 mV, 100 mV, 125 mV, 150 mV, 175 mV, 200 mV, 225 mV, 250
.. mV, 275 mV, 300 mV, 325 mV, 350 mV, 375 mV, 400 mV, 425 mV, 450 mV, 475 mV,
500 mV, 525 mV, 550 mV, 575 mV, 600 mV, 625 mV, 650 mV, 675 mV, 700 mV, 725
mV. 750 mV, 775 mV, 800 mV, 825 mV, 850 mV, 875 mV, 900 mV, 925 mV, 950 mV,
975 mV or 1000 mV.
Regardless of the number, each DC pulse can be applied for about 50 msec
.. to about 500 msec, about 60 msec to about 450 msec, about 70 msec to about
400
msec, about 80 msec to about 350 msec, about 90 msec to about 300 msec, about
100 msec to about 250 msec, about 150 msec to about 200 msec, or about 175
msec.
Alternatively, each pulse can be applied for about 50 msec, about 60 msec,
about 70
msec, about 80 msec, about 90 msec, about 100 msec, about 125 msec, about 150
.. msec, about 175 msec, about 200 msec, about 225 msec, about 250 msec, about
275
msec, about 300 msec, about 325 msec, about 350 msec, about 375 msec, about
400
msec, about 425 msec, about 450 msec, about 475 msec or about 500 msec. In
particular, each DC pulse at +450 mV can be applied for about 250 msec, and
each
DC pulse at 0 mV can be applied for about 500 msec. Alternatively still, each
pulse
.. can be applied for less than about 50 msec or more than about 500 msec.
Generally, the ramp rate of each DC pulse is selected to provide about 50% or
greater reduction in peak current relative to the peak current provided by a
nearly ideal
potential transition. In some instances, each pulse can have the same ramp
rate. In
19
CA 02900607 2016-12-20
other instances, some pulses can have the same ramp rate and other pulses can
have
a different ramp rate. In still other instances, each pulse has its own ramp
rate. For
example, effective ramp rates can be from about 5 mV/msec to about 75 mV/msec
or
from about 10 mV/msec to about 50 mV/msec, 15 mV/msec to about 25 mV/msec, or
about 20 mV/msec. Alternatively, the ramp rate can be about 5 mV/msec, about
10
mV/msec, about 15 mV/msec, about 20 mV/msec, about 25 mV/msec, about 30
mV/msec, about 35 mV/msec, about 40 mV/msec, about 45 mV/msec, about 50
mV/msec, about 55 mV/msec, about 60 mV/msec, about 65 mV/msec, about 70
mV/msec, or about 75 mV/msec. In particular, the ramp rate can be from about
40
mV/msec to about 50 mV/msec.
Like the AC block, one of skill in the art understands that the number,
potential, duration and order of the DC pulses can be varied.
AC and/or DC current response information is collected from the test
sequence and includes current responses to the AC and DC blocks. In some
instances, the current response information can be collected at an AID
sampling rate
for DC and AC measurements to simplify the system design, including a single
shared
signal path for AC and DC measurements. Common digital audio sampling rates
range include, but are not limited to, from about 44.1 kHz to about 192 kHz.
ND
converters in this range are readily available from variety of commercial
semiconductor suppliers.
As part of the inventive concept, it has been recognized that the recovery
responses include unique informational content, particularly pertaining to
Hct, salt
concentration and temperature. Furthermore, this information provides value
and can
be used to further refine accuracy and performance of SMBG devices,
apparatuses
and systems.
Returning to FIG. 3, the responses to the pulsed DC block encode Hct and
temperature information, as well as real-time information about other
important
processes, such as wetting of the reagent, sample diffusion and separation
with
respect to the reagent, the establishment of a stable glucose transport
gradient, and
the kinetics associated with the reducible analyte. The illustrated DC block
provides
short, distinct strobing of these processes with respect to time. Each
positive DC
CA 02900607 2016-12-20
pulse produces a distinct current signature, which is not exactly like the
others due to
its position in time.
Importantly, each closed circuit recovery potential pulse provides an
adequately long recovery period in which the electrochemical reaction with
glucose is
turned off, thereby allowing the system to return to a common starting point
before
subsequent interrogation with another positive pulse.
Just as the shapes of the current decays from positive DC pulses encode
information about glucose, Hct and temperature (as well as the other biosensor
processes noted above), the shapes of the recovery pulses also are unique.
Each
recovery pulse produces a negative current response with a rate of growth that
also
encodes distinct, time-ordered information describing how the biamperometric
system
returns to a given reference state. The rate of current growth during the
recovery
pulse is not simply a mirror image of the current decay associated with a
neighboring
positive DC pulse, because the glucose reaction has been turned off by
selecting a
potential magnitude that cannot initiate and sustain the electrochemical
reaction with
glucose. The exemplary methods disclosed herein utilize unique information
content
pertaining to Hct, temperature and other confounding variables encoded by
differences within and across the excitation and/or recovery current responses
to
improve the accuracy and performance SMBG devices, apparatuses and systems.
It shall be appreciated that near-zero, and non-zero positive and negative
potential magnitudes also may be utilized as recovery pulses in additional
embodiments, and that the magnitude, duration, and shapes of all pulses may
vary
from the illustrated exemplary embodiments. It also shall be appreciated that
the
exemplary embodiments disclosed herein do not restrict the number of AC
frequencies that may be employed, their positions in time, or their
amplitude(s)/frequencies. Nor does it restrict interspersing AC frequencies
within the
DC block of the test sequence, such as in the exemplary test s illustrated in
FIG. 3 and
discussed in greater detail below. Furthermore, the exemplary embodiments
disclosed herein do not restrict the number, length or magnitude of the DC
pulses.
FIG. 3 shows an exemplary test sequence 500 that can be provided to an
electrode system of an electrochemical test cell. The vertical axis 501 of
graph
denotes working electrode potential in volts (V). It shall be understood that
working
21
CA 02900607 2016-12-20
electrode potential may refer to a potential applied to a working electrode or
to a
potential difference between a working electrode and another electrode such as
a
counter or reference electrode regardless of the electrode or electrodes to
which a
potential or a test signal is applied. The horizontal axis 502 of graph
denotes time in
sec. Test sequence 500 is applied at or after time = 0 sec, which is a time at
which a
sufficient sample is present in a test cell as may be determined using sample
sufficiency detection electrodes and signals or through other techniques.
Test sequence 500 begins with a signal component 510 (or block) that may
include one or more AC segment(s), preconditioning test segment(s) or
combinations
thereof. Signal component 510 also may include incubation signal components
that
are selected not to drive an electrochemical reaction but to allow for reagent
hydration
and progression of reaction kinetics. Such incubation components may include,
for
example, an open circuit condition, a 0 mV potential, a substantially 0 mV
average
potential, or a non-zero volt potential such as a non-zero potential that is
less than the
potential needed to drive a particular reaction of interest.
In some instances, signal component 510 comprises one or more AC
segments and frequencies provided to an electrode system of an electrochemical
test
cell. For example, the AC segments of signal component 510 include a 10 kHz
segment applied from about time = 0 sec to about time = 1.2 sec, a 20 kHz
segment
applied from about time = 1.2 sec to about time = 1.3 sec, a 10 kHz segment
applied
from about time = 1.3 sec to about time = 1.4 sec, a 2 kHz segment applied
from
about time = 1.4 sec to about time = 1.5 sec, and a 1 kHz segment applied from
about
time = 1.5 sec to about time = 1.6 sec. Alternatively, the AC segments and
frequencies of signal component 510 includes a 10 kHz signal applied for about
1.5
sec, followed by a 20 kHz signal applied for about 0.2 sec, followed by a 10
kHz signal
applied for about 0.2 sec, followed by a 2 kHz signal applied for about 0.2
sec,
followed by a 1 kHz signal applied for about 0.2 sec.
As noted above, the signal component 510 can include one or more
preconditioning signal(s). In some instances, the signal component 510
includes a
positive DC preconditioning pulse applied starting at about time = 0 sec for
about 200-
600 msec and having an amplitude of about 100 mV or greater. In other
instances,
the signal component 510 includes a positive DC preconditioning pulse applied
starting at about time = 0 sec for about 500 msec and having an amplitude of
about
22
CA 02900607 2016-12-20
450 mV. In still other instances, the signal component 510 includes a two
cycle
triangular potential wave including a slew rate of about 2 V/s.
As such, the signal component 510 can include combinations of one or more
AC segments as well as preconditioning signal component(s). In some instances,
the
signal component 510 includes one or more AC signal components followed by one
or
more preconditioning signal components. In other instances, the signal
component
510 includes one or more preconditioning signal components followed by one or
more
AC signal components.
After signal component 510, a pulsed DC sequence 520 (or block) is applied
to the electrode system. Pulse sequence 520 begins with the working electrode
potential being ramped up to the excitation potential of pulse 521. From pulse
521 the
working electrode potential is ramped down to the recovery potential of pulse
522.
From potential 522 the working electrode potential is sequentially ramped up
and
down to the potentials of pulses 523-532. As shown in FIG. 3, the ramping
between
pulses is controlled to occur at a predetermined rate effective to mitigate
capacitive
current response. In some instances, the ramp rate is selected to provide a
50% or
greater reduction in peak current relative to the peak current provided by a
substantially square wave excitation in which signal rise time is determined
by the
native characteristics of the driving circuitry rather than being deliberately
controlled
according to a predetermined target rate or range.
Pulses 521, 523, 525, 527, 529 and 531 are examples of ramp-rate controlled
excitation potential pulses that provide an excitation potential to an
electrochemical
test cell effective to drive an electrochemical reaction in the test cell and
generate an
associated Faradaic current response which may be convolved with capacitive
charging current responses and other current response information attributable
to a
plurality of confounding variables. As also shown in FIG. 3, the excitation
potential
pulses provide a potential difference between a working electrode and a
counter
electrode of about 450 mV that is about 130 msec in duration. The excitation
potential
shown is selected to drive a particular analyte reaction, which in this case
is an
enzyme-mediated reaction of glucose. It shall be understood that the magnitude
and
duration of the excitation potential pulses may vary depending upon the
particular
activation potential of the mediator used or the potential needed to drive a
particular
reaction of interest.
23
CA 02900607 2016-12-20
Pulses 522, 524, 526, 528, 530 and 532 are examples of closed circuit
recovery potential pulses that provide a potential to a working electrode of
an
electrochemical test cell during which a closed circuit condition of the test
cell is
maintained to control the test cell to discharge current and to more rapidly
restore test
cell conditions to a substantially common starting point for subsequent
interrogation
with an excitation potential pulse. Closed circuit recovery potential pulses
also may be
ramp rate controlled in the same or a similar manner to excitation potential
pulses. As
shown in FIG. 3, the recovery potential pulses provide a potential difference
between
a working electrode and a counter electrode of about 0 mV, which is about 280
msec
in duration during which the electrode system is maintained in a closed
circuit
condition.
In some instances, the magnitude of the DC potential provided by a closed
circuit recovery pulse and its duration may vary depending upon the potential
below
which a test cell can recover toward a pre-excitation state and the time
needed to
provide a desired response. Thus, some embodiments can include recovery
potential
pulses having a non-zero potential that is less than the activation potential
of a given
mediator. Some instances include recovery potential pulses having a non-zero
potential that is less than the potential needed to drive a particular
reaction of interest.
Other instances include recovery potential pulses having a non-zero potential
that is
less than the minimum redox potential for a specified reagent system. Still
other
instances include recovery potential pulses having an average potential of
about 0
mV, but which have pulse portions greater than 0 mV and portions less than 0
mV.
Still other instances include recovery potential pulses having an average
potential
according to any of the aforementioned non-zero potentials, but which have
portions
greater than the non-zero average and portions less than the non-zero average.
FIG. 4 shows a current response 600 produced by a test cell in response to
test sequence 500 of FIG. 3. The vertical axis 601 of graph 600 denotes
working
electrode current in pA. The horizontal axis 602 of graph 600 denotes time in
seconds. Current response 600 begins with response component 610 that includes
a
response to signal component 510. In some instances, response component 610
includes AC current responses from which impedance, admittance and phase angle
can be determined. Such measurements may be performed for one or more AC block
segments or components such as those described above in connection with FIG.
3. In
24
CA 02900607 2016-12-20
some instances, response component 610 includes a preconditioning signal
component but no AC segment and no measurement of response component 610 is
performed. In other instances, response component 610 includes a combination
of
the foregoing and/or other components.
After response component 610, response 600 includes a sequence of
exponentially decaying excitation current responses 621, 623, 625, 627, 629
and 631,
which are generated in response to excitation pulses 521, 523, 525, 527, 529
and
531, respectively. Excitation current responses 621, 623, 625, 627, 629 and
631
include a Faradaic current response component relating to an electrochemical
reaction in the test cell as well as a capacitive charging current response
relating to
capacitive electrode charging and current response information attributable to
a
plurality of confounding variables. Current responses 622, 624, 626, 628, 630
and
632 include a recovery current response relating to discharge of the test cell
when
maintained in a closed circuit condition applying a recovery potential and
current
response information attributable to a plurality of confounding variables.
Current responses 621-632 include information related to the concentration of
an analyte of interest that may be present in the fluidic sample being tested,
as well as
additional information of confounding variables convolved therewith. This
inventive
concept described herein therefore can be incorporated into methods by which
the
information associated with current responses 621-631 can be used to determine
a
concentration of an analyte of interest with enhanced accuracy, precision,
repeatability
and reliability by compensating for or decreasing sensitivity to one or more
confounding variables. A number of confounding variables may impact analyte
concentration determinations including variations in reagent film thickness,
sample
temperature, sample Hct, reagent wetting, and reaction kinetics among others.
The
present disclosure demonstrates that the methods disclosed herein may be
utilized to
perform analyte concentration determinations that compensate for or exhibit
decreased sensitivity to such confounding variables.
FIG. 5 shows in greater detail a portion 700 of the signals illustrated in
FIGS.
3-4. The closed circuit recovery potential 522 ramps to excitation potential
523 over a
rate controlled ramp potential 752 such as, for example, a ramp rate of about
45
V/sec. Alternatively, the ramp potentials can be controlled to have a ramp
rate less
than about 50 V/sec, between about 40 V/sec to about 50 V/sec, or between
about 40
CA 02900607 2016-12-20
V/sec to about 45 V/sec. Other embodiments control the ramp rate between
pulses at
different rates that are effective to reduce the contribution of the effect of
capacitive
charging on current responses.
The ramping rate of ramp potential 752 is effective to reduce the effect of
capacitive charging on current response 762, which is generated in response to
ramp
potential 752 and excitation potential 523. Average current is measured
starting about
30 msec after excitation potential 523 is achieved over an about 100 msec
measurement period ending at the point at which excitation potential 523
begins to
ramp down to closed circuit recovery potential 522 over ramp potential 753.
Similar
current measurements may be taken for excitation current responses 621, 625,
627,
629 and 631. It shall be appreciated that average current measurements may be
performed using continuous integration, discrete integration, sampling or
other
averaging techniques. The successive current measurements may be used to
construct an effective current decay curve from which analyte concentration
can be
calculated using techniques such as Cottrell analysis and others. In FIG. 5,
ramp
potential 753 is controlled to have a ramp rate substantially the same as ramp
potential 752. In other instances, ramp potential 753 may be controlled at
different
rates or may be allowed to transition at a system defined rate without active
control.
Current responses, such as current responses 621-632, therefore encode
unique time ordered information relating to sample glucose concentration,
sample Hct,
sample temperature, as well as information relating to processes such as
reagent
wetting of the reagent, sample diffusion and separation with respect to the
reagent,
the establishment of a stable glucose transport mechanism, and the kinetics
associated with the reducible analyte. Pulse sequences such as pulse sequence
520
provide short, distinct strobing of these processes with respect to time and
produces
current responses including unique, time-ordered information relating to
sample
glucose concentration, sample Hct, sample temperature, and other factors. The
inventors have demonstrated a number of unexpected advantages of the
techniques
disclosed herein through experiments in which pulse sequences such as pulse
sequence 520 were used to analyze various concentrations of blood glucose
while
hematocrit and temperature were varied systematically.
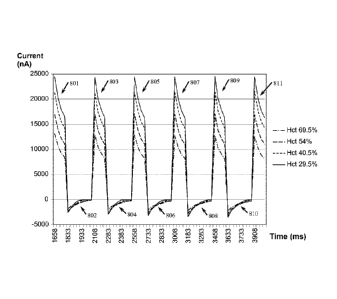
FIG. 6 shows the effects of an exemplary systematic variation of excitation
current responses and recovery current responses to pulse sequence 520
described
26
CA 02900607 2016-12-20
above for varying Hct and constant temperature. Current responses are
illustrated for
four test samples with varying Hct concentrations of about 29.5%, 40.5%, 54%
and
69.5%, constant glucose concentrations of about 530 mg/dL, and constant
temperatures of about 25 C. The magnitude and decay rates of the excitation
current
responses to excitation potential pulses 521, 523, 525, 527, 529 and 531 vary
with
sample Hct in a manner that is substantially constant with respect to time. At
each
Hct, current responses 801, 803, 805, 807, 809 and 811 exhibit substantially
consistent magnitudes and decay rates for each pulse in pulse sequence 520.
Within
each pulse of pulse sequence 520, the magnitude of current responses 801, 803,
805,
807, 809 and 811 varies in an inverse relationship with Hct.
The magnitude and growth rates of the recovery current responses to
recovery potential pulses 522, 524, 526, 528, 530 and 532 also exhibit an
observable
relationship. Recovery current responses 802, 804, 806, 808 and 810 to closed
circuit
recovery potential pulses 522, 524, 526, 528, 530 and 532 have comparable
starting
magnitudes both within each pulse and across pulses for each Hct, but have
different
rates of growth resulting in current response crossovers. As Hct varies,
current
responses 802, 804, 806, 808 and 810 grow at different rates depending upon
the Hct.
The aforementioned current response characteristics and relationships also
were demonstrated in experiments that used samples having constant glucose
concentrations of about 33 mg/dL but were otherwise substantially in
accordance with
those described above.
In comparison, FIG. 7 shows the effects an exemplary systematic variation of
current responses to pulse sequence 520 for varying temperature, constant Hct
and
constant glucose concentration. Current responses are illustrated for five
test
samples with varying temperatures of 6.5 C, 12.5 C, 24.6 C, 32.4 C and 43.7 C,
constant Hct of about 41%, and constant glucose concentrations of about 535
mg/dL.
The current responses to the positive DC potential of pulses 521, 523, 525,
527, 529
and 531 show a relative decrease for successive pulses with respect to time.
The
magnitude of current responses 901, 903, 905, 907, 909 and 911 decrease
successively across pulses for each of the sample temperatures. Furthermore,
the
amount of decrease across pulses varies depending upon sample temperature.
27
CA 02900607 2016-12-20
The magnitude and growth rates of the recovery current responses to
recovery potential pulses 522, 524, 526, 528, 530 and 532 also exhibit an
observable
relationship. Recovery current responses to 522, 524, 526, 528, 530 and 532
show
substantially consistent magnitudes across pulses and, within each pulse, have
distinctly ordered starting values and decreasing growth rates, but exhibit no
crossover.
The aforementioned current response characteristics and relationships also
were demonstrated in experiments that used samples having constant glucose
concentrations of about 33 mg/dL but were otherwise substantially in
accordance with
those described above.
From this research, a number of analyte concentration measurement methods
will now be described that use "descriptors" to encode magnitude and shape
information of excitation current responses and closed circuit recovery
current
responses to the short duration pulse sequences of excitation potentials and
closed
circuit recovery potentials such as those described above in, for example,
FIGS. 3-5.
Descriptors represent a way to encode information relating to analyte
concentration as
well as information relating to systematic variation in confounding variables
such as
variation in sample Hct, sample temperature, sample salt, chemical kinetics,
diffusion
and other confounding variables. Such information may be contained within
magnitude and shape of current responses to short-duration excitation and
recovery
pulses, for example, as illustrated and described above in connection with
FIGS. 6-7.
Analyte concentration determinations using descriptors provide a unique and
unexpected compensation for insensitivity to the effects of confounding
variables.
The descriptors described herein include (1) within-pulse descriptors, and (2)
across-pulse descriptors. As used herein, "within-pulse descriptor" or "within-
pulse
descriptors" means numerical quantities determined using one or more observed
measurements within a current response to an individual pulse (excitation or
recovery)
in a continuous DC waveform, to describe an intrinsic property of the current
response. Two examples of within-pulse descriptors include the average current
value within a current response and the magnitude difference between two
different
current responses separated in time during the same pulse (e.g., the first and
last
measured current values within a current response). Additional examples of
within-
pulse descriptors include, but are not limited to, the slopes and intercepts
from any
28
CA 02900607 2016-12-20
two measurement points within a current response, for example, the first two
points,
the last two points, the first and last points, and other sets of points
within a current
response; the amplitudes and time constants from a multi-exponential fit of
the current
response using relative or absolute time values; the sum of all current
measurements
and the cumulative slope and intercept of those currents within a pulse, an
angle
between a certain portion of a current response and a horizontal or vertical
axis; and
extrapolated value from a certain portion of a current response.
As used herein, "across-pulse descriptor" or "across-pulse descriptors" means
numerical quantities encoding information of the progression or development of
current responses to two or more pulses as a function of time. Across-pulse
descriptors may encode information for current responses to sequential pulses
or for
pulses separated by intervening pulses or time. An example of an across-pulse
descriptor includes magnitude and/or slope differences for points or sets of
points of
current responses to two or more pulses, for example, the magnitude
differences
between the last current value in an excitation pulse and the first current
value in an
adjacent recovery pulse, as well as the magnitude differences between the last
point
in a recovery pulse and the first point in the following excitation pulse.
Additional
examples of across-pulse descriptors include, but are not limited to, the
current
responses from all pulses, only positive pulses, only recovery pulses or other
combinations, for example, the slope, intercept and/or parameter values from a
curve
fit through the first or last current values from all positive pulses or
negative pulses,
respectively.
Descriptors also may be used in connection with methods involving
transformations of current response information. An ideal model of the
relationship
between current as a function of time and analyte concentration is given by
the Cottrell
equation, which provides that I = nFAco(Dtitt)-1/2, where I is current in
amps, n is the
number of electrons to reduce/oxidize one molecule of a given analyte, F is
Faraday's
constant (96,485 C/mol), A is the area of a planar electrode in cm2, co is the
initial
concentration of the analyte in mol/cm3, D = diffusion coefficient for the
analyte in
cm2/s, and t = time in sec. A simplified form of the Cottrell equation is i =
kt-1/2, where
k is the collection of constants n, F, A, co and D for a given system. The
Cottrell
equation is typically used to analyze graphs of current vs. time-1/2. For
ideal Cottrell
29
CA 02900607 2016-12-20
behavior, the resulting slope is linear, but this is not the case for many
real world
analyte measurement systems.
As described above, descriptors encoding magnitude and shape information
of current responses such as slope, intercept and curvature information, can
be
utilized in performing analyte concentration determinations. The inventors
have
developed data transformation methods that can be utilized in systems where
Cottrell
behavior is not linear. Certain transformations utilize descriptors of the
slope, linearity
and/or curvature in a transformed In-In space. Additional examples include
slopes and
intercepts of best fit lines for two or more current measurements, slopes and
intercepts for current averages for ranges within pulses, and other types of
slope and
intercept descriptors.
FIG. 8 is a graph of current responses to recovery pulse 528 for four samples
1001, 1002, 1003 and 1004 in a transformed coordinate system where x =
In(time)
and y = In(current), time is measured from the start of pulse 528, and current
is
measured at multiple points during pulse 528. Sample 1101 has a glucose
concentration of 550 mg/dL, a Hct concentration of 70%, and a temperature of
25 C.
Sample 1102 has a glucose concentration of 550 mg/dL, a Hct concentration of
31%,
and a temperature of 25 C. Sample 1103 has a glucose concentration of 550
mg/dL,
a Hct concentration of 42%, and a temperature of 44 C. Sample 1104 has a
glucose
concentration of 550 mg/dL, a Hct concentration of 42%, and a temperature of 6
C.
For recovery pulse 528, samples 1101, 1102, 1103 and 1104 show a
nonlinear relationship between In(current) and In(time) which includes
information
relating to sample temperature and sample Hct at a given glucose
concentration. For
example, there is a systematic change in the separation and order of current
responses 1101 and 1102 resulting in a crossover as sample Hct changes and the
sample temperature remains constant. In addition, there is a systematic
difference in
the slope and intercept defined by the last two current measurements for
sample 1103
and sample 1104 when the hematocrit level is constant and temperature is
varied.
The descriptors disclosed herein may be used to encode information of these
systematic relationships and to perform analyte concentration determinations
compensating for variation in sample hematocrit and sample temperature among
other
confounding variables.
CA 02900607 2016-12-20
FIG. 9 is a graph of current responses to excitation pulse 529 for samples
1101, 1102, 1103 and 1104 plotted in a transformed coordinate system where x =
In(time) and y = In (current), time is measured from the start of pulse 529,
and current
is measured at multiple points during pulse 529. Samples 1101, 1102, 1103 and
1104
show a linear relationship between In(current) and In(time) for excitation
pulse 529 and
the relative order of current responses remains constant during pulse 529. The
effect
of Hct variation can be seen through a comparison of samples 1101 and 1102.
The
effect of temperature variation can be seen through a comparison of samples
1103
and 1104 and is greater than the effect due to hematocrit variation. The
descriptors
disclosed herein may be used to encode information of these systematic
relationships
and to perform analyte concentration determinations compensating for variation
in
sample Hct and sample temperature among other confounding variables.
The descriptor and/or data transformation methods disclosed herein may be
used to determine glucose concentration in a sample of blood provided to a
test cell
including an electrode system. FIG. 10 illustrates an exemplary glucose
concentration
determination process 1200, which may be performed using analyte measurement
systems including a meter and an electrochemical biosensor such as those
described
herein.
Process 1200 begins at operation 1210 where a meter is operatively coupled
with an electrochemical biosensor. Process 1200 continues to operation 1212
where
a sample is provided to the biosensor and contacted with a reagent to provide
a test
cell including an electrode system in electrical communication with the
combined
sample and reagent. Process 1200 then continues to operation 1214 where a
sample
sufficiency determination is performed by the meter. If an affirmative sample
sufficiency determination is made process 1200 proceeds to operation 1216 and
initiates a test signal and response measurement operation. If an affirmative
sample
sufficiency determination is not made, operation 1214 repeats and may
optionally time
out or terminate after a predetermined number of attempts, or after a
predetermined
time has elapsed, or based upon other criteria.
Operation 1216 performs a test sequence and response measurement
operation during which a test sequence is generated by the meter and provided
to the
electrode system of the test cell, and a response signal of the test cell is
measured by
the meter. In some instances, operation 1216 generates and provides test
sequence
31
CA 02900607 2016-12-20
500 to the electrode system and measures the corresponding response 600. The
measurement of response 600 may include measurement of response component 610
and measurement of current responses 621-632. Multiple current measurements
are
taken during each of current responses 621-632, and the measured current
information is stored in a memory. It shall be appreciated that in other
instances,
operation 1216 generates and provides other test signals including a DC pulse
sequence having excitation potential pulses and recovery potential pulses and
respective corresponding excitation current responses and recovery current
responses which may include the variations and alternatives described herein
above,
as well as other numbers, magnitudes and durations of excitation potential
pulses and
recovery potential pulses. Process 1200 then proceeds to operation 1218, where
a
microcontroller and/or other processing circuitry processes the stored current
measurement information to determine a glucose concentration.
Operation 1218 determines a glucose concentration based upon the stored
current measurement information including current response information
corresponding to excitation potential pulses and current response information
corresponding to recovery pulses. In some instances, operation 1218 utilizes
descriptors that encode the slope and intercept of the last two current
measurement
points within a current response in an x-y coordinate system where x =
In(time) and y
= In(current) and where time is measured relative to an identified starting
point for
each pulse (excitation and recovery) to determine an effective DC current
according to
Equation 1:
i=N
Ieff =*Pi,. + Co*
i= 1
In Equation 1, leff designates the effective DC current, i designates a pulse
number in a pulse sequence of the excitation potential pulses and the recovery
potential pulses, N designates the total number of pulses in a sequence
(including
both excitation and recovery pulses), Pip is a descriptor designating the
slope of the
last two current measurement points within a pulse in an x-y coordinate system
where
x= In(time) and y=ln(current), Pi,b is a descriptor designating the intercept
of the last
two current measurement points within a pulse in an x-y coordinate system
where
x=ln(time) and y=ln(current), col designates a slope weighting constant, and
ci,b
32
CA 02900607 2016-12-20
designates an intercept weighting constant. The weighting constants may be
determined empirically using a number of optimization techniques, for example,
those
available in the SAS software package available from SAS Institute, Inc.
It shall be appreciated that the number of pulses and associated current
responses may vary. In some examples herein, the number of pulses was N = 9.
Other forms, however, can use a different numbers of pulses. Furthermore, it
shall be
appreciated that not all pulses in a test sequence need be utilized in an
analyte
concentration determination, for example, where the number of pulses N = 9,
and
pulse sequence including eleven pulses such as that disclosed above in
connection
with FIG. 3 may be used, and the current response information for pulses 10
and 11
may not be utilized. In other instances, information from current responses to
all
pulses in a test signal may be used.
Operation 1218 uses the effective current leff as well as AC current response
information to determine a predicted glucose concentration according to
Equation 2:
Predglu = a0 + (b0 + exp(b1+ b2leff + Peff Yeff))*(leff).
In Equation 2, Peff is the effective phase of the AC current response, Yeff is
the
effective admittance of the AC current response, and a0, b0, b1 and b2 are
constants
that are determined through known optimization techniques. The phase term,
Peff, is
determined according to Equation 3:
Peff = bp2*(p11 *cos(a) + p12*sin(a)) + bp3*(-p11*sin(a) + p12*cos(a)).
In Equation 3, a = arctan(I), p11 is a 20 kHz AC current response phase, p12
is a 10 kHz AC current response phase, and bp2 and bp3 are optimized weighting
coefficients that may be determined by various optimization techniques. The
admittance term, Yeff, is defined according to Equation 4:
Yeff = by2*(y11 * cos(a) + y12*sin(a)) + by3*(-y11 *n() + y12*cos(a)).
In Equation 4, a = arctan(I), and y11 is a 20 kHz AC admittance, y12 is a 10
kHz AC admittance, and by2 and by3 are optimized weighting coefficients that
may be
determined by various optimization techniques.
Operation 1218 may use alternative methods to determine a predicted
glucose concentration, for example, according to relationship described by
Equation 5:
Predglu = a0 + alleff + exp(b0 + Peff Yeff)*ieff.
33
CA 02900607 2016-12-20
In Equation 5, Peff is the effective phase of the AC current response, Yeff is
the
effective admittance of the AC current response, and a0, al and b0 are
constants. Peff
and Yeff may be determined using substantially the same techniques as
described
above.
It shall be appreciated that the descriptors, transformations and
determinations described above in connection with operation 1218 are non-
limiting
examples of methods by which analyte concentrations can be determined using
information included in current responses corresponding to a DC pulse sequence
comprising excitation potential pulses and current response information for
recovery
pulses. Alternative methods incorporating the inventive concept may utilize a
variety
of additional or alternate descriptors and/or data transformations in
accordance with
the principles and examples disclosed herein.
The inventors developed and experimentally validated that a number of
unexpected performance characteristics can be achieved through the methods
disclosed herein. A number of such performance characteristics were validated
in
connection with the general method described in connection with FIG. 10. An
exemplary performance characteristic includes 10/10 performance, where less
than
5% of glucose determinations performed using a plurality of test elements
included an
error greater than 10% at high glucose levels such as those at or above 75
mg/dL
and/or an error of 10 mg/dL at low glucose levels such as those below 75
mg/dL.
Certain exemplary methods therefore include 10/10 performance for variation
in sample temperature, variation in sample Hct, and/or variation in sample
salt. Some
methods include 10/10 performance for 50% variation in sample Hct, for
example,
variation from 20%-70% Hct. Other methods include 10/10 performance for 50 C
variation in sample temperature, for example, variation from 6 C to 44 C.
Other
methods include 10/10 performance for 40 mg/dL variation in sample salt, for
example, variation in sample salt from 140 mg/dL to 180 mg/dL. Other methods
include 10/10 performance for a combination of the foregoing temperature, Hct
and/or
salt variations.
Further exemplary performance characteristics include, but are not limited to,
measurement bias, normalized error ("NE") standard deviation of normalized
error
("SDNE"), total system error ("TSE") and combinations thereof. In one
exemplary
34
CA 02900607 2016-12-20
validation study, 10/10 performance for compensation for co-variation of
sample Hct
from about 20% to about 70% and sample temperature from about 6 C to about 44
C
demonstrated the performance characteristics summarized in Table 1 below.
Table 1
10/10 10/10
Temperature Hematocrit Bias at NE SDNE TSE
Failures Failures Nominal
0 0 1.79 0.22 5.67 9.55
Another exemplary performance characteristic includes bias, SDNE and TSE
characteristics for variation in reagent film thickness. In an exemplary
validation
study, three rounds of testing were performed with capillary blood for three
rolls of test
elements produced on up to two different lanes (0 and M). Measured dry reagent
film
thicknesses for rolls 1, 2 and 3 were 4.64, 4.08 and 5.10 pm, which correspond
to
nominal, -12%, +10%. The performance characteristics for this study are
summarized
in Table 2 below.
Table 2
Roll Lane N Mean Bias SDNE TSE
1 M 477 -0.30 4.11 8.52
1 0 233 -1.68 4.22 10.12
1 M&0 710 -0.75 4.20 9.14
2 0 236 6.17 5.49 17.15
3 M 234 -6.32 4.39 15.10
The study demonstrated a negligible bias (-0.75) with capillary blood, even
though the analyte concentration technique was not trained with capillary
blood. The
study also demonstrated low mean biases for both lanes of roll 1 even though
the
algorithm was trained with strips from lane M only. The study further
demonstrate
insensitivity to coat weight variation as the mean bias was about +6% at the
lower
coat weight and about -6% at the higher coat weight.
In another exemplary validation study, three rounds of testing were performed
on the test elements from roll 1. This study considered study-to-study
variation in
testing and demonstrated the results summarized in Table 3 below.
CA 02900607 2016-12-20
Table 3
Roll Lane N Mean Bias SDNE TSE
1 M 238 0.06 3.85 7.76
1 0 239 0.05 4.09 8.23
1 M&0 477 0.06 3.97 7.99
36
CA 02900607 2016-12-20
A further exemplary validation study tested ten different lots of test
elements,
three of which were used in verification of the analyte concentration
determination
technique. This study demonstrated lot-to-lot robustness results summarized in
Table
4 below.
Table 4
Roll Lane N Mean Bias SDNE TSE
2 M&O 480 -0.73 4.44 9.61
3 M&O 479 2.31 3.78 9.88
4 M&O 478 2.44 4.33 11.10
2 M 240 0.57 4.54 9.66
2 0 240 -2.04 3.93 9.9
3 M 240 2.68 3.55 9.78
3 0 239 1.94 3.97 9.89
4 M 240 1.91 4.05 10.02
4 0 238 2.98 4.53 12.04
Another exemplary performance characteristic includes compensation for
dose tremble such as double dosing or delayed dosing at various glucose
concentrations and hematocrit levels. An exemplary dose tremble validation
study
was conducted and demonstrated the results summarized in Table 5 below.
Table 5
Mean Standard
Glucose HCTBias
Dose Type
Prediction Deviation
120 45 Normal 135.22 3.65 0.00
120 45 Tremble 138.24 4.18 2.23
120 70 Normal 124.38 3.88 0.00
120 70 Tremble 127.72 3.79 2.68
550 45 Normal 578.03 3.35 0.00
550 45 Tremble 593.94 3.37 2.75
550 70 Normal 621.51 3.70 0.00
550 10 Tremble 626.13 4.23 0.74
Performance characteristics also were validated in connection with the
descriptors and method described in connection with FIG. 10, as well as
additional
37
CA 02900607 2016-12-20
descriptors. The performance characteristics for a variety of exemplary
descriptors
are summarized in Table 6 below.
Table 6
Descriptors
LN Time, LN Simple 1/sqrt Time Rate of
All Pulse
Current Linear R's with Total Transitions
Descriptors Compensated Temperature Charge (Q) - Orig DC
of FIG. 10 AC & DC Descriptors Buildup - Current
Orig DC, Rs
Modified Y's
Failed T 0 0 0 0 0
Claims
Failed Hct 0 0 0 0 3
Claims
SDNE 4.7 3.7 3.7 8.0 6.5
Training ---
Salt Claim Passed Passed Passed Passed Passed
Mean Bias -0.7 -0.1 0.6 -0.6 -5.2
CV Round
1
SDNE 4.2 4.7 4.7 4.9 4.3
Round 1
Mean Bias 0.1 0.1 1.6 -1.1 -5.8
CV Round
2
SDNE 4.0 4.4 4.1 7.1 5.9
Round 2
Mean Bias 2.3 3.3 -3.1 -3.9 -3.1
CV Round
3 ---
SDNE 3.8 4.3 3.7 5.1 4.6
Round 3 --
Side 0.6 3.2 2.4 0.8 1.4
Dosing
Bias
'5 mg/d L 8.4 24.5 17.0 1.8 0.3
Ascorbic
Acid Bias
at 40 Glu
15 mg/dL 34.2 59.5 53.4 18.1 -1.7
Ascorbic
Acid Bias
at 40 Glu
38
CA 02900607 2016-12-20
All of the patents, patent applications, patent application publications and
other publications recited herein are hereby incorporated by reference as if
set forth in
their entirety.
The present inventive concept has been described in connection with what are
presently considered to be the most practical and preferred embodiments.
However,
the inventive concept has been presented by way of illustration and is not
intended to
be limited to the disclosed embodiments.
39