Note: Descriptions are shown in the official language in which they were submitted.
CA 02907400 2015-09-16
WO 2014/153265
PCT/US2014/029833
SPECTRUM ANALYSIS OF CORONARY ARTERY TURBULENT BLOOD
FLOW
RELATED APPLICATIONS
100011 This application claims priority from United States Non-
Provisional
Patent .Application titled "Spectrum Analysis Of coronary Artery Turbulent
Blood
Flow," filed on March 1.8, 2013, Serial Number 13/81.5,961. United States Non-
Provisional Patent Application titled "Spectrum Analysis Of Coronary Artery
Turbulent Blood Flow,' filed on March 18, 2013, Serial Nurriber 131815,961 is
a
continuation-in-pan:of United:States Patent Application Serial No, 12/228,058
filed
on August 9, 2008.
BACKGROUND OF THE INVENTION
1. HELD OF INVENTION
100021 The invention relates generally to detecting and processing
vibrational
cardiac data., and more specifically to apparatuses and methods used to detect
vibrational cardiac data related to coronary artery disease.
2. ART BACKGROUND
100031 Coronary artely disease is a primary precursor of heart attacks,
which
is a leading cause of death in the United States. Coronary artery disease is
characterized by a deposition of plaque within the coronary arteries,
resulting in a
condition referred to as stenosis, in which case blood flow is restricted and
the oxygen
supply to the heart muscle is decreased. Such a deposition. of plaque is also
referred
CA 02907400 2015-09-16
WO 2014/153265
PCT/US2014/029833
to as an occlusion. Coronary artery disease can result in heart attack and
subsequent
physical injury and possible death. This can present a problem,
100041 it is known that the blood flow can become turbulent as the
blood
passes through an area of stenosis. Turbulent blood flow provides a source of
vibrational excitation within the body, The -vibrational excitation causes
enemy to
propagate through the body and provides a field that can be measured_ at Mt':
surface of
the 'body. Normal body fhnetions such as breathing and the opening and closing
of
the heart s valves provide high levels of background noise relative to the
magnitude
of the -vibrational enemy resulting from excitation at areas of stenosis. Such
high
levels of background noise can frustrate detection. This can present a
problem,
10-0051 The body is made up of structures that have very different
physical
properties which are distributed as a function of space throughout the body
cavity.
Some of these structures are limgs, ribs, organs, blood, arteries, fat,. etc.
These
structures present a non-homogeneous media to the propagation of vibrational
energy.
Such a non-homogenous media can make it difficult to characterize the .media
sufficiently to form focused listening beams While processing the vibrational
energy
emitted from the areas of stenosis during a parametric analysis that assumes a
known
vibrational wave speed. This can present a problem.
190061 Currently, coronary artery disease is treated post
symptomatically with
an invasive procedure called an angiogram. The angiogram is costly, invasive,
and
places the patient at risk of injury due to complications that can arise
during the
procedureõ All of this can present problems.
2
CA 02907400 2015-09-16
WO 2014/153265
PCT/US2014/029833
BRIEF DESCRIPTION OF THE DRAWINGS
100071 The invention may best be understood by .refeiring to the
following
description and accompanying drawings that are used to illustrate embodiments
of the
invention. The invention is illustrated .by way of example in the embodiments
and is
not limited in the .figures of the accompanying drawings, in. which like
references
indicate similar elements.
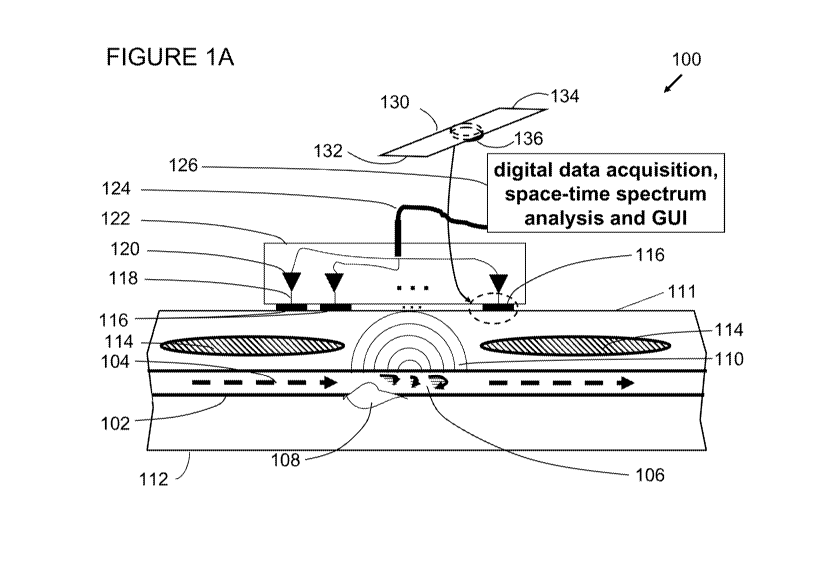
100081 Figure IA illustrates an apparatus, according to one embodiment:
of
the invention.
100091 Figure IB illustrates a block diagram ofa computer system (data
acquisition system) in which embodiments of the invention may be used.
100101 Figure 2 illustrates a plot, representational of vibrational
cardiac data.
as a function of time for two heart cycles, according to one embodiment of
the.
invention.
100111 Figure 3 illustrates a method for processing vibrational cardiac
data,
according to embodiments of the invention,
100121 Figure 4 illustrates several channels ofyibrational cardiac
data,
according to an embodiment of the invention.
100131 Figure 5 illustrates master replica selection according to an
embodiment of the invention.
100141 Figure 6 illustrates, in one embodiment, a correlation scan.
100151 Figure 7 illustrates, in one embodiment, assembling multiple
heart
cycles.
100161 Figure 8 illustrates, in one embodiment, diastolic intervals
selected for
further processing.
3
CA 02907400 2015-09-16
WO 2014/153265
PCT/US2014/029833
100171 Figure 9 illustrates a two-dimensional space-time frequency
power
spectrum (orthogonal vibration mode decomposition of the cross-channel power
spectral density matrix "CSDM") of vibrational cardiac data, according to one
embodiment of the invention.
1.041181 Figure 10 illustrates a two-dimensional space-time frequency
power
spectrum processed for Equivalent Rectangular Bandwidth, according to one
embodiment of the invention.
100191 Figure 11 illustrates a phantom constructed to simulate blood
flow
through an area of stenosis, according to one embodiment of the invention,
100201 Figure 12 illustrates detection of stenosis in a phantom;
according to
embodiments of the invention.
100211 Figure 13 illustrates an Equivalent Rectangular bandwidth (ERB)
display of vibrational energy resulting from fluid flow with oceluder present
in a
phantom (area of stenosis), according to one embodiment of the invention,
100221 Figure 14 illustrates an Equivalent Rectangular bandwidth (ERB)
estimate of vibrational energy resulting from fluid flow without occluder in a
phantom (healthy condition without stenosis), according to one embodiment of
the
invention.
100231 Figure 1.5 illustrates an apparatus according to embodiments of
the
invention,
100241 Figure 16 illustrates a method to obtain vibrational cardiac
data.
according embodiments of the invention.
100251 'Figure 17 illustrates time series plots of vibrational cardiac
data,
according to embodiments of the invention,
4
CA 02907400 2015-09-16
WO 2014/153265
PCT/US2014/029833
100261 Figure 18 illustrates another set of time series plots of
vibrational
cardiac data collected from a human whose coronary arteries are in a healthy
condition, according to embodiments of the invention.
100271 'Figure 19 illustrates vibrational frequency power spectra
estimates
corresponding to a time Slot 181.6 shown in Figure :18, according to
embodiments of
the invention.
100281 Figure 20 illustrates a method for averaging vibrational
frequency
cardiac data, according to embodiments of the invention.
100291 Figure 21 illustrates an overlay of space-time averaged
vibrational
frequency power spectra estimates corresponding to data from Figure 18,
according
to embodiments of the invention.
100301 Figure 22 illustrates a set of time series 'plots of vibrational
cardiac
data collected from a human with coronary artery disease, according to
embodiments
of the invention.
100311 Figure 23 illustrates a set of vibrational frequency power
speciza
estimates corresponding to the time series from 'Figure 22, according to
embodiments
of the invention.
100321 Figure 24 illustrates an overlay of vibrational frequency power
spectra
estimates from multiple slots corresponding to the human's data shown in
Figure 22,
according to embodiments of the invention.
100331 Figure 25 illustrates a method for identifying a feature related
to
coronary artery blood flow turbulence using a single human, according to
embodiments of the invention.
100341 Figure 26 illustrates a comparison of vibrational cardinc data
from
multiple 'humans, according to embodiments of the invention,
CA 02907400 2015-09-16
WO 2014/153265
PCT/US2014/029833
10035j Figure 27 illustrates a method for identifying a feature related
to
coronary artery blood flow turbulence using multiple humans, according to
embodiments of the invention.
6
CA 02907400 2015-09-16
WO 2014/153265
PCT/US2014/029833
100361 DETAILED DESCRIPTION
100371 in the following detailed description of embodiments of the
invention,
reference is made to the accompanying .drawings in which like references
indicate
similar elements, and in which is Shown by way of illustration, specific
embodiments
in which the invention may be practiced. These embodiments are described in
sufficient detail to enable those of Skill in the art to practice the
invention, in other
instances, well-known circuits, structures, and techniques have not been shown
in
Mail in order not to obscure .the understanding of this description. The
following
detailed description is, therefore, not to be taken in a limiting sense, and
the scope of
the invention is .defined only by the appended claims.
100381 Apparatuses and methods are described Ibr detecting and
processing
-vibrational cardiac data in a human, in one or more embodiments, the
vibrational
cardiac data arises from stenosis in a coronary artery. In one embodiment,
vibrational
cardiac data is measured and processed from a phantom with and without
stenosis.
100391 Figure 1A. illustrates an apparatus generally at 1.00, according
to one
embodiment of the invention. With reference to Figure IA, a cross-section 112
of a
human body contains coronary artery 102 having a flow of blood 104 passing
therethrough. The flow of blood 104 can .i.nteract with a coronary artery
lesion 10:8
and cause an excitation of the artery wan by known physical means, which
include
transition to turbulent flow and the corresponding application of forces
normal w the
surface of the coronary artery. Such excitation of the coronary artery wall
results in.
vibration& energy110 propagating to the surface of the human i11.
100401 In this description of .embodiments, the term "sensor" is
synonymous
with the terms "channel" or "sensor channel," whereby a separate measurement
is
7
CA 02907400 2015-09-16
WO 2014/153265
PCT/US2014/029833
contemplated. Additionally, the term,"sensor" is synonymous with the terms
"transducer" or "sensing transducer." Thus, a first sensor's output (a first
channel)
and a second sensor's output (a second channel) are each available for
analysis and
each represents a separate measurement of a field quantity of interest, such
as the
vibration field in a human's body. As will be noted by those of skill in the
art, in
some instances, it might be advantageous to electrically combine together, in
series or
parallel, several sensors into a single channel. Such combinations can be made
within
the scope of the descriptions provided herein. However to simplify the
discussion,
"sensor" will be understood to be synonymous with the terms "sensor channel,"
"channel," "transducer," or "sensing transducer."
100411 An array of sensors 116 measures the vibration of thesurface 111
and
collects vibrational cardiac data thereby. The array of sensors 116 is made up
of a
gene-mi number of N sensors (sensing transducers or transducers). In one
embodiment, the number N equals 14 and the spacing between adjacent
transducers is
one-quarter inch (0,25"). Those of skill in the art will recognize that the
array of N
sensors 116 can be contlaured with; a different number of sensors, a different
sensor
width, and/or sensor spacing. The example given herein is provided .merely for
illustration and does not limit embodiments of the invention.
100421 The cross section 1.12 of the human presents a nen-homogeneous
media through which the vibrational energy 110 propagates and contains various
structures such as ribs, lungs, organs interfaces, muscles, tat, and skin
tissue indicated
generally by 114. The vibrational energy propagates through the nen-
homogeneous
media and is measured on the surface 111 by the array of N. sensors 116, in
one
embodiment, it can be desirable to place the array of sensors 116 over a
person's heart
8
CA 02907400 2015-09-16
WO 2014/153265
PCT/US2014/029833
and above a space between adjacent ribs to facilitate detection of the -
vibrational
energy.
100431 in one embodiment, each sensor of the array of sensors 116 is
made
from a strip of poiyvinylidene. fluoride (PVDF) film. In one example, each
strip of
PVDF fiim meitsures 0.75 inches lone., between attachments to a chassis 122,
and
0.1875 inches wide. Each strip of PVDF -fain is stretched into a flat plane
and is
anchored at each end by the chassis 122. At the midpoint of each strip of
PA/DE
film, a pad is placed to provide an area aeon-tact. between the skin surface
11.1 and
the strip of PVDF .film. An example of one such sensor from the array of
sensors 116
is illustrated by a strip of PVDF film 1.30, having a first end 132 and a
second end 134
(which are attached to the chassis 122) and a pad 136 that makes contact with
the skin
surface ill. In one .embodiment, the diameter of the pads is 0.1.875 inches
and the
thickness of the pads is 0.0625 inches. The sensitivity of the PVIN. film
along its
major axis is 22176 Vlutilt strain for a PVDF film thickness of 0,028
millimeters.
The MIDI' film generates a voltage in -response to strain imparted from the
motion of
the skin surface 11 I. in one embodiment, 'ht.': chassis 122 is made out of
metal such
as aluminum, in other embodiments the chassis 122 is made out of plastic or
another
material sufficient to provide the necessary anchor points for the strips of
PVDF
100441 Each sensing transducer is in electrical contact with at least
one
preamplifier 120 using connection 118. It is advantageous to place a
preamplifier
proximate to its sensing transducer in order to minimize the addition of
electronic
noise. Additional amplification stages can be used and in one embodiment the
outputs from the preamplifiers 120 are passed. to a bank of amplifiers (not
shown).
such as those available from Ithaco Corporation Model 451. In oue. embodiment,
the
outputs of the sensing transducers (array 116) are carried in a cable bundle
124 and
9
CA 02907400 2015-09-16
WO 2014/153265
PCT/US2014/029833
are processed in a data acquisition system .126 that can contain a graphical
user
interface (GUI).
100451 Those of skill in the art will appreciate that adjustments to
the array
geometty can he made, i.e., sensor dimensions and sensor spacing. Vibrational
energy 110 includes shear wave energy propagation with shear wavelengths on
the
order of several tens of millimeters, e.g. approximately 40 .millimeters at
200 cycles
per second and approximately 20 millimeters at 500 cycles per second.
1110461 Figure 111 illustrates, generally at 150, a 'block diagram of a
computer
system (data acquisition system) in which embodiments of the invention may be
used.
The block diagram is a high-level conceptual representation and may be
implemented
in a variety of ways and by various architectures. With reference to 'Figure
IB,. bus
system 162 interconnects a Central Processing Unit (CPU) 164, Read Only Memory
(ROM) 166, Random Access Memory (RAM) 168, storage 160, display 161, audio
1.62, keyboard 164, pointer 166, data acquisition unit (C AU) 126, and
communications 170, The bus system 162 may be for example, one or more of such
buses as a system bus, Peripheral Component Interconnect (PC1), Advanced
Graphics
Port (AGP), Small Computer System interface (SCSI), Institute of Electrical
and
Electronics Engineers (IEEE) standard number 1394 (FireWire), Universal Serial
Bus
(USB), or a dedicated bus designed for a custom application, etc. The CPU 164
may
be a single, multiple, or even a distributed computing resource. Storage 160
may he
Compact Disc (CD), Digital Versatile Disk (DVD), hard disks (HD), optical
disks,
tape, flash, memory sticks, video recorders, etc. The computer system 150 can
be
used to receive vibrational cardiac data via 124 from the array 116 of -
vibration
sensors (Figure 1A). Note that depending upon the actual implementation of a.
CA 02907400 2015-09-16
WO 2014/153265
PCT/US2014/029833
computer system, the computer system may include some, all, more, or a
rearrangement of components in the block diagram,
100471 Thus, in various embodiments, .vibrational cardiac data. is
received at
124 for processing by the computer system 150. Such data can be transmitted
via
communications interface 170 for .further processing and diagnosis in a remote
location, as illustrated in 'Figure 18 at 172. Connection with a network, such
as an
intranet or the Internet is obtained via 1.72, as is recognized by those of
skill in the art,
which enables the data processing device 150 to communicate with other data
processing devices in .remote locations,
100481 For example, embodiments of the invention can be implemented on
a
computer system 150 configured as a desktop computer or work station, on for
exantple a WINDOWS' compatible computer running operating systems such as
WINDOWS4t' XP Home or WINDOWS'*' XP Professional, Lima., etc. as weil as
computers from APPLE COMPUTER, Inc, running operatin2 systems such as OS X.
etc. Alternatively, or in conjunction with such an implementation, embodiments
of
the invention can he configured with devices such as speakers, earphones,
video
monitors, etc. configured for use with a Bluetooth commimication channel.
100491 Figure 2 .illustrates, generally at 200, a plot of vibrational
cardiac data
as a. innction of time thr two heart cycles, according to one embodiment of
the
invention. With reference to Figure 2, a representative output from one of the
vibration sensors, from array 1.16 (Figure IA) is illustrated, where a
magnitude of the
sensor's output is plotted on a vertical axis 204 as a function of time 202. A
.first
heart cycle 206 contains a first peak 208 corresponding to the closure of the
mitral
and tricuspid valves. This :first peak is described in the literature as a
"tub" sound
when heard through a stethoscope. The first heart cycle 206 contains a second
peak at
11
CA 02907400 2015-09-16
WO 2014/153265
PCT/US2014/029833
210, which corresponds to the .closure of the two semi-lunar, aortic and
pulmonary
valves at the beginning of diastolic period 212. This second peak. is
described in the
literature as a. "dub" sound when heard through a stethoscope. The diastolic
period.
212 fbllows the second peak 210.
100501 The heart continues to beat, and a second heart cycle 226 is
produced
thereby with the same major features found in the first heart cycle; a first
peak at 228,
followed by a second peak at 230, and a diastolic interval (DI) 232.
Successive heart
cycles (not shown) will continue to occur as the heart continues to beat.
During the
diastolic intervals, 212, 232, eto, blood, flow is at a maximum in the
coronary arteries
and unwanted coronary events, such as the first peaks 208, 228 and the second
peaks
210, 230 are separated in time and their effect on the diastolic interval is
at a
minimum,
10051.1 In one embodiment, it is desinable tei.proceSS vibrational
cardiac data
accumulated over iipproximately one hundred and twenty (120) heart cycles in
order
to provide a sufficiently long, averaging, time record length for an array of
14
channels. In practice, with human test subjects, it has been observed that the
human
test subjects can comfortably breath-hold .for iipproximately twenty (20)
heart cycles.
In this case, a human test subject will alternate between breath-hold and
normal
breathing, for breath recovery, While the heart waveform is measured. In one
embodiment, a nominal duration of the entire heart waveform is from one
hundred
and twenty (120) to one hundred and eighty OW seconds and is made up of six
(6)
twenty (20) to thirty (30) second segments. In another embodiment, a number of
heart cycles is approximately equal to ten (10) to fifteen (15) times: the
number of
sensor channels in array N. Such a number of heart cycles is needed to
adequately
resolve theitumerically higher eigenvalues as described below in sections of
the
12
CA 02907400 2015-09-16
WO 2014/153265
PCT/US2014/029833
following discussion. A shorter duration heart waveform (fewer heart cycles)
can be
collected if the eigenvalue range is limited accordingly. Those of skill in
the art will
appreciate that the entire heart waveform can vary in length and that the
examples
provided herein are given for illustration only and do not limit embodiments
of the
invention.
100521 The number of heart cycles over which a human tot.subject can
comfortably 'breath-hold will vary between human test subjects and will depend
on
many factors such as age, physical condition, etc. When vibrational cardiac
data is
collected during breath-hold, the effects of breathing on the measured
vibrational
cardiac data are minimized. The number of segments can be adjusted to suite
the
particular test conditions, given the length of time that the human test
subject can
breath-hold for and the number of sensor channels in the array N. in one
embodiment, a human starts and stops the acquisition of the vibrational
cardiac data
to coincide with acquisition during breath-hold periods.
100531 The N sensor array, described in Figure 1A, is used to measure
and
process vibrational cardiac energy, which is measured at the surface 11.1
during the
diastolic intervals. In one embodiment, such measurement and processing of the
vibrational cardiac energy is used to determine whether a .plaque deposit(s)
(coronary
artery lesion(s)) 108 exists in the human due to coronary artery disease. In
other
embodiments, such processing can be used to detect vibrational energy
generated
within the human in genera] and not necessarily caused by coronary arteiy
disease.
100541 Figure 3 illustrates, generally at 30(.1, a method for
processing
vibrational cardiac data, according to embodiments of the invention. The
method is
applied to vibrational cardiac data that is measured with an array of N
sensing
transducers, which are mounted on the surface of a human's body as described
above
13
CA 02907400 2015-09-16
WO 2014/153265
PCT/US2014/029833
Ri eonjimetion with the previous figures. With reference to Figure 3, a method
starts
at a block 302.
100551 For the purpose of extracting..diastolie intervals front their
respective
heart cycles, at a block 304 a -technician selects a single high quality
channel from the
array of N SCliglig transducers. A high quality channel has a high signal-to-
noise
ratio, .wherein the signal-to-noise ratio is expressed as the ratio between
the height of
a first peak of a heart cycle and the background level during the diastolic
interval and
the height of a second peak of the heart cycle and background level of the
vibrational
cardiac data. The selection of a high quality channel can be 'performed by a
technician or it can be automated in a selection algorithm that would be
performed by
a data processing system such as the .computer system (data acquisition
system)
described above in conjunction with Figure lB. Figure 4 illustrates, generally
at
400, several channels 402, 404, 406, and 408 of vibrational cardiac data.
according to
an embodiment of the invention. In this example, Channel 6 indicated at 404 is
selected_ as the high quality channel, with sigmt-to-noise ratio metric
indicated at 410.
100561 Optionally., at a block 308, the vibrational cardiac data from
the 'high
quality channel is band pass filtered to suppress energy at frequencies that
are above
and below the frequency content of the first and second peaks of the heart
cycle. The
band pass filter operation typically passes energy in the band From
approximately 5
cycles per second (Hz) to several tens of Hz.
100571 Optionally, at a block 310, envelope detection can be applied to
the
vibrational cardiac data from the high quality channel. Envelope detection
operation
is given by:
c(t) abs0010,
14
CA 02907400 2015-09-16
WO 2014/153265
PCT/US2014/029833
and can be performed before the band-pass filter operation of block 310. x(t)
is the
high quality channel vibrational cardiac data time series, abs is the absolute
value
operator, and 00) is the envelope .amplitude.
[00581 Optionally, one or more segments of heart cycle data can be
collected.
to provide the entire heart waveform as described above. When multiple
segments
are collected, a master replica is selected from each segment.
100591 With reference to Figure 3, at a block 314, a master .replica is
selected
from the high quality channel, which was specified at the block 304. The
master
replica is selected by selecting a heart cycle that is hiehly representative
of a majority
of heart cycles within the segment of the heart waveform represented by the
high
quality channel. The master replica is either a portion of or the entire heart
cycle so
identified. To illustrate the process, Figure 4 displays vibrational cardiac
data,
generally at 400, collected froni four (4) different transducer Channels,
i,e,, a channel
five (5) at 402, a Channel six (6) at 404, a channel seven. (7) at 406 and a
channel eight
(8) a 408. The vibrational cardiac data collected from channel six. (6) at 404
(Figure
4) will be used for master replica selection and correlation due to favorable
signal-to-
noise characteristics as indicated at 410.
100601 Optionally, the data from 404 can be band-pass filtered, as
described at
the block 306 (Figure 3) and is displayed as 502 in 'Figure 5. Figure 5
illustrates,
generally. at 500, master replica selection according to an embodiment of the
invention, .A noise burst due to breathing is marked at 504 and the same band-
pass
filtered data is displayed again at 506 where the .master replica (MR) window
is
indicated tit 508.
[0061] At a block 316 the master replica is correlated with the high
quality
channel vibrational cardiac data from which it was selected. This cross-
correlation
CA 02907400 2015-09-16
WO 2014/153265
PCT/US2014/029833
procedure produces a correlation waveform that is a finiction of the time lag
between
the master replica and the segment waveform extending over the entire length
of the
segment minus the time length of the master replica. The correlation waveform
has
local maxima when the master replica is temporally well aligned as a function
of time
lag with a corresponding high signal-to-noise ratio portion of the segment
wavethrm.
These local maxima establish time reference points that are used to id.entify
the
diastolic window and to align successive heart cycles in time, i.e.,
synchronize, for
signal analysis.
100621 At a block 318õ the local maxima identified in the block 316 are
used
to separate heart cycles from a segment as a function of time. Figure 6
illustrates, in
one embodim.ent, a correlation scan, generally at 600, that resulted from the
vibrational cardiac data ShOWT1 at 506 in Figure 5. 'With .reference to Figure
6, in one
embodiment, the process begins by analyzing the correlation data 602 to locate
local
maxima for all values of time (1) for Which the correlation coefficient .c(t)
is:
c(t)> max lc(t-) 4t41)1.
100631 Next, all values thr which c(t) falls below a threshold are
discarded.
With reference to Figure 6, correlation coefficient c(t) is plotted at 602 as
a function
of time 604. A. threshold is indicated at 608. The threshold 608 can be
defined by an
operator with a graphical -user interthee (pup or it can be defined by the
system.
!pow] Next, a time difference is obtained between a correlation peak
and the
peak that came before it in time. If the time difference is less than a
threshold, then
the maximum peak value is discarded as a possible bean beat cycle starting
time.
This process discards all candidate heart cycle starting times for 'heart
cycles with a
heart rate greater than a specified threshold. For example, a 0,5 second time
difference threshold. would disallow heart rates above 120 beats per minute
(bptn),
16
CA 02907400 2015-09-16
WO 2014/153265
PCT/US2014/029833
The local maxima that are left are used to iden0, the heart cycles from Which
the
vibrational cardiac data will be extracted and processed. Generally lower
values of
e.orrelation coefficient can be observed in interval 606 which .eorrespond
with the
effects of breathing noise.
100651 Corresponding with a block 320 (Figure 3), Figure 7 illustrates,
in one
embodiment, assembling multiple heart cycles. With reference to Figure 7, the
local
maxima that are identified by the analysis described above in conjunction with
the
block 318 are used to define windows in time as. the window starting times.
The
vibrational cardiac data .cotTesponding to these windows in time are over
plotted as
illustrated, where amplitude is .indicated on an axis 702 and time along an.
axis 704.
Envelope amplitude maxima 712 and 7.14 are. followed by a diastolic interval
710.
Enve1ope amplitude maxima 716 and. 718 are used to help the identification
oldie
diastolic interval; 'however it is not mand.atoty to use all four Envelope
amplitude
maxima to locate the diastolic interval 710. A single envelope amplitude
.maxima and
knowledge of the human's heart beat rate are sufficient to identify the
diastolic
interval 710. A start time 706 and a stop time 708 are placed at the ends of
the
diastolic interval either by a technician or these indicators can be located
automatically by an algorithm in an automated process.
100661 Optionally, for each of the diastolic intervals indicated at 710,
a power
parameter, such as average squared amplitude over the duration of the heart
cycle is
computed tbr each heart cycle. Then all of the average squared amplitude
levels are
averaued to produce a mean squared amplitude level averaged over all heart
cycles
over plotted. Each heart cycle's average squared amplitude level is compared
to a
multiple of the mean squared level and is discarded if its value exceeds the
.multiple of
the mean squared level. In one em.bodiment the multiple is equal to 2Ø This.
heart
17
CA 02907400 2015-09-16
WO 2014/153265
PCT/US2014/029833
cycle waveform pruning operation is used to discard those heart cycles that
are
contaminated by noise which is likely due to breathing and/or intestinal
activity.
100671 Corresponding with a block 32.2 (figure 3), Figure 8 illustrates,
in one
embodiment; generally at 800, diastolic intervals selected for further
processing.
With reference to Figure 8, using the heart cycle starting times, estimated
above in
conjunction with the previous .figures, e.g,, Figure 7, a subsequence of
adjacent time
samples are extracted from the vibrational cardiac data 810. In Figure 8,
vibrational
cardiac data from a high quality transducer channel are plotted with amplitude
on an
axis 802 and time on an axis 804. Vibrational cardiac data are accepted from
21
diastolic intervals. The intervals marked at 806 are contaminated with
excessive
noise and are rejected.
100681 Corresponding with a block 324 (Figure 3), the vibrational
cardiac.
data that are extracted during the identical time window for all N sensors
channels,
from the diastolic windows, can be processed as a continuous ensemble of data
or the
diastolic window can be further partitioned into subintervals or slots as
described
above. Referring back to Figure 2, the diastolic window 212 is divided into
four 4
slots 214 and the next diastolic window 232 is partitioned into four (4) slots
234.
Adjacent time slots with the slots 214 or 234 can overlap in time. The slots
have
fixed starting times relative to the respective diastolic interval and are
typically
separated by less than one tenth of an average heart cycle (for example, 0.1
seconds
for a 60 beat per minute heart cycle). In one embodiment, the length of the
slot
interval, in number of time samples, is taken to be the number of points in a
discrete
Fast 'Fourier Transform .(FFT) operation which is performed independently
within
each slot. This procedure effectively strobes the same time slot number (c.a.
I, 2, 3,
4, etc.) .from each heart cycle for FFT spectrum analysis. In various
embodiments, the
18
CA 02907400 2015-09-16
WO 2014/153265
PCT/US2014/029833
temporal length of an FFT window slot is in the range of 0.1.54-0.1 seconds.
Thus, for
each sensor channel, a complex. Fourier spectrum of the vibrational cardiac
data is
computed from the time series data.
100691 Corresponding with a block 326 (Figure 3), Figure 9 illostrateS 4
two-
dimensional space-time frequency 'power spectrum (cross-channel power spectral
density matrix "CSDM") of vibrational cardiac data, generally at 900,
according to
one embodiment of the invention. With reference to Figure 9, spatial frequency
number is plotted on an axis 902 and temporal frequency is plotted on an axis
904.
Normalized amplitude is indicated by a grey scale color and a reference key is
illustrated at 906,
1.00701
The CSDM is either computed for the entire beart:cyde, based on
averaging all heart cycles iu the entire heart: waveform or it can optionally
be
computed for the a specific slot number M the heart cycle. In either ease, the
CSDM
is computed by placing the complex Fourier spectrum .(FFT outputs), obtained
by
processing the transducer channel outputs, into a four-dimensional matrix
indexed as
x(n,, b, k, m):
-x(1, b, k,m)
42, b, k. In)
xtb, k,
x(N, b, k, m)
where n is the .vibration transducer number, kis the FFT discrete frequency
bin
number, b is the retained heart beat. count, and in is the slot number. In
cases where:. a
hearowayeform coma ins multiple segments, heart beat count b will span
multiple time
19
CA 02907400 2015-09-16
WO 2014/153265
PCT/US2014/029833
segments, where each segme!n corresponds to a breath holding period as
described
above.
100711 With N as the number of vibration transducer channels, the CSDM
is
then an N-by-N complex Hermitian Wk., in) matrix, R(k., m) is calculated as a
time
average over the heart beat count index b, separately for each frequency bin
k, and
slot number tn, according to:
B
rn) ee: x(b, 'k, ni)x(b, k, mY
B
Where 13 is the number of heart beat cycles in the averaging ensemble which
can span
multiple segments of acquired vibrational transducer data in some embodiments.
The
value of B will depend on the number of separate transducer channels processed
bral
given measurement. Generally: a lower bound for the value of B is
approximately
four (4) times the number of transducers, N. A. preferred value for B is eight
(8) to
ten (10) times N. Those of skill in the art will recognize that the goal in
selecting the
value tbr B is to reduce the variance in the estimation of the CSDM matrix,
therefore
the value of B can be set at various numbers and the values of eight ($) to
ten (10) are
illustrative and. not limiting.
190721 Corresponding with a block 328 (Tigure 3), the processes from a
'block.
306 to the block 326 'are repeated as needed for each segment in the heart
waveform.
Thus, if the heart waveform contains more than one segment, control transfers
from
330 to the block 306 and the .intervening process blocks are repeated. Now,
that .for
each segment in the heart waveform, a new master replica is chosen and a
correlation
step is performed on a segnient-by-segment basis. This process accommodates
variations ia 'heart rate within a segment and the time averaging in the CSDM
process
(bloe.k. 326) spans the time epoch for all segments acquired and processed
within a.
heart waveform.
CA 02907400 2015-09-16
WO 2014/153265
PCT/US2014/029833
100731 Corresponding with a block 332 (Figure 3), Figure 10 illustrates
two-dimensional space-time frequency power spectrum (Temporal-Spatial Spectrum
(TSS)) processed tbr Equivalent Rectangular Bandwidth (ERB), generally at
1000,
according to one embodiment of the invention, With reference to Figure 10,
temporal frequency is plotted on an axis 1004 and eigerivalue numberlindex
(Spatial
frequency number (sv)) is plotted on an axis 1002. Relative amplitude 1006 of
the
data is displayed as a modulation of gray scale. Following completion of the
C5D.N4
calculation (block 330), an els= yid ue-eigenvector decomposition (EEL)) of
the
CSDNI in each slot and for each FFT frequency bin in the range ktow < k < kb*
is
computed. This decomposition of the CSDNI provides estimates of the blood flow
turbulence induced noise spectrum level and bandwidth.
100741 With N transducer channels, the distribution of energy in the
CSD-M.
eigenvalues at each frequency also quantifies the degree of angular
concentration of
spatial radiation points. The metric of spatial distribution of energy sources
is
referred to herein as spatial bandwidth and is non-parametric since it does
not require
a propagation model parameterization, including wave speed, of the non-
homogeneous body medium 11 2 (Figure 1A) through which the wave energy
propagates from the turbulent induced noise location within the artery (Figure
1.A).
100751 The EEL) is calculated according to:
1M(k, m), in), .N.11(k, trol svd(R(k, m))
where M(*, m) is the N-by-N matrix of orthonormal eigenvectors of (R(k., in)
as
columns and L(k, m) is the diagonal .matrix of corresponding eigenvalues
arranged in
monotonically decreasing order from the upper left to lower right.
100761 Tn one embodiment, to establish a noise floor for the analysis,
the
smallest Islieigetwalues are averaged over all ITT frequency values and then
these
21
CA 02907400 2015-09-16
WO 2014/153265
PCT/US2014/029833
frequency averages arc in turn, averaged over the smallest Nf values, This
produces a
two dimensional space-time average. The number Nf is typically ten to thirty
percent
of the total number of transducer channels, N. and the frequency bins over
which
frequency averaging is performed are within the range above 100. This two
dimensional averaged eigenvalue, A.0, is termed the TSS noise floor. The TSS
noise
floor sets a threshold, over which an accumulation (summation) of eigenvalues
is
performed. This accumulation of eigenvalues contains an estimate of the blood
flow
turbulence induced noise energy,
100771 For the largest pi, 2 1, Neigenvalues, all of the
eigenvalues
as a function of frequency for a fixed value of p that exceed a threshold
given by cat,
are counted by integer counter C,(mand averaged as An(p) and those that do not
exceed
the threshold are counted by Cwo also averaged as
100781 Referring back to Figure 9, the CSD.M eigenvalues are plotted
along
the vertical axis as a function of frequency (horizontal axis) for the sample
case
described herein. The estimation of the CSDM presented in Figure 9 has been
obtained by time averaging the "slot I" interval processed data over five
segments
with a total of ninety (90) heart cycles. The 3m, 54', and 7'h harmonics of
the 60 cycle
power line artifact are evident in the data. Subsequently, these artifacts are
nulled,
blocked, and extrapolated through, which effectively notches out the EFT
frequency
bins as illustrated in the image at 950. Similar processing can be performed
on the
other slots within the diastolic interval,
100791 Corresponding with a block 334 (Figure 3) referring: back to
Figure
10, The counter Cmo when multiplied by the EET frequency bin width equal to
the
numerical inverse of the FFT interval in seconds) is termed the Equivalent
Rectangular spectral Bandwidth. ERB, for spatial eigenvalue p. The estimated
22
CA 02907400 2015-09-16
WO 2014/153265
PCT/US2014/029833
number set C [Cs(p), ^1/40, CIO>, knal> , a, X0 for p 1, 2, ._,N-Nd can
provide a
diagnostic tool for the detection of arterial blood flow turbulence and
thereby the
causative pathology. A simulation of such detection was performed on a phantom
and
is described below in cony-unction with Figure If through Figure 14.
100801 Referring back to Figure 10, presentation of the set C in
relative terms,
shows that the magnitudes of the temporal frequency bandwidth .counter Co) and
the
Signal-to-Noise Ratio (SNR).metric (X,40.44)) are in proportion to and
therefore a
positively correlated marker for blood flow turbulence, in addition, the
extent to
which the threshold is crossed for larger values of p is in proportion to the
extent of
spatial distribution, i.e. spatial bandwidth, of the arterial occlusions that
result hi
blood flow turbuiente.
won in other embodiments, different algorithms eau be used lo
express
Equivalent Rectangular Bandwidth (ERB), All such expressions maintain both
lon1.3-
time averaged and spatial-temporal spectrum, analysis of the signals from an
array of
vibration sensors. in one such alternative embodiment, the temporal eigenvalue
spectrum fbr eacIi spatial frequency index, L(k, p), k kk.hkiõ for each
spatial
frequency index, p, is searched over the temporal frequency index k br the
point at
which .the level has decreased to a pre-specified value ( e.g. -3 db, -6 db,
) relative
to the maximum value. This embodiment is appropriate .where the shape of the
eigenvalue spectnun has a monotonically decreasing trend with increasing k.
100821 The process begins by pre-smoothing the estimated .frequency
spectrum as a least squares fit of lo, 00(1(k, p)) to a two parameter linear
function
over the range of k, Such smoothing permits a specific value of k Cxo at the
specified reduced value threshold point relative to the maximum value, log I
0(L(kio,õõ
p)), to be identified. Given the estimated value of k Cgo at the specified
reduced
23
CA 02907400 2015-09-16
WO 2014/153265
PCT/US2014/029833
value level threshold, for each of p------, 1, 2, õ., N. the eigenvalues as a
function of
frequency, k, that exceed the threshold are given by the averaged value above
the
threshold as 'Asfp) and those that do not exceed the threshold are counted by
C,gpi and
expressed by the averaged value below the threshold. as
100831 'In this alternative embodiment, the estimated tumber set C'
for p = 1, 2, , N) or its flinctional equivalent, can be used with
appropriate human data to provide a diagnostic tool for the detection of
arterial 'blood
flow turbulence and the causative pathology. An example of such use is
illustrated
below in conjunction with Figure 11 through Figure 14.
100841 'Examination of Me set C', shows that the magnitudes of the
temporal
frequency bandwidth counter C> and the. Signal-to-Noise Ratio .(SNR) metric
are in proportion to and arc therefore a positively correlated marker for the
presence of blood flow turbulence. This alternative embodiment can be
generalized.
by performing higher order approximations to the estimated eigenvalue spectrum
and
thereby increasing the number of parameters subjected to a diagnostic process.
On
this issue, the example presented above embodies the lowest possible
complexity.
1.00851 Figurell illustrates a phantom, generally at 1100, constructed
to
simulate blood .flow through an area of stenosis, according to one embodiment
of the
invention. With reference to Figure 11, a phantom simulator of the human
thorax
1102 in the vicinity of the chest wall was formed from silicone gel 1106 with
a
predetermined stiffness comparable to human tissue. The phantom contained
high.-
stiffness human rib surrogates 1108 made of shaped plastic. Blood flaw was
simulated within a latex tube 1104 having cross-sectional characteristics
typical of the
left anterior descending (LAD) human coronary artery with a 3.0 millimeters
(Ulm)
inner diameter. Fluid flow oc.eludets of different topologies were inserted
into the
24
CA 02907400 2015-09-16
WO 2014/153265
PCT/US2014/029833
latex tubing and the blood was simulated in viscosity with mixtures of 25 to
50 %
glycol and distilled water. Al] dimensions were known and the latex tube was
embedded at a depth of 40 nun from the contiguous surface of the phantom.
100861 The long axis of the vibration sensor linear army (not shown)
was
placed parallel to the rib surrogates '1108 and directly over the linear space
between a
pair of the rib surrogates 1108. Such placement simulates placement on a human
and
established a direct vibration wave path from the induced turbulent flow site
to the
vibration sensors located an the contiguous surface of the phantom.
100871 Figure 12 illustrates detection of stenosis occlusion in a
phantom,
generally at 1200, according to embodiments of the invention. With reference
to
Figure 12, the measured power spectrum level of vibration transducers is
plotted on a
vertical axis 1204, Spectrum level represents an integration in .frequency of
the
energy in a given eigenvalue. Flow speed is plotted on an axis 1202õA. series
of
experiments were conducted with different flow speeds with and without an
occluder
present in the latex tube 1104 (Figure 11) to simulate an area of stenosis in
a human.
100881 One experiment consisted of comparing the case of a high flow
rate, 72
cm/sce, without occluder (to induce turbulence) to a realistic human diastolic
LAD
flow rate, 35 crnisee, with .oectuder induced flow turbulence (to simulate
stenosis in a
human). The higher flow rate had more than .four times the laminar .flow
kinetic.
energy than the lower flow rate wherein turbulence was induced by the
occluder. The
objective of this experiment was to quantify the vibrational energy levels
from both
flow regimes and to evaluate the sensitivity of the methods described herein
as a
procedure for discriminating phantom simulated pathological flow from normal
unoceluded flow (healthy no stenosis) at a very high level in order to produce
a worst
case detection scenario.
CA 02907400 2015-09-16
WO 2014/153265
PCT/US2014/029833
100891 Figure 12 shows the Measured 'Power Spectrum level (relative
decibels, db) versus fluid flow rate (cm/see) for flow "with oceluder" at 1216
and
"without occluder" at 1218. Plotted in Figure 12 are the maximum and minimum
oigenvalues, sv-01 and s v141, respectively, of the 14 sensor array estimated
Cross-
Spectral Density matrix (CS-DM). Eigenvalue sv14 is shown at .1206 with
occluder
and at 1208 without occluder. Eigenvalue svOl is plotted at 1216, as a
function of
flow speed, with occluder in to simulate an area of stenosis. Eigenvalue sv-01
is
plotted at 1.218 without oceluder to simulate the healthy state, free of
stenosis.
100901 Figure 12 illustrates that the vibrational energy detected at
the surface
of the phantom is larger in all c;.,ises, with the oeciuder present and low
flow rate, than
even the very high 100 cm/see flow rate with no occluder present. Of
particular
interest -for detecting stenosis in humans is the condition of occluded .flow
(1216) for
velocities above 40 cm/See, the .detccted levels remain above that for
unoccluded flow
(1.218) even at a flow velocity of 100 cm/sec. .Such results demonstrate a
.eapability
for discrimination between. even very high flow rates without occluder induced
noise
(1218) and nominally Tow flow rates with oceluder produced turbulence (.1216).
100911 Figure 13 illustrates an Equivalent Rectangular bandwidth (ERB)
display of vibrational enemy resulting from fluid flow with occluder present
(area of
stenosis) õgenerally at 1300, according! to one embodiment of the invention.
With
reference to Figure 13, temporal frequency is plotted on an axis 1302 and
eigenvaiue
number/index is plotted on rn axis 1304. -Relative amplitude 1308 of the data
1.306 is
displayed as a modulation of gray scale. Data 1306 represents an Equivalent
Rectangular Bandwidth (ERB) estimate for the 35 cm/sec flow rate with an
oecluder
present.
26
CA 02907400 2015-09-16
WO 2014/153265
PCT/US2014/029833
100921 Figure 14 illustrates an .Equivaicnt Rectangular bandwidth (ERB)
estimate of vibrational energy resulting from fluid flow without OCChida
(healthy
condition without stenosis), generally at 1400, according to one embodiment of
the
invention.. With reference to Figure 14, the same format is used to present
the data
from the 14 channel array, temp-oral frequency is plotted on an axis 1402 and.
eigenvalue number/index is plotted on an axis 1404. Relative amplitude 1408 of
the
data 1406 is displayed as a modulation of gray scale. The flow .rate of the
simulated
blood flow was 72 cm/sec. Such a rate is higher than what typically exists
during
normal blood flow in a healthy human. This high rate (72 .cm/sec) was selected
for
purposes of comparison M order to present a worst ease detection scenario for
the
methods described herein.
100931 Figure 13 shows that three spatial frequency eigenvalue modes
1310
are excited with sufficient energy to exceed the 3 db ERB threshold for the 35
cm/see
flow velocity. In contrast, Figure :14 indicates that only two spatial modes
1410
exceed the ERB threshold level at a notably small value of the estimated ERB.
The
discrimination provided by these two extreme cases illustrates the presence of
detected turbulent flow induced noise.
100941 'Figure 15 illustrates, generally at 1..500, an apparatus
according to
embodiments of the .invention. With refercuce to Figure 15 z.incl as is
similarly showa
in Figure IA, a cross-sectional view of a human is presented. In Figure 15,
the cross
section contains a coronary artery 1502. A direction of blood flow is
indicated at
I 504. An occlusion in the artery .1506 participates in causing downstream
blood flow
turbulence 1508. As described above in conjunction with Figure IA, blood flow
turbulence produces a state of vibration1510 in the human's body which
propagates.
27
CA 02907400 2015-09-16
WO 2014/153265
PCT/US2014/029833
energy in the form of elastic waves 151Ø The elastic waves produce vibration
of the
surface of the human and are measured non-invasively by one or more sensors
1516.
100951 As the elastic wave energy 1510 propagates through the humans
body
it interacts with internal structures such as lung 1514 and ribs 1512, In
various
embodiments, it can be desirable to measure the vibration of the surface of
the human
in-between such ribs 1512, by placing a vibration transducer(s) in the
intercostal
space (between ribs) as shown by the placement of sensor 151.6.
1.00961 Depending on the geometry of the surface of the human, the
surface
may provide a curved surface, such as is indicated by 1522. The sensor or
array of
sensors is placed in such a mariner as to conform to the geometry of the
surface 1522.
1.00971 A variety of types of transducers can be used to measure
vibration of a
surface of a human. For example, a Film sensor such as described above in
conjunction with Figure IA can be used as well as other sensors, such as for
example
a laser based sensor. Sensors that respond to displacement, velocity, and
acceleration
can be used to measure the vibrational energy that manifests on the surface of
the
human, in various embodiments, proximity sensors can be used. Sensors as of
now
yet unknown can be used to measure the vibration of the surface of the human.
Embodiments of .the invention are not limited by the choice of sensor used to
non-
invasively measure the vibrational energy manifest on the surface of the
human.
Those of skill in the art will note that if a laser based sensor is used,
physical contact
between the sensor and the surface of the human is not necessary as a laser
can be
used to measure the surface without making physical contact apart from the
laser
beam interacting with the surface.
100981 The output of the sensor(s) is input at .151$ into a spectrum.
analyzer
1520. Spectrum analyzer 1520 is in various embodiments a single or multi-
channel
28
CA 02907400 2015-09-16
WO 2014/153265
PCT/US2014/029833
spectrum analyzer that performs a transformation from time to frequency. The
resulting transformation has been. referred to above in conjunction with
Figure 3 as a
complex Fourier spectrum of the vibrational cardiac data. and the ensemble
average of
the amplitude squared spectrum is referred to below as a vibrational frequency
power
spectrum estimate or simply "spectral estimate" or spectral estimates" when
plural
spectra are referred to. As used herein, in this description of embodiments
and in the
figures, it is understood by those of skill in the art that the terms power
spectral
density estimate (PSD), absolute (PSD) level, spectrum level, level, etc,
rethr the
amplitude of a 'power spectrum estimate. Furthermore, it is common in the art
to
express the level of a power spectrum as a decibel representation where the
units are
abbreviated as "dB." In various embodiments, the vibrational frequency power
spectrum estimate is presented on a display .1524 for view by a doctor or
technician or
the vibrational =frequency power spectrum estimate can be analyzed by an
automated
system to extract features related to a condition of health of a coronary
.artery.. Such
an automated system is configured in various embodiments as described above in
conjunction with Figure 1.13,
109991 As described below in the figures that follow, the vibrational
frequency
power spectrum estimate is used. to quantify features and their
Characteristics which
are used to support a diagnosis of a state of health of a human. A list of
features and
their characteristics includes, but is not limited to blood flow turbulence
energy from:
(a) ventricular refilling turbulence characterized by a low frequency (LF)
plateau with
feature characteristics of level, width, and roll-off rate (slope) :from
thel..f plateau;
(b) arterial blood flow turbulence induced by diffuse occlusions characterized
by a
characteristic that captures the broadband spectrum level increase in the high
frequency .(11F) band above a 200 to 400 Hz roll-off .band relative to the LF
plateau
29
CA 02907400 2015-09-16
WO 2014/153265
PCT/US2014/029833
level; (c) relatively localized occlusions described as having a .band of
surface
curvature radials that induce spectral energy swaths characterized to first
order by the
characteristics of spectrum 'level, center frequency, and bandwidth; (d)
localized
occlusions with a dominant surface curvature that induces spectrally narrow
whistles
characterized by the characteristics of level (amplitude) and center
.frequency; (c) a
roll-off over a band of frequency that can occur anywhere in a frequency
spectrum;
and (f) auSer defined feature. One Or more features or multiples of a single
type of
feature can be evident in the vibrationai frequency power spectrum estimates
obtained
from humans. As used M this description of embodiments, when -refrence is made
to
a feature:, the characteristics (shape) of the .feature arc also implied
thereby.
1001_00] 'Figure 16 illustrates, generally at 1600, a method to assess a
condition
of health of a comnaiy artery using vibrational cardiac data, according to
embodiments of the invention. With reference to Figure 16, a method starts at
a
block 1.602. At a block 1.604 vibrational cardiac data is acquired non-
invasively from
a surface of a human. At a block 1606 unwanted cotonary events arc separated
from
the .vibrational cardiac data. Separating .unwanted coronary events such as
heart valve
vibrations are described above. in conjunction with Figure 3. At a block 1608
a
transient event is extracted from the vibrational cardiac data. The transient
event is
associated with blood flow ruthuience and is used to assess a condition of
health of a
coronary artety. At a block 61O the transient event is evaluated for an
indication of
energy due to coronary artery blood flow turbulence and. the corresponding
state of
health of the coronary artery. At a block 1612 a feature is identified in the
vibrational
frequency power spectrum estimate that is associated with blood flow
turbulence.
Relating the .feature(s), or characteristic(s) thereof in the vibrational
frequency power
CA 02907400 2015-09-16
WO 2014/153265
PCT/US2014/029833
spectrum estimate to a state of health in the coronary arteries of a human is
described
below in conjunction with the figures that follow. At a block 1614 the method
stops.
100101i Figure 17 illustrates, generally at. 1700, time series plots of
synchronized vibrational cardiac data, according to embodiments of the
invention.
With reference to Figure 17, time is platted on a horizontal axis 1702 and
amplitude
is plotted on a vertical axis 1704. As described above in conjunction with
Figure 3,
vibrational cardiac data was collected non-invasively from a surface of human
with a.
transducer. Displayed in Figure 17 is a stack of 67 synchronized heart-cycle
time
series waveforms. The stack of 67 heart-cycle time series waveforms is from
one
channel of a 14 channel array. In order to 11.1aNiMiZe signal-to-noise ratio
(SNR) in a.
given measurement, heart cycles can he pruned, thereby discarding outliers
that are
contaminated with various sources of noise. As described above, various
extraneous
stimuli in the environment can manifest themselves as noise in .vibrational
cardiac
data. These stimuli includeõ but are not limited to, stomach gurgling, etc.
The inter-
waveform correlation coefficient with a master replica exceeds 0.87 for all of
the 67
waveform pairs in Figure 17.
I901021 Similar to the representation of heart-cycle waveforms shown
above in
Figure 2 or Figure 7, two diastolic, intervals are shown in Figure 17, A first
diastolic
interval is observed at 1706. The first diastolic interval 1706 is followed by
a systolic
interval 1708 and then a second diastolic interval 1710. A first heart sound
is
indicated at 1712 and a second heart sound is indicated at 1714. Heart sounds
1712
and 1714 are sonic of the unwanted mummy events that are separated from the
vibrational cardiac data. Durinp., diastole, blood. flow in the coronary
arteries is at a
maximum and the unwanted. heart sound. vibrations are at a minimum. Therefore,
the
vibrational cardiac data that occurs during a diastolic interval are processed
to assess
31
CA 02907400 2015-09-16
WO 2014/153265
PCT/US2014/029833
a condition of health of the coronary arteries.. Blood flow through the
coronary
arteries is at a maximum at the onset of diastole and then decreases as a
function of
time through diastole. Thus, information about blood flow turbulence and a
corresponding state of health of a human's coronary artery can be obtained
from an
analysis of the blood flow turbulence energy that occurs during diastole.
100103j In one or .more embodiments, a diastolic interval (window), such
as
.1706, is divided into a plurality of time slots, such as the example of four
time skits
shown in Figure 1.7 as indicated by 1716, 1718, 1720, and 1722. Transforming
the
time series waveforms that occur in these time slots to the frequency .domain
produces
vibrational frequency power spectra estimates which are compared in order to
obtain
information about both the transient and stationary behavior of the blood flow
turbulence..
1001041 As described above in co-Ili-unction with Figures 3 through
Figure 7, a
time got is an interval of time with a known start time and duration time
relative to an
established time mark. A time slot is also referred to herein as a sub-
interval or a.
portion of a diastolic interval. Note also that a time slot .ean be configured
to be
equivalent in duration to a diastolic interval. The time mark can be selected
either
manually or automatically by the system, in one embodiment, a preferred.
location tbr
a start time is very early diastole during the rapid early ventricular filling
phase, when.
coronary blood flow is at a maximum rate. In one embodiment, a typical time
slot
length can be i.n the range 0,125 to 0.1825 seconds in duration when four (4)
time
Slots are used to process the diastolic window with 50% overlap between time
slots,
Other amounts of time slot overlap can be used and in some embodiments time
slots
can be configured without overlap. The example of four (4) time slots with a
50%
overlap is provided merely for illustration and does not present any
limitation to
32
CA 02907400 2015-09-16
WO 2014/153265
PCT/US2014/029833
embodiments of the invention. Throughout diastole, the .cross-sectional shape
of the
coronary artery is .changing and the frequency content of the blood flow
turbulence
induced energy is changing. These changes are observed. in the vibrational
frequency
power spectra estimates discussed in conjunction with the figures below.
[001051 Figure 18 illustrates, generally at 1800, another set of time
series plots
of vibrational cardiac data collected from a human whose coronary arteries are
in a
healthy condition, according to embodiments of the invention. With reference
to
Figure 18, a stack of 109 synchronized heart-cycle waveforms are displayed in
the
figure with time plotted on an axis .180.2 and amplitude plotted on an axis
1804. The
correlation coefficient computed between a master replica and all other heart
cycles
exceeded 0.89 for pairs of heart cycles in the stack of Figure 18. The human
corresponding to the data shown in Figure 1.8 is a forty three (43) year old
male who
is symptom free with respect to cardiovascular disease. The individual
exercises
regularly and has a total cholesterol value of 170. The vibrational cardiac
data from
this individual is used below to provide information on blood flow turbulence
from a
healthy state of coronary artery health.
1901061 The first heart sound interval is indicated at 1806. The first
heart
sound interval 1806 includes a closure snap 1812 of a mitral valve and a
closure snap
of a tricuspid valve at: 1814. The second heart sound interval 1808 includes
an aortic
valve closure 1818 and 1820. 1820 is either a pulmonary valve closure andior
an
early ventricular refilling turbulence transient. As described above, the
diastolic
interval is the region of interest. The aforementioned heart sounds constitute
unwanted coronary events and are eliminated from the processing by placement
of the
time slots. The time intervals that are used for estimation of the vibrational
frequency
power spectra are pre first heart sound time slot 1816, diastolic interval
time slot 1
33
CA 02907400 2015-09-16
WO 2014/153265
PCT/US2014/029833
(1822), diastolic interval time slot 2 (1824), diastolic interval time slot 3
(1826),
diastolic interval time slot 4 (1828). A heart sound referred to as the fourth
heart
sound is indicated at 1830, which is caused by diastole refilling turbulence
transient.
1001071 The stack of one hundred and nine (109) vibrational cardiac data
measurements from Fil,,ture 18 are transformed to the frequency domain using
techniques such as the Fast Fourier Transform .(FFT), Other techniques can be
used
to transfonn to the frequency domain, the F.F.'T is used for example and does
not 'limit
embodiments of the invention,
1.00108j Figure 19 illustrates, generally at 1900, vibrational frequency
power
spectra estimates corresponding to a time slot 18.16 shown in Figure 18,
according to
embodiments of the invention. With reference to Figure 19, the one hundred and
nine (109) time slot 1 sub-intervals in the synchronized heart cycles are
Fourier
transformed and then the amplitude squared of the complex Fourier transforms
are
ensemble averaged for a given Channel, In one embodiment, the procedure is
repeated for each channel when an array of transducers is used to obtain the
vibrational cardiac data. The averaged vibrational frequency power spectrum
estimate for each channel is indicated .for a channel number at 1902 and is
plotted as a.
function of frequency on an axis 1.904. The corresponding normalized amplitude
is
indicated by grey scale with amplitude reference given at 1906 in decibels.
100109j The lower plot in Figure 19 displays the vibrational frequency
power
spectrum estimate obtained by averaging a subset of channels from 1902. In
this
case, channels one (1) through thirteen (13) from the fourteen (.14) channel
array are
averaged together. Frequency is indicated on a horizontal axis at 1908.
Spectrum
level is indicated on a vertical axis at 1910,
34
CA 02907400 2015-09-16
WO 2014/153265
PCT/US2014/029833
1001:101 The dominant feature of the spectral estimates is a low
frequency
plateau 1920. The low frequency plateau 1920 includes a relatively flat low
frequency region of the spectrum between approximately eighty (80) and two
hundred
(200) cycles per second (Hz). Above 200 Hz the spectrum rolls-off decreasing
at a
rate of 27 to 29 decibels/octave in the 200 to 400Hz octave. A decrease of 27
to 29
decibels is indicated at 1912 and the 200 to 400 Hz octave is indicated at
1916. This
plateau, in the 80 to 200 Hz band coincides with atrioventricular valve blood
flow
turbulence during ventricular refilling. The level and width of this plateau
is
proportional to a valve flow rate and therefore to flow velocity. Mechanisms
thr the
generation of this low frequency' flow energy is a combination of valve
vibration
.indueed by blood flow shedding from the valve flaps and valve jet flow
induced
pressure waves in the ventricles propagating to and exiting: the ventricle
heart wail.
The valve vibrational energy propagates by means of elastic waves in the walls
of the
heart Chamber. If there is other energy that is time coincident with the third
and
fourth heart sounds, e.g., 1820 and 1830 (Figure 18), then the correspondina
spectrum is masked by 1820 and .1830 (Figure 18). Power line artithcts of 60
Hz are
indicated at 1.918,
1001.111 Figure 20 illustrates, generally at 2000, a method for averaaing
vibrational frequency cardiac: data, according to embodiments of the
invention. With
reference to Figure 20, a method starts at a block 2002. At a block 2004, in
one
embodiment as described above in conjunction with Figure 1.9, an ensemble of
vibrational frequency power spectra estimates, corresponding to time slots in
the
synchronized 'heart cycles are averaged. Optionally at a block 2006, for each
channel
of an array, the resulting: plurality of time averaged vibrational frequency
power
spectra estimates are averaged together. In one embodiment, an example of such
CA 02907400 2015-09-16
WO 2014/153265
PCT/US2014/029833
averaging in time and transducer channel position space :is shown in. Figure
19 at
19.10. The process stops at a block 2008. Note that averaging vibrational
frequency
power speetra estimates can be performed an all or a subset of channels,
1001121 Figure 21 illustrates, generally at 2100, an overlay of space-
time
averaged vibrational frequency power spectra estimates .eatTesponding to data
from
Figure 18, according to embodiments of the invention. With reference to Figure
21,
the space-time averaged vibrational frequency power spectrum estimates 2118
are
plotted with frequency on an axis 2102 and spectrum 'level on an axis 2104. A
twenty
five (25) dB roll-off, indicated at 2106, occurs in the 200-400 Hz band
indicated at
2110 for the averaged pow in- spectrum estimate for time slot 2, indicated at
2124. A
28 dB roll-off, indicated at 2108, occurs in the 200-400 Hz band 2110 for the
averaged power spectrum estimate for time slot 1, indicated at 2122. Reference
point
2112 is the 3 dB down point from the low frequency plateau. Reference point
2112 is
used to measure the roll-offs described directly. above. Artifacts of 60 Hz
power line
harmonies are evident at 2116, Those of skill in the art will recognize that
such
narrow band 60 cycle artifacts are tolerable as long as they do not bias the
estimated
power spectral density (PST)) level outside of their narrow band.,
1001.1.31 Note that the spectrum roll-off of time slot 1 2122 in a band of
.frequency above 400 Itz is different between Figure 19 (pre mitral -valve
closure time
slot) and the roll-off shown in Figure 21. The spectrum rolls-off.more slowly
in the
band of frequency above 400 Hz in Figure 21 because in Figure 18 the time slot
4
interval captures the leading edge of the next mitral valve closure snap,
which
contributed to a very broad band of energy at higher frequencies. The spectrum
level
increase above 400 'Hz continues M frequency and is completely dominated. by
broad
band energy at: 2120. Valve closure snaps result in significant energy and
elevated
36
CA 02907400 2015-09-16
WO 2014/153265
PCT/US2014/029833
levels as can .he seen by 2120 which corresponds to capturing only a portion
of the
map in the .mitral valve closure snap by time slot 4 (1828 in Figure 18).
Thus, by
eliminating unwanted cardiac events such as bean valve open or close motions
the
energy that is due to blood flow turbulence can be detected by the procedure.
1.0-0114.1 With reference to Figure 21, the spectrum for time slot 1 2122
could
contain energy from the pulmonary .valve closure 1820 (Figure 18) and the
early.
ventricle refilling 1830 (Figure .18. The pulmonary valve snap will generate
broadband energy above 200 Hz which appears to be at a very low level because
this
band has the lowest spectrum level for all four time slots 211.8. The
ventricle refilling
will produce energy below 200 Hz because it results from the flow over the
strike of
the anioventricular valves which have relatively large surfaces of order
centimeters
with low curvatures relative to the inner dimensions of a coronary artery,
which has
dimensions of order millimeters with proportional curvatures,
[001151 The averaged spectrum level for time slot 2 is indicated at
2124, T One
slot 2 captures the trailing edge of ventricle refilling (S3), the leading
edge of S4 and
a quiet area which permits measurement of energy due to blood flow turbulence
in the
left coronary artery. A moderate strength spread spectrum energy swath is
indicated
at 2114. This swath has a center frequency of 350 Hz, a bandwidth of
approximately
60 Hz, and a signal-to-noise ratio (SNR) of approximately 8-10 dB, This
measurement indicates that energy generated from blood flow turbulence is
present in
symptom free humans with respect to coronary artery disease.
1001161 Time slot 2, shown. at 21.24, also indicates a low level of
spectrum
ripple. The ripple has a period of approximately 30 to 40 Hz and a peak-to-
valiey
amplitude differential of 2 to 3 dB as indicated at 2126. This effect is
consistent with
.interference pattern produced by energy propagating from a vibration source
to a
37
CA 02907400 2015-09-16
WO 2014/153265
PCT/US2014/029833
vibration transducer (measurement location) along more than a single path.
Phase
coherent energy arrivals on different paths can periodically suppress or
support each
other and a frequency spectrum ripple period of 30 to 40 Hz is consistent with
elastic
wave propagation speeds in tissue with multiple path length differences on the
order
of centimeters.
1001171 Figure 22 illustrates, generally at 2200, a set of time series
plots of
vibrational cardiac data collected from a clinically diagnosed individual with
a history
of coronary artery disease, according to embodiments of the invention. With
reference to Figure 22, the subject of the measurements presented in Figure 22
is a
male in his late sixties. Six months prior to the measurement, this man was
diagnosed
with total blockage of Left .Anterior Descending (LAD) coronary artery and
under vent a stein procedure that restored full LAD .flow. Presented in Figure
22 are
One hundred and four (104) synchronized heart cycle waveforms of vibrational
cardiac data. These data have been collected as previously described and, in
this
embodiment, an array of fourteen (.14) transducers was used to collect the
vibrational
cardiac data. The synchronized heart cycle waveforms exhibit a master replica
pair
wise correlation coefficient greater than 0.91.
1001.1.8i in Figure 22 time is plotted on an axis 2202 and amplitude is
plotted
on an axis 2204. A systolic interval is indicated at 2206 and a diastolic
interval is
indicated at 2208. In this embodiment, the diastolic interval 2208 has been
partitioned into four (4) overlapping time slots 2210, 2212, 214, and 2216.
Transformations from time to frequency are 'performed On each heart cycle
waveform
within each time slot. This process is repeated for each channel of the array
of
fourteen transducers.
38
CA 02907400 2015-09-16
WO 2014/153265
PCT/US2014/029833
1001:19.1 In one embodiment, for each channel, an. ensemble of power
spectrum
estimates are then averaged for the same time slot in each heart cycle. The
results of
the avmged time slot power spectrum estimates (time to frequency
transformations)
are shown in Figure 23 on a channel-by-channel basis with the time ensemble
average at the top and as a channel average across the array at: the bottom,
[00120j Figure 23 illustrates, generally at 2300, a set of vibrational
frequency
power spectra estimates corresponding to the time series from Figure 22,
according to
embodiments of the invention. With reference to Figure 23, each of the
averaged
spectral estimates for each channel are displayed at 2300 with frequency on an
axis at
2302, channel number on an axis 2304 and normalized spectrum level is
indicated at
2305 as gray scale. Thirteen of the tburteen time averaged channel spectrum
estimates from 2300 are averaged together and plotted in 2350 with frequency
on an
axis at 2352 and spectrum level on an axis 2354. Averaging as was done in both
time
(ensemble of heart cycles) and space (across channels) improves a sit-mai-to-
noise
ratio of the measurement. Such averaging is not always required and in some
embodiments with sufficient signal-to-noise ration (SNR), Meanin aid
information is
obtained from a single time to frequency transformation of a sing,le heart
cycle from.
one transducer,
1001211 The processed vibrittional frequency power spectrum estimate
plotted
in Figure 23 at 2350, corresponds to the first time slot 2210 (figure 22) in
the
diastolic interval 2208 (Figure 22). Features are present in 2350 that are
used to
id.entify coronary artery blood .flow turbulence, One feature is a low
frequency
plateau, which exists between approximately 80 and 150 Hz and is indicated at
2356.
This low frequency 'plateau is associated with valve flow as previously
discussed.
Another .feature is a low frequency roll-off from the plateau which occurs
between 80
39
CA 02907400 2015-09-16
WO 2014/153265
PCT/US2014/029833
and 150 Hz, The roll-off of the amplitude is 18 dB as indicated at 2358 over
the 200
to 400 Hz frequency octave. Another feature is a strong spread spectrum energy
swath which occurs at 2360. This strong swath is characterized by a center
frequency
of 230 Hz, a bandwidth of 80 Hz, and a signal-to-noise ratio of 18 dB. Yet
another
feature is a weak spread spectrum energy swath which occurs at 2362. This
weak.
swath is characterized by a center frequency of 365 Hz, a bandwidth of 55 Hz,
and a.
signal-to-noise ratio of 7 dB, .Another feature is a medium spread spectrum
energy
swath which occurs at 2364. This medium swath is characterized by a center
frequency of 570 Hz, a 'bandwidth of 100 Hz, and a signal-to-arise ratio of 8
dB.
Another feature is a frequency band-limited whistle at 2366. Whistle 2366 is
characterized by a center frequency of 805 Hz and amplitude of 8 dB. Another
feature is a difference in amplitude between the low frequency plateau 2356
and a
high frequency broad band level. This difference is approxim.ately 30 dB as
indicated.
at 2368. Several power line artifacts of 60 Hz are evident at 2370. These
power line
artifacts are not considered to be features.
100122i Figure 24 illustrates, generally at 2400, an overlay of
vibrational
frequency power spectra estimates from .multiple slots corresponding to the
human's
data shown in Figure 22, according to embodiments of the invention. With
reference
to Figure 24, time and channel averaged vibrational frequency power spectrum
estimates for each time slot (2210, 2212, 2214, and 2216 from Figure 22) are
plotted
on a graph with frequency on an axis 2402 and spectrum level on an axis 2404.
Time
slot 1, time slot 2, and time slot 3 contain feattires, the types of which
were described
above, which are associated with coronary artery blood flow turbulence and a
state of
health of a coronary artery. Time slot 4 (22.16 in Figure 22) contains valve
snap
energy and has been placed to capture part of the valve snap to illustrate the
fact that
CA 02907400 2015-09-16
WO 2014/153265
PCT/US2014/029833
the first three time slots (22.10, 2212, and 2214 from Figure 22) are
measuring blood
flow turbulence.
100123i Notably, the characteristics of some of the features exhibit
transient
behavior and have changed between time slot 1 and tittle slot 2. Similarly,
characteristics of features have also .changed between time slot I and time
slot 3 and
between slot 2 and slot 3. For example, a feature in time slot 1 is a strong
spread
spectrum swath 2406. This strong spread spectrum swath 2406 has a center
frequency of approximately 230 Hz and a bandwidth of approximately 90 Hz 2407.
in tifile SiOt 2, (2212) .the strong spread spectrum swath 2406 (from time
slot 1 2210)
has transformed into a frequency band 'limited whistle at 2408 with a center
frequency
of 200 1-17, at 2424. Another example of a feature changing between time slots
is
medium spread spectrum energy swath 2412 in time slot 2 (2212) transforming
into a
frequency band limited whistle 2414 in time slot 3 (2214). The estimated
center
frequency of the swath 2412 and the whistle 2414 is 390 Hz t.ts indicated at
2422.
100124j Extraction of fimtures, from such an individual and comparison of
the
characteristics of the features between time slots permits identification of a
state of
health of the individual's coronary artery or arteries. Changes in
characteristics of a
feature(s) from one time slot to another within a given human's vibrational
cardiac
data permits identification of a state of health of coronary arteries. Here,
note that in
Figure 22 the. clinically diagnosed. individual, who tmderwent the stein
procedure, has
turbulence inducing occluded arteries and a features which exhibit transient
behavior
between at least two time slots. .By comparing the features that exist in each
time slot
a transient event can he Wend fled and extracted and a determination can .be
made with
respect to a state of health of the associated coronary artery(s) regarding
the presence
of arterial blockage.
41
CA 02907400 2015-09-16
WO 2014/153265
PCT/US2014/029833
100125-1 Figure 25 illustrates, generally at 2500, a method for
identifying a
feature related to coronary artery blood flow turbulence using a single human,
according to embodiments of the invention. With reference to Figure 25, a
process
starts at a block 2502. At a block 2504, a diastolic interval of a heart cycle
is
partitioned into at least two time slots. At a block 2506 a time to frequency
transformation is performed on vibrational cardiac data collected from the
time slots
created in the block 2504. At a block 2508 one or more features and/or
characteristics
of the features that are associated with a transient event from blood flow
turbulence in
a coronary artery are identified. These transient: events are then analyzed to
determine.
a state of health of the human, .A process stops at a block 2510. In one or
more
embodiments, a monitoring paradigm for heart disease includes periodic
measurements made on an individual. Comparison of the individual's
measurements
over time will indicate an increase in blood flow turbulence energy if the
individuals
state of coronary artery health declines. Such comparison can be performed
with the
individual's own data, as described above M conjunction with Figure 25, or in
other
embodiments; comparison can be made with blood flow turbulence measurements
made from known clinically diagnosed states, as described below.
100126i Figure 26 illustrates, generally at 2600, a comparison of
vibrational
cardiac data From multiple humans, according; to embodiments of the invention.
With
reference to Figure 26, frequency is plotted on an axis at 2602 and spectrum
level is
plotted on an axis at 2604. The vibrational cardiac data plotted in Figure 26
are the
time and channel averaged vibrational frequency power spectrum estimates for
time
slot 1 (for the symptom free 'person at 2630) data previously shown in Figure
21 and
the person whose coronary arteries indicate coronary artery turbulence at
2620, which
42
CA 02907400 2015-09-16
WO 2014/153265
PCT/US2014/029833
are data previously shown in. Figure 23 and Figure 24 (2210) for the
clinically
diagnosed individual.
100127i The low frequency plateau was previously described for 2630 in
Figure 19 as extending from 90 to 180 Hz. The location of the strong spread
spectrum energy swath 2606 slightly obscures the high frequency end of the low
frequency plateau; however the low frequency plate:au for both 2620 and 2630
are
substantially equivalent in amplitude.
1001281 The roll-off of the low frequency plateau diffe.rs between the
symptom
free person's inea.surentent 2620 and the clinically diagnosed person's
:measure:merit
2630, For 2630 the roll-off is 24 dB indicated. at 2612. For 2620 the roll-off
is 17 dB
indicated at 2614.
1901291 The spread spectrum energy swath bandwidths are 90 Hz for 2606,
110
Tiz for 2608, and 11.0 Hz.: for 2610. Spread specum energy swath 2606 has a
center
frequency of 230 Hz at 2616; spread spectrum energy swath 2610 has a center
frequency of 570 Hz at 2618. The signal-to-noise ratio :for spread spectrum
swath.
2606 is 19 dB and the spread spectrum swath 2610 has a signai-to-noise ratio
of 9 dB,
100130j Figure 27 illustrates, generally at 2700, a method .for
identifying a
feature related to coronary artery blood flow turbulence using multiple
humans,
according to embodiments of the invention. With reference to Figure 27, a
process
starts at a block 2702. At a block 2704 a time to frequency transformation
performed on vibrational cardiac data collected during a diastolic interval of
a heart
cycle, thereby resultin,g M. a vibrational =frequency power spectrum estimate.
At a
block 2706 a feature(s) is extracted from the vibrational .frequency power
spectrum.
estimate with the aid of previously identified and clinically verified
features that are
43
CA 02907400 2015-09-16
WO 2014/153265
PCT/US2014/029833
related to blood flow turbulence in a coronary artery and the related
condition of
health of the coronary artery.
IOO131 Following the teaching .presented in the figures above, in
various
embodiments, process block 2706 includes a plurality of measurements, which
can be
referred to as a library of measurements. The library of measurements thus
created
contains different features (with their associated characteristics) of blood
flow
turbulence in the frequency domain that are associated with different
conditions of
health of coronary arteries in clinically verified cases. These features are
also referred
to as "signatures" of blood flow turbulence and the associated pathology. Note
that
blood flow turbulence is not always associated with a diseased condition. At
times, a
measure of blood flow turbulence indicates a healthy condition (refer to
Figure 19
and Figure 21). Note that in different embodiments, databases of library
measurements can be assembled in different ways according to the teachings
presented herein. For example, a database can be 'based on transients that
occur
during diastole. A database(S) can be assembled based on symptom free
individuals,
thereby establishing a plurality of measurements of healthy conditions. A
database(s)
can be assembled that is based on features and their characteristics that are
associated
with clinically .verified known pathologies, Le., degree of blockage of an
artery's
cross-section, presence of a stent or lack thereof, etc. Data.bases can be
combined to
form databases that combine self-evaluation changes in spectral content from
one
time Slot to another time slot within a diastolic interval along with
comparison
measurements from data collected on a population of humans. Thus, apparatuses
and.
methods have been described which permit a condition of health of a human's
coronary artery(s) to be evaluated non-invasively.
44
CA 02907400 2015-09-16
WO 2014/153265
PCT/US2014/029833
I00132] For purposes of discussing and understanding the embodiments of
the
invention, it is to be understood that .various terms are used by those
knowledgeable
in the art to describe techniques and..approachcs. 'Furthermore, in the
description, thr
purposes of explanation, numerous specific details are set fsorth in order to
provide a.
thorough understanding of the present invention. It will be evident, however,
to one
of ordinary skill in the art that the present invention may be practiced
without these
specific details. In some instances, well-known structures and devices are
Shown in
block diagram form, rather than in detail, in order to avoid obscuring the
present
invention. These embodiments are described in sufficient detail to enable
those of
ordinary skill in the art to practice the invention, and it is to be
understood that other
embodiments may be utilized and that logical, .mcehanical, electrical, and
other
changes may he made without departing from the scope of the present invention.
Pin] Some portions of the description may he presented in terms of
algorithms and symbolic representations of operations on, for example, data
bits
within a computer memory. These algorithmic descriptions and representations
are
the means .used by those of ordinary skill in the data processing arts to most
effectively convey the substance of their work to others of ordinary skill in
the art.
An algorithm is here, and generally, conceived to be a self-consistent
sequence of acts
leading to a desired. result. The acts are those requiring physical
manipulations of
physical quantities. Usually, though not .necessarily, these quantities take
the form of
electrical or magnetic., signals capable of being stored, transferred,
combined,
compared, and otherwise manipulated. It has proven convenient at times,
principally
for reasons of common usage, to refer to these signals as bits, values,
elements,
symbols, characters, terms, numbers, waveforms, data, time series or the like.
CA 02907400 2015-09-16
WO 2014/153265
PCT/US2014/029833
I00134] it should be borne in mind, however, that all of these and
similar terms
are to be associated with the appropriate physical quantities and are incre1y
convenient labels applied to these quantities. Unless specifically stated
otherwise as
apparent from the discussion, it is appreciated that throughout the
description,
discussions utilizing terms such as "processing" or "computing" or
"calculating" or
"determining" or "displaying" or the like, can .refer to the action and
processes of a
computer system, or similar electronic computing device, that manipulates and
transforms data .represented as physical (electronic) quantities within the
computer
system's registers and memories into other data similarly represented as
physical
quantities within the computer system memories or registers or other such
information
storage, transmission, or display devices.
[00135] An apparatus for perfonnina the operations herein can implement
the
present invention. This apparatus may be specially constructed for the
required
purposes, or it may comprise a general-purpose computer, selectively activated
or
reconfigured by a computer program stored in the computer. Such a computer
program may be stored in a computer readable storage medium, such as, but not
limited to, any type of disk including floppy disks, hard disks, optical
disks, compact
disk read-only memories (CD-ROMs), and magnetic-optical disks, read-only
memories (ROMs), random access memories (RAMA electrically programmable
read-only memories (EPROM)s, electrically erasable programmable read-only
memories (E.EPROMs), FLASH memories, magnetic or optical cards, etc., or any
type of media suitable for storing electronic instructions either local to the
computer
or remote to the computer,
[00130] The algorithms and displays presented: herein are not inherently
related
to any particular computer or other apparatus. Various general-purpose systems
may
46
CA 02907400 2015-09-16
WO 2014/153265
PCT/US2014/029833
be used with programs in accordance with the teachings herein, or it may prove
convenient to construct more specialized apparatus to perform the required
method.
For example, any of the methods according to the present invention can be
implemented in hard-wired circuitry, by programming a general-purpose
processor, or
by any combination of hardware and software. One of ordinary skill in the art
will.
immediately appreciate that the invention can be practiced with computer
system
configurations other than those described, including hand-held devices,
multiprocessor systems, microprocessor-based or programmable consumer
electronics, digital signal processing (DSP) devices, network PCs,
minicomputers,
mainframe computers, and the like. The invention CUI also be practiced in
distributed
computing environments where tasks are performed by remote processing devices
that are linked through a communications network.
1001371 The methods of the invention may be implemented using computer
software. If written in a programming language contbrming to a recognized
standard,
sequences of instructions designed. to implement the methods can be compiled
for
execution on a variety of hardware platforms and for interface to a variety of
operating systems. In addition, the present invention is not described with
reference
to any particular programming language. It will be appreciated that a variety
of
programming languages may be used to implement the teachings of the invention
as
described herein. Furthermore, it is common in the art to speak of software,
in one
form or another (e.g., program, procedure, application, driver,...), as taking
an action
or causing, a result. Such expressions are merely a shorthand way of saying
that
execution of the software by a computer causes the processor of the computer
to
perform an action or produce a result.
47
CA 02907400 2015-09-16
WO 2014/153265
PCT/US2014/029833
100138j it is to be understood that various terms and techniques are used
by
those knowledgeable in the art to describe communications, protocols,
applications,
implementations, mechanisms., etc. One such technique is the description of an
implementation of a technique in terms of an algorithm or mathematical
expression.
That is, while the technique .may be, for example, implemented as executing
code On a.
computer, the expression of that technique may be more aptly and succinctly
conveyed and communicated as a formula, algorithm, mathematical expression,
flow
diagram or flow chart. Thus, one of ordinary skill in the an would recognize a
block
denoting A-1-13,C as an additive function whose implementation in hardware
anti/or
software would take two inputs (A and 13) and produce a summation output (C).
Thus, the use of formula, algorithm, or mathematical expression as
descriptions is to
be understood as baying a physical embodiment in at least hardware and/or
software
(such as a computer system in which the techniques of the present invention
may be
practiced as well as implemented as an embodiment).
100139j A machine-readable medium is understood to include any mechanism
for storing or transmitting information in a form readable by a machine
.(e.g., a
computer). For example, a machine-readable medium includes read only .memory
(ROM); random access memory (RAM); magnetic disk storage .media; optical
storage
media; flash memory devices; electrical, optical, acoustical or other form of
propagated signals (e.g., carrier waves, infrared signals, digital signals,
etc.); etc.
1001401 As used in this description, "one embodiment" or "an embodiment"
or
similar phrases means that the feature(s) being described are included in at
least one
embodiment of the invention. References to "one embodiment" in this
description do
not necessarily refer to the same embodiment; 'however, neither are such
embodiments
mutually exclusive. Nor does -one embodiment" imply that there is but a single
48
CA 02907400 2015-09-16
WO 2014/153265
PCT/US2014/029833
embodiment of the invention. For example, a feature, structure, act, etc.
described in
"one embodiment" may also be included in other embodiments. Thus, the
invention
may include a variety of combinations and/or integrations of the embodiments
described herein..
1001411 'While the invention has been described in terms of several
embodiments, those of skill in the art will recognize that the invention is
not limited
to the embodiments described, but can he practiced with modification and
alteration
within the spirit and scope of the appended claims. The description is thus to
be
regarded as illustrative instead of limiting.
49