Note: Descriptions are shown in the official language in which they were submitted.
= CA 02911744 2015-11-04
DESCRIPTION
Title of the Invention
A method of measuring cancer related substances by Raman spectroscopy
Technical Field
[0001] The present invention relates to a method of measuring cancer-related
substances which increases in blood with the progress of cancer, including
mainly a free DNA (DNA wrapped around the histones) as a target to be
measured by Raman spectroscopy.
Background Art
[0002] A method of measuring a cancer-related substance which increases in
the blood with the progress of the cancer, has hitherto been used as one of
the
diagnostic methods for cancer. The cancer-related substances referred to
proteins and the like, which are cancer-specific substances extracted from a
body fluid of cancer patients and are generally educed into the blood when the
cancer cells are destroyed. According to the prior diagnostic methods of the
cancer, it is determined that there is a possibility that the test subject or
patient is
suffering from cancer when more than a determined value of the cancer-related
substance is found existing in the blood
[0003] Thus as the cancer-related substance educed into the blood by
destruction of the cancer cells, it is known that not only proteins but also
DNA
may be educed into the blood. And, when compared with the healthy subjects
and cancer patients, it has been reported that the amount of the free DNA
1
CA 02911744 2015-11-04
(ctDNA) derived from cancer cells in blood, is significantly more in those
cancer
patients than healthy individuals. Thus, by quantifying the free DNA of cancer
cells from the body fluid such as blood, it is considered to be able to
diagnose
the presence of cancer . As such a method of cancer diagnosis, for example,
there are proposed 1) a method of diagnosing a possibility of cancer in case
of
detecting 200bp or more DNA to be amplified by the polymerase chain reaction
(PCR) method and the like, in the body fluid or feces discharged from the
body,
and further analyzing a mutation in its DNA if necessary,(Patent Document 1
and
2) and 2) a method of quantifying genomic DNA contained in a body fluid, and
further performing DNA testing in the case of more than a predetermined value
of the genomic DNA (Patent Document 3).
[0004] Incidentally, even if the patient is diagnosed suffering from cancer,
mere
quantitative analysis of the DNA in body fluids is unable to to identify a
cancer
suffering organ . When the cancer is arising and progressing, it is known that
a
specific mutation of DNA occurs depending on the original cancer site.
Therefore,
by clarifying the type of mutation in the DNA, it may be possible to identify
an
organ or a cancer site where the cancer is developing. Here, as Mutations of
DNA, there are listed up a point mutation of DNA, and also a structural
abnormalities such as chromosome gain or loss. For example, in about 70% of
pancreatic cancer, it is known that the point mutation occurs in the K-ras
gene.
Also, in the analysis of loss of heterozygous, (hereinafter referred to as
LOH)
there have been reported the loss of specific chromosomal arms depending on
each cancer type, for example, it is known that LOH is concentrated on the
short
arm of chromosome 3 in case of the lung cancer. Also, the amplification of
long
2
CA 02911744 2015-11-04
a
arm No. 8 of chromosome and the amplification of RB2 are known in the breast
cancer, Therefore, in order to provide an improved method for diagnosing
cancer with high accuracy by quantifying the free DNA from cancer cells, there
has been provided a method of diagnosing cancer, which comprises a step of
extracting a free DNA from plasma collected from a subject, a step of
calculating
the free DNA per unit volume of the extracted plasma by quantifying the free
DNA, a step of comparing the calculated value of the free DNA with a second
threshold value more than the first threshold value, a step of making a
diagnose
as follows; the subject has a high possibility of affection with cancer when
the
calculated value is less than the first threshold value, while some DNA from
normal cells are mixed in the plasma when the above threshold is more than the
second threshold value (patent document 4).
The Prior Technical Art
[0005] PATENT LITERATURE
Patent document 1 :US Pat. No. 6143529
Patent document 2 :US Pat. No. 2004 / 0259101A1
Patent document 3 : WO 2008/090930
Patent document 4: Patent Publication No. 2011-81001
[0006] However, for example, even if we would try to quantify the free DNA
derived from cancer cells in a whole blood, whereas a trace amount of the free
3
CA 02911744 2015-11-04
DNA is contained therein, a large amount of the DNA comes from the
lymphocytes derived from normal cells. Accordingly, even if DNA can be
directly extracted from a whole blood, it is difficult to quantify the free
DNA
derived from cancer cells exactly. Therefore, for example, by using a plasma
that has been separated from the whole blood, it is considered to provide a
method of quantifying the free DNA derived from the cancer cells in the
plasma,
but depending on the extraction method of DNA, the DNA derived from the
normal cells from such as lymphocytes might be incorporated with the free DNA
derived from the cancer cells, so that not only the free DNA derived from the
cancer cells but also the DNA derived from the normal cells are to be
qualified
together, resulting in a cause for error diagnosis of cancer. Therefore, in
proceeding an accurate diagnosis of cancer, it is important to accurately
quantify
the free DNA (hereinafter referred to the DNA wound around the histones in the
present invention) derived from cancer cells, so that it is necessary to
provide
how to extract the free DNA simply and rapidly and how to remove the DNA from
normal cells in order to improve the detection accuracy of the free DNA
derived
from cancer, and also how to detect a trace amount of DNA precisely for the
appropriate diagnosis of cancer.
[0007] By the way, the Raman spectroscopy has been used for analyzing a
trace amounts of DNA in the blood, and is promising for qualitative and
quantitative detection tools, but SERS phenomena is not only, 1) the mechanism
is not understood perfectly ,but also 2) it is exactly difficult to synthesis
and
control a structurally defined nano-materials for SERS, 3) there are a lot of
the
problems to be solved from the aspect of reproducibility and reliability due
to
4
CA 02911744 2015-11-04
change of the enhanced efficiency by the polarization direction and the
wavelength of an exciting light used at the time of measuring the spectrum,
which remains as a big problem for the application of SERS phenomena,
including the development and commercialization of the biosensor. Therefore,
a hybrid structure of the nano-wires and nano-particles has been proposed in
order to enhance SERS signals of biological extracts, proteins and
bio-molecules such as DNA and to improve the reproducibility, the sensitivity
and the reliability of the measurement of SERS signals (Patent Document 4).
However, the hybrid structure of the nano-wires and the nano-particles is used
for trapping the object to be measured via some receptors, so that it is not
still
appropriate as a method of detecting a trace amount of the free DNA from the
cancer cells.
Summary of Invention
Technical Problem
[0008] After our sharp researches considering the above problems, the present
inventors have found that the necessary target to be directly detected should
the
cancer related substances such as the free DNA derived from cancer cells,
which increase in blood with progress of the cancer when the cancer is
susceptible and it is considered best to detect directly the free DNA without
using any receptors
[0009] Here, the free DNA to be detected is a DNA wound around the protein
called histones, which wound unit structure (1 set) is called a nucleosome and
CA 02911744 2015-11-04
the structure which comes to a string shape of nucleosome gathered is called a
chromatin (fibers). And, when the cells were into a cancerous state and
divided
repeatedly, DNA becomes to be wrapped around the histone not so as to come
out the genes (tumor suppressor gene) inconvenient to increase the cancer and
the DNA winding onto the histone becomes more tightly by methylation not so as
to make the DNA loosen from the histones easily. Usually the histones are
charged as (+), while the DNA is charged as (-) , so that the two are stuck as
a
magnet and the methylation makes the two not to be untied easily where the
methylated DNA wound around the histones is charged to the ( + ) state (see
Fig.
11(a)). On the other hand, acetylation makes histone changed into charge ( -
),
so that DNA of ( -) becomes to act repulsively to the histones changed into
the
( - ) state by the acetylation, resulting in expression of genes due to the
unwound
mechanism of the 'thread' of DNA from the histones (see Fig. 11(b)).
Therefore, in order to selectively adsorb or trap the free DNA derived from
cancer cells as the DNA wound around the histones , the substrate to absorb or
trap the cancer related substances ( +) in the sample is preferably considered
to
have a state of charge( -) .in the sample for analysis.
Solution to Problem
[0010] Meanwhile, the present inventors have found that, on the metal
substrate having a less noble electrode potential (large ionization tendency)
than
that of a metal forming a metal complex in the metal complex aqueous solution,
an electro-chemical reduction occurs due to the electrode potential difference
between the metal substrate and the metal complex, resulting in deposition and
6
CA 02911744 2015-11-04
aggregation of the metal complex from the aqueous solution onto the metal
substrate to form quantum crystals (nano-sized metal complex crystals). In
case of silver complex, the silver complex can be formed as quantum crystals
of
silver complex due to an electro-chemical reduction on copper or copper alloy
of
less noble electrode potential (large ionization tendency) than that of silver
in a
silver thiosulfate aqueous solution. Specifically, the concentration of the
metal
complex in the aqueous solution should be determined by considering the size
of
the quantum crystals to be formed mainly and, where a dispersing agent is
used,
its concentration has to be considered. While the complex concentration can
be usually used from 100 ppm to 5000 ppm, 500 to 2000 ppm of such
concentration is preferably used in order to prepare nano-sized crystals
called a
nano-cluster depending on the functionality of the ligand. Metal complex to be
formed as a quantum crystal may be selected to have a complex stability
constant (logP) of the formula ( I ) correlating with the electrode potential
E of
the substrate metal.
Formula ( I ): E = (RT / I Z F) In (I3; )
where E is the standard electrode potential, R is the gas constant, T is the
absolute temperature, Z is the ion valence, F represents the Faraday constant.
If the metal complexes is selected from the group consisting of plasmon metals
such as Au, Ag, Pt and Pd, the plasmon metals have a function of localized
surface plasmon resonance enhancement effect for the Raman light. In
particular, when the metal complex is a silver complex, the complex may be
formed by reaction of silver complexing agent having a stability constant
(formation constant) (log 80 of 8 or more with a silver halide, where a silver
halide
7
CA 02911744 2015-11-04
,
may be preferably selected as the halides and the complexing agent may be
preferably selected from the group consisting of thiosulfate salt, thiocyanate
salt,
sulfite salt, thiourea salt, potassium iodide salt, thiosalicylic acid salt,
and
thiocyanuric acid salt. In case of silver complex, the resulting quantum
crystal
has quantum dots made of nano-cluster having an average diameter of 5 -
20nm, so that the size of the quantum crystal will be in a range of 100 -
200nm.
[0011] The inventors of the present invention have found that such silver
complex can be changed by means of alkali treatment in the presence of
halogen ions (for example treatment with sodium hypochlorite) according to the
following reaction into nano-crystals of silver oxides composite comprising a
silver peroxide and silver halide as cores (see Fig. 9), which shows the ( - )
charge in water while the DNA wound around the histones shows the (+) charge
(Fig. 11(a)), so that the cancer related substance represented by the free DNA
having a positive charge was found to selectively be adsorbed. The inventors
of the present invention have also found that the acicular nano-crystals of
silver
oxides composite containing a silver peroxide can be reduced by irradiation of
an exciting laser beam, into a metallic silver, results in that the metallic
silver
shows the surface plasmon enhancement effect by the laser beam irradiation,
and thereby the cancer related substances represented by the trapped free DNA
becomes to be able to be detected by Surface Enhanced Raman Scattering
(SERS) .
Na 2 S 2 0 3 + 4NaCIO + H 2 0 --- Na 2S0 4 + H 2 SO4 + 4NaCI
Ag+ + NaCl -* AgCI + Na +
Ag 1- + 3NaOCI--* 2AgCI + NaCIO 3 + 2Na +
8
Ag + OH- Ag0H
2Ag ++ 20H Ag 2 0 H 2 0 (see US Pat. No. 4,478,943)
[0012] The present invention is based on the above findings and is intended to
provide a bio-chip for measuring cancer related substances, which bio-chip is
provided with a region containing a composite of acicular nano-crystals of
silver
oxide comprising silver halide or halogen, which has properties for showing a
negative charge ( - ) in water in order to adsorb cancer related substances
having a positive charge (+) and form a charge transfer complex therefrom. On
the other hand, the composite of acicular nano-crystals of silver oxide can be
changed into metallic silver nano-particles by a laser light irradiation,
resulting in
making a region where the surface plasmon enhancement effect is obtained by
the laser irradiation.
[0012a] In accordance with one aspect there is provided a method of measuring
the quantity of cancer related substances by Surface Enhanced Raman
Scattering (SERS), which comprises steps of preparing a biochip having a
meso- crystal region of silver oxides containing a silver peroxide, adding
dropwise a serum or biological liquid sample to the mesa-crystal region of the
biochip, selectively trapping cancer related substance having a positive
charge
in the sample, irradiating an exciting light such as laser to the trapped
cancer
related substances and detecting the surface enhanced Raman scattering light.
[0012b] In accordance with another aspect there is provided a method of
preparing
a meso-crystal region of silver oxides containing a silver peroxide on a Cu or
9
CA 2911744 2019-01-23
Cu alloy carrier; providing a metal complex aqueous solution having a silver
complex content of 500 to 2000ppm; adding the silver complex aqueous solution
on the carrier to form a quantum crystal of the silver complex; and
re-crystallizing the quantum crystal into a meso-crystal comprising silver
oxides
containing a silver peroxide by an alkali treatment in presence of halogen
ion.
Advantageous Effects of Invention
10013] The composite of acicular nano-crystals of the silver oxide according
to
the present invention, in which silver oxide contains silver peroxides to be
self-assembled into a neurons form three-dimensional super-structure
(hereinafter called a meso crystal in the present invention) (FIGS. 12 and
13),
although an Ag I AgCI electrode is subjected to a controlled-potential
electrolysis
in a silver ion aqueous solution to get the meso-crystal of silver oxide
containing
silver peroxides, silver complex quantum crystals. For example, silver
thiosulfate
quantum crystals are subjected to an alkali treatment with sodium hypochlorite
solutions in the presence of halogen ions to obtain the silver oxide meso-
crystals.
9a
CA 2911744 2019-01-23
CA 02911744 2015-11-04
[0014] According to the present invention, the utilization of the biochip of
the
present invention brings about such an advantage that the Raman analysis of
biological samples containing the blood makes it possible to quantify
cancer-related substances, such as the free DNA. Specifically, using the
composite needle nano-crystals of silver oxide comprising silver halide or
halogen, that is, the biochip having a meso crystal region of the silver oxide
containing peroxide of silver (FIGS. 12 and 13), the serum or biological
liquid
sample is dropped onto the biochip so that the cancer related substances in
the
serum may be selectively trapped because the cancer related substances have
a positive charge in the sample. The Raman scattering from the cancer related
substances is subsequently enhanced by the effect of SERS and detected.
Therefore, it is possible to determine the cancer disease by the intensity of
surface enhanced Raman scattering (SERS).
[0015] The cancer related substances in serum include DNA wound around
histone derived from cancer cells (referred to as the free DNA in the present
invention), a nucleosome of unit structure (1 set) and a chromatin (fibers)
which
is a string-like structure of nucleosome. Although the serum includes globulin
having a positive charge, the increase of globulin is at largest up to two
times or
less and, since the cancer procession may result in the increase of the
cancer-related substances detected by the biochip of the present ivnention
reaching up to 100 times or more, it shows the detection of the increase of
the
substance (cancer cell originating free DNA). Furthermore, DNA leaving from
the normal cells, DNA leaving from histones by acetylation and albumin
altogether account for approximately 60% of serum, however, in order to take
CA 02911744 2015-11-04
on a negative charge, they will not be trapped in the practice of the present
invention. Therefore, it is advantageous for quantitative examination of the
cancer related substances.
[0016] Moreover, the needle-like nano-crystals used in the practice of the
present invention (meso crystals of silver oxide containing peroxide of
silver)
tend to be easily negatively charged in an aqueous solution and, therefore, it
appears that the meso-crystals according to the present inventionmay form a
charge transfer complex in contact with the target molecules such as cancer
related substances. Furthermore, the silver oxide is reduced upon receipt of
the
light energy to thereby being changed into a metallic silverand, therefore,
the
surface plasmon resonance enhancement effect peculiar to the regularly
arranged metallic nano-particles may occurs on the meso-crystals. Thus, the
acicular nanocrystals (meso crystal) of the present invention, although being
a
non-metal compound, is provided with metal properties and ionization
properties
concurrently and, therefore, the present invention can provide a suitable
biochips for measurement of surface enhanced Raman scattering (SERS).
[0017] Metal complex to form a quantum crystal is selected to have a complex
stability constant (logf3) of the formula (I) to correlate the electrode
potential E
of the supported metal.
Formula (I): E = (RT IlZ1 F) In (6i)
Where E is the standard electrode potential, R is the gas constant, T is
absolute
temperature, Z is the ion valence, F represents the Faraday constant.)
In case that the metal complexes is selected from the group consisting of
11
CA 02911744 2015-11-04
plasmon metals such as Au, Ag, Pt and Pd, the plasmon metals have a function
of localized surface plasmon resonance enhancement effect for the Raman light.
In particular, when the metal complex is a silver complex, the complex may be
formed by reaction of silver complexing agent having a stability constant
(formation constant) (log 89 of 8 or more with a silver halide, where a silver
halide
may be preferably selected as the halide and the complexing agent may be
preferably selected from the group consisting of thiosulfate salt, thiocyanate
salt,
sulfite salt, thiourea salt, potassium iodide salt, thiosalicylic acid salt,
and
thiocyanuric acid salt. In case of the silver complex, the resulting quantum
crystal has quantum dots made of nano-cluster having average diameter of 5 ¨
20nm, so that the size of the quantum crystal will be in a range of 100¨
200nm.
[0021] The concentration of the metal complex in the aqueous solution should
be determined depending on the size of the quantum crystals mainly, and, where
a dispersing agent is used, the concentration of the dispersing agent should
be
considered correspondingly. Typically, although the metal complex in the
aqueous solution can be used in the range of 100ppm to 5000ppmõ the
concentration in the range of 500 to 2000ppm is rather preferred where
nano-sized particles called as the nano-cluster is desired to be prepared
depending on the functionality of the ligand.
[0022] The quantum crystals formed on a metal substrate or metal particles are
believed likely tohave a positive polarity in an aqueous solution as a metal
complex crystalsand, in order to allow the protein in a biological sample to
be
adsorbed, the polarity is preferably adjusted by means of an alkali treatment
n
12
CA 02911744 2015-11-04
the presence of halide ions, for example, by dropping sodium hypochlorite
solution of pH11 or higher thereon. By so doing, the quantum crystals is
re-crystallized not only to have a negative polarity in an aqueous solution
but
also to form the composite needle nano-crystalline comprising silver oxide
including peroxides, wherein a sample of cancer related substances derived
from the cancer cells with a positively charged is possible to facilitate the
immobilization of the free DNA.
[0023] Determination of the total protein concentration in a biological sample
can be measured by obtaining the Raman spectrum resulting from irradiation
ofthe laser beam of a specific wavelength. Fig. 3 is a Raman spectrum wherein
a serum sample of colon cancer patients is diluted 10-fold, 100-fold, 500-
fold,
1000-fold and10000-fold with pure water and measured by 633nm laser (30mW),
to obtain peak rising value (PSV) and peak integration value, which change
with
concentration. Therefore, it will readily be understood that the quantitative
analysis of the total protein in the serum can be accomplished. In the Raman
spectrum, particular peaks are observed in carbon-specific G band(1300
1400cm -1 vicinity) and D band (in the vicinity of 1550 ¨ 1600cm -1), and a
peak
can also be observed in the vicinity of -1 specific 2900cm to methyl group.
The
observation of the peaks in the Raman spectrum as discussed above appears to
suggest that the methylation state of to DNA wound around histones could have
been detected as a cancer related substances.
[0024] Therefore, it is possible to analyze the identification and progress of
cancer from information such as the peak height, the peak integral values and
13
CA 02911744 2015-11-04
the peak onset time of the resulting Raman spectrum. FIG. 1 shows a peak
calculation method of Raman waveform, wherein from the spectrum of Raman
scattering by 633nm laser of human serum samples it is confirmed to form the
peak of the scattering intensity in the vicinity of 1350cm -1 vicinity and
1550cm
Thus, on the basis of average value (m) between 800cm -1 (a) and 2000cm -1 (b)
of scattering intensity, the (p-m) peak rising value was defined as (Shifting
Peak
Value PSV) . The entire area of the peak was as the integral value. These
peaks rise value and peak integral value are important in view of the cancer
related substances in human serum, it is possible to be an indicator of the
identification and progression of cancer in conjunction with peak onset time.
Brief Description of Drawings
[0025] Fig.1 shows a method of calculating peaks in the Raman wave, in which
spectra of the Raman scattering by 633nm laser of human serum samples
indicates the formation of a peak of scattering intensity in the vicinity of
1350cm
-1 and around 1550cm -1.
Fig.2A is a Raman spectral diagram of a sample by adjusting the sera obtained
from 12 cases of stomach cancer patients.
Fig.2B is a Raman spectral diagram of a sample by adjusting the sera obtained
from 12 cases of colorectal cancer patients.
Fig.2C is a Raman spectral diagram of a sample by adjusting the sera obtained
from 12 cases of benign disease patients.
14
CA 02911744 2015-11-04
Fig.2D is a graph showing a comparison of Raman scattering peak rising value
of stomach cancer, colorectal cancer, and benign disease sample.
Fig.3 is the Raman spectrum showing the relationship between diluted samples
and the Raman scattering intensity where the diluted samples are obtained from
12 cases of colon cancer patients, which shows that the scattering intensity
peak
rising value and the sample concentration are correlative each other.
Fig.4 is an explanatory diagram showing a making procedure of the present
inventive new SERS substrate shown in Example 1, wherein an upper left
photograph shows a substrate of Mytec Co. Ltd. with the SEM image.
Fig.5 is a photograph showing various SEM images of the nano-particle
aggregate (quantum crystal) prepared in Example 1.
Fig.6 is a photograph showing an enlarged SEM image of a nano-particle.
Fig.7 Is a photograph showing the relationship between quantum crystal shapes
and standing times after dropping on the phosphor bronze substrate.
Fig.8 is a graph showing a result of EDS spectra analysis of quantum crystals
(elemental analysis).
Fig.9 Is a photograph showing SEM image of quantum crystals alkali-treated in
the presence of a halogen ion (Sodium hypochlorite treatment).
Fig.10A is a photograph showing needle-like crystals of the alkali-treated
quantum crystals.
CA 02911744 2015-11-04
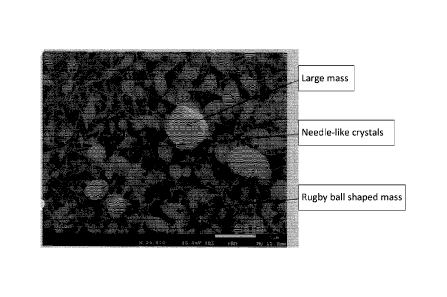
Fig.10B is a photograph showing a rugby ball-shaped mass in the .needle-like
crystals.
Fig.10C is a graph showing a result of EDS spectra of large mass (elemental
analysis).
Fig.11 is functional illustration views showing a state of the methylated free
DNA
(a) and a state of acetylated DNA (b).
Fig.12 is a view (top) of SEM image showing a re-crystallized substrate which
is
the quantum crystal substrate alkali treated in the presence of a halogen ion
(Sodium hypochlorite treatment) (top view) and a graph (below) showing a
result
(elemental analysis) of the EDS spectra of the re-crystallized substrate.
Fig.13 is a graph showing a result of XPS measurement of the
alkali-treated .recrystallization substrate.
Fig.14 is a graph showing a result of XPS measurements after etching the
surface of the recrystallization substrate.
Description of Embodiments
[0026] Hereinafter, the present invention will be demonstrated by way of
examples that are to be understood as provided only for illustration and not
intended to limit the scope of the present invention.
(Example 1)
As shown in Figure 4, an aqueous solution containing 1000ppm of silver
16
CA 02911744 2015-11-04
thiosulfate was prepare and the 1 drop was added dropwise onto a phosphor
bronze plate. After the phosphor bronze plate with the aqueous solution drop
thereon has been left standing for about 3 minutes, the solution on the plate
was
blown off. On the plate, a quantum crystals was obtained as shown in the SEM
image at the right side of Fig.4..
Fig. 5 is a photograph showing various SEM images of the nano-particle
aggregate prepared in Example 1 (quantum crystal), and Fig. 6 shows an
enlarged SEM image of nano-particles where there were thin hexagonal
columnar crystals of 100 nm more or less and having an unevenness surface of
several nm order. We could not find out any specific facets of metal
nano-crystals in the quantum crystals.
Figure 7 is a microphotograph showing the relationship between quantum crystal
shapes and the standing time after dropping onto the phosphor bronze
substrate,
where it is recognized that firstly, a hexagonal quantum crystal is produced
and
then growing while maintaining the crystal shape.
Fig. 8 is a graph showing results of EDS spectra (elemental analysis).of the
quantum crystals where not only silver but also elements derived from complex
ligands can be detected in case of the quantum crystal on the phosphor bronze
substrate, while only silver can be detected in the case of the quantum
crystals
formed on a copper plate by using 1000ppm of silver thiosulfate in aqueous
solution and keeping it for the standing time of 3 minutes after dropping onto
the
copper substrates.
[0027] (Discussion on formation of the quantum crystal)
In case of 1000ppm of silver thiosulfate complex in an aqueous solution,
17
CA 02911744 2015-11-04
hexagonal column crystals of 100nm more or less, are formed for the standing
time of 3 minutes after dropping it onto a phosphor bronze plate, where it is
confirmed that irregularities of several nm order are found on the hexagonal
column quantum crystals from the SEM images (Fig. 4, 5 and 6).and any specific
facets derived from a metal nano-crystals are not found, while the EDS
elemental analysis shows silver and elements derived from the complexing
ligand. Accordingly, it can be estimated from the above analysis, that the
whole
particles show nano-crystals of silver complex and also the unevenness
appearance on the surface may be caused by the formation of spread quantum
dots made of silver clusters in the complexes. From the aspect of phenomenon
that the silver complex quantum crystals of the present invention can be
formed
on a phosphor bronze plate, while silver nano-particles alone can be deposited
on the copper substrate, it is estimated that, as the equilibrium potential of
the
silver thiosulfate complexes is 0.33 which is equivalent to the copper
electrode
potential with 0.34, there is deposited only silvers with 0.80 on the copper
substrate. On the other hand, in case of a phosphor bronze plate with the
electrode potential of 0.22, which is slightly less noble than that of the
copper so
that silver complex crystals seem able to be precipitated. The concentration
of
the silver complex in the aqueous solution should be in a dilute region of 500
-2000ppm, 2) the electrode potential of the metal substrate with respect to
the
equilibrium potential of the metal complex solution is slightly less noble, 3
) the
metal complex should be deposited by the electrode potential difference
between the metal substrate and the metal complex. Further, in case of
18
CA 02911744 2015-11-04
1000ppm of thiourea silver complex in aqueous solution, the same function was
can be observed.
[0028] (Example 2)
A substrate of silver thiosulfate quantum crystal made on the phosphor bronze
plate in Example 1 was prepared and, on this substrate an aqueous solution of
sodium hypochlorite having pH11 was dropped. After dropping of the aqueous
solution, the solution was allowed to stand on the substrate for three minutes
and is subsequently blown off to prepare a bio-chip for SERS. On the other
hand, the serums obtained from 12 cases of gastric cancer patients, the serum
obtained from 12 cases of the colorectal carcinoma patients and the serum
obtained from 12 cases of benign disease patients, all of them are diluted 10
times to prepare testing samples, which are subjected to a measurement of
Raman spectra with irradiated with 633nm laser light. There are observed
much correlation between the degree of progress and the peak rise values as
well as the peak integral value in case of gastric cancer and colon cancer. In
addition, in the case of gastric cancer, the peak became to develop in the
Raman spectrum developed after one minute of the laser irradiation, the peak
became to develop in the Raman spectrum after 2-3 minutes after laser
irradiation in the case of colon cancer. Also, D is a graph showing a
comparison
of the Raman scattering peak rising values concerning gastric cancer, colon
cancer and benign disease. The peak of the gastric cancer samples and colon
cancer samples are found to be significantly higher than that of .the benign
disease samples. While it is difficult to find the difference between the
gastric
cancer sample and the colon cancer samples concerning the peak rise valueõ it
19
CA 02911744 2015-11-04
is possible to identify both cancers considering the peak expression times and
the peak integral value.
[0029] (Discussion on the meso-crystal of silver oxide compound: Part 1)
The quantum crystal substrate is subjected to a treatment of dropping 5%
sodium hypochlorite solution thereon and the dropped solution is removed off 2
minutes later to obtain crystals having structures shown in Fig. 12, where
needle-shaped crystals and large clumps such as rugby ball-like mass are
observed and the respective compositions are subjected to analyzation at EDS
spectra (elemental analysis),. After a result of the analysis, the needle-like
crystals are both considered to consist of a composite crystal of silver oxide
and
silver chloride ,from the following reaction formulas and the result of Figure
12
does not show any chlorine and shows that the silver and oxygen is dominant.
Na 2 S 2 0 3 + 4NaCIO + H 2 0 Na 2 SO 4 + H 2 SO 4 + 4NaCI (1)
Ag + NaCl AgC1+ Na (2)
Ag + 2AgCI + NaCIO 3 + 2Na + (3)
Ag + OH- ¨> Ag0H (4)
2Ag ++ 20H ---0 Ag 2 0 + H 2 0(5)
Thus, although it is considered that silver ions and thiosulfate ions are
important
in the formation of meso-crystal according to the present invention by
alkaline
oxidation reaction in the presence of chloride ions and ,although the silver
oxide
is formed according to a conventional reaction, it is surprised that silver
peroxide
are predominantly formed from the following XPS measurement.
CA 02911744 2015-11-04
[0030] (Discussion of the meso-crystal of silver oxide compound: Part 2)
XPS measurement:
The aqueous sodium hypochlorite was added dropwise to the quantum crystal
substrate prepared as the above for 2 minutes, to make a re-crystal substrate,
which is subjected to a XPS analysis (using models: ULVAC-PHI (Ltd.) /
PH 15000 Versa Probe II (scanning X-ray photoelectron spectroscopy) without
etching for Ag and 0 by XPS measurement. In addition, for comparison, Ag in
the powder of silver chloride and the powder of silver oxide were measured. On
the other hand, the recrystallized substrate was subjected to XPS measurement
of Ag and 0 after etching for 5 minutes with an argon gas cluster ion gun. If
the
XPS measurement results of FIGS. 13 and 14 will be combined with the results
of EDS according to FIG. 12, the peak in the vicinity of 529eV is the peak
derived
from silver peroxide (Ag0), while the peak in the vicinity of 530eV is the
peak
derived from silver oxide (Ag2O). Further, If it is etched, the oxygen content
decreases, while the 0 peak derived from the silver peroxide (AgO) in the
vicinity
of 529eV is still greater than the peak derived from the silver oxide in the
vicinity
of 530eV in case of etching , so that it is recognized that the silver
peroxide was
produced in the vicinity of the substrate. It is assumed that the electrode
potential of the substrate and the catalytic action are affected.to the meso
-crystal formation
The EDS measurement was carried on the above-mentioned re-crystal substrate
by using a JEOL Ltd. / JSM-7001F (field emission scanning electron microscope
analysis).
In addition, even iif the aqueous solution selected from the group consisting
of
21
CA 02911744 2015-11-04
hypochlorous acid, 0.01 N sodium hydroxide, 0.01 N hydrochloric acid and 0.1
molar sodium carbonate would be used , any result similar to be treated with
sodium hypochlorite was not obtained. Thus, it is believed that the formation
of
the needle-like crystals are caused by the above reaction in the presence of
silver ions and thiosulfate ions. While the silver oxide is induced into
negatively
charged in an aqueous solution, it is reduced by the light to deposit metallic
silver. Since silver peroxide shows more remarkable in the above tendency than
silver oxide, it is possible to adsorb cancer related substances having a
positive
charge, resulting in occurrence of the surface plasmon enhancement effect
between the trapped cancer related substance and the silver particles.
Industrial Applicability
[0031] Thus, according to the present invention, it is possible to selectively
detect cancer related substances in the blood and biological samples, so that
the
early detection of cancer and the judgement of progress of cancer can be made
by the measurement of Raman spectra..
22