Note: Descriptions are shown in the official language in which they were submitted.
CA 02913820 2015-11-26
WO 2015/009834
PCT/US2014/046860
PREDICTING PROPERTIES OF WELL BORE TREATMENT FLUIDS
BACKGROUND
[0001] Well bore treatment fluids often are used in, e.g., well drilling,
completion,
and stimulation operations. Examples of such well bore treatment fluids
include, but are not
limited to, drilling fluids, cement compositions, spacer fluids, fracturing
fluids, acidizing
fluids, completion fluids, and the like. As used herein, the term "well bore
treatment fluid"
will be understood to mean any fluid that may be used in a subterranean
application in
conjunction with a desired function and/or for a desired purpose. The term
"well bore treatment
fluid" does not imply any particular action by the fluid. The well bore
treatment fluids may be
introduced into a well bore in accordance with known techniques.
[0002] It may be desirable to know various properties of the well bore
treatment fluids
to accurately predict how the fluids should act upon being introduced into the
well bore. Fluid
properties that may be important when designing well bore treatment fluids
include, but are
not limited to, rheological behavior, fluid loss, static gel strength,
sedimentation, thickening
time, compressive strength, viscosity, and free water, among others. A
particular fluid may be
selected for use in a well bore based on one or more of these properties. For
example, a spacer
fluid may be selected having a rheology that maximizes the fluid's
displacement efficiency.
Additionally, optimizing a spacer fluid's rheology can also help to prevent
fluid inversion due
to fluid density differences between the fluids before and after the spacer
fluid. By way of
further example, a fracturing fluid may be selected having a viscosity
sufficient to generate
fracture geometry and transport proppant. The fluid design for a subterranean
operation has
typically been based on both experience and laboratory testing, whereas the
use of modeling
methods to predict fluid behavior has been limited. For example, fluid design
can require
extensive laboratory time to test a number of different fluid formulations
before a well bore
treatment fluid having desirable properties may be selected.
1
CA 02913820 2015-11-26
WO 2015/009834
PCT/1JS2014/046860
BRIEF DESCRIPTION OF THE DRAWINGS
[0003] These drawings illustrate certain aspects of some of the embodiments of
the
present invention, and should not be used to limit or define the invention.
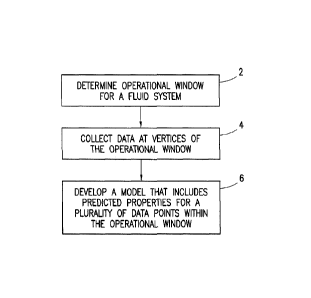
[0004] FIG. 1 is a flow chart illustrating an example method for predicting
properties
of well bore treatment fluids.
[0005] FIG. 2 is a flow chart illustrating an example method for predicting
rheological
properties of well bore treatment fluids.
[0006] FIG. 3 is an example computer system that may be used in embodiments of
the present techniques.
[0007] FIG. 4 is an example operational window that may be used in example
methods
for predicting rheological properties.
[0008] FIG. 5 is another example of an operational window that may be used in
example methods for predicting rheological properties.
[0009] FIG. 6 is a particle suspension chart that may be used in determining
an
operational window in embodiments of the present techniques.
2
CA 02913820 2015-11-26
WO 2015/009834
PCT/1JS2014/046860
DESCRIPTION OF PREFERRED EMBODIMENTS
[0010] Embodiments of the present techniques relate to predicting properties,
such as
rheological properties, of well bore treatment fluids. In accordance with
present embodiments,
the properties may be predicted with a limited amount of lab testing.
Accordingly, costs may
be saved and a competitive advantage may be gained by reducing the amount of
lab time that
may be required to design a fluid for use in subterranean operations. Among
other things,
embodiments may allow the design of a fluid with minimal customer notice, thus
giving the
opportunity for reduced rig time, improved bond logs, and/or better customer
satisfaction.
[0011] Embodiments disclosed herein related to design of a well bore treatment
fluid
for use in subterranean operations. Subterranean operations in which the well
bore treatment
fluids may be used include well drilling, completion, and stimulation
operations. Examples of
such well bore treatment fluids include, but are not limited to, drilling
fluids, cement
compositions, spacer fluids, fracturing fluids, acidizing fluids, completion
fluids, and the like.
In some embodiments, methods may employ Barycentric interpolation to develop a
model that
includes predicted properties such as rheologieal data for a plurality of data
points within the
boundaries of a fluid system. A well bore treatment fluid may then be designed
using the
model. One example of such a well bore treatment fluid is a spacer fluid.
Embodiments may
be particularly advantageous for spacer fluids due to the fluid rheologies
that are typically
required when using these fluids. In particular, optimized rheology may be
important for
spacer fluids, for example, to ensure proper hole cleaning, fluid separation,
and efficient fluid
recovery and displacement.
[0012] An embodiment provides a method of predicting fluid properties
comprising:
determining an operational window for a well bore fluid system; collecting
data at vertices of
the operational window; and developing a model comprising predicted properties
for a
plurality of data points within the operational window, wherein developing the
model uses
Barycentric interpolation.
[0013] Another embodiment provides a method of servicing a well bore
comprising:
providing an optimized treatment fluid, wherein the optimized treatment fluid
is based, at least
in part, on a model developed using Barycentric interpolation; and introducing
the treatment
fluid into a well bore.
[0014] Yet another embodiment provides a fluid property prediction system
comprising: memory; and a processor coupled to the memory, wherein the
processor is
configured to receive data for a fluid system and develop a model using
Barycentric
interpolation, the model comprising predicted properties for a plurality of
data points within
an operational window of the fluid system.
3
CA 02913820 2015-11-26
WO 2015/009834
PCT/1JS2014/046860
[0015] FIG. 1 is a flow chart illustrating an example method for predicting
properties
of well bore treatment fluids. As shown in step 2, the method may include
determining an
operational window for a fluid system. The method may further include
collecting data at
vertices of the operational window (step 4). Once the data is collected, a
model may be
developed (step 6) that includes predicted properties (such as rheological
data) for a plurality
of data points within the operational window of the fluid system, wherein
Barycentric
interpolation is used in developing the model.
[0016] The operational window generally may define the boundaries of the fluid
system. Two or more boundary conditions may be used to determine the
operational window.
Non-limiting examples of boundary conditions that may be used in developing
the operational
window include, without limitation, rheology, compressive strength, fluid
loss, static gel
strength, sedimentation, thickening time, free water, cement mechanical
properties (e.g.,
Young's modulus, Poisson's ratio, specific heat, thermal conductivity, and
post-set
expansion), wettability, emulsion, break time, pH, post-set permeability,
hydration time, post-
set porosity, mass or volumetric ratio of an additive (e.g., weighting
additive, viscosifier, fluid
loss control additive, proppant, etc) to water, additive concentration (e.g.,
cement set retarder,
fluid loss control additive, proppant, crosslinking agent, friction reducer,
buffer, surfactant),
density, viscosity, temperature, foam quality, permeability, expansion, water
properties (e.g.,
pH, chlorides, bicarbonates, iron, tannin/lignins, carbonates, sulfates,
magnesium, and calcium
concentration), fluid break time (e.g., for fracturing fluids), and proppant
size. In one particular
embodiment, the boundary conditions may be ratio of weighting additive to
water and ratio of
viscosifier to water. In another particular embodiment, the boundary
conditions may be
temperature and thickening time or free water. Two boundary conditions may be
defined for
a two-dimensional operational window. For a three-dimensional operational
window, three
boundary conditions may be defined. In some embodiments, multiple operation
windows may
be defined and the interpolation may occur across dimensions.
[0017] Three or more points or vertices may be selected that define the
operational
window. By way of example, a two-dimensional operational window may be defined
as
follows: Vertex 1 (xi, yi), Vertex 2 (x2, y2),.. . Vertex n (xõ, yõ), wherein
n is the number of
vertices defining the operational window, x is a first boundary condition, and
y is a second
boundary condition. In some embodiments, the operational window may be a
triangular
window that is defined by three vertices. FIG. 4 is a graphical representation
of an example
triangular operational window. FIG. 4 will be described in more detail below.
In further
embodiments, the boundary conditions at each vertex may be mass ratio of
weighting additive
to water and mass ratio of viscosifier to water. By way of further example, a
three-dimensional
4
CA 02913820 2015-11-26
WO 2015/009834
PCT/1JS2014/046860
operational window may be defined as follows: Vertex 1 (xi, yi, zi), Vertex 2
(x2, yz, zz), and
Vertex n (xn, yn, zn), wherein n is the number of vertices defining the
operational window, x is
a first boundary condition, y is a second boundary condition, and z is a third
boundary
condition.
[0018] In some embodiments, the operational window may be determined based on
the functional boundaries of the fluid system. By way of example, the maximum
and/or
minimum of each boundary condition may be used to define one or more vertices
of the
operational window. The functional boundaries of a fluid system may be
generally defined by
the operational limits of a fluid, for example, the limits of the particular
boundary conditions
for the fluid system. In one embodiment, Vertex 1 may be defined as the
maximum viscosifier,
Vertex 2 may be defined as the maximum weighting additive, and Vertex 3 may be
defined as
the minimum viscosifier and minimum weighting/no weighting additive. By way of
example,
a three-dimensional operational window may be defined as follows, wherein the
x-axis is
weight ratio of weighting additive and the y-axis is weight ratio of
viscosifier to water: Vertex
1 (0, yi), Vertex 2 (x2, yz), Vertex 3 (0, y3), wherein yi is the maximum
weight ratio of
viscosi tier to water, x2 is the maximum weight ratio of weighting additive to
viscosifier, yz is
the minimum weight ratio of viscosifier to water, and y3 is the minimum weight
ratio of
viscosifier to water. Those of ordinary skill in the art, with the benefit of
this disclosure, should
be able to determine functional boundaries of a fluid system, for example,
using lab testing or
other appropriate methodologies.
[0019] In some embodiments, the operational window may be divided into two or
more sub-windows, for example, to increase the accuracy of the property
prediction. By way
of example, one or more points may be selected on edges of the operational
windows that
could be used to divide the operational window into sub-windows. In particular
embodiments,
the operational window may be divided into two, three, four, five, six, or
more sub-windows.
FIG. 5 is a graphical illustration of an example operational window that has
been divided into
four sub-windows. FIG. 5 will be described in more detail below. By dividing
the operational
window in this manner, the interpolation technique may be refined to increase
the accuracy of
the resultant property prediction.
[0020] As illustrated, the example method at step 4 may include collecting
data at
vertices of the operational window. In particular embodiments, the collecting
the data may
include collecting data at vertices of each sub-window that has been created,
for example, by
division of the operational window. The collected data generally may be
related to desirable
properties of the fluid system relative to subterranean operations. By way of
example, the
collected data related to one or more of the following properties: rheology,
compressive
5
CA 02913820 2015-11-26
WO 2015/009834
PCT/1JS2014/046860
strength, fluid loss, static gel strength, sedimentation, thickening time,
free water, cement
mechanical properties (e.g., Young's modulus, Poisson's ratio, specific heat,
thermal
conductivity, and post-set expansion), wettability, emulsion, break time, pH,
post-set
permeability, hydration time, post-set porosity. Data may be collected using
standard
laboratory techniques or other suitable methodologies. In some embodiments,
historical data
may be used so that additional laboratory testing may not be required.
[0021] At step 6, the example method may further include developing a model
that
includes predicted properties (such as rheological data) for a plurality of
data points within the
operational window of the fluid system. Each data point may correspond to a
fluid having a
specific composition, wherein the model predicts properties for the particular
fluid represented
by that data point. Density may be also determined for each of the data points
within the
operational window. In some embodiments, methods may employ Barycentric
interpolation to
develop the model within the operational window. By way of example,
Barycentric
interpolation may be used to interpolate one or more properties for a
plurality data points
within the operational window. Embodiments may use Microsoft Excel or other
suitable
software program may be used to implement disclosed interpolation techniques
using a
processor, for example. The Barycentric interpolation may use the collected
data for the
vertices of the operational window (or sub-windows) as the known data points
in the
interpolation. The interpolation technique may be adjusted to generate any
number of data
points within operational window. By way of example, the interpolation
technique may
generate at least 100, at least 1,000, or at least 10,000 data points within
the operational
window. In additional embodiments, a specific set of results may be determined
by
determining a specific data point based on entered boundary conditions. By way
of example,
two or more boundary conditions may be entered and the model may predict
properties at those
particular boundary conditions.
[0022] Once a model has been developed using Barycentric interpolation, for
example, the model may be used in selection of a well bore treatment fluid for
use in a
subterranean operation. By way of example, a well bore treatment fluid may be
selected for
use in a subterranean operation based on the model. As the model should
contain a number of
different data points (e.g., density, predicted properties, etc.) for the
fluid system, the data
points generally represent a set of potential fluids. A user may select a
fluid from this set of
potential fluids having desirable properties. In some embodiments, the method
may include
inputting desirable properties wherein the method compares the inputted
properties to the
predicted properties model to determine one or more potential fluids having
optimum
properties. By way of example, in response to the comparison, one or more data
points (which
6
CA 02913820 2015-11-26
WO 2015/009834
PCT/1JS2014/046860
correspond to potential fluids, for example) may be output. In particular
embodiments for
spacer fluids, rheology data for the fluid (e.g., a drilling fluid) ahead of
the spacer fluid and
the fluid (e.g., a cement composition) behind the spacer fluid may be compared
to the model
to determine one or more potential fluids having optimum properties. In
further embodiments,
additional properties may be input including, for example, desired density of
the fluid,
anticipated pump rates, and well geometry. Once the fluid or a set of fluids
has been selected,
the selected fluid may be further refined, for example, by use of simulation
and/or laboratory
testing.
[0023] In some embodiments, the model may be used to predict properties within
the
operational window based off a change in density by changing the concentration
of water in
the fluid system. This may be desirable, for example, to allow for onsite
adjustments to a
particular well bore fluid at the well site. In particular embodiments, water
concentration may
be changed at the well site to change the rheology of the fluid.
[0024] FIG. 2 is a flow chart illustrating another example method for
predicting
properties of well bore treatment fluids. The embodiment illustrated on FIG. 2
relates to
prediction of properties for a well bore spacer system. As illustrated on FIG.
2, the method at
step 8 may include determining an operational window for a well bore spacer
system. The
method may further include dividing the operational window into sub-windows at
step 10.
Rheology data may then be collected at vertices of the sub-windows (step 12).
Once the data
is collected, a model may be developed, as shown at step 14, that includes
predicted
Theological data for a plurality of data points within the operational window
of the fluid
system, wherein Barycentric interpolation is used in developing the model.
[0025] In some embodiments, one or more parameters of the well bore spacer
system
may be pre-defined. In some embodiments, the components of the well bore
spacer system
may also be pre-defined. By way of example, present embodiments may be used to
predict
properties of a well bore spacer system having pre-defined components. In some
embodiments,
relative proportions of certain components may also be pre-defined. Properties
may be
predicted using a well bore spacer system that comprises, for example, an
aqueous component,
a weighting additive, and a viscosifier. The well bore spacer system may also
comprise one or
more of a dispersant, lost circulation material, surfactant, buffer, clay
control additive, salt,
thixotropic additive, and dye, among others. Heavyweight additives may be
included in a
spacer fluid to increase the density of the spacer fluid while still
maintaining the necessary
fluid properties (e.g., fluid rheologies). A spacer fluid having an increased
density may be
desirable to more precisely match the densities of the drilling fluid and/or
cement composition
in the well bore. Examples of heavyweight additives that may be used include,
but are not
7
CA 02913820 2015-11-26
WO 2015/009834
PCT/1JS2014/046860
limited to, hematite, hausmannite, barite, cement kiln dust, and sand. The
viscosifier may be
included in the spacer fluid system, for example, to aid in the control of
free water and/or for
solids suspension. Examples of viscosifiers that may be used include, but are
not limited to,
guar gums, xanthan gums, diutan gums, carboxymethyl-hydroxyethyl cellulose,
and clays
(e.g., bentonite, etc.).
[0026] As previously mentioned, the operational window generally may define
the
boundaries of a fluid system. In the illustrated embodiment, the operational
window generally
may define the boundaries of the well bore spacer system. The operational
window may be
defined as previously described in accordance with FIG. I. By way of example,
two or more
boundary conditions may be used in defining the operational window of the
spacer fluid
system. In some embodiments, a two-dimensional triangular operational window
may be
defined. The boundary conditions used in defining the operational window may
comprise, for
example, weight ratio of weighting additive to water ("HWR") and weight ratio
of viscosifier
to water ("VWR"). Accordingly, a two-dimensional operational window may be
defined as
follows: Vertex 1 (xi, yi), Vertex 2 (x2, y2), and Vertex 3 (x3, y3), wherein
x is HWR and y
VWR.
[0027] In accordance with present embodiments, the functional boundaries of
the
spacer fluid system may be used to define the operational window. By way of
example,
functional boundaries may include maximum VWR, minimum VWR, and maximum HWR.
The maximum VWR may be the VWR above which the fluid system is unmixable. In
one
embodiment, the maximum VWR may be determined by maximizing the VWR until an
unmixable concentration of the viscosity and water is achieved. The maximum
VWR may be
determined with a HWR of 0. Another functional boundary may include the
minimum HWR.
Minimum VWR may be the VWR below which solids cannot be suspended. In one
embodiment, the minimum VWR may be determined by calculating the minimum
amount of
viscosifier required to suspend the heavyweight additive at low shear rate.
Yet another
functional boundary may include maximum HWR, which may be determined at
minimum
VWR. In one embodiment, maximum HWR may be determined by maximizing the HWR
until
an unmixable concentration of heavyweight additive in water (at minimum VWR)
is achieved.
FIG. 4 is a graphical representation of an example triangular operational
window having three
vertices defined by HWR and VWR. Vertex 1 is the maximum VWR, Vertex 2 is the
minimum
VWR at maximum HWR, and Vertex 3 is the minimum HWR at minimum VWR.
[0028] At step 10, the operational window may be divided into two or more sub-
windows. This sub-division should increase the accuracy of the property
prediction. By way
of example, one or more points may be selected on edges of the operational
windows that
8
CA 02913820 2015-11-26
WO 2015/009834
PCT/1JS2014/046860
could be used to divide the operational window into sub-windows. For example,
one pointed
selected on the edge connecting Vertex 1 and Vertex 2, for example, on the
midpoint of the
edge. Another point may be selected on the edge connecting Vertex 2 and Vertex
3, for
example, on the midpoint of the edge. Yet another point may be selected on the
edge
connecting Vertex 1 and 3, for example, on the midpoint of the edge. These
three additional
points may be used to divide the operational window into four sub-windows, as
illustrated in
FIG. 5.
[0029] At step 12, the example method may include collecting rheology data at
the
vertices of the sub-windows. Additional data may be collected related to one
or more of the
following properties: rheology, compressive strength, fluid loss, static gel
strength,
sedimentation, thickening time, free water, cement mechanical properties
(e.g., Young's
modulus, Poisson's ratio, specific heat, thermal conductivity, and post-set
expansion),
wettability, emulsion, break time, pH, post-set permeability, hydration time,
post-set porosity,
foam quality, permeability, expansion, water properties (e.g., pH, chlorides,
bicarbonates, iron,
tannin/lignins, carbonates, sulfates, magnesium, and calcium concentration),
and fluid break
time (e.g., for fracturing fluids). Data may be collected using standard
laboratory techniques
or other suitable methodologies. By way of example, the rheology data may be
collected in
accordance with the ANSI/API Recommended Practice 10B-2, Recommended Practice
for
Testing Well Cements, First Edition, July 2005. In some embodiments,
historical data may be
used so that additional laboratory testing may not be required.
[0030] At step 14, the example method may further include developing a model
using
Barycentric interpolation that includes predicted rheology data for a
plurality of data points
within the operational window of the fluid system. Density may also be
determined for each
of the data points within the operational window. The Barycentric
interpolation may use the
collected rheology data for the vertices of the sub-windows as the known data
points in the
interpolation. The interpolation technique may be adjusted to generate any
number of data
points within operational window.
[0031] FIG. 3 is a block diagram of an exemplary computer system 15 that that
may
be used in performance of the techniques described herein. Software for
performing the
interpolations and other method steps may be stored in the computer system
and/or on external
computer readable media. Those of ordinary skill in the art will appreciate
that the computer
system 15 may comprise hardware elements including circuitry, software
elements including
computer code stored on a machine-readable medium or a combination of both
hardware and
software elements. Additionally, the blocks shown are but one example of
blocks that may be
implemented. A processor 16, such as a central processing unit or CPU,
controls the overall
9
CA 02913820 2015-11-26
WO 2015/009834
PCT/1JS2014/046860
operation of the computer system 15. The processor 16 may be connected to a
memory
controller 18, which may read data to and write data from a system memory 20.
The memory
controller 18 may have memory that includes a non-volatile memory region and a
volatile
memory region. The system memory 20 may be composed of a plurality of memory
modules,
as will be appreciated by one of ordinary skill in the art. In addition, the
system memory 20
may include non-volatile and volatile portions. A system basic input-output
system (BIOS)
may be stored in a non-volatile portion of the system memory 20. The system
BIOS may be
adapted to control a start-up or boot process and to control the low-level
operation of the
computer system 15.
[0032] As illustrated, the processor 16 may be connected to at least one
system bus
22, for example, to allow communication between the processor 16 and other
system devices.
The system bus may operate under a standard protocol such as a variation of
the Peripheral
Component Interconnect (PCI) bus or the like. In the exemplary embodiment
shown in FIG.
3, the system bus 22 may connect the processor 16 to a hard disk drive 24, a
graphics controller
26 and at least one input device 28. The hard disk drive 24 may provide non-
volatile storage
to data that is used by the computer system 15. The graphics controller 26 may
in turn be
connected to a display device 30, which provides an image to a user based on
activities
performed by the computer system 15. The computer system 15 may be programmed
to
perform operation and control methods of the present technique, including with
regard to
interpolation and comparison steps. The memory devices of the computer system
15, including
the system memory 20 and the hard disk 24 may be tangible, machine-readable
media that
store computer-readable instructions to cause the processor 16 to perform a
method according
to an embodiment of the present techniques.
[0033] To facilitate a better understanding of the present invention, the
following
examples of certain aspects of some embodiments are given. In no way should
the following
examples be read to limit, or define, the entire scope of the invention.
EXAMPLE 1
[0034] A model was developed to predict fluid rheology for a well spacer
system that
comprised water, a heavyweight additive, and a viscosifier. The viscosifier
used was SA-
1OI5TM Suspending Agent, available from Halliburton Energy Services, Inc. The
heavyweight
additive used comprises 50 weight % cement kiln dust and 50 weight % barite. A
dispersant
(CFR3TM dispersant, Halliburton Energy Services, Inc.) was also included in an
amount of
0.4% by weight of the heavyweight additives. Depending on the source of the
cement kiln
dust, the dispersant may not be needed_ The concentration of the dispersant
can be varied to
minimize cost. The model was developed by determining an operational window
for the well
CA 02913820 2015-11-26
WO 2015/009834
PCT/1JS2014/046860
spacer system, dividing the operational window into four sub-windows and then
conducting
six baseline rheology tests at the vertex of each sub-window. Each baseline
rheology test
included the particular fluid recipe for each vertex tested at 80 F, 130 F,
and 180 F.
Barycentric interpolation was then used to predict rheology data for multiple
data points
(approximately 30,000) within the operational window.
[0035] FIG. 4 is a graphical representation of the determined operational
window. The
functional boundaries of the well spacer system were used to define the
operational window.
The weight ratio of the heavyweight additive to water ("HWR") and the weight
ratio of the
viscosifier to water ("VWR") were used as the boundary conditions. The
operational window
was defined as follows: Vertex 1 (xi, yi), Vertex 2 (x2, y2), and Vertex 3
(x3, y3), wherein xi
is a HWR of 0, yi is maximum VWR, x2 is maximum HWR of 0, y2 is minimum VWR,
x3 is
a HWR of 0, and y3 is minimum VWR. The maximum VWR was determined at an HWR of
0
by maximizing the VWR until an unmixable concentration of the viscosity and
water is
achieved. The maximum VWR was determined to be 0.0125. The minimum VWR was
determined by calculating the minimum amount of viscosifier required to
suspend the
heavyweight additive at low shear rate. FIG. 6 is a chart relating to material
specific gravity
and particle size that was created to aid in determining minimum VWR. The
minimum VWR
was determined to be 0.002. The maximum HWR was determined at minimum VWR by
maximizing the HWR until an unmixable concentration of heavyweight additive in
water was
achieved. The maximum HWR was determined to be 1.565.
[0036] The operational window was then divided into four sub-windows, as shown
on
FIG. 5, represented as triangle a, triangle 13, triangle y, and triangle p.
Points 4, 5, and 6 on
FIG. 5 were determined by calculating the midpoints between Vertices 1 and 2,
Vertices 2 and
3, and Vertices 1 and 3, respectively.
[0037] Baseline rheology tests were then conducted at the vertex of each sub-
window,
i.e., Vertex 1, Vertex 2, Vertex 3, Point 4, Point 5, and Point 6. Each
baseline rheology test
included the particular fluid recipe for each vertex tested at 80 F, 130 F,
and 180 F. The
theology tests were conducting in accordance with ANSI/API Recommended
Practice 10B-2,
Recommended Practice for Testing Well Cements, First Edition, July 2005. The
data for the
six baseline rheology tests are provided in the table below.
Table 1
Baseline Temp. Viscometer RPM
Test (0F) 300 200 100 60 30 6 3
Vertex 1 80 80.5 78 74.5 70.5 66 53.95 50.25
11
CA 02913820 2015-11-26
WO 2015/009834
PCT/1JS2014/046860
130 73.5 73 69.5 66.5 62.5 51.8 48.6
180 65.5 64 61.5 60 56 48.2 45.75
Vertex 2 80 68.5 55 39.5 32 25.5 16.7 14.8
130 64 51 38 31 26 17.9 16.7
180 72 58 43.5 36.5 31 26.75 22.6
Vertex 3 80 11 9 8 7 7 6.6 6.45
130 10 8.5 8 8 7.5 6.95 6.55
180 10 9 8.5 8.5 8.5 7.9 7.45
Point 4 80 90 83.5 75.5 71 66 54.2 50.55
130 100 93 84 79 73 61.3 58
180 90.5 86 78.5 73.5 69 61.35 59.85
Point 5 80 27.5 23 18 16.5 13 10.05 9
130 27 23 28 16 14 10.4 9.2
180 27 23 19 16.5 14 10.7 10
Point 6 80 42.5 40.5 38.5 36.5 34 28 25.75
130 44.5 42.5 39.5 38 35.5 28.95 27.1
180 46 45 42 40 37 32 30.4
[0038] After the data for the baseline rheology tests was collected,
Barycentric
interpolation was used to generate predicted rheological data for a plurality
of data points
within the operational window. Approximately 30,000 data points were generated
by the
interpolation. A Microsoft Excel spreadsheet was used to generate the
predicted data. In
addition to the predicted rheological data, the spreadsheet also determined
density of the fluid
corresponding to each data point and specific gravities of the materials used
in the baseline
rheology tests.
[0039] To more accurately predict a well spacer system ranging in density from
8.35
pounds per gallon to 16 pounds per gallon, two additional models were
developed. Model 2
and Model 3 further included varying concentrations of barite in the weighting
agent. Below
are the weight ratios of cement kiln dust and barite that were used for each
model:
Model 1 -50 wt% cement kiln dust -50 wt% barite
Model 2 - 100 wt% cement kiln dust -0 wt% barite
Model 3 - 15 wt% cement kiln dust -85 wt% barite
EXAMPLE 2
12
CA 02913820 2015-11-26
WO 2015/009834 PCT/1JS2014/046860
[0040] Testing was conducted to evaluate the accuracy of the predicted
rheological
data generated using the models developed in Example I. A spacer fluid was
selected using
Model 3 (15% cement kiln dust - 85% barite) having an HWR of 1.06 and a VWR of
0.0031.
The selected spacer fluid corresponds to a data point in Model 3. The selected
spacer fluid
from Model 3 had a density of 14 pounds per gallon and composition of the
spacer fluid was
water (125.57 grams), cement kiln dust (22.50 grams), barite (127.50 grams),
viscosifier (0.43
grams) and dispersant (0.60 grams). The dispersant used was CFR_3TM cement
friction
reducer, available from Halliburton Energy Services, Inc. Rheology testing in
accordance with
ANSI/API Recommended Practice 10B-2, Recommended Practice for Testing Well
Cements,
First Edition, July 2005, was conducted at 80 F, 130 F, and 180 F to compare
the actual
theological data with the predicted rheological data from Model 3.
[0041] Table 2 below is a comparison of the predicted and actual rheological
data for
the selected spacer fluid.
Table 2
Temp. Viscometer RPM
( F) 300 200 100 60 30 6 3
Actual 80 51 43 36 33 29 23 13
44 36 32 29 23 22
130 47 42 37 34 31 25 11
42 36 33 30 25 23
180 48 43 38 36 33 28 23
43 38 35 32 27 25
Predicted 80 52 46 37 33 29 22 20
130 50 45 38 34 30 25 23
180 49 44 37 34 31 25 23
[0042] Comparing the actual theological data to the predicted rheological data
from
Model 3 shows very little variation, indicating that the model accurately
predicted the
Theological data for this particular data point.
EXAMPLE 3
[0043] Additional testing was conducted to evaluate the accuracy of the
predicted
rheological data generated using the models developed in Example 1. A spacer
fluid was
selected using Model 3 (15% cement kiln dust - 85% barite) having an HWR of
1.06 and a
VWR of 0.0031. The selected spacer fluid corresponds to a data point in Model
3. The selected
spacer fluid from Model 3 had a density of 13.5 pounds per gallon and
composition of the
13
CA 02913820 2015-11-26
WO 2015/009834
PCT/1JS2014/046860
spacer fluid was water (141.54 grams), cement kiln dust (22.50 grams), barite
(127.50 grams),
viscosifier (0.43 grams) and dispersant (0.60 grams). The dispersant used was
CFR-31m
cement friction reducer, available from Halliburton Energy Services, Inc.
Rheology testing in
accordance with ANSI/API Recommended Practice 10B-2, Recommended Practice for
Testing Well Cements, First Edition, July 2005, was conducted at 80 F, 130 F,
and 180 F to
compare the actual rheological data with the predicted rheological data from
Model 3.
[0044] Table 3 below is a comparison of the predicted and actual theological
data for
the selected spacer fluid.
Table 3
Temp. Viscometer RPM
( F) 300 200 100 60 30 6 3
Actual 80 40 36 31 28 26 20 16
36 30 28 25 20 18
130 39 35 30 28 25 18 13
35 30 28 25 20 18
180 38 34 30 28 26 21 19
35 30 28 26 21 19
Predicted 80 43 37 30 27 24 18 17
130 41 36 31 28 25 20 19
180 40 36 31 28 25 20 19
[0045] Comparing the actual rheological data to the predicted rheological data
from
Model 3 shows very little variation, indicating that the model accurately
predicted the
rheological data for this particular data point.
[0046] It should be understood that the compositions and methods are described
in
terms of "comprising," "containing," or "including" various components or
steps, the
compositions and methods can also "consist essentially of" or "consist of' the
various
components and steps. Moreover, the indefinite articles "a" or "an," as used
in the claims, are
defined herein to mean one or more than one of the element that it introduces.
[0047] For the sake of brevity, only certain ranges are explicitly disclosed
herein.
However, ranges from any lower limit may be combined with any upper limit to
recite a range
not explicitly recited, as well as, ranges from any lower limit may be
combined with any other
lower limit to recite a range not explicitly recited, in the same way, ranges
from any upper
limit may be combined with any other upper limit to recite a range not
explicitly recited.
Additionally, whenever a numerical range with a lower limit and an upper limit
is disclosed,
14
CA 2913820 2017-05-03
any number and any included range falling within the range are specifically
disclosed. In
particular, every range of values (of the form, "from about a to about b," or,
equivalently,
"from approximately a to b," or, equivalently, "from approximately a-b")
disclosed herein is
to be understood to set forth every number and range encompassed within the
broader range
of values even if not explicitly recited. Thus, every point or individual
value may serve as its
own lower or upper limit combined with any other point or individual value or
any other
lower or upper limit, to recite a range not explicitly recited.
[0048] Therefore, the present invention is well adapted to attain the ends and
advantages mentioned as well as those that are inherent therein. The
particular embodiments
disclosed above are illustrative only, as the present invention may be
modified and practiced
in different but equivalent manners apparent to those skilled in the art
having the benefit of
the teachings herein. Although individual embodiments are discussed, the
invention covers
all combinations of all those embodiments. Furthermore, no limitations are
intended to the
details of construction or design herein shown, other than as described in the
claims below.
Also, the terms in the claims have their plain, ordinary meaning unless
otherwise explicitly
and clearly defined by the patentee. It is therefore evident that the
particular illustrative
embodiments disclosed above may be altered or modified and all such variations
are
considered within the scope and spirit of the present invention.