Note: Descriptions are shown in the official language in which they were submitted.
Temperature Compensation for an Analyte Measurement
Determined from a Specified Sampling Time Derived
From a Sensed Physical Characteristic of the Sample
Containing the Analyte
PRIORITY
[0001] This patent application claims priority to U.S. patent
application S.N.
13/929,495 filed on June 27, 2013 and U.S. patent application S.N. 61/840,176
filed on
June 27, 2013.
BACKGROUND
[0002] Electrochemical glucose test strips, such as those used in the
OneTouch0 Ultra
whole blood testing kit, which is available from LifeScan, Inc., are designed
to measure
the concentration of glucose in a physiological fluid sample from patients
with
diabetes. The measurement of glucose can be based on the selective oxidation
of
glucose by the enzyme glucose oxidase (GO). The reactions that can occur in a
glucose
test strip are summarized below in Equations 1 and 2.
Eq. 1 Glucose + GO(0x) Gluconic Acid + GO(red)
Eq. 2 GO(red) + 2 Fe(CN)63- GO(0x) + 2 Fe(CN)64-
100031 As illustrated in Equation 1, glucose is oxidized to gluconic
acid by the
oxidized form of glucose oxidase (G0(0x)). It should be noted that GO(ox) may
also be
referred to as an "oxidized enzyme." During the reaction in Equation 1, the
oxidized
enzyme GO(0x) is converted to its reduced state, which is denoted as GO (i
(red) (i. e.,
"reduced enzyme"). Next, the reduced enzyme GO(red) .S i re-oxidized back to
GO(0x) by
reaction with Fe(CN)63- (referred to as either the oxidized mediator or
ferricyanide) as
illustrated in Equation 2. During the re-generation of G0(.0 back to its
oxidized state
GO(ox), Fe(CN)63- is reduced to Fe(CN)64- (referred to as either reduced
mediator or
ferrocyanide).
1
Date Recue/Date Received 2020-12-29
[0004] When the reactions set forth above are conducted with a test
signal applied
between two electrodes, a test current can be created by the electrochemical
re-
oxidation of the reduced mediator at the electrode surface. Thus, since, in an
ideal
environment, the amount of ferrocyanide created during the chemical reaction
described above is directly proportional to the amount of glucose in the
sample
positioned between the electrodes, the test current generated would be
proportional to
the glucose content of the sample. A mediator, such as ferricyanide, is a
compound that
accepts electrons from an enzyme such as glucose oxidase and then donates the
electrons to an electrode. As the concentration of glucose in the sample
increases, the
amount of reduced mediator formed also increases; hence, there is a direct
relationship
between the test current, resulting from the re-oxidation of reduced mediator,
and
glucose concentration. In particular, the transfer of electrons across the
electrical
interface results in the flow of a test current (2 moles of electrons for
every mole of
glucose that is oxidized). The test current resulting from the introduction of
glucose
can, therefore, be referred to as a glucose signal.
[0005] Electrochemical biosensors may be adversely affected by the
presence of certain
blood components that may undesirably affect the measurement and lead to
inaccuracies in the detected signal. This inaccuracy may result in an
inaccurate glucose
reading, leaving the patient unaware of a potentially dangerous blood sugar
level, for
example. As one example, the blood hematocrit level (i.e. the percentage of
the amount
of blood that is occupied by red blood cells) can erroneously affect a
resulting analyte
concentration measurement.
[0006] Variations in a volume of red blood cells within blood can
cause variations in
glucose readings measured with disposable electrochemical test strips.
Typically, a
negative bias (i.e., lower calculated analyte concentration) is observed at
high
hematocrit, while a positive bias (i.e., higher calculated analyte
concentration as
compared to referential analyte concentration) is observed at low hematocrit.
At high
hematocrit, for example, the red blood cells may impede the reaction of
enzymes and
electrochemical mediators, reduce the rate of chemistry dissolution since
there is less
plasma volume to solvate the chemical reactants, and slow diffusion of the
mediator.
These factors can result in a lower than expected glucose reading as less
signal is
produced during the electrochemical process. Conversely, at low hematocrit,
fewer red
blood cells may affect the electrochemical reaction than expected, and a
higher
2
Date Recue/Date Received 2020-12-29
measured signal can result. In addition, the physiological fluid sample
resistance is
also hematocrit dependent, which can affect voltage and/or current
measurements.
[0007] Several strategies have been used to reduce or avoid hematocrit
based variations
on blood glucose. For example, test strips have been designed to incorporate
meshes to
remove red blood cells from the samples, or have included various compounds or
formulations designed to increase the viscosity of red blood cells and
attenuate the
effect of low hematocrit on concentration determinations. Other test strips
have
included lysis agents and systems configured to determine hemoglobin
concentration in
an attempt to correct hematocrit. Further, biosensors have been configured to
measure
hematocrit by measuring an electrical response of the fluid sample via
alternating
current signals or change in optical variations after irradiating the
physiological fluid
sample with light, or measuring hematocrit based on a function of sample
chamber fill
time. These sensors have certain disadvantages. A common technique of the
strategies
involving detection of hematocrit is to use the measured hematocrit value to
correct or
change the measured analyte concentration, which technique is generally shown
and
described in the following respective US Patent Application Publication Nos.
2010/0283488; 2010/0206749; 2009/0236237; 2010/0276303; 2009/0223834;
2008/0083618; 2004/0079652; 2009/0194432; or US Patent Nos., 7,972,861 and
7,258,769.
SUMMARY OF THE DISCLOSURE
[0008] Applicant has provided various embodiments of a novel technique
to allow
analyte measurements to account for the effects of temperature upon the
electrochemical reaction. Advantageously, this new technique has enabled
applicant to
provide a technical contribution to the field in that approximately 97% of the
biosensors fall with 15 mg/dL for measurements below 100 mg/dL and 15% for
measurements at 100 mg/dL or greater. An additional technical contribution is
also
provided by this invention in that the average bias to nominal bias is within
10 mg/dL
for measurements below 100 mg/dL and 10% for measurements at 100 mg/dL or
greater.
[0009] In a first aspect, applicant has devised an analyte measurement system
that includes a
biosensor configured to be coupled to a meter. The biosensor has a plurality
of
electrodes including at least two electrodes with an enzyme disposed thereon.
The
3
Date Recue/Date Received 2020-12-29
meter includes a microcontroller coupled to a power source, memory and the
plurality
of electrodes of the biosensor. The microcontroller is configured to: measure
ambient
temperature proximate the biosensor; drive a signal to the at least two
electrodes when
a fluid sample with an analyte is deposited proximate the at least two
electrodes;
measure a signal output from the at least two electrodes during the
electrochemical
reaction; calculate an uncompensated analyte value from the signal output;
adjust the
uncompensated analyte value to a final analyte value with a temperature
compensation
term defined by a relationship in which: (a) the temperature compensation term
increases for increasing uncompensated analyte values; the temperature
compensation
term is inversely related to the ambient temperature proximate the biosensor
from
about 5 degrees Celsius to about 22 degrees Celsius; and the temperature
compensation
term is about zero for the ambient temperature proximate the biosensor from
about 22
degrees Celsius to about 45 degrees Celsius. The microcontroller is also
configured to
annunciate the final analyte value.
[0010] In a second aspect, applicant has provided an analyte measurement
system with a test
strip and an analyte meter. The test strip includes a substrate and a
plurality of
electrodes connected to respective electrode connectors. The analyte meter
includes a
housing with a test strip port connector configured to connect to the
respective
electrode connectors of the test strip, and a microprocessor in electrical
communication
with the test strip port connector to apply electrical signals or sense
electrical signals
from the plurality of electrodes. The microprocessor is configured to: (a)
sense a
temperature of the environment proximate the sensor; (b) apply a first signal
to the
plurality of electrodes so that a physical characteristic of a fluid sample is
determined;
(c) estimate an analyte concentration based on a predetermined sampling time
point
during a test sequence; (d) apply a second signal to the plurality of
electrodes at a
specified sampling time point during the test sequence dictated by the
determined
physical characteristic so that an uncompensated analyte concentration is
calculated
from the second signal; and (e) compensate the uncompensated analyte
concentration
with a temperature compensation term that: (i) increases for uncompensated
analyte
values that are increasing; (ii) is inversely related to the ambient
temperature
proximate the biosensor from about 5 degrees Celsius to about 22 degrees
Celsius; and
(iii) is about zero for the ambient temperature proximate the biosensor from
about 22
degrees Celsius to about 45 degrees Celsius. The microprocessor is configured
to
annunciate the final analyte value.
4
Date Recue/Date Received 2020-12-29
[0011] In a third aspect, applicant has developed a glucose meter that
includes a housing with
a test strip port connector disposed on the housing. The test strip port
connector is
configured to connect to respective electrode connectors of a test strip. The
meter has
means for: (a) sensing a temperature of the environment proximate the housing;
(b)
determining a specified sampling time based on a sensed or estimated physical
characteristic of a sample deposited on a plurality of electrodes of the test
strip, the
specified sampling time being at least one time point or interval referenced
from a start
of a test sequence upon deposition of a sample on the test strip; (c)
determining an
uncompensated analyte concentration based on the specified sampling time; (d)
compensating the uncompensated analyte concentration with a temperature
compensation term that: (i) increases for uncompensated analyte values that
are
increasing; (ii) is inversely related to the temperature of the housing or the
environment proximate the biosensor from about 5 degrees Celsius to about 22
degrees
Celsius; and (iii) is about zero for the housing or environmental temperature
proximate the biosensor from about 22 degrees Celsius to about 45 degrees
Celsius,
along with means for annunciating the final analyte value.
[0012] In a fourth aspect, applicant has devised a method of adjusting for the
effect of
temperature upon a biosensor that has a plurality of electrodes with at least
two
electrodes provided with enzymes thereon. The method can be achieved by:
applying a
signal to the at least two electrodes; initiating an electrochemical reaction
between the
at least two electrodes and an analyte in a fluid sample to cause a
transformation of the
analyte into a byproduct; measuring a signal output from the at least two
electrodes
during the electrochemical reaction; measuring a temperature proximate the
biosensor;
calculating an analyte value representative of a quantity of analyte in the
fluid sample
from the signal output; adjusting the analyte value to a final analyte value
by a
temperature compensation term defined by a relationship where: (a) the
temperature
compensation term increases for increasing analyte values; (b) the temperature
compensation term is inversely related to the biosensor temperature in a range
of about
degrees Celsius to about 22 degrees Celsius; and (c) the temperature
compensation
term is about zero for the ambient temperature proximate the biosensor from
about 22
degrees Celsius to about 45 degrees Celsius, and annunciating the final value
representative of the quantity of analyte in the fluid sample.
[0013] In a fifth aspect, applicant has designed a method of determining an
analyte
concentration from a fluid sample. The method can be achieved by: depositing a
fluid
5
Date Recue/Date Received 2020-12-29
sample on a biosensor to start a test sequence; causing the analyte in the
sample to
undergo an enzymatic reaction; estimating an analyte concentration in the
sample;
measuring at least one physical characteristic of the sample; sensing a
temperature of
the environment proximate the biosensor; defining a specified time point from
the start
of the test sequence to sample output signals of the biosensor based on the
estimated
analyte concentration from the estimating step and at least one physical
characteristic
from the measuring step; sampling output signals of the biosensor at the
specified time
point; determining an uncompensated analyte concentration from the sampled
output
signals of the biosensor at the specified time point; and compensating the
uncompensated analyte value to a final analyte value with a temperature
compensation
term defined by a relationship in which: (a) the temperature compensation term
increases for increasing uncompensated analyte values; (b) the temperature
compensation term is inversely related to the ambient temperature proximate
the
biosensor from about 5 degrees Celsius to about 22 degrees Celsius; and (c)
the
temperature compensation term is about zero for the ambient temperature
proximate the
biosensor from about 22 degrees Celsius to about 45 degrees Celsius. The
method
includes annunciating the final analyte value.
[0014] And for these aspects, the following features may also be
utilized in various
combinations with these previously disclosed aspects: the relationship is
represented by
an equation of the following form:
G
GF __________________________ o
1+ \ _________ \
(T ¨ To )3 + x2 (T ¨ To )2 + x3 (T ¨ To )
x4 (log(Go ))3 + x5 (log(Go ))2 + x6 (log (Go )) + 1
Where:
GF comprises the final analyte value
Go comprises the uncompensated analyte value
T comprises the temperature measured by the meter (in C);
To comprises about 22 C (nominal temperature);
Xi comprises about 4.69e-4,
X2 comprises about -2.19e-2,
X3 comprises about 2.80e-1,
X4 comprises about 2.99e0,
xs comprises about -3.89e1, and
X6 comprises about 1.32e2.
[0015] Alternatively, the relationship is represented by an equation of the
following form:
6
Date Recue/Date Received 2020-12-29
Go
GF __________________________________________________________
1+ \3 \ 2
¨ To + x2 ¨ To + x3(T¨ To )
X4 (Go ¨ Gnom)3 + x5 (Go ¨ Gnom)2 + x6 (Go ¨ Gnom)+ x7
Where:
GF comprises the final analyte value
Go comprises the uncompensated analyte value
Gnominai comprises a nominal analyte value
T comprises the temperature measured by the meter (in C)
To comprises about 22 C (nominal temperature).
Xi comprises about 4.80e-5,
X2 comprises about -6.90e-3,
X3 comprises about 2.18e-1,
X4 comprises about 9.18e-6,
X5 comprises about -5.02e-3,
X6 comprises about 1.18e0, and
X7 comprises about 2.41e-2.
[0016] In these prior aspects described above, the microcontroller is
configured to: (a) apply a
first signal to the plurality of electrodes so that a physical characteristic
of the fluid
sample is determined; (b) estimate an analyte concentration based on a
predetermined
sampling time point during a test sequence; (c) apply a second signal to the
plurality of
electrodes; (d) measure output signal from the plurality of electrodes at a
specified
sampling time during the test sequence dictated by the determined physical
characteristic so that an analyte concentration is calculated from the output
signal of the
plurality of electrodes, the specified sampling time is calculated using an
equation of
the form:
SpecifiedSamplingTime = xaHxb + xc
where
"SpecifiedSamplingTime" is designated as a time point
from the start of the test sequence at which to sample
the output signal of the test strip,
H represents the physical characteristic of the sample;
xa represents about 4.3e5;
Xb represents about -3.9; and
xc represents about 4.8.
7
Date Recue/Date Received 2020-12-29
[0017] For these aspects, the microcontroller determines the uncompensated
analyte
concentration with an equation of the form:
[IT ¨ Intercept]
Go =
Slope
where
Go represents an uncompensated analyte concentration;
IT represents a signal measured at the SpecifiedSamplingTime;
Slope represents the value obtained from calibration testing of a batch of
test
strips of which this particular strip comes from; and
Intercept represents the value obtained from calibration testing of a batch of
test
strips of which this particular strip comes from.
[0018] Also, for the above aspects, the microcontroller determines a specified
sampling time
based on: (a) a physical characteristic of the fluid sample; and (b) an
estimated analyte
concentration from the sample. The microcontroller estimates the analyte
concentration with an equation of the form:
(-/E x2 )
Gest =
where Gest represents the estimated analyte
concentration;
/Eis the signal measured at about 2.5 seconds;
xi comprises a calibration slope of a particular batch of
biosensors;
X2 comprises a calibration intercept of a particular batch of
biosensors; and
in which the microcontroller determines the uncompensated analyte
concentration with an equation of the form:
Go = (is ¨ x4)
X3
where: Go represents the uncompensated analyte
concentration;
Is comprises the signal measured at the specified sampling time;
8
Date Recue/Date Received 2020-12-29
X3 comprises a calibration slope of a particular batch of biosensors; and
X4 comprises the intercept of a particular batch of biosensors.
[0019] For the prior aspects, the plurality of electrodes comprises at least
two electrodes to
measure the physical characteristic and at least two other electrodes to
measure the
analyte concentration; the at least two electrodes and the at least two other
electrodes
are disposed in the same chamber provided on the substrate; the at least two
electrodes
and the at least two other electrodes are disposed in respective two different
chambers
provided on the substrate; all of the electrodes are disposed on the same
plane defined
by the substrate; a reagent is disposed proximate the at least two other
electrodes and
no reagent is disposed on the at least two electrodes; the final analyte
concentration is
determined from the second signal within about 10 seconds of a start of the
test
sequence; the sampling time point is selected from a look-up table that
includes a
matrix in which different qualitative categories of the estimated analyte are
set forth in
the leftmost column of the matrix and different qualitative categories of the
measured
or estimated physical characteristic are set forth in the topmost row of the
matrix and
the sampling times are provided in the remaining cells of the matrix; the
means for
determining includes means for applying a first signal to the plurality of
electrodes so
that a batch slope defined by a physical characteristic of a fluid sample is
derived and
for applying a second signal to the plurality of electrodes so that an analyte
concentration is determined based on the derived batch slope and the specified
sampling time; the means for determining includes means for estimating an
analyte
concentration based on a predetermined sampling time point from the start of
the test
sequence and for selecting a specified sampling time from a matrix of
estimated analyte
concentration and sensed or estimated physical characteristic; the means for
determining includes means for selecting a batch slope based on the sensed or
estimated physical characteristic and for ascertaining the specified sampling
time from
the batch slope; the applying of the signal comprises: (a) applying a first
signal to the
sample to measure a physical characteristic of the sample; and (b) driving a
second
signal to the sample to cause an enzymatic reaction of the analyte and the
reagent,
wherein the calculating step comprises: estimating an analyte concentration
based on a
predetermined sampling time point from the start of the test sequence;
selecting a
sampling time point from a look-up table having different qualitative
categories of the
estimated analyte and different qualitative categories of the measured or
estimated
9
Date Recue/Date Received 2020-12-29
physical characteristic indexed against different sampling time points;
sampling signal
output from the sample at the selected sampling time point; calculating an
analyte
concentration from measured output signal sampled at said selected sampling
time
point in accordance with an equation of the form:
G _[IT ¨ Intercept]
0 ¨ Slope
where
GO represents an uncompensated analyte concentration;
IT represents a signal (proportional to analyte concentration) measured at the
selected sampling time T;
Slope represents the value obtained from calibration testing of a batch of
test
strips of which this particular strip comes from; and
Intercept represents the value obtained from calibration testing of a batch of
test
strips of which this particular strip comes from.
[0020] In the prior aspects, the applying step comprises: (a) applying a first
signal to the
sample to measure a physical characteristic of the fluid sample; and (b)
driving a
second signal to the sample to cause an enzymatic reaction of the analyte and
the
reagent, and the calculating step comprises: estimating an analyte
concentration based
on a predetermined sampling time point from the start of the test sequence;
selecting a
sampling time point based on both the measured or estimated physical
characteristic
and the estimated analyte concentration; sampling signal output from the
sample at the
selected sampling time point; calculating an analyte concentration from
measured
output signal sampled at said selected sampling time point; the measuring
comprises
applying a first signal to the sample to measure a physical characteristic of
the sample;
the causing step comprises driving a second signal to the sample; the
measuring
comprises evaluating an output signal from at least two electrodes of the
biosensor at a
point in time after the start of the test sequence, in which the point in time
is set as a
function of at least the measured or estimated physical characteristic; and
the
determining step comprises calculating an analyte concentration from the
measured
output signal at said point in time; further comprising estimating an analyte
concentration based on a predetermined sampling time point from the start of
the test
sequence; the defining comprises selecting a defined time point based on both
the
measured or estimated physical characteristic and the estimated analyte
concentration;
Date Recue/Date Received 2020-12-29
further comprising estimating an analyte concentration based on a measurement
of the
output signal at a predetermined time; the predetermined time comprises about
2.5
seconds from the start of the test sequence; the estimating comprises
comparing the
estimated analyte concentration and the measured or estimated physical
characteristic
against a look-up table having different respective ranges of analyte
concentration and
physical characteristic of the sample indexed against different sample
measurement
times so that the point in time for measurement of the output from the sample
of the
second signal is obtained for the calculating step; the applying of the first
signal and
the driving of the second signal is sequential; the applying of the first
signal overlaps
with the driving of the second signal; the applying of the first signal
comprises
directing an alternating signal to the sample so that a physical
characteristic of the
sample is determined from an output of the alternating signal; the applying of
the first
signal comprises directing an electromagnetic signal to the sample so that a
physical
characteristic of the sample is determined from an output of the
electromagnetic signal;
the physical characteristic comprises at least one of viscosity, hematocrit,
temperature
and density; the physical characteristic comprises hematocrit and the analyte
comprises
glucose; the directing comprises driving first and second alternating signal
at different
respective frequencies in which a first frequency is lower than the second
frequency;
the first frequency is at least one order of magnitude lower than the second
frequency;
the first frequency comprises any frequency in the range of about 10kHz to
about
250kHz; the sampling comprises sampling the signal output continuously at the
start of
the test sequence until at least about 10 seconds after the start; the
sampling time point
is selected from a look-up table that includes a matrix in which different
qualitative
categories of the estimated analyte are set forth in the leftmost column of
the matrix
and different qualitative categories of the measured or estimated physical
characteristic
are set forth in the topmost row of the matrix and the sampling times are
provided in
the remaining cells of the matrix.
[0021] In the aforementioned aspects of the disclosure, the steps of
determining,
estimating, calculating, computing, deriving and/or utilizing (possibly in
conjunction
with an equation) may be performed by an electronic circuit or a processor.
These
steps may also be implemented as executable instructions stored on a computer
readable medium; the instructions, when executed by a computer may perform the
steps
of any one of the aforementioned methods.
11
Date Recue/Date Received 2020-12-29
[0022] In additional aspects of the disclosure, there are computer
readable media, each
medium comprising executable instructions, which, when executed by a computer,
perform the steps of any one of the aforementioned methods.
[0023] In additional aspects of the disclosure, there are devices,
such as test meters or
analyte testing devices, each device or meter comprising an electronic circuit
or
processor configured to perform the steps of any one of the aforementioned
methods.
[0024] These and other embodiments, features and advantages will
become apparent to
those skilled in the art when taken with reference to the following more
detailed
description of the exemplary embodiments of the invention in conjunction with
the
accompanying drawings that are first briefly described.
BRIEF DESCRIPTION OF THE DRAWINGS
[0025] The accompanying drawings, which are incorporated herein and
constitute part
of this specification, illustrate presently preferred embodiments of the
invention, and,
together with the general description given above and the detailed description
given
below, serve to explain features of the invention (wherein like numerals
represent like
elements), in which:
[0026] FIGURE 1A illustrates an analyte measurement system including a
meter and a
biosensor.
[0027] Figure 1B illustrates yet another analyte measurement system
including a meter
and a biosensor.
[0028] FIGURE 2A illustrates in simplified schematic form the
components of the meter
200.
[0029] FIGURE 2B illustrates in simplified schematic form a preferred
implementation
of a variation of meter 200.
[0030] FIGURE 2C is a simplified block diagram of various blocks of
the hand-held test
meter of Figures 1A and 1B;
[0031] FIGURE 2D is a simplified block diagram of a physical
characteristic
measurement block as can be employed in embodiments according to the present
disclosure;
[0032] FIGURE 2E is a simplified annotated schematic diagram of a dual
low pass filter
sub-block as can be employed in embodiments of the present disclosure;
12
Date Recue/Date Received 2020-12-29
[0033] FIGURE 2F is a simplified annotated schematic diagram of a
transimpedance
amplifier (TIA) sub-block as can be employed in embodiments of the present
disclosure;
[0034] FIGURE 2G is a simplified annotated schematic block diagram
depicting a dual
low pass filter sub-block, a calibration load sub-block, an biosensor sample
cell
interface sub-block, a transimpedance amplifier sub-block, an XOR phase shift
measurement sub-block and a Quadratur DEMUX phase-shift measurement sub-block
as can be employed in a physical characteristic measurement block of
embodiments of
the present disclosure
[0035] FIGURE 3A(1) illustrates the test strip 100 of the system of
FIGURE 1 in which
there are two physical characteristic sensing electrodes upstream of the
measurement
electrodes.
[0036] FIGURE 3A(2) illustrates a variation of the test strip of
FIGURE 3A(1) in which a
shielding or grounding electrode is provided for proximate the entrance of the
test
chamber;
[0037] FIGURE 3A(3) illustrates a variation of the test strip of
FIGURE 3A(2) in which a
reagent area has been extended upstream to cover at least one of the physical
characteristic sensing electrodes;
[0038] FIGURE 3A(4) illustrates a variation of test strip 100 of
FIGURES 3A(1), 3A(2)
and 3A(3) in which certain components of the test strip have been integrated
together
into a single unit;
[0039] FIGURE 3B illustrates a variation of the test strip of FIGURE
3A(1), 3A(2), or
3A(3) in which one physical characteristic sensing electrode is disposed
proximate the
entrance and the other physical characteristic sensing electrode is at the
terminal end of
the test cell with the measurement electrodes disposed between the pair of
physical
characteristic sensing electrodes.
[0040] FIGURES 3C and 3D illustrate variations of FIGURE 3A(1), 3A(2),
or 3A(3) in
which the physical characteristic sensing electrodes are disposed next to each
other at
the terminal end of the test chamber with the measurement electrodes upstream
of the
physical characteristic sensing electrodes.
[0041] FIGURES 3E and 3F illustrates a physical characteristic sensing
electrodes
arrangement similar to that of FIGURE 3A(1), 3A(2), or 3A(3) in which the pair
of
physical characteristic sensing electrodes are proximate the entrance of the
test
chamber.
13
Date Recue/Date Received 2020-12-29
[0042] FIGURE 4A illustrates a graph of time over applied potential
to the biosensor
of FIGUREs 3A(1), 3A(2), 3A(3) and 3B-3F.
[0043] FIGURE 4B illustrates a graph of time over output current from
the biosensor of
FIGUREs 3A(1), 3A(2), 3A(3) and 3B-3F.
[0044] FIGURE 5 illustrates an exemplary waveform applied to the test
chamber and a
waveform as measured from the test chamber to show a time delay between the
waveforms.
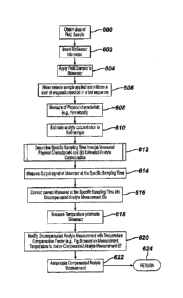
[0045] FIGURE 6 illustrates a logic diagram of an exemplary method to
achieve a more
accurate analyte determination.
[0046] FIGURE 7 illustrates a signal output transient of the biosensor
and the range of
time point utilized for determination of the analyte, as well as the
estimation of the
analyte concentration.
[0047] FIGURE 8 illustrates data from test measurements conducted with
the exemplary
technique herein such that the data show the bias of less than about 10% for
the
hematocrit range of about 30% to about 55%.
[0048] FIGURE 9 illustrates the temperature compensation factors as
applied to
uncompensated analyte measurements.
[0049] FIGURE 10 illustrates the results from 24 batches of biosensor
where the results
have been compensated to account for temperature effect upon the
electrochemical
reaction of the analyte in the fluid sample as compared to reference values.
[0050] FIGURES 11A-11E illustrates the results of the 24 batches and
the average bias
to nominal temperatures at varying analyte measurements and environmental
temperatures.
MODES OF CARRYING OUT THE INVENTION
[0051] The following detailed description should be read with reference to the
drawings, in
which like elements in different drawings are identically numbered. The
drawings,
which are not necessarily to scale, depict selected embodiments and are not
intended to
limit the scope of the invention. The detailed description illustrates by way
of example,
not by way of limitation, the principles of the invention. This description
will clearly
enable one skilled in the art to make and use the invention, and describes
several
embodiments, adaptations, variations, alternatives and uses of the invention,
including
what is presently believed to be the best mode of carrying out the invention.
14
Date Recue/Date Received 2020-12-29
[0052] As used herein, the terms "about" or "approximately" for any numerical
values or
ranges indicate a suitable dimensional tolerance that allows the part or
collection of
components to function for its intended purpose as described herein. More
specifically,
"about" or "approximately" may refer to the range of values 10% of the
recited value,
e.g. "about 90%" may refer to the range of values from 81% to 99%. In
addition, as
used herein, the terms "patient," "host," "user," and "subject" refer to any
human or
animal subject and are not intended to limit the systems or methods to human
use,
although use of the subject invention in a human patient represents a
preferred
embodiment. As used herein, "oscillating signal" includes voltage signal(s) or
current
signal(s) that, respectively, change polarity or alternate direction of
current or are multi-
directional. Also used herein, the phrase "electrical signal" or "signal" is
intended to
include direct current signal, alternating signal or any signal within the
electromagnetic
spectrum. The terms "processor"; "microprocessor"; or "microcontroller" are
intended
to have the same meaning and are intended to be used interchangeably. As used
herein,
the term "annunciated" and variations on its root term indicate that an
announcement
may be provided via text, audio, visual or a combination of all modes or
mediums of
communication to a user.
[0053] FIGURE 1A illustrates a test meter 200 for testing analyte (e.g.,
glucose) levels in the
blood of an individual with a biosensor produced by the methods and techniques
illustrated and described herein. Test meter 200 may include user interface
inputs (206,
210, 214), which can be in the form of buttons, for entry of data, navigation
of menus,
and execution of commands. Data can include values representative of analyte
concentration, and/or information that are related to the everyday lifestyle
of an
individual. Information, which is related to the everyday lifestyle, can
include food
intake, medication use, the occurrence of health check-ups, general health
condition
and exercise levels of an individual. Test meter 200 can also include a
display 204 that
can be used to report measured glucose levels, and to facilitate entry of
lifestyle related
information.
[0054] Test meter 200 may include a first user interface input 206, a second
user interface
input 210, and a third user interface input 214. User interface inputs 206,
210, and 214
facilitate entry and analysis of data stored in the testing device, enabling a
user to
navigate through the user interface displayed on display 204. User interface
inputs 206,
210, and 214 include a first marking 208, a second marking 212, and a third
marking
216, which help in correlating user interface inputs to characters on display
204.
Date Recue/Date Received 2020-12-29
[0055] Test meter 200 can be turned on by inserting a biosensor 100 (or its
variants) into a
strip port connector 220, by pressing and briefly holding first user interface
input 206,
or by the detection of data traffic across a data port 218. Test meter 200 can
be
switched off by removing biosensor 100 (or its variants), pressing and briefly
holding
first user interface input 206, navigating to and selecting a meter off option
from a main
menu screen, or by not pressing any buttons for a predetermined time. Display
104 can
optionally include a backlight.
[0056] In one embodiment, test meter 200 can be configured to not receive a
calibration input
for example, from any external source, when switching from a first test strip
batch to a
second test strip batch. Thus, in one exemplary embodiment, the meter is
configured to
not receive a calibration input from external sources, such as a user
interface (such as
inputs 206, 210, 214), an inserted test strip, a separate code key or a code
strip, data
port 218. Such a calibration input is not necessary when all of the biosensor
batches
have a substantially uniform calibration characteristic. The calibration input
can be a
set of values ascribed to a particular biosensor batch. For example, the
calibration input
can include a batch slope and a batch intercept value for a particular
biosensor batch.
The calibrations input, such as batch slope and intercept values, may be
preset within
the meter as will be described below.
[0057] Referring to FIGURE 2A, an exemplary internal layout of test meter 200
is shown. Test
meter 200 may include a processor 300, which in some embodiments described and
illustrated herein is a 32-bit RISC microcontroller. In the preferred
embodiments
described and illustrated herein, processor 300 is preferably selected from
the MSP 430
family of ultra-low power microcontrollers manufactured by Texas InstrumentsTM
of
Dallas, Texas. The processor can be bi-directionally connected via I/O ports
314 to a
memory 302, which in some embodiments described and illustrated herein is an
EEPROM. Also connected to processor 300 via I/O ports 314 are the data port
218, the
user interface inputs 206, 210, and 212, and a display driver 320. Data port
218 can be
connected to processor 300, thereby enabling transfer of data between memory
302 and
an external device, such as a personal computer. User interface inputs 206,
210, and
214 are directly connected to processor 300. Processor 300 controls display
204 via
display driver 320. Memory 302 may be pre-loaded with calibration information,
such
as batch slope and batch intercept values, during production of test meter
200. This
pre-loaded calibration information can be accessed and used by processor 300
upon
receiving a suitable signal (such as current) from the strip via strip port
connector 220
16
Date Recue/Date Received 2020-12-29
so as to calculate a corresponding analyte level (such as blood glucose
concentration)
using the signal and the calibration information without receiving calibration
input
from any external source.
[0058] In embodiments described and illustrated herein, test meter 200 may
include an
Application Specific Integrated Circuit (ASIC) 304, so as to provide
electronic circuitry
used in measurements of glucose level in blood that has been applied to a test
strip 100
(or its variants) inserted into strip port connector 220. Analog voltages can
pass to and
from ASIC 304 by way of an analog interface 306. Analog signals from analog
interface 306 can be converted to digital signals by an A/D converter 316.
Processor
300 further includes a core 308, a ROM 310 (containing computer code), a RAM
312,
and a clock 318. In one embodiment, the processor 300 is configured (or
programmed)
to disable all of the user interface inputs except for a single input upon a
display of an
analyte value by the display unit such as, for example, during a time period
after an
analyte measurement. In an alternative embodiment, the processor 300 is
configured
(or programmed) to ignore any input from all of the user interface inputs
except for a
single input upon a display of an analyte value by the display unit. Detailed
descriptions and illustrations of the meter 200 are shown and described in
International
Patent Application Publication No. W02006070200, which is hereby incorporated
by
reference into this application as if fully set forth herein.
[0059] Referring to FIGUREs 1B AND 2C THROUGH 2G, another embodiment of a hand-
held
test meter 200 is provided. This version of the meter 200 includes a display
102, a
plurality of user interface buttons 104, a strip port connector 106, a USB
interface 108,
and a housing 110. Referring to FIGUREs 1B AND 2C in particular, hand-held
test
meter 200 also includes a microcontroller block 112, a physical characteristic
(hematocrit) measurement block 114, a display control block 116, a memory
block 118
and other electronic components (not shown) for applying a test voltage to
biosensor,
and also for measuring an electrochemical response (e.g., plurality of test
current
values) and determining an analyte based on the electrochemical response. To
simplify
the current descriptions, the FIGURES do not depict all such electronic
circuitry.
[0060] Display 102 can be, for example, a liquid crystal display or a bi-
stable display
configured to show a screen image. An example of a screen image may include a
glucose concentration, a date and time, an error message, and a user interface
for
instructing an end user how to perform a test.
17
Date Recue/Date Received 2020-12-29
[0061] Strip port connector 106 is configured to operatively interface with a
biosensor 100,
such as an electrochemical-based biosensor configured for the determination of
glucose
in a whole blood sample. Therefore, the biosensor is configured for operative
insertion
into strip port connector 106 and to operatively interface with phase-shift-
based
hematocrit measurement block 114 via, for example, suitable electrical
contacts.
[0062] USB Interface 108 can be any suitable interface known to one skilled in
the art. USB
Interface 108 is essentially a passive component that is configured to power
and
provide a data line to hand-held test meter 200.
[0063] Once a biosensor is interfaced with hand-held test meter 200, or prior
thereto, a bodily
fluid sample (e.g., a whole blood sample) is introduced into a sample chamber
of the
biosensor. The biosensor can include enzymatic reagents that selectively and
quantitatively transform an analyte into another predetermined chemical form.
For
example, the biosensor can include an enzymatic reagent with ferricyanide and
glucose
oxidase so that glucose can be physically transformed into an oxidized form.
[0064] Memory block 118 of hand-held test meter 200 includes a suitable
algorithm and can be
configured, along with microcontroller block 112 to determine an analyte based
on the
electrochemical response of biosensor and the hematocrit of the introduced
sample.
For example, in the determination of the analyte blood glucose, the hematocrit
can be
used to compensate for the effect of hematocrit on electrochemically
determined blood
glucose concentrations.
[0065] Microcontroller block 112 is disposed within housing 110 and can
include any
suitable microcontroller and/or micro-processer known to those of skill in the
art. One
such suitable microcontroller is a microcontroller commercially available from
Texas
Instruments TM, Dallas, TX USA and part number MSP430F5138. This
microcontroller
can generate a square wave of 25 to 250 kHz and a 90 degree phase-shifted wave
of the
same frequency and, thereby, function as a signal generation s-block described
further
below. MSP430F5138 also has Analog-to-Digital (AID) processing capabilities
suitable for measuring voltages generated by phase shift based hematocrit
measurement
blocks employed in embodiments of the present disclosure.
18
Date Recue/Date Received 2020-12-29
[0066] Referring in particular to FIGURE 2D, phase-shift-based hematocrit
measurement
block 114 includes a signal generation sub-block 120, a low pass filter sub-
block 122,
an biosensor sample cell interface sub-block 124, an optional calibration load
block 126
(within the dashed lines of FIGURE 2D), a transimpedance amplifier sub-block
128,
and a phase detector sub-block 130.
[0067] As described further below, phase-shift-based hematocrit measurement
block 114 and
microcontroller block 112 are configured to measure the phase shift of a
bodily fluid
sample in a sample cell of an biosensor inserted in the hand-held test meter
by, for
example, measuring the phase shift of one or more high frequency electrical
signals
driven through the bodily fluid sample. In addition, microcontroller block 112
is
configured to compute the hematocrit of the bodily fluid based on the measured
phase
shift. Microcontroller 112 can compute the hematocrit by, for example,
employing an
AID converter to measure voltages received from a phase-detector sub-block,
convert
the voltages into a phase-shift and then employing a suitable algorithm or
look-up table
to convert the phase-shit into a hematocrit value. Once apprised of the
present
disclosure, one skilled in the art will recognize that such an algorithm
and/or look-up
table will be configured to take into account various factors such as strip
geometry
(including electrode area and sample chamber volume) and signal frequency.
[0068] It has been determined that a relationship exists between the reactance
of a whole
blood sample and the hematocrit of that sample. Electrical modeling of a
bodily fluid
sample (i.e., a whole blood sample) as parallel capacitive and resistive
components
indicates that when an alternating current (AC) signal is forced through the
bodily fluid
sample, the phase shift of the AC signal will be dependent on both the
frequency of the
AC voltage and the hematocrit of the sample. Moreover, modeling indicates that
hematocrit has a relatively minor effect on the phase shift when the frequency
of the
signal is in the range of approximately 10 kHz to 25 kHz and a maximum effect
on the
phase shift when the frequency of the signal is in the range of approximately
250 kHz
to 500 KHz. Therefore, the hematocrit of a bodily fluid sample can be measured
by,
for example, driving AC signals of known frequency through the bodily fluid
sample
and detecting their phase shift. For example, the phase-shift of a signal with
a
19
Date Recue/Date Received 2020-12-29
frequency in the range of 10 kHz to 25 kHz can be used as a reference reading
in such
a hematocrit measurement while the phase shift of a signal with a frequency in
the
range of 250 kHz to 500 kHz can be used as the primary measurement.
[0069] Referring to FIGURES 2C-2G, in particular, signal generation sub-block
120 can be any
suitable signal generation block and is configured to generate a square wave
(OV to
Vref) of a desired frequency. Such a signal generation sub-block can, if
desired, be
integrated into microcontroller block 112.
[0070] The signal generated by signal generation sub-block 120 is communicated
to dual low
pass filter sub-block 122, which is configured to convert the square wave
signal to a
sine wave signal of a predetermined frequency. The dual LPF of FIGURE 2E is
configured to provide both a signal of a first frequency (such as a frequency
in the
range of 10kHz to 25kHz) and a signal of a second frequency (such as a
frequency in
the range of 250 kHz to 500kHz) to the biosensor sample cell interface sub-
block and
an biosensors' sample chamber (also referred to as the HCT measurement cell).
Selection of the first and second frequency is accomplished using switch IC7
of
FIGURE 2E. The dual LPF of FIGURE 2E includes employs two suitable operational
amplifiers (IC4 and IC5) such as the operational amplifier available from
Texas
InstmmentsTM, Dallas, Texas, USA as high-speed, voltage feedback, CMOS
operational amplifier part number 0PA354.
[0071] Referring to FIGURE 2E, F-DRV represents a square wave input of either
a low or high
frequency (e.g., 25kHz or 250 kHz) and is connected to both IC4 and ICS.
Signal Fi-
HIGH/LOW (from the microcontroller) selects the output of dual low pass filter
sub-
block 122 via switch IC7. C5 in FIGURE 2E is configured to block the operating
voltage
of dual low pass filter sub-block 122 from the HCT measurement cell.
[0072]
Although a specific dual LPF is depicted in FIGURE 2E, dual low pass filter
sub-
block 122 can be any suitable low pass filter sub-block known to one skilled
in the art
including, for example, any suitable multiple feedback low pass filter, or a
Sallen and
Key low pass filter.
Date Recue/Date Received 2020-12-29
[0073] The
sine wave produced by low pass filter sub-block 122 is communicated to
biosensor sample cell interface sub-block 124 where it is driven across the
sample cell
of the biosensor (also referred to as an HCT measurement cell). Biosensor
sample cell
interface block 124 can be any suitable sample cell interface block including,
for
example, an interface block configured to operatively interface with the
sample cell of
the biosensor via first electrode and second electrodes of the biosensor
disposed in the
sample cell. In such a configuration, the signal can be driven into the sample
cell (from
the low pass filter sub-block) via the first electrode and picked-up from the
sample cell
(by the transimpedance amplifier sub-block) via the second electrode as
depicted in
FIGURE 2G.
[0074] The
current produced by driving the signal across the sample cell is picked-up
by transimpedance amplifier sub-block 128 and converted into a voltage signal
for
communication to phase detector sub-block 130.
[0075]
Transimpedance sub-block 128 can be any suitable transimpedance sub-block
known to one skilled in the art. FIGURE 2F is a simplified annotated schematic
block
diagram of one such transimpedance amplifier sub-block (based on two 0PA354
operational amplifiers, IC3 and IC9). The first stage of TIA sub-block 128
operates at,
for example, 400mV, which limits the AC amplitude to +/-400mV. The second
stage
of TIA sub-block 128 operates at Vref/2, a configuration which enables the
generation
of an output of the full span of the microcontroller AID inputs. C9 of TIA sub-
block
128 serves as a blocking component that only allows an AC sine wave signal to
pass.
[0076]
Phase detector sub-block 130 can be any suitable phase detector sub-block that
produces either a digital frequency that can be read back by microcontroller
block 112
using a capture function, or an analog voltage that can be read back by
microcontroller
block 112 using an analog to digital converter. FIGURE 2G depicts a schematic
that
includes two such phase detector sub-blocks, namely an XOR phase detector (in
the
upper half of FIGURE 2G and including IC22 and IC23) and a Quadrature DEMUX
phase detector (in the lower half of FIGURE 2G and including IC12 and IC13).
[0077] FIGURE 2G also depicts a calibration load sub-block 126 that includes a
switch
(I06) and a dummy load R7 and C6. Calibration load sub-block 126 is configured
for
21
Date Recue/Date Received 2020-12-29
the dynamic measurement of a phase offset for the known phase shift of zero
degrees
produced by resistor R7, thus providing a phase offset for use in calibration.
C6 is
configured to force a predetermined slight phase shift, e.g. to compensate for
phase
delays caused by parasitic capacities in the signal traces to the sample cell,
or for phase
delays in the electrical circuits (LPF and TIA).
[0078] The Quadrature DEMUX phase detector circuit of FIGURE 2G includes two
portions,
one portion for a resistive part of the incoming AC signal and one portion for
the
reactive portion of the incoming AC signal. Use of such two portions enables
the
simultaneous measurement of both the resistive and reactive portion of the AC
signal
and a measurement range that covers 0 degrees to 360 degrees. The Quadrature
DEMUX circuit of FIGURE 2G generates two separate output voltages. One of
these
output voltages represents the "in phase measurement" and is proportional to
the
"resistive" part of the AC signal, the other output voltage represents the
"Quadrature
Measurement" and is proportional to the "reactive part of the signal. The
phase shift is
calculated as:
= tan-1 (VQUAD-PHASE I VIN-PHASE)
[0079] Such a Quadrature DEMUX phase detector circuit can also be employed to
measure the
impedance of a bodily fluid sample in the sample cell. It is hypothesized,
without
being bound, that the impedance could be employed along with the phase-shift,
or
independently thereof, to determine the hematocrit of the bodily sample. The
amplitude of a signal forced through the sample cell can be calculated using
the two
voltage outputs of the Quadrature DEMUX circuit as follows:
Amplitude = SQR ((VQuAD-pHAsE)2 + (VIN-pHAsE)2)
[0080] This amplitude can then be compared to an amplitude measured for the
known resistor
of calibration load block 126 to determine the impedance.
[0081] The XOR phase detector portion has a measurement range of 00 to 180 ,
or
alternatively a measurement range of -90 to +90 , depending whether the
"Square
wave input from [LC" is in phase to the sine wave or is set to a 90 phase
shift. The
22
Date Recue/Date Received 2020-12-29
XOR phase detector produces an output frequency that is always double the
input
frequency, however the duty cycle varies. If both inputs are perfectly in
phase, the
output is LOW, if both inputs are 180 shifted the output is always HIGH. By
integrating the output signal (e.g. via a simple RC element) a voltage can be
generated
that is directly proportional to the phase shift between both inputs.
[0082] As provided herein, one skilled in the art will recognize that phase
detector sub-blocks
employed in embodiments of the present disclosure can take any suitable form
and
include, for example, forms that employ rising edge capture techniques, dual
edge
capture techniques, XOR techniques and synchronous demodulation techniques.
[0083] Since low pass filter sub-block 122, transimpedance amplifier sub-block
128 and phase
detector sub-block 130 can introduce a residual phase shift into phase-shift-
based
hematocrit measurement block 114, calibration load block 126 can be optionally
included in the phase-shift-based hematocrit measurement block. Calibration
load
block 126 is configured to be essentially resistive in nature (for example a
33k-ohm
load) and, therefore, induces no phase shift between excitation voltage and
generated
current. Calibration load block 126 is configured to be switched in across the
circuit to
give a "zero" calibration reading. Once calibrated, the hand-held test meter
can
measure the phase shift of a bodily fluid sample, subtract the "zero" reading
to compute
a corrected phase shift and subsequently compute the physical characteristic
of the
sample based on the corrected phase shift.
[0084] FIGURE 3A(1) is an exemplary exploded perspective view of a test strip
100, which
may include seven layers disposed on a substrate 5. The seven layers disposed
on
substrate 5 can be a first conductive layer 50 (which can also be referred to
as electrode
layer 50), an insulation layer 16 having an opening 18, two overlapping
reagent layers
22a and 22b, an adhesive layer 60 which includes adhesive portions 24, 26, and
28, a
hydrophilic layer 70, and atop layer 80 made up of portions 36, 38, which
forms a
cover 94 for the test strip 100. Test strip 100 may be manufactured in a
series of steps
where the conductive layer 50, insulation layer 16, reagent layers 22, and
adhesive
layer 60 are sequentially deposited on substrate 5 using, for example, a
screen-printing
process. Note that the electrodes 10, 12, and 14) are disposed for contact
with the
reagent layer 22a and 22b whereas the physical characteristic sensing
electrodes 19a
and 20a are spaced apart and not in contact with the reagent layer 22.
Hydrophilic
23
Date Recue/Date Received 2020-12-29
layer 70 and top layer 80 can be disposed from a roll stock and laminated onto
substrate 5 as either an integrated laminate or as separate layers. Test strip
100 has a
distal portion 3 and a proximal portion 4 as shown in FIGURE 3A(1).
[0085] Test strip 100 may include a sample-receiving or test chamber 92
through which a
physiological fluid sample 95 may be drawn through or deposited (Fig. 3A(2)).
The
physiological fluid sample discussed herein may be blood. Sample-receiving
chamber
92 can include an inlet at a proximal end and an outlet at the side edges of
test strip
100, as illustrated in FIGURE 3A(1). A fluid sample 95 can be applied to the
inlet along
axis L-L (Fig. 3A(2)) to fill a sample-receiving chamber 92 so that glucose
can be
measured. The side edges of a first adhesive pad 24 and a second adhesive pad
26
located adjacent to reagent layer 22 each define a wall of sample-receiving
chamber 92,
as illustrated in FIGURE 3A(1). A bottom portion or "floor" of sample-
receiving
chamber 92 may include a portion of substrate 5, conductive layer 50, and
insulation
layer 16, as illustrated in FIGURE 3A(1). A top portion or "roof' of sample-
receiving
chamber 92 may include distal hydrophilic portion 32, as illustrated in FIGURE
3A(1).
For test strip 100, as illustrated in FIGURE 3A(1), substrate 5 can be used as
a
foundation for helping support subsequently applied layers. Substrate 5 can be
in the
form of a polyester sheet such as a polyethylene tetraphthalate (PET) material
(HostaphanTM PET supplied by Mitsubishi). Substrate 5 can be in a roll format,
nominally 350 microns thick by 370 millimeters wide and approximately 60
meters in
length.
[0086] A conductive layer is required for forming electrodes that can be used
for the
electrochemical measurement of glucose. First conductive layer 50 can be made
from a
carbon ink that is screen-printed onto substrate 5. In a screen-printing
process, carbon
ink is loaded onto a screen and then transferred through the screen using a
squeegee.
The printed carbon ink can be dried using hot air at about 140 C. The carbon
ink can
include VAGH resin, carbon black, graphite (KS15), and one or more solvents
for the
resin, carbon and graphite mixture. More particularly, the carbon ink may
incorporate a
ratio of carbon black: VAGH resin of about 2.90:1 and a ratio of graphite:
carbon black
of about 2.62:1 in the carbon ink.
[0087] For test strip 100, as illustrated in FIGURE 3A(1), first conductive
layer 50 may include
a reference electrode 10, a first working electrode 12, a second working
electrode 14,
third and fourth physical characteristic sensing electrodes 19a and 20a, a
first contact
pad 13, a second contact pad 15, a reference contact pad 11, a first working
electrode
24
Date Recue/Date Received 2020-12-29
track 8, a second working electrode track 9, a reference electrode track 7,
and a strip
detection bar 17. The physical characteristic sensing electrodes 19a and 20a
are
provided with respective electrode tracks 19b and 20b. The first conductive
layer 50
may be formed from carbon ink. First contact pad 13, second contact pad 15,
and
reference contact pad 11 may be adapted to electrically connect to a test
meter. First
working electrode track 8 provides an electrically continuous pathway from
first
working electrode 12 to first contact pad 13. Similarly, second working
electrode track
9 provides an electrically continuous pathway from second working electrode 14
to
second contact pad 15. Similarly, reference electrode track 7 provides an
electrically
continuous pathway from reference electrode 10 to reference contact pad 11.
Strip
detection bar 17 is electrically connected to reference contact pad 11. Third
and fourth
physical characteristic electrode tracks 19b and 20b connect to the respective
electrodes
19a and 20a. A test meter can detect that test strip 100 has been properly
inserted by
measuring a continuity between reference contact pad 11 and strip detection
bar 17, as
illustrated in FIGURE 3A(1).
[0088] Variations of the test strip 100 (FIGURE 3A(1), 3A(2), 3A(3), or 3A(4))
are shown in
FIGURES 3B-3F. Briefly, with regard to variations of test strip 100
(illustrated
exemplarily in FIGURES 3A(2), 3A(2)), these test strips include an enzymatic
reagent
layer disposed on the working electrode, a patterned spacer layer disposed
over the first
patterned conductive layer and configured to define a sample chamber within
the
biosensor, and a second patterned conductive layer disposed above the first
patterned
conductive layer. The second patterned conductive layer includes a first phase-
shift
measurement electrode and a second phase-shift measurement electrode.
Moreover, the
first and second phase-shift measurement electrodes are disposed in the sample
chamber and are configured to measure, along with the hand-held test meter, a
phase
shift of an electrical signal forced through a bodily fluid sample introduced
into the
sample chamber during use of the biosensor. Such phase-shift measurement
electrodes
are also referred to herein as bodily fluid phase-shift measurement
electrodes.
Biosensors of various embodiments described herein are believed to be
advantageous in
that, for example, the first and second phase-shift measurement electrodes are
disposed
above the working and reference electrodes, thus enabling a sample chamber of
advantageously low volume. This is in contrast to a configuration wherein the
first and
second phase-shift measurement electrodes are disposed in a co-planar
relationship
with the working and reference electrodes thus requiring a larger bodily fluid
sample
Date Recue/Date Received 2020-12-29
volume and sample chamber to enable the bodily fluid sample to cover the first
and
second phase-shift measurement electrodes as well as the working and reference
electrodes.
[0089] In the embodiment of FIGURE 3A(2) which is a variation of the test
strip of FIGURE
3A(1), an additional electrode 10a is provided as an extension of any of the
plurality of
electrodes 19a, 20a, 14, 12, and 10. It must be noted that the built-in
shielding or
grounding electrode 10a is used to reduce or eliminate any capacitance
coupling
between the finger or body of the user and the characteristic measurement
electrodes
19a and 20a. The grounding electrode 10a allows for any capacitance to be
directed
away from the sensing electrodes 19a and 20a. To do this, the grounding
electrode 10a
can be connected any one of the other five electrodes or to its own separate
contact pad
(and track) for connection to ground on the meter instead of one or more of
contact
pads 15, 17, 13 via respective tracks 7, 8, and 9. In a preferred embodiment,
the
grounding electrode 10a is connected to one of the three electrodes that has
reagent 22
disposed thereon. In a most preferred embodiment, the grounding electrode 10a
is
connected to reference electrode 10. Being the grounding electrode, it is
advantageous
to connect the grounding electrode to the reference electrode (10) so not to
contribute
any additional current to the working electrode measurements which may come
from
background interfering compounds in the sample. Further by connecting the
shield or
grounding electrode 10a to reference electrode 10 this is believed to
effectively increase
the size of the reference electrode 10 which can become limiting especially at
high
signals. In the embodiment of FIGURE 3A(2), the reagent are arranged so that
they are
not in contact with the sensing electrodes 19a and 20a. Alternatively, in the
embodiment of FIGURE 3A(3), the reagent 22 is arranged so that the reagent 22
contacts
at least one of the sensing electrodes 19a and 20a.
[0090] In alternate version of test strip 100', shown here in FIGURE 3A(4),
the top layer 38',
hydrophilic film layer 34' and spacer 29 have been combined together to form
an
integrated assembly for mounting to the substrate 5 with reagent layer 22'
disposed
proximate insulation layer 16'.
[0091] In the embodiment of FIGURE 3B, the analyte measurement electrodes 10,
12, and 14
are disposed in generally the same configuration as in Fig. 3A(1), 3A(2), or
3A(3). The
electrodes 19a and 20a to sense physical characteristic (e.g., hematocrit)
level,
however, are disposed in a spaced apart configuration in which one electrode
19a is
proximate an entrance 92a to the test chamber 92 and another electrode 20a is
at the
26
Date Recue/Date Received 2020-12-29
opposite end of the test chamber 92. Electrodes 10, 12, and 14 are disposed to
be in
contact with a reagent layer 22.
[0092] In FIGURES 3C, 3D, 3E and 3F, the physical characteristic (e.g.,
hematocrit) sensing
electrodes 19a and 20a are disposed adjacent each other and may be placed at
the
opposite end 92b of the entrance 92a to the test chamber 92 (Figs. 3C and 3D)
or
adjacent the entrance 92a (Figs. 3E and 3F). In all of these embodiments, the
physical
characteristic sensing electrodes are spaced apart from the reagent layer 22
so that these
physical characteristic sensing electrodes are not impacted by the
electrochemical
reaction of the reagent in the presence of a fluid sample (e.g., blood or
interstitial fluid)
containing glucose.
[0093] In the various embodiments of the biosensor, there are two measurements
that are made
to a fluid sample deposited on the biosensor. One measurement is that of the
concentration of the analyte (e.g. glucose) in the fluid sample while the
other is that of
physical characteristic (e.g., hematocrit) in the same sample. The measurement
of the
physical characteristic (e.g., hematocrit) is used to modify or correct the
glucose
measurement so as to remove or reduce the effect of red blood cells on the
glucose
measurements. Both measurements (glucose and hematocrit) can be performed in
sequence, simultaneously or overlapping in duration. For example, the glucose
measurement can be performed first then the physical characteristic (e.g.,
hematocrit);
the physical characteristic (e.g.. hematocrit) measurement first then the
glucose
measurement; both measurements at the same time; or a duration of one
measurement
may overlap a duration of the other measurement. Each measurement is discussed
in
detail as follow with respect to FIGURES 4A, 4B and 5.
[0094] FIGURE 4A is an exemplary chart of a test signal applied to test strip
100 and its
variations shown here in FIGURES 3A-3F. Before a fluid sample is applied to
test strip
100 (or its variants), test meter 200 is in a fluid detection mode in which a
first test
signal of about 400 millivolts is applied between second working electrode and
reference electrode. A second test signal of about 400 millivolts is
preferably applied
simultaneously between first working electrode (e.g., electrode 12 of strip
100) and
reference electrode (e.g., electrode 10 of strip 100). Alternatively, the
second test
signal may also be applied contemporaneously such that a time interval of the
application of the first test signal overlaps with a time interval in the
application of the
second test voltage. The test meter may be in a fluid detection mode during
fluid
27
Date Recue/Date Received 2020-12-29
detection time interval TFD prior to the detection of physiological fluid at
starting time
at zero. In the fluid detection mode, test meter 200 determines when a fluid
is applied
to test strip 100 (or its variants) such that the fluid wets either the first
working
electrode 12 or second working electrode 14 (or both working electrodes) with
respect
to reference electrode 10. Once test meter 200 recognizes that the
physiological fluid
has been applied because of, for example, a sufficient increase in the
measured test
current at either or both of first working electrode 12 and second working
electrode 14,
test meter 200 assigns a zero second marker at zero time "0" and starts the
test time
interval Ts. Test meter 200 may sample the current transient output at a
suitable
sampling rate, such as, for example, every 1 milliseconds to every 100
milliseconds.
Upon the completion of the test time interval Ts, the test signal is removed.
For
simplicity, FIGURE 4A only shows the first test signal applied to test strip
100 (or its
variants).
[0095] Hereafter, a description of how analyte (e.g., glucose) concentration
is determined
from the known signal transients (e.g., the measured electrical signal
response in
nanoamperes as a function of time) that are measured when the test voltages of
FIGURE
4A are applied to the test strip 100 (or its variants).
[0096] In FIGURE 4A, the first and second test voltages applied to test strip
100 (or its variants
described herein) are generally from about +100 millivolts to about +600
millivolts. In
one embodiment in which the electrodes include carbon ink and the mediator
includes
ferricyanide, the test signal is about +400 millivolts. Other mediator and
electrode
material combinations will require different test voltages, as is known to
those skilled
in the art. The duration of the test voltages is generally from about 1 to
about 5 seconds
after a reaction period and is typically about 3 seconds after a reaction
period.
Typically, test sequence time Ts is measured relative to time to. As the
voltage 401 is
maintained in FIGURE 4A for the duration of Ts, output signals are generated,
shown
here in FIGURE 4B with the current transient 702 for the first working
electrode 12
being generated starting at zero time and likewise the current transient 404
for the
second working electrode 14 is also generated with respect to the zero time.
It is noted
that while the signal transients 702 and 404 have been placed on the same
referential
zero point for purposes of explaining the process, in physical term, there is
a slight time
differential between the two signals due to fluid flow in the chamber towards
each of
the working electrodes 12 and 14 along axis L-L. However, the current
transients are
sampled and configured in the microcontroller to have the same start time. In
FIGURE
28
Date Recue/Date Received 2020-12-29
4B, the current transients build up to a peak proximate peak time Tp at which
time, the
current slowly drops off until approximately one of 2.5 seconds or 5 seconds
after zero
time. At the point 706, approximately at 5 seconds, the output signal for each
of the
working electrodes 12 and 14 may be measured and added together.
Alternatively, the
signal from only one of the working electrodes 12 and 14 can be doubled.
[0097] Referring back to Fig. 2B, the system drives a signal to measure or
sample the output
signals IE from at least one the working electrodes (12 and 14) at any one of
a plurality
of time points or positions T1, T2, T3, .... TN. As can be seen in Fig. 4B,
the time
position can be any time point or interval in the test sequence Ts. For
example, the
time position at which the output signal is measured can be a single time
point T1.5 at
1.5 seconds or an interval 708 (e.g., interval-10 milliseconds or more
depending on the
sampling rate of the system) overlapping the time point T2.8 proximate 2.8
seconds.
[0098] From knowledge of the parameters of the biosensor (e.g., batch
calibration code offset
and batch slope) for the particular test strip 100 and its variations, the
analyte (e.g.,
glucose) concentration can be calculated. Output transient 702 and 404 can be
sampled
to derive signals IE (by summation of each of the current IwEi and IwE2 or
doubling
of one of IwEi or IwE2) at various time positions during the test sequence.
From
knowledge of the batch calibration code offset and batch slope for the
particular test
strip 100, the analyte (e.g., glucose) concentration can be calculated.
[0099] It is noted that "Intercept" and "Slope" are the values obtained by
measuring
calibration data from a batch of biosensors. Typically around 1500 biosensors
are
selected at random from the lot or batch. Physiological fluid (e.g., blood)
from donors
is spiked to various analyte levels, typically six different glucose
concentrations.
Typically, blood from 12 different donors is spiked to each of the six levels.
Eight
biosensors (or strips in this embodiment) are given blood from identical
donors and
levels so that a total of 12 x 6 x 8 = 576 tests are conducted for that lot.
These are
benchmarked against actual analyte level (e.g., blood glucose concentration)
by
measuring these using a standard laboratory analyzer such as Yellow Springs
Instrument (YSI). A graph of measured glucose concentration is plotted against
actual
glucose concentration (or measured current versus YSI current) and a formula y
=
mx+c least squares fitted to the graph to give a value for batch slope m and
batch
intercept c for the remaining strips from the lot or batch. The applicants
have also
provided methods and systems in which the batch slope is derived during the
29
Date Recue/Date Received 2020-12-29
determination of an analyte concentration. The "batch slope", or "Slope", may
therefore be defined as the measured or derived gradient of the line of best
fit for a
graph of measured glucose concentration plotted against actual glucose
concentration
(or measured current versus YSI current). The "batch intercept", or
"Intercept", may
therefore be defined as the point at which the line of best fit for a graph of
measured
glucose concentration plotted against actual glucose concentration (or
measured current
versus YSI current) meets the y axis.
[00100] It is worthwhile here to note that the various components,
systems and
procedures described earlier allow for applicant to provide an analyte
measurement
system that heretofore was not available in the art. In particular, this
system includes a
biosensor that has a substrate and a plurality of electrodes connected to
respective
electrode connectors. The system further includes an analyte meter 200 that
has a
housing, a test strip port connector configured to connect to the respective
electrode
connectors of the test strip, and a microcontroller 300, shown here in FIGURE
2B. The
microcontroller 300 is in electrical communication with the test strip port
connector
220 to apply electrical signals or sense electrical signals from the plurality
of
electrodes.
[00101] Referring to FIGURE 2B, details of a preferred implementation
of meter 200
where the same numerals in FIGURES 2A and 2B have a common description. In
FIGURE 2B, a strip port connector 220 is connected to the analogue interface
306 by
five lines including an impedance sensing line EIC to receive signals from
physical
characteristic sensing electrode(s), alternating signal line AC driving
signals to the
physical characteristic sensing electrode(s), reference line for a reference
electrode, and
signal sensing lines from respective working electrode 1 and working electrode
2. A
strip detection line 221 can also be provided for the connector 220 to
indicate insertion
of a test strip. The analog interface 306 provides four inputs to the
processor 300: (1)
real impedance Z"; (2) imaginary impedance Z"; (3) signal sampled or measured
from
working electrode 1 of the biosensor or I wei; (4) signal sampled or measured
from
working electrode 2 of the biosensor or I we2. There is one output from the
processor
300 to the interface 306 to drive an oscillating signal AC of any value from
25kHz to
about 250kHz or higher to the physical characteristic sensing electrodes. A
phase
differential P (in degrees) can be determined from the real impedance Z. and
imaginary
impedance Z" where:
Date Recue/Date Received 2020-12-29
P=tan-1{Z"/Z '} Eq. 3.1
[00102] and magnitude M (in ohms and conventionally written as I Z )
from line Z' and
Z" of the interface 306 can be determined where
(z12
Eq. 3.2
[00103] In this system, the microprocessor is configured to: (a) apply
a first signal to the
plurality of electrodes so that a batch slope defined by a physical
characteristic of a
fluid sample is derived and (b) apply a second signal to the plurality of
electrodes so
that an analyte concentration is determined based on the derived batch slope.
For this
system, the plurality of electrodes of the test strip or biosensor includes at
least two
electrodes to measure the physical characteristic and at least two other
electrodes to
measure the analyte concentration. For example, the at least two electrodes
and the at
least two other electrodes are disposed in the same chamber provided on the
substrate.
Alternatively, the at least two electrodes and the at least two other
electrodes are
disposed in respective two different chambers provided on the substrate. It is
noted that
for some embodiments, all of the electrodes are disposed on the same plane
defined by
the substrate. In particular, in some of the embodiments described herein, a
reagent is
disposed proximate the at least two other electrodes and no reagent is
disposed on the at
least two electrodes. One feature of note in this system is the ability to
provide for an
accurate analyte measurement within about 10 seconds of deposition of a fluid
sample
(which may be a physiological sample) onto the biosensor as part of the test
sequence.
[00104] As an example of an analyte calculation (e.g., glucose) for
strip 100 (Fig.
3A(1), 3A(2), or 3A(3) and its variants in FIGURES 3B-3F), it is assumed in
Fig. 4B that
the sampled signal value at 706 for the first working electrode 12 is about
1600
nanoamperes whereas the signal value at 706 for the second working electrode
14 is
about 1300 nanoamperes and the calibration code of the test strip indicates
that the
Intercept is about 500 nanoamperes and the Slope is about 18
nanoamperes/mg/dL.
Glucose concentration Go can be thereafter be determined from Equation 3.3 as
follow:
Go= RIE)-Intercept]/Slope Eq. 3.3
where
IE is a signal (proportional to analyte concentration) which is the total
signal from all of the electrodes in the biosensor (e.g., for sensor 100, both
electrodes 12 and 14 (or Lvei + Iwe2));
31
Date Recue/Date Received 2020-12-29
Iwel is the signal measured for the first working electrode at the set
sampling
time;
4,2 is the signal measured for the second working electrode at the set
sampling time;
Slope is the value obtained from calibration testing of a batch of test
strips of which this particular strip comes from;
Intercept is the value obtained from calibration testing of a batch of test
strips of which this particular strip comes from.
[00105] From Eq. 3.3; Go = [(1600+1300)-5001/18 and therefore, Go =
133.33
nanoamp ¨ 133 mg/dL.
[00106] It is noted here that although the examples have been given in
relation to a
biosensor 100 which has two working electrodes (12 and 14 in Fig. 3A(1)) such
that the
measured currents from respective working electrodes have been added together
to
provide for a total measured current IE, the signal resulting from only one of
the two
working electrodes can be multiplied by two in a variation of test strip 100
where there
is only one working electrode (either electrode 12 or 14). Instead of a total
signal, an
average of the signal from each working electrode can be used as the total
measured
current IE for Equations 3.3, 6, and 5-7 described herein, and of course, with
appropriate modification to the operational coefficients (as known to those
skilled in
the art) to account for a lower total measured current IE than as compared to
an
embodiment where the measured signals are added together. Alternatively, the
average
of the measured signals can be multiplied by two and used as IE in Equations
3.3, 6,
and 5-7 without the necessity of deriving the operational coefficients as in
the prior
example. It is noted that the analyte (e.g., glucose) concentration here is
not corrected
for any physical characteristic (e.g., hematocrit value) and that certain
offsets may be
provided to the signal values Iwel and Iwe2 to account for errors or delay
time in the
electrical circuit of the meter 200. Temperature compensation can also be
utilized to
ensure that the results are calibrated to a referential temperature such as
for example
room temperature of about 20 degrees Celsius.
[00107] Now that an analyte (e.g., glucose) concentration (Go) can be
determined from
the signal IE, a description of applicant's technique to determine the
physical
characteristic (e.g., hematocrit) of the fluid sample is provided in relation
to FIGURE 5.
In FIGURE 5, the system 200 (Fig. 2) applies a first oscillating input signal
800 at a first
32
Date Recue/Date Received 2020-12-29
frequency (e.g., of about 25ki10-Hertz) to a pair of sensing electrodes. The
system is
also set up to measure or detect a first oscillating output signal 802 from
the third and
fourth electrodes, which in particular involve measuring a first time
differential Ati
between the first input and output oscillating signals. At the same time or
during
overlapping time durations, the system may also apply a second oscillating
input signal
(not shown for brevity) at a second frequency (e.g., about 100ki10-Hertz to
about
'MegaHertz or higher, and preferably about 250 kilo Hertz) to a pair of
electrodes and
then measure or detect a second oscillating output signal from the third and
fourth
electrodes, which may involve measuring a second time differential At2(not
shown)
between the first input and output oscillating signals. From these signals,
the system
estimates a physical characteristic (e.g., hematocrit) of the fluid sample
based on the
first and second time differentials Ati and At2. Thereafter, the system is
able to derive a
glucose concentration. The estimate of the physical characteristic (e.g.,
hematocrit)
can be done by applying an equation of the form
HCT =(ClAt1 ¨ C2At2 -c3)
EST
ml Eq. 4.1
where
each of Ci, C2, and C3 is an operational constant for the test strip and
mi represent a parameter from regressions data.
[00108] Another technique to determine physical characteristic (e.g.,
hematocrit) can be
by two independent measurements of physical characteristic (e.g., hematocrit).
This
can be obtained by determining: (a) the impedance of the fluid sample at a
first
frequency and (b) the phase angle of the fluid sample at a second frequency
substantially higher than the first frequency. In this technique, the fluid
sample is
modeled as a circuit having unknown reactance and unknown resistance. With
this
model, an impedance (as signified by notation" I Z I ") for measurement (a)
can be
determined from the applied voltage, the voltage across a known resistor
(e.g., the
intrinsic strip resistance), and the voltage across the unknown impedance Vz;
and
similarly, for measurement (b) the phase angle can be measured from a time
difference
between the input and output signals by those skilled in the art. Other
suitable
techniques for determining the physical characteristic (e.g., hematocrit,
viscosity,
temperature or density) of the fluid sample can also be utilized such as, for
example,
33
Date Recue/Date Received 2020-12-29
US Patent No. 4,919,770, US Patent No. 7,972,861, US Patent Application
Publication Nos. 2010/0206749, 2009/0223834, or "Electric Cell¨Substrate
Impedance Sensing (ECIS) as a Noninvasive Means to Monitor the Kinetics of
Cell
Spreading to Artificial Surfaces" by Joachim Wegener, Charles R. Keese, and
Ivar
Giaever and published by Experimental Cell Research 259, 158-166 (2000)
doi:10.1006/excr.2000.4919, available online at http://www.idealibrary.coml;
"Utilization of AC Impedance Measurements for Electrochemical Glucose Sensing
Using Glucose Oxidase to Improve Detection Selectivity" by Takuya Kohma,
Hidefumi Hasegawa, Daisuke Oyamatsu, and Susumu Kuwabata and published by
Bull. Chem. Soc. Jpn. Vol. 80, No. 1, 158-165 (2007).
[00109] Another technique to determine the physical characteristic
(e.g., hematorcrits,
density, or temperature) can be obtained by knowing the phase difference
(e.g., phase
angle) and magnitude of the impedance of the sample. In one example, the
following
relationship is provided for the estimate of the physical characteristic or
impedance
characteristic of the sample ("IC"):
IC= M2 * A *
Y1 + Y2 +y3 +P * D *
Y4 + Y5
Eq. 4.2
where: M represents a magnitude I Z I of a measured
impedance in
ohms);
P represents a phase difference between the input and output
signals (in degrees)
yi is about -3.2e-08 and 10%, 5% or 1% of the numerical value
provided hereof (and depending on the frequency of the input
signal, can be zero);
y2 is about 4.1e-03 and 10%, 5% or 1% of the numerical value
provided hereof (and depending on the frequency of the input
signal, can be zero);
y3 is about -2.5e+01 and 10%, 5% or 1% of the numerical
value provided hereof;
y4 is about 1.5e-01 and 10%, 5% or 1%
of the numerical value provided hereof (and depending on the
frequency of the input signal, can be zero); and
34
Date Recue/Date Received 2020-12-29
ys is about 5.0 and 10%, 5% or 1% of the numerical value provided hereof(and
depending
on the frequency of the input signal, can be zero);.
[00110] It is noted here that where the frequency of the input AC
signal is high (e.g.,
greater than 75kHz) then the parametric terms yi and y2 relating to the
magnitude of
impedance M may be +200% of the exemplary values given herein such that each
of
the parametric terms may include zero or even a negative value. On the other
hand,
where the frequency of the AC signal is low (e.g., less than 75 kHz), the
parametric
terms y4 and ys relating to the phase angle P may be 200% of the exemplary
values
given herein such that each of the parametric terms may include zero or even a
negative
value. It is noted here that a magnitude of H or HCT, as used herein, is
generally equal
to the magnitude of IC. In one exemplary implementation, H or HCT is equal to
IC as
H or HCT is used herein this application.
[00111] In another alternative implementation, Equation 4.3 is
provided. Equation 4.3 is
the exact derivation of the quadratic relationship, without using phase angles
as in
Equation 4.2.
-Y2 + 11y3 - (4Y3 (Y1 - M))
/C = _________________________________________
2yi Eq. 4.3
where:
IC is the Impedance Characteristic [%];
M is the magnitude of impedance [Ohm];
yi is about 1.2292e1 and 10%, 5% or 1% of the numerical value
provided hereof;
y2 is about ¨4.3431e2 and 10%, 5% or 1% of the numerical value
provided hereoff,
y3 is about 3.5260e4 and 10%, 5% or 1% of the numerical value
provided hereof
[00112] By virtue of the various components, systems and insights
provided herein, a
technique to achieve a temperature compensated analyte measurement can be
Date Recue/Date Received 2020-12-29
understood with reference to FIGURE 6. This technique involves depositing a
fluid
sample (which may be a physiological sample) on a biosensor at step 604 (e.g.,
in the
form of a test strip as show in FIGURES 3A(1), 3A(2), 3A(3) through 3F) that
has been
inserted into a meter (step 602). Once the meter 200 is turned on, a signal is
applied to
the strip 100 (or its variants) and when the sample is deposited onto the test
chamber,
the applied signal physically transforms the analyte (e.g., glucose) in the
sample into a
different physical form (e.g., gluconic acid) due to the enzymatic reaction of
the analyte
with the reagent in the test chamber. As the sample flows into the capillary
channel of
the test cell, at least one physical characteristic of the sample is obtained
(step 608)
along with estimate of the analyte concentration (step 610). From the obtained
physical
characteristic (step 608) and estimated analyte concentration (step 610), a
sampling
time point is defined (at step 612) at which the signal output from the sample
during
the test sequence is measured (at step 614) and used for calculating the
analyte
concentration in step 616. In particular, the step of obtaining the physical
characteristic
(step 608) may include applying a first signal to the sample to measure a
physical
characteristic of the sample, while the step 606 of initiating an enzymatic
reaction may
involve driving a second signal to the sample, and the step of measuring (step
614) may
entail evaluating an output signal from the at least two electrodes at a point
in time after
the start of the test sequence, in which the point in time is set (at step
612) as a function
of at least the measured or estimated physical characteristic (step 608) and
estimated
analyte concentration (step 610).
[00113] The determination of the appropriate point (or time interval)
during the test
sequence Ts as a function of the measured or estimated physical
characteristic(s) (in
step 612) can be determined by the use of a look-up table programmed into the
microprocessor of the system. For example, a look-up table may be provided
that
allows for the system to select the appropriate sampling time for the analyte
(e.g.,
glucose or ketone) with measured or known physical characteristic (e.g..
hematocrit or
viscosity) of the sample.
[00114] In particular, an appropriate sampling time point may be based
on an early
estimation of the analyte and the measured or known physical characteristic to
arrive at
the appropriate sampling time that gives the lowest error or bias as compared
to
referential values. In this technique, a look up table is provided in which
the defined
sampling time point is correlated to (a) the estimated analyte concentration
and (b) the
36
Date Recue/Date Received 2020-12-29
physical characteristic of the sample. For example, Table 1 may be programmed
into
the meter to provide a matrix in which qualitative categories (low, medium,
and high
glucose) of the estimated analyte form the main column and the qualitative
categories
(low, medium, and high) of the measured or estimated physical characteristic
form the
header row. In the second column, t/Hct is a value determined experimentally
of the
time shift per % hematocrit difference from nominal hematocrit of 42%. As one
example, for 55% hematocrit at "Mid-Glucose" would indicate a time shift of
(42 -55)*90 = -1170ms. The time of -1170 milliseconds is added to the original
test time of
about 5000 milliseconds giving (5000-1170=3830 milliseconds) ¨ 3.9 seconds.
Table 1
Estuated t/ Hct (in Sampling Time Point Sampling Sampling
mfflomm11111
11111111-
Analyte milliseconds) T for Lo Het (from Time Point I
Time Point T
m1111111111
start of test for Mid Het for High
Hct
011111
sequence, in seconds) (from start of (from start
of
test sequence, test
sequence,
in seconds) in seconds)
Lo-Glucose 40 5.5 5 4.5
Mid-Glucose 90 6.1 5 3.9
Hi-Glucose 110 6.3 5 3.6
[00115] The time T (i.e., a specified sampling time) at which the
system should be
sampling or measuring the output signal of the biosensor is based on both the
qualitative category of the estimated analyte and measured or estimated
physical
characteristic and is predetermined based on regression analysis of a large
sample size
of actual physiological fluid samples. Applicants note that the appropriate
sampling
time is measured from the start of the test sequence but any appropriate datum
may be
utilized in order to determine when to sample the output signal. As a
practical matter,
the system can be programmed to sample the output signal at an appropriate
time
sampling interval during the entire test sequence such as for example, one
sampling
every 100 milliseconds or even as little as about 1 milliseconds. By sampling
the entire
signal output transient during the test sequence, the system can perform all
of the
37
Date Recue/Date Received 2020-12-29
needed calculations near the end of the test sequence rather than attempting
to
synchronize the sampling time with the set time point, which may introduce
timing
errors due to system delay.
[00116] Applicant hereafter will discuss the look-up Table 1 in
relation to the particular
analyte of glucose in physiological fluid samples. Qualitative categories of
blood
glucose are defined in the first column of Table 1 in which low blood glucose
concentrations of less than about 70 mg/dL are designated as "Lo-Glucose";
blood
glucose concentrations of higher than about 70 mg/dL but less than about 250
mg/dL
are designated as "Mid-Glucose"; and blood glucose concentrations of higher
than
about 250 mg/dL are designated as "Hi-Glucose".
[00117] During a test sequence, an "Estimated Analyte" can be obtained
by sampling
the signal at a convenient time point, typically at five seconds during a
typical 10
seconds test sequence. The measurement sampled at this five second time point
allows
for an accurate estimate of the analyte (in this case blood glucose). The
system may
then refer to a look-up table (e.g., Table 1) to determine when to measure the
signal
output from the test chamber at a specified sampling time T based on two
criteria: (a)
estimated analyte and (b) qualitative value of the physical characteristic of
the sample.
For criteria (b), the qualitative value of the physical characteristic is
broken down into
three sub-categories of Low Hct, Mid Hct and High Hct. Thus, in the event that
the
measured or estimated physical characteristic (e.g., hematocrit) is high
(e.g., greater
than 46%) and the estimated glucose is also high, then according to Table 1,
the test
time for the system to measure the signal output of test chamber would be
about 3.6
seconds. On the other hand, if the measured hematocrit is low (e.g., less than
38%) and
the estimated glucose is low then according to Table 1, the test time T for
the system to
measure the signal output of test chamber would be about 5.5 seconds.
[00118] Once the signal output IT of the test chamber is measured at
the designated time
(which is governed by the measured or estimated physical characteristic), the
signal IT
is thereafter used in the calculation of the analyte concentration (in this
case glucose)
with Equation 5 below.
[I ¨ Intercept]
Go= Eq. 5
Slope
where
GO represents an analyte concentration;
38
Date Recue/Date Received 2020-12-29
IT represents a signal (proportional to analyte concentration) determined from
the sum
of the end signals measured at a specified sampling time T, which may be the
total current
measured at the specified sampling time T;
Slope represents the value obtained from calibration testing of a batch of
test
strips of which this particular strip comes from and is typically about 0.02;
and
Intercept represents the value obtained from calibration testing of a batch of
test
strips of which this particular strip comes from and is typically from about
0.6 to about
0.7.
[00119] It should be noted that the step of applying the first signal
and the driving of
the second signal is sequential in that the order may be the first signal then
the second
signal or both signals overlapping in sequence; alternatively, the second
signal first
then the first signal or both signals overlapping in sequence. Alternatively,
the
applying of the first signal and the driving of the second signal may take
place
simultaneously.
[00120] In the method, the step of applying of the first signal
involves directing an
alternating signal provided by an appropriate power source (e.g., the meter
200) to the
sample so that a physical characteristic of the sample is determined from an
output of
the alternating signal. The physical characteristic being detected may be one
or more of
viscosity, hematocrit or density. The directing step may include driving first
and
second alternating signal at different respective frequencies in which a first
frequency is
lower than the second frequency. Preferably, the first frequency is at least
one order of
magnitude lower than the second frequency. As an example, the first frequency
may be
any frequency in the range of about 10 kHz to about 100 kHz and the second
frequency
may be from about 250 kHz to about 1 MHz or more. As used herein, the phrase
"alternating signal" or "oscillating signal" can have some portions of the
signal
alternating in polarity or all alternating current signal or an alternating
current with a
direct current offset or even a multi-directional signal combined with a
direct-current
signal.
[00121] Further refinements of Table 1 based on additional
investigations of the
technique allowed applicants to devise Table 2, shown below.
39
Date Recue/Date Received 2020-12-29
Table 2. Specified Sampling Time to Estimated G and Measured or Estimated
Physical
Characteristic
Estimated
[mg/dL] Measured or Estimated Physical Characteristic (e.g., HCT
24 27 p30
33 36 39 42 45 48 51 54 57 p 60
25 4.6 4.6 IM4.5 4.4 4.4 4.4 4.3 4.3 4.3 4.2 4.1 4.1 1114.1
50 5 4.9 14.8 4.7 4.7 4.6 4.5 4.4 4.3 4.2
4.1 4 "III " 4
75 5.3 5.3 1'115.2 5 4.9 4.8 4.7 4.5
4.4 4.3 4.1 4 111113.8
100 5.8 5.6 111'5.4 5.3 5.1 5 4.8 4.6 4.4
4.3 4.1 3.9 1'113.7
125 6.1 5.9 15.7 5.5 5.3 5.1 4.9 4.7 4.5 4.3 4.1 3.8 1'113.6
150 6.4 6.2 111115.9 5.7 5.5 5.3 5 4.8 4.6 4.3 4 3.8
1IIII"3.5
175 6.6 6.4 1M"6.2 5.9 5.6 5.4 5.2 4.9 4.6 4.3 4 3.7 1113.4
200 6.8 6.6 1'116.4 I 6.1 5.8 5.5 5.2 4.9 4.6
4.3 4 3.7 111113.4
225 7.1 6.8 1M"6.5 6.2 5.9 5.6 5.3 5 4.7 4.3 4 3.6
1111H3.2
250 7.3 7 16.7 6.4 6 5.7 5.3 5 4.7 4.3 4 3.6
1'113.2
275 7.4 7.1 16.8 6.4 6.1 5.8 5.4 5 4.7 4.3 4 3.5 03.2
11111111 300 "7.5 17.1 6.8 6.5 6.2 M115.8 H5.5 115.14.7 H4.3 141111113.5
3.1
w325 7.6 7.3 6.9 6.5 6.2 5.8 5.5 5.1 4.7 4.3 3.9 3.5 3.1
11111111 350 7.6 7.3 7 6.6 6.2 5.8
5.5 5.1 4.7 4.3 3.9 3.5 3.1
375 7.7 7.3 7 6.6 6.2 5.8 5.5 5.1 4.7 4.3 3.9 3.5 3.1
400 7.7 7.3 6.9 6.5 6.2 5.8 5.4 5 4.7 4.3 3.9 3.5 3.1
425 7.6 7.3 6.9 6.5 6.2 5.8 5.4 5 4.6 4.3 3.8 3.5 3.1
450 7.6 7.2 6.8 6.4 6.1 5.7 5.3 5 4.6 4.3 3.8 3.5 3.1
475 7.4 7.1 6.7 6.4 6 5.6 5.3 4.9 4.6 4.2 3.8 3.5 3.1
500 7.3 7 6.6 6.2 5.9 5.5 5.2 4.9 4.5 4.1 3.8 3.5 3.2
525 7.1 6.8 6.5 6.1 5.8 5.5 5.1 4.8 4.4 4.1 3.8 3.5 3.2
550 7 6.7 6.3 5.9 5.6 5.3 5 4.7 4.4 4.1 3.8 3.5 3.2
575 6.8 6.4 6.1 5.8 5.5 5.2 4.9 4.6 4.3 4.1 3.8 3.5 3.4
600 6.5 6.2 5.9 5.6 5.3 5 4.7 4.5 4.3 4 3.8 3.6 3.4
[00122] As in Table 1, a measured or estimated physical characteristic
is used in Table 2
along with an estimated analyte concentration to derive a time S at which the
sample is
to be measured. For example, if the measured charactertistic is about 30% and
the
estimated glucose (e.g., by sampling at about 2.5 to 3 seconds) is about 350,
the time at
which the microcontroller should sample the fluid is about 7 seconds. In
another
example, where the estimated glucose is about 300 mg/dL and the measured or
estimated physical characteristic is 60%, the specified sampling time would be
about
3.1 seconds.
[00123] For the embodiments utilized with Table 2, the estimated
glucose concentration
is provided with an equation:
Date Recue/Date Received 2020-12-29
(-/E ¨ x2)
Gest =
Eq. 6
where Gest represents the estimated glucose
concentration;
/Eis the signal measured at about 2.5 seconds;
xi is the slope (e.g., xt=1.3e01);
x2 is the intercept (e.g., x6.9e02)
[00124] From the estimated glucose, the glucose concentration can be
determined from:
= (Is ¨ .)C4
X3
Eq. 7
where: Go represents the glucose concentration;
Is is the signal measured at a specified sampling time S from
Table 2;
x3 is the slope (e.g., x3=9.6); and
x4is the intercept (e.g., xµp4.8e02).
[00125] Although applicant's technique may specify only one sampling
time point, the
method may include sampling as many time points as required, such as, for
example,
sampling the signal output continuously (e.g., at specified sampling time such
as, every
1 milliseconds to 100 milliseconds) from the start of the test sequence until
at least
about 10 seconds after the start and the results stored for processing near
the end of the
test sequence. In this variation; the sampled signal output at the specified
sampling
time (which may be different from the predetermined sampling time point) is
the value
used to calculate the analyte concentration.
[00126] It is noted that in the preferred embodiments, the measurement
of a signal
output for the value that is somewhat proportional to analyte (e.g., glucose)
concentration is performed prior to the estimation of the hematocrit.
Alternatively, the
hematocrit level can be estimated prior to the measurement of the preliminary
glucose
concentration. In either case, the estimated glucose measurement GE is
obtained by
Equation 3.3 with IE sampled at about one of 2.5 seconds or 5 seconds, as in
FIGURE 7,
the physical characteristic (e.g.. Hct) is obtained by Equation 4 and the
glucose
41
Date Recue/Date Received 2020-12-29
measurement G is obtained by using the measured signal output ID at the
designated
sampling time point(s) (e.g., the measured signal output ID being sampled at
3.5
seconds or 6.5 seconds) for the signal transient 1000.
[00127] Other techniques for determining the analyte concentration or
value are shown
and described in PCT/GB2012/053276 (Attorney Docket No. DDI 5220W0PCT) filed
on December 28, 2012, PCT/GB2012/053279 (Attorney Docket No.
DD15246W0PCT) filed on December 28, 2012; PCT/GB2012/053277 (Attorney
Docket No. DD15228W0PCT) filed on December 28, 2012.
[00128] Under actual operating conditions, the biosensor 100 may be
used in an
environment with ambient temperature varying widely from the test temperature
of
about 22 degrees Celsius. In such cases, the electrochemical reaction is less
efficient at
low temperatures causing a wide bias to the actual measurement. Consequently,
there is
a need to ensure that the analyte results are insensitive to the effects of
the
environmental temperature.
[00129] Referring to step 618 of FIGURE 6, the system measures the
temperature
proximate the biosensor 100 with a suitable temperature sensor, such as, for
example, a
thermistor built into the circuit board of the meter 200. Once temperature has
been
measured at step 618, the system utilizes an additive temperature compensation
term
(which may in units of measures (e.g., mg/dL) or as a percentage) based on (1)
a
measured temperature different than 23 degrees Celsius and (2) as a function
of
different magnitudes of the measured analyte concentration to modify the
uncompensated analyte value Go at step 620 and annunciate the modified or
compensated final analyte value G F at step 622.
[00130] In one embodiment, the system may utilize a plurality of
temperature
compensation terms for step 620 from Fig. 9. The compensation terms are used
to
adjust or correct the uncompensated value by applying the compensation term to
the
uncompensated analyte value. The effect this compensation has on the
uncompensated
value is shown in Fig. 9 as a function of bias to reference value. As a
consequence, for
uncompensated analyte values below a predetermined threshold (e.g., 100 mg/dL
of
glucose), the system may be seen as adding the correction or compensation term
directly whereas, if the uncompensated value is at the threshold or greater,
the
compensation factor would be an additive as a percentage of the uncompensated
value.
As an example of the first case where the uncompensated value is below the
threshold
42
Date Recue/Date Received 2020-12-29
of 100 mg/dL, the uncompensated analyte value was determined to be about 25
mg/dL
and the ambient temperature was 5 degrees Celsius, the compensation line CL1
would
be utilized to determine the compensation term of about 3 mg/dL that would be
added
directly to the uncompensated value of 25 mg/dL to give a final compensated
value of
28 mg/dL. In an example for the second case where the uncompensated value is
at or
above a predetermined threshold (e.g., 100 mg/dL of glucose), such as 350
mg/dL with
measured ambient temperature of 10 degrees Celsius, the system would utilize
compensation line CL5 to add to the uncompensated value of 350 mg/dL a
compensation term of 20% of the uncompensated value (20%*350=70 mg/dL) which
would be added (to 350 mg/dL) to give the final value of 420 mg/dL.
[00131] Referring back to Fig. 9, if the analyte (e.g., glucose) is
about 25 mg/dL, the
temperature compensation term for temperature can be derived generally from
compensation line CL1; at about 75 mg/dL, the temperature compensation term
generally follows compensation line CL2; at about 150 mg/dL, the temperature
compensation term generally follows compensation line CL3; at about 250 mg/dL
then
the temperature compensation term applied to the uncompensated analyte value
generally follows line CL4; and at about 350 mg/dL, the temperature
compensation
term applied to the uncompensated analyte value generally follows line CL5. In
the
event that the uncompensated analyte measurement is between any two
compensation
lines, an interpolation can be made. To summarize Figure 9, the temperature
compensation lines or compensation terms for the uncompensated analyte values
must
conform to the following relationship implicitly defined in Figure 9, in
which:
(a) the temperature compensation term increases for increasing uncompensated
analyte values (which can be seen in Figure 9 in which the lines CL1-CL5
increases for increasing analyte values (25, 75, 150, 250 and 350 mg/dL));
and
(b) the temperature compensation term is inversely related to the ambient
temperature proximate the biosensor from about 5 degrees Celsius to about
22 degrees Celsius; and
(c) the temperature compensation term is about zero for the ambient
temperature proximate the biosensor from about 22 degrees Celsius to about
45 degrees Celsius.
[00132] For a more precise compensation of the temperature as compared
to the
relationship in Figure 9õ the following equation (Eq. 8) can be utilized:
43
Date Recue/Date Received 2020-12-29
G
GF _________________________________ o
1+ \ _________ \
(T ¨ To)3 + x2(T ¨To)2 + x3(T ¨To) Eq. 8
x4 (log (Go ))3 + x5 (log(Go ))2 + x6 (log(Go )) +1
Where:
GF is the final glucose result
Go is the uncompensated analyte value G glucose result (must be
T is the temperature measured by the meter (in C)
To=22 C (or a nominal temperature)
xi=4.69e-4, x2=-2.19e-2, x3=2.80e-1, x4=2.99e0, x5=-3.89e1, x6=1.32e2
[00133] Due to the nature of Equation 8, the uncompensated analyte
measurement Go
has to be set to 1 if it is less than 1 otherwise Equation 8 loses all meaning
as the fitting
function (governed by the log term for uncompensated analyte value below 1)
diverges
dramatically from expected measurements. Equation 8 was utilized for 24
batches of
the biosensor 100. Results are summarized in graphical form in FIGURES 10 and
11A-
11E. FIGURE 10 presents the individual bias values for the same data. FIGURES
11A
through 11E describe the entire data set.
[00134] As can be seen in FIGURE 10, the majority of the analyte
values, as compared to
reference analyte values, are within the bias of 10 mg/dL for analyte
measurements less
than 100 mg/dL of the analyte (e.g., glucose) and 10% for analyte measurement
at 100
mg/dL or greater. Curve fitting of the compensated measurements (line CT)
shows that
the measurements are within these two bias boundaries.
[00135] As can be seen in each of FIGURES 11A-11E the average bias as
compared to
nominal temperature for all batches a varying magnitude (e.g., 40 mg/dL, 65
mg/dL,
120 mg/dL, 350 mg/dL) with respect to various environmental temperatures (6
degrees
C, 12 degrees C, 22 degrees C, 35 degrees C, and 44 degrees C) indicates that
the
batches are well within the bias boundaries of 10 mg/dL for measurements
below 100
mg/dL (Figs. 11A and 11B) and within the bias boundaries of 10% for
measurements
at 100 mg/dL or above (Figs. 11C-11E).
[00136] To summarize the data provided herein, applicant's invention
has allowed
applicant to obtain the technical contribution of enabling approximately 97%
of the
biosensors to fall within 15 mg/dL for measurements below 100 mg/dL and 15%
for
44
Date Recue/Date Received 2020-12-29
measurements at 100 mg/dL or greater. An additional technical contribution is
provided by this invention in that the average bias to nominal bias is within
10
mg/dL for measurements below 100 mg/dL and 10% for measurements at 100 mg/dL
or greater. Both of these technical contributions (enabled by applicant's
invention)
were heretofore not available with applicant's current system (i.e., One-Touch
Ultra
blood glucose measurement system).
[00137] Where the system has sufficient computing power, Equation 9 can
be utilized in
place of Equation 8. Specifically, the form of Equation 9 is:
Go
GF= Eq. 9
1+ (T ¨ To)3 + x2 (T ¨ To)2 + x3 (T ¨ To )
x4 (Go ¨ Gnom)3 + x5(Go ¨ Gnom)2 + x6(Go¨ Gnom)+ x7
Where:
GF is the final analyte value;
Go is the uncompensated analyte value;
Gnomznal is a nominal analyte value;
T is the temperature measured by the meter (in C);
To is about 22 C (or a nominal temperature);
xi is about 4.80e-5, x2 is about -6.90e-3, x3 is about 2.18e-1, x4 is
about 9.18e-6, x5 is about -5.02e-3, x6 is about 1.18e0, and x7 is about
2.41e-2.
[00138] Although the techniques described herein have been directed to
determination
of glucose and compensating for the effect of environmental temperature, the
techniques can also applied to other analytes (with appropriate modifications
by those
skilled in the art) that are affected by physical characteristic(s) of the
fluid sample in
which the analyte(s) is disposed in the fluid sample. For example, the
physical
characteristic (e.g., hematocrit, viscosity or density and the like) of a
physiological fluid
sample could be accounted for in determination of ketone or cholesterol in the
fluid
sample, which may be physiological fluid, calibration, or control fluid. Other
biosensor
configurations can also be utilized. For example, the biosensors shown and
described
in the following US Patents can be utilized with the various embodiments
described
Date Recue/Date Received 2020-12-29
herein: US Patent Nos. 6179979; 6193873; 6284125; 6413410; 6475372; 6716577;
6749887; 6863801; 6860421; 7045046; 7291256; 7498132.
[00139] As is known, the detection of the physical characteristic does
not have to be
done by alternating signals but can be done with other techniques. For
example, a
suitable sensor can be utilized (e.g., US Patent Application Publication No.
20100005865 or EP1804048 B1) to determine the viscosity or other physical
characteristics. Alternatively, the viscosity can be determined and used to
derive for
hematocrits based on the known relationship between hematocrits and viscosity
as
described in "Blood Rheology and Hemodynamics" by Oguz K. Baskurt, M.D.,
Ph.D.,1
and Herbert J. Meiselman, Sc.D., Seminars in Thrombosis and Hemostasis, volume
29,
number 5, 2003.
[00140] As described earlier, the microcontroller or an equivalent
microprocessor (and
associated components that allow the microcontroller to function for its
intended
purpose in the intended environment such as, for example, the processor 300 in
FIGURE
2B) can be utilized with computer codes or software instructions to carry out
the
methods and techniques described herein. Applicants note that the exemplary
microcontroller 300 (along with suitable components for functional operation
of the
processor 300) in FIGURE 2B is embedded with firmware or loaded with computer
software representative of the logic diagrams in FIGURE 6 and the
microcontroller 300,
along with associated connector 220 and interface 306 and equivalents thereof,
are the
means for: (a) determining a specified sampling time based on a sensed or
estimated
physical characteristic, the specified sampling time being at least one time
point or
interval referenced from a start of a test sequence upon deposition of a
sample on the
test strip and (b) determining an analyte concentration based on the specified
sampling
time. Alternatively, the means for determining may include means for applying
a first
signal to the plurality of electrodes so that a batch slope defined by a
physical
characteristic of a fluid sample is derived and for applying a second signal
to the
plurality of electrodes so that an analyte concentration is determined based
on the
derived batch slope and the specified sampling time. Furthermore, the means
for
determining may include means for estimating an analyte concentration based on
a
predetermined sampling time point from the start of the test sequence and for
selecting
a specified sampling time from a matrix of estimated analyte concentration and
sensed
or estimated physical characteristic. Yet further, the means for determining
may
46
Date Recue/Date Received 2020-12-29
include means for selecting a batch slope based on the sensed or estimated
physical
characteristic and for ascertaining the specified sampling time from the batch
slope.
[00141] Moreover, while the invention has been described in terms of
particular
variations and illustrative Figures, those of ordinary skill in the art will
recognize that
the invention is not limited to the variations or Figures described. In
addition, where
methods and steps described above indicate certain events occurring in certain
order, it
is intended that certain steps do not have to be performed in the order
described but in
any order as long as the steps allow the embodiments to function for their
intended
purposes. Therefore, to the extent there are variations of the invention,
which are
within the spirit of the disclosure or equivalent to the inventions found in
the claims, it
is the intent that this patent will cover those variations as well.
47
Date Recue/Date Received 2020-12-29