Note: Descriptions are shown in the official language in which they were submitted.
,
CA 02923543 2016-03-07
WO 2015/053748
PCT/US2013/063818
INTEGRATED WELL SURVEY MANAGEMENT AND PLANNING TOOL
TECHNICAL FIELD
[0001] This disclosure relates to well survey management and planning.
BACKGROUND
[0002] A well plan describes the well trajectory to be followed to to take a
well successfully from its surface position to the end of the well trajectory.
Based on
factors such as an expected use of a well (e.g., observation, production,
injection, or
multi-purpose well), parameters (e.g., production parameters, completion
requirements, well dimensions, location), an expected life of the well, and
conditions
of the geological target (e.g., the subterranean reservoir) to be reached by
the well,
and other factors, the well plan outlines well objectives to be achieved
during well
drilling and well use. When drilling commences based on the well plan, the
well can
be periodically surveyed to obtain information describing the well being
drilled and
the obtained information interpreted, e.g., to compare a planned position and
a
determined position of the well. An operator can respond to deviations between
the
planned position and the determined position, e.g., by adjusting the drilling
operations
or by re-defining the well objectives (or both).
DESCRIPTION OF DRAWINGS
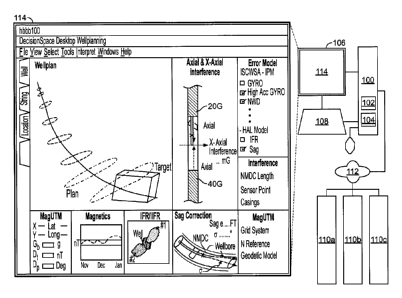
[0003] FIG 1 illustrates an example computer system to implement an
integrated well survey management and planning tool.
[0004] FIG. 2 is a flowchart of an example process to implement the
integrated well survey management and planning tool during a planning stage.
[0005] FIG 3 illustrates an example user interface provided by the example
computer system of FIG 1 in response to implementing the integrated well
survey
management and planning tool.
[0006] FIG 4 is a flowchart of an example process to implement the
integrated well survey management and planning tool during an execution stage.
[0007] FIG. 5 illustrates an example schematic of the example computer
system of FIG. 1.
1
CA 02923543 2016-03-07
WO 2015/053748
PCT/US2013/063818
[0008] Like reference symbols in the various drawings indicate like elements.
DETAILED DESCRIPTION
[0009] This disclosure describes an integrated well survey management and
planning tool. The tool can be implemented as a comprehensive, interactive
survey
management computer software application that can enable better planning and
evaluation of survey strategy. The tool can bring different aspects of survey
management, e.g., outputs determined by different survey tools that need to be
considered during planning and executing a well into a single interactive
environment.
By implementing the tool, results of some analysis and actual interference
effects can
be viewed during the planning stage and the execution stage, respectively.
[0010] As described below, the tool can display multiple elements that affect
well planning and surveying in a single interactive user interface on a
display device.
The interactive user interface can display the effect of a change in one
parameter on
other parameters, as applicable. Based on the outputs displayed in the user
interface,
an operator can adjust the choice of survey tools resulting in a well survey
that
achieves the well objectives, e.g., drill a well that reaches the intended
geological
target. In this manner, the tool can be implemented as an all-in-one
interactive tool
that can illustrate and optimize a survey for a well, platform, pad or field.
For
example, the tool can enable implementing as few surveys as necessary with
survey
tools that are as inexpensive as practicable. The tool can be implemented
before or
after commencing drilling operations (or both). Implementing the tool can
enable
operators to match the survey program with well objectives. The tool can be
used to
perform what-if analysis to determine the optimum length of non-magnetic
material
required in the BHA and to monitor the effects of variations in the earth
magnetic
field, due to solar storms for instance, on survey accuracy and allow for
early
determination if re-surveying is needed. Also the tool allows for the
instantaneous
verification that the correct earth magnetic model is being used and that the
input
variables are correct, the same applies for the declination correction being
applied.
FIG. 1 illustrates an example computer system 100 to implement the integrated
well
survey management and planning tool. In some implementations, the tool can be
implemented as a computer software application including computer instructions
stored on a computer-readable medium 102 and executable by data processing
2
CA 02923543 2016-03-07
WO 2015/053748
PCT/1JS2013/063818
apparatus 104 (e.g., one or more computer processors). The computer system 100
can
be connected to a display device 106 and to one or more input devices 108
(e.g., a
mouse, a keyboard, a touchscreen, a stylus, an audio input device, or other
input
devices). In some implementations, the computer system 100 can be a desktop
computer, a laptop computer, a tablet computer, a smartphone, a personal
digital
assistant, a client computer of a server-client computer system, or other
computer
system.
[0011] The computer system 100 can be connected to one or more well survey
and planning computer systems (e.g., a first computer system 110a, a second
computer system 110b, a third computer system 110c) over one or more wired or
wireless networks 112 (e.g., a local area network, a wide area network, the
Internet).
Each well survey and planning computer system can execute a respective well
survey
and planning computer software application that receives survey information
obtained
from survey tools connected to each well survey and planning computer system.
The
computer system 100 can receive the survey information from the well survey
and
planning computer software applications over the one or more wired or wireless
networks 112. In some implementations, the one or more well survey and
planning
computer systems can be implemented as entities that are separate from the
computer
system 100 that implements the integrated well survey management and planning
tool. Alternatively, the computer system 100 can implement the computer
software
applications implemented by each of the one or more well survey and planning
computer systems.
[0012] FIG. 2 is a flowchart of a process 200 to implement the integrated well
survey management and planning tool during a planning stage, i.e., before
drilling
commences. In some implementations, the computer system 100 can implement the
process 200. At 202, the computer system 100 can receive multiple parameters.
For
example, the parameters can describe a location and a shape of a well and can
be
received, e.g., from a well operator. At 206, the computer system 100 can
receive a
survey plan indicating the number, position and survey type of surveys to be
performed on the well while drilling the well.
[0013] At 204, the computer system 100 can receive a trajectory of the well
from a surface to a subterranean geological target to be reached by drilling
the well.
3
CA 02923543 2016-03-07
WO 2015/053748
PCT/US2013/063818
For example, an operator can provide the trajectory as an input to the
computer
system 100. Alternatively, another computer system, which stores the
trajectory, can
provide the trajectory as an input to the computer system 100. At 208, the
computer
system 100 can receive a selection of a survey tool from among multiple survey
tools.
A survey tool can be a physical type of surveying tool that can be carried
into the
well. For example, the tool can be carried into the well on a wire (e.g., a
wireline, e-
line, or other tool) or tubing. The survey tool can measure the location in
three-
dimensional space of the well. For example, either the computer system 100 or
one
or more of the well survey and planning computer systems (or both) can be
connected
to the survey tool that surveys the well to be drilled along the received
trajectory. In
some implementations, the computer system 100 can also receive the number,
position and survey type of surveys to be performed on the well while drilling
the
well.
[0014] At 210, the computer system 100 can apply multiple error models to
the survey tool. An error model can be implemented as a computer software
application as computer instructions stored on the computer-readable medium
102 and
executable by the data processing apparatus 104. Each error model can define a
respective uncertainty in reaching the subterranean geological target by
drilling the
well along the received trajectory. Some error models can determine the
respective
uncertainty by accounting for influences of different error sources. In some
implementations, the computer system 100 can receive the error models, e.g.,
as
inputs from an operator or from another computer system (or both). At 212, the
computer system 100 can display, in a user interface 114 (e.g., displayed in
the
display device 106), the multiple parameters, the received trajectory of the
well, an
identifier identifying the survey tool and an uncertainty indicator determined
by
applying the one or more error models. The uncertainty indicator indicates an
uncertainty in drilling the well on the received trajectory.
[0015] The uncertainty indicator represents a combination of respective
uncertainties defined by the multiple error models. In other words, the
uncertainty
indicator is an uncertainty of the well that represents a combination of
uncertainties of
each survey and spacing between the surveys. For example, each of multiple
survey
tools that are (or can be) implemented during a well survey is associated with
a
4
CA 02923543 2016-03-07
WO 2015/053748
PCT/US2013/063818
respective uncertainty. The uncertainty indicator described in this disclosure
represents a combination of the multiple uncertainties associated with the
multiple
survey tools. The computer system 100 can determine the uncertainty indicator
based, in part, on the locations of the survey tools. The uncertainty
represented by the
uncertainty indicator is more than the uncertainty in the accuracy of the tool
itself.
The uncertainty in the accuracy of the tool is determined by errors in the
tool's ability
to make measurements. In addition to the uncertainty of the tool, the
uncertainty for
the well represented by the uncertainty indicator represents an uncertainty in
drilling
the well along the target trajectory without being able to see the three-
dimensional
drilling space, i.e., without survey points and using measurements made by the
survey
tools during the previous survey. The uncertainty represented by the
uncertainty
indicator can increase as a time between successive surveys increases because
the
possible error builds. In some implementations, the uncertainty indicator can
be
determined based on the intended well trajectory and the survey tools that
will be used
(and the locations of the survey tools). The operator can then plan more or
fewer
survey points, different survey points, different survey tools (or
combinations of
them) based on a confidence (provided by the uncertainty indicator) that the
well will
hit the geological target.
[0016] In this manner, the computer system 100 can provide the user interface
114 as a comprehensive, interactive survey management module. The operator can
use the user interface 114 to evaluate an effect of different numbers,
positions and
survey types of surveys that affect the uncertainty indicator. The operator
can also
use the user interface 114 to evaluate an effect of different error models and
combinations of error models, measurement corrections (e.g., sag correction),
drill
string configuration (e.g., the NMDC), well configurations and factors
including well
location and drilling time of the year. For example, the computer system 100
can
provide each of the factors that affect the uncertainty indicator as a
selectable option
in the user interface 114. The operator can create combinations of selectable
options
(e.g., a combination of a first error model, a first correction, a first drill
string
configuration, a first location, a first drilling time, another combination of
first and
second error models, no correction, a second drill string configuration, the
first
location, a second drilling time, or other combinations) to determine the
uncertainty
CA 02923543 2016-03-07
WO 2015/053748
PCT/US2013/063818
indicator. In this manner, the operator can select/unselect available options
and
determine an effect on the uncertainty indicator. The operator can use the
tool
implemented by the computer system 100 to determine a survey program (i.e.,
the
number, position and survey types) that will enable the operator to drill a
well that
will reach the geological target.
[0017] In the planning stage, the computer system 100 can receive the
multiple parameters, receive the trajectory of the well, receive the selection
of the
survey tool, apply the one or more error models and display the multiple well
survey
parameters before the well is drilled along the received trajectory. In an
execution
stage, the computer system 100 can additionally receive actual drilling data
and show
the trajectory based on actual drilling data, as described below.
[0018] FIG. 3 is an example of the user interface 114 provided by the
computer system 100 in response to executing the integrated well survey
management
and planning tool. The user interface 114 includes multiple regions. In each
region,
the computer system 100 displays either an input to or an output of the
integrated well
survey management and planning tool implemented by the computer system 100. In
some implementations, the user interface 114 includes a region 304 in which
the
computer system 100 displays multiple parameters, e.g., a length of a non-
magnetic
drill collar (NMDC) to be positioned in the well, a sensor position in the
NMDC at
which a survey tool is to be positioned, and casing information describing at
least one
of a casing size, distance, or direction from the sensor position. The
computer system
100 can receive the multiple parameters, which can also include a location and
a
shape of the well, either from an operator of the computer system 100 or from
one of
the well survey and planning computer systems.
[0019] The user interface 114 includes a region 308 in which the computer
system 100 displays the trajectory of the well from the surface to the
subterranean
geological target based, in part, on the parameters. In the region 308, the
computer
system 100 can also display the uncertainty indicator described above. In some
implementations, the computer system 100 can display the uncertainty indicator
as
including multiple ellipses, each occupying a different area. As described
above, each
ellipse represents a combination of uncertainties associated with different
multiple
survey tools. A change in an uncertainty associated with information obtained
by one
6
CA 02923543 2016-03-07
WO 2015/053748
PCT/US2013/063818
of the survey tools affects an uncertainty associated with information
obtained by
another of the survey tools. Each ellipse of the multiple ellipses accounts
for the
different uncertainties associated with the different survey tools. For
example, an area
occupied by each ellipse is a measure of uncertainty in drilling on the target
trajectory
at a respective depth that cannot be visualized by relying on survey points
obtained
from the survey tools during a previous survey. In addition, each ellipse is
associated
with a respective depth of the well from the surface to the subterranean
geological
target. The computer system 100 can display the multiple ellipses at multiple
respective depths along the trajectory in the region 308 of the user interface
114.
[0020] In some implementations, the computer system 100 can determine a
confidence level for each ellipse that represents a confidence that an actual
trajectory
of the drilled well will match the predicted trajectory. The computer system
100 can
determine the confidence level for each ellipse based, in part, on
uncertainties
associated with the information obtained by the survey tools, as described
above. The
computer system 100 can additionally determine an uncertainty threshold at a
respective depth that represents an acceptable deviation between the actual
and
predicted trajectories. The uncertainty threshold is a potential uncertainty
that is so
great that the target trajectory could possibly miss the geological target.
The
computer system 100 can also determine whether the possible actual trajectory
will
reach the geological target. The computer system 100 can determine that a
first
ellipse at a first depth does not satisfy an uncertainty threshold at that
depth. In
response, the computer system 100 can display the first ellipse in the region
308 in a
manner that is visually distinguishable from a second ellipse that satisfies
the
uncertainty threshold at a second depth. For example, the computer system 100
can
display ellipses that satisfy respective uncertainty thresholds in a color
(e.g., green)
and ellipses that do not satisfy the respective uncertainty thresholds in
another color
(e.g., red).
[0021] In some implementations, multiple survey tools can be available and
can be connected to (e.g., operated by) the well survey and planning computer
systems. The operator of the computer system 100 can select one or more survey
tools, which can include, e.g., a single shock magnetic survey tool, a MWD
magnetic
survey tool with multi-shock type survey, or other survey tools. If the
inaccuracies
7
CA 02923543 2016-03-07
WO 2015/053748
PCT/US2013/063818
determined for the survey tools are higher than acceptable thresholds, then
additional
corrections can be applied. The corrections can include, e.g., SAG corrections
to
correct errors in the alignment of the survey tool, corrections to correct
errors
associated with the presence of magnetic components in the drill string,
corrections
due to earth's magnetic field based on geographic location (e.g., closer to
the north or
south poles), and other corrections.
[0022] As described above, the computer system 100 can receive a selection
of one or more survey tools, e.g., from a user of the computer system 100 or
from one
or more of the well survey and planning computer systems. In addition, the
computer
system 100 can receive one or more error models to be applied to the selected
survey
tool through the user interface 114. For example, the user interface 114 can
include a
region 302 in which the computer system 100 displays multiple error models
including, e.g., at least one of an interpolation in-field referencing (IIFR)
model, an
in-field referencing (IFR) model, and a measurement while drilling (MWD)
model.
In this region, the user interface 114 can also include a correction applied
to the
readings, e.g., a sag correction. A user of the computer system 100 can select
one or
more of the error models through the user interface 114. The computer system
100
can apply the selected one or more error models to the selected survey tool.
In some
implementations, the computer system 100 can include an "Accuracy" field that
specifies an acceptable deviation (e.g., 1-sigma, 2-sigma, 3-sigma) in the
region 302.
The computer system 100 can apply the selected one or more error models to the
selected survey tool to determine that the errors fall within the deviation
specified in
the "Accuracy" field.
[0023] In some implementations, the multiple parameters can include a
geographic location at which the well is to be drilled and a drilling time,
i.e., a time of
the year when drilling operations are to be performed. A well survey and
planning
computer system can implement a geodetic model that can determine the earth's
gravitational field and magnetic field strength at the location and at the
drilling time.
The user interface 114 can include a region 306 in which the computer system
100
displays an identifier identifying the geodetic model. The user interface 114
can also
include a region 312 in which the computer system 100 can display the earth's
8
CA 02923543 2016-03-07
WO 2015/053748
PCT/US2013/063818
gravitational field strength and magnetic field strength, and a dip angle of
the
magnetic field.
[0024] In some implementations, the multiple parameters can include
magnetics representing variations in the earth's magnetic field due to solar
effects
during the drilling time. The user interface 114 can include a region 314 in
which the
computer system 100 displays the magnetics during the drilling time. For
example,
one of the well survey and planning computer systems can determine and provide
the
magnetics to the computer system 100 for display in the region 314. The
computer
system 100 can display a plot of the magnetics over a time that includes the
drilling
time in the region 314. Either the computer system 100 or a well survey and
planning
computer system can compare the magnetics with a threshold magnetics for
drilling
the well. In some implementations, the computer system 100 can display the
magnetics at a particular time that satisfy the threshold magnetics to be
visually
distinguishable from magnetics at a different time that does not satisfy the
threshold
magnetics. For example, the computer system 100 can display the magnetics that
satisfy the threshold magnetics in a first color (e.g., green) and the
magnetics that do
not satisfy the threshold magnetics in a second, different color (e.g., red).
Moreover,
some of the survey tools measure orientation relative to the earth's magnetic
field.
The computer system 100 can account for the effect of the magnetics on the
readings
of the magnetic survey tools.
[0025] Additional survey and planning information that the computer system
100 can display in the user interface 114 can include an image of a SAG
correction
for the well (e.g., in a region 318), an axial and cross-axial interference
(e.g., in a
region 310) representing a disturbance in a magnetic field due to low magnetic
permeability components in the well, and an output of the IFR/IIFR error
models
(e.g., in a region 316). As described above, the user interface 114 is
interactive. For
example, when the computer system 100 receives a change to an uncertainty
defined
by an error model (or any input to the integrated well survey management and
planning tool) that results in a change to an uncertainty defined by another
error
model, the computer system 100 can automatically and without user intervention
update the uncertainty indicator (or any other aspect of the well plan or
survey
displayed in the user interface 114). The computer system 100 can display the
9
CA 02923543 2016-03-07
WO 2015/053748
PCT/US2013/063818
updated uncertainty indicator in the user interface 114. An operator of the
computer
system 100 can make changes and see, e.g., in real time or near real time, an
effect of
the changes on the ellipse. In this manner, the operator can create different
scenarios
while designing the well survey plan.
[0026] The techniques described above related to implementing the integrated
well survey management and planning tool during the planning stage of well.
After
drilling has commenced, one or more survey tools can be implemented to monitor
the
drilling operation as described below with reference to FIG. 4. The computer
system
100 can implement the integrated well survey management and planning tool to
receive information determined by the one or more survey tools, and, in real
time,
update appropriate regions in the user interface 114. By doing so, the
operator can
compare the actual drilling information with the predicted drilling
information, and
make adjustments as necessary, e.g., to the drilling conditions, the survey
tools, the
error models (or combinations of them). In addition, the operator can
visualize an
effect of the actual drilled well on the ellipses. For example, if the as-
drilled well
lands at a center of a predicted ellipse, the subsequent ellipses over
undrilled portions
will not be as large as predicted.
[0027] FIG 4 is a flowchart of an example process to implement the
integrated well survey management and planning tool during an execution stage.
In
some implementations, the computer system 100 can implement the process 400.
At
402, the computer system 100 can receive survey data describing a well being
drilled.
For example, after the well drilling has commenced, a survey tool positioned
at a
location between the surface and the geological target to be reached by
drilling the
well can be implemented to obtain survey data that includes a trajectory of
the well
being drilled. The survey tool can be moved to different locations in the
well. For
example, after drilling for a certain period, drilling can be stopped and the
survey tool,
which can be near the drill bit, can be operated to take a survey. As
described above,
the computer system 100 can receive a target trajectory along the well to be
drilled to
the geological target. At 404, the computer system 100 can determine an
uncertainty
indicator indicating an uncertainty in drilling the well on a target
trajectory. For
example, the computer system 100 can determine the uncertainty indicator based
at
least in part on the survey data and the target trajectory. The uncertainty
indicator can
CA 02923543 2016-03-07
WO 2015/053748
PCT/US2013/063818
indicate an uncertainty (e.g., a confidence measure) in reaching the
geological target
by drilling the well along the target trajectory.
[0028] At 406, the computer system 100 can display the uncertainty indicator
in a user interface, e.g., in the user interface 114. As described above, in
certain (but
not all) instances, the computer system 100 can have previously determined an
uncertainty indicator for the well during a planning stage, i.e., before
drilling
commences. By implementing process 400, the computer system 100 can determine
a
revised uncertainty indicator for the well based, in part, on survey data that
describe
the well being drilled. The revised uncertainty indicator measured during the
drilling
stage, therefore, is an update to the uncertainty indicator determined during
the
planning stage. In some implementations, the computer system 100 can receive
at
least a portion of a measured trajectory (i.e., the actual trajectory) of the
well being
drilled and compare the portion of the measured trajectory with the target
trajectory
determined during the planning stage. The computer system 100 can determine
the
revised uncertainty indicator based on the comparison. For example, upon
determining that the as-drilled well lands at or near a center of an ellipse,
then the
computer system 100 can determine that the uncertainty that the well will land
in a
subsequent ellipse in an undrilled portion is low. Consequently, the computer
system
100 can determine the revised ellipse to be smaller than a current ellipse.
Alternatively, upon determining that the as-drilled well lands at or near a
periphery of
the ellipse, the computer system 100 can determine the revised ellipse to be
larger
than or at least the same size as the current ellipse.
[0029] The uncertainty indicator determined during the drilling stage, like
the
uncertainty indicator determined during the planning stage, can include
multiple
ellipses, each occupying a different area. Each ellipse is associated with a
respective
depth of the well from the surface to the subterranean geological target. One
or more
of the ellipses represents an uncertainty associated with a portion of the
well that has
not yet been drilled. The computer system 100 can display the multiple
ellipses at
multiple respective depths of the well in the user interface. In some
implementations,
the computer system 100 can replace an ellipse at a depth determined during
the
planning stage with another ellipse at the depth determined during the
drilling stage.
In this manner, the computer system 100 can replace one or more ellipses at
11
CA 02923543 2016-03-07
WO 2015/053748
PCT/1JS2013/063818
respective one or more depths based on the survey data and the target
trajectory. In
some situations, the computer system 100 can determine that an ellipse
determined
during the planning stage matches (e.g., occupies the same area as) an ellipse
determined during the drilling stage. In such situations, the computer system
100 may
not replace the ellipse determined during the planning stage.
[0030] In response to viewing ellipses associated with the revised uncertainty
indicator, an operator may change aspects of a survey plan, e.g., to adjust
the target
trajectory from the as-drilled well and the plan such that the newly updated
ellipses
land at the geological target. At 408, the computer system 100 can receive a
change
to the survey plan that indicates the number, position and survey type of
surveys to be
performed on the well while drilling the well. As described above, the change
can be
responsive to the uncertainty indicated by the revised uncertainty indicator.
For
example, upon viewing the revised uncertainty indicator, an operator can
determine to
change the number, position, survey type, error models (or a combination) that
was
previously defined in the survey plan. The operator can, e.g., select a survey
tool that
the operator had not selected during the planning stage before drilling
commenced. In
some implementations, the computer system 100 can display, in the user
interface,
multiple survey tools from among which the operator can make one or more
selections.
[0031] At 410, the computer system 100 can apply multiple error models
based on the received change to the survey plan. Each error model defines a
respective uncertainty in reaching the subterranean geological target by
drilling the
well. The uncertainty is based on a survey performed while the well is being
drilled
as well as the remaining target trajectory. The revised uncertainty indicator
represents
a combination of the respective uncertainties defined by the multiple error
models. A
change to an uncertainty defined by one of the error models can affect an
uncertainty
defined by another of the error models and the revised uncertainty indicator
itself. At
412, the computer system 100 can determine such a change to the uncertainty
indicator, and, at 414 display the revised uncertainty indicator in the user
interface
114.
[0032] After the operator has adjusted the survey plan, well drilling can
continue. The computer system 100 can continue to receive the survey data and
12
CA 02923543 2016-03-07
WO 2015/053748
PCT/US2013/063818
determine the uncertainty indicator. For example, the computer system 100 can
receive the data in real time (or near real time) or concurrently with the
well drilling
(or both). Based on a change or changes to the uncertainty indicator (e.g., if
the
uncertainty indicator fails to satisfy an uncertainty threshold), the operator
can
provide changes to the survey plan resulting in the computer system 100
revising the
uncertainty indicator. In this manner, during the drilling stage, the computer
system
100 can be implemented as a tool that the operator can use to monitor and
adjust
drilling operations to reach the geological target by implementing as few and
as
inexpensive survey tools as practicable.
[0033] FIG. 5 illustrates a schematic of the example computer system 100 of
FIG. 1. The example computer system 100 can be located at or near one or more
wells and/or at a remote location. The example computer system 100 includes a
data
processing apparatus 104 (e.g., one or more processors), a computer-readable
medium
102 (e.g., a memory), and input/output controllers 170 communicably coupled by
a
bus 165. The computer-readable medium can include, for example, a random
access
memory (RAM), a storage device (e.g., a writable read-only memory (ROM) and/or
others), a hard disk, and/or another type of storage medium. The computer
system
100 can be preprogrammed and/or it can be programmed (and reprogrammed) by
loading a program from another source (e.g., from a CD-ROM, from another
computer device through a data network, and/or in another manner). The
input/output
controller 170 is coupled to input/output devices (e.g., the display device
106, input
devices 108, and/or other input/output devices) and to a network 112. The
input/output devices receive and transmit data in analog or digital form over
communication links such as a serial link, wireless link (e.g., infrared,
radio
frequency, and/or others), parallel link, and/or another type of link.
[0034] The network 112 can include any type of data communication network.
For example, the network 112 can include a wireless and/or a wired network, a
Local
Area Network (LAN), a Wide Area Network (WAN), a private network, a public
network (such as the Internet), a WiFi network, a network that includes a
satellite
link, and/or another type of data communication network.
13
CA 02923543 2016-03-07
WO 2015/053748
PCT/US2013/063818
[0035] A number of implementations have been described. Nevertheless, it
will be understood that various modifications may be made without departing
from
the spirit and scope of the disclosure.
14