Note: Descriptions are shown in the official language in which they were submitted.
CA 02937919 2016-07-25
WO 2015/117056 PCT/US2015/014053
EVALUATING DATA QUALITY OF CLINICAL TRIALS
CROSS REFERENCE TO RELATED APPLICATIONS
[0001] The application claims the benefit of Provisional Application No.
61/935,319,
Attorney Docket #30820-25122, filed on February 3, 2014, and Provisional
Application No.
62/043,374, Attorney Docket #30820-27649, filed on August 28, 2014, both of
which are
hereby incorporated herein by reference.
BACKGROUND
1. FIELD
[0002] The described embodiments generally relate to the field of digital
data
processing systems, and more specifically, to processing electronic patient
records produced
as part of clinical trials in order to quantify their data quality.
2. DESCRIPTION OF THE RELATED ART
[0003] Clinical trials typically collect an immense amount of patient data,
such as
demographics, medical history, lab values, adverse events such as illnesses,
and the like. In
many trials, there are hundreds or thousands of patients, each with patient
data made up of
values for thousands of associated variables.
[0004] The patient data is often input manually, e.g., by medical personnel
or clerical
workers. To avoid erroneous data, the input data is manually reviewed and
verified for
accuracy. However, such manual checks are time-consuming, and in the aggregate
often
account for 30% or more of the total cost of the clinical trial.
SUMMARY
[0005] An analysis server obtains electronic patient data associated with
patients as part
of a clinical trial. The analysis server processes the patient data to derive
a number of
different of univariate and/or bivariate models specifying how likely it is
that a given value of
a variable (or values of a pair of variables) is erroneous (e.g., due to input
errors). The
models can be applied to the patient data to identify variable values more
likely to be
1
CA 02937919 2016-07-25
WO 2015/117056 PCT/US2015/014053
erroneous, and in turn to quantify the data quality of patients, sites, and
the clinical trial itself
BRIEF DESCRIPTION OF DRAWINGS
[0006] FIG. 1 illustrates an environment in which patient data records are
collected and
analyzed, according to one embodiment.
[0007] FIG. 2 is a block diagram illustrating a detailed view of components
of the
analysis server of FIG. 1, according to one embodiment.
[0008] FIG. 3A is a data flow diagram illustrating a process of forming
models for
assessing likelihoods that errors are present in patient data, according to
one embodiment.
[0009] FIG. 3B is a data flow diagram illustrating usage of the models of
FIG. 3A to
identify potential errors in patient data, according to one embodiment.
[0010] FIG. 4 illustrates a sample user interface according to one
embodiment.
[0011] FIG. 5 is a block diagram illustrating various physical components
of an
example computer system that can serve as an analysis server according to one
embodiment.
[0012] The figures depict various embodiments of the present invention for
purposes of
illustration only. One skilled in the art will readily recognize from the
following description
that other alternative embodiments of the structures and methods illustrated
herein may be
employed without departing from the principles of the invention described
herein.
DETAILED DESCRIPTION
[0013] FIG. 1 illustrates a computing environment in which patient data
records
associated with a clinical trial are collected and analyzed, according to one
embodiment.
Different medical or data processing sites 120 collect patient data records
121 for the patients
associated with the clinical trial. For example, one site 120A might be a
medical office
where employees collect patient intake information such as medical histories,
manually
producing records 121 by entering the intake information into a database. The
site 120A
might also review patient lab results collected during the clinical trial,
manually entering the
results. A clinical trial will commonly include many such sites (120A, 120B,
120C, etc.).
Some portion of the entered data may also be automatically entered, such as by
a medical
device that automatically places patient data readings in a database.
[0014] The various patient records produced by the different sites 120 are
provided to
2
CA 02937919 2016-07-25
WO 2015/117056 PCT/US2015/014053
an analysis server 100, which analyzes the data and assesses the data quality
of the records.
More specifically, based on the data in the provided records, the analysis
server 100 derives
models for one or more variables in the patient records that indicate how
likely it is that the
data in one or more patient data records is accurate. The analysis server 100
can then apply
the models to the patient data records to identify values of variables that
have a
comparatively high likelihood of containing inaccurate data. Manual data
verification efforts
can then be focused on these identified values, thereby greatly reducing the
amount of
manual effort required to ensure data quality. The analysis server 100 can
additionally
aggregate its findings from the level of individual values of patient data
records to make
higher-level observations, such as identifying sites 120 that produce greater
than average
numbers of errors, or assessing the current overall quality of patient data in
the clinical trial to
determine whether additional data still should be collected and verified, or
whether the
existing data is sufficient and the clinical trial need therefore collect no
additional data.
[0015] Although three sites 120¨site 120A, site 120B, and site 120C¨are
illustrated
in FIG. 1, this is purely for the purpose of example, and there may be
different numbers of
sites 120 in different embodiments.
[0016] FIG. 2 is a block diagram illustrating a detailed view of components
of the
analysis server 100 of FIG. 1, according to one embodiment. A unification
module 210 takes
as input the various patient data records 121 of the sites 120 and produces a
set of unified
patient data records 202. A model derivation module 220 clusters the various
variables of the
patient data variables according to their observed similarities. The model
derivation model
220 further derives a set of models 206,which when applied to variable values
of a patient
data record indicate whether those values likely are erroneous. A scoring
module 230 applies
the models 206 derived by the model derivation module 220 to variable values
of patient data
records of the unified records 202, the result for each data record being a
score indicating
whether the values are likely erroneous. A grading module 240 uses the scores
produced by
the scoring module 230 to assign a single intuitive grade to the clinical
trial as a whole.
Further detail on the operations of the modules 210-240 is now provided, and
the operations
are later illustrated in the context of the data flow diagrams of FIGS. 3A-3B.
[0017] UNIFICATION
[0018] The unification module 210 takes as input the various patient data
records 121
of the sites 120 and produces a set of unified patient data records 202. In
one embodiment,
the patient data records 121 from the various sites use a patient ID to
identify information as
3
CA 02937919 2016-07-25
WO 2015/117056 PCT/US2015/014053
pertaining to a particular patient, and the unification module 210 uses that
patient ID to join
the information for that patient from the different sets of patient data
records 121.
[0019] The different sets of data for a given patient are joined in
different ways,
depending on the nature of the data. For example, for a set of data with just
one record per
patient (e.g., height), the values of the variables within the set of data are
simply joined to the
other data for that patient (e.g., date of birth).
[0020] As another example, for event-based data sets (i.e., data describing
events that
can recur a number of times, such as doctor visits or adverse events such as
sicknesses),
which can have multiple records for a given patient, the various records are
combined to list
event counts for the various events. For example, input records of the format
<patientID,
eventType, eventDate>, such as the three records {<1, 2, 12/23/13 4:26:30 PM>,
<1, 2,
1/26/14 2:05:00 PM>, <1, 3, 12/31/13 11:55:20 PM>} can be aggregated to a
single record of
the format <patientID, eventTypei, count',
eventTypeõ, countõ,>, such as the record <1, 1,
0, 2, 2, 3, 1>, indicating that the patient with the ID "1" had 0 events of
type 1, 2 events of
type 2, and 1 event of type 3.
[0021] As another example, for time series-based data sets (i.e., data
describing events
whose temporal relationships are significant, such as lab values or efficacy
endpoints), which
can have multiple records for a given patient, the various records are
combined to group all
the records for a patient. For example, input records of the format
<patientID,
measurementType, date, measurementValue> can be aggregated to a single record
of the
format <patientID, <measurementDataTypei>,
<measurementDataTypen>>, where there
is a measurementDataType, for every instance of a time event of that type,
listing the time
and the value of the time event. For example, the three records {<1, 2,
12/23/13 4:26:30 PM,
4>, <1, 2, 1/26/14 2:05:00 PM, 5>, <1, 3, 12/31/13 11:55:20 PM, 2>} could be
aggregated to
a single record <1, 2:<12/23/13 4:26:30 PM, 4; 1/26/14 2:05:00 PM, 5>, 3:< 3,
12/31/13
11:55:20 PM, 2>>. Optionally, the variable number of time series data items
for a given
datatype can be further converted to a single set of representative data, such
as a mean/slope
describing a line that best fits the time series data items. In addition to
these examples, other
methodologies for joining patient data may be employed by the implementer.
[0022] In one embodiment, for each data set, a variable is added that
represents the
number of records that the given patient had within that data set. Thus, for
example, if a
patient had been taking five different medications, the patient would have
five records in the
medications dataset, and would have a value of <5> for the additional variable
representing
4
CA 02937919 2016-07-25
WO 2015/117056 PCT/US2015/014053
the medication count.
[0023] In one embodiment, additional preprocessing is used to make the data
more
amenable to statistical analysis. For example, dates can be converted to day
numbers (e.g., as
offsets with respect to the first day of the study), so that all patients are
on the same time
scale. As another example, variables that are constant for all patients are
removed. As
another example, variables that have a high missing fraction are recorded to
missing/non-
missing.
[0024] MODEL DERIVATION
[0025] The model derivation module 220 evaluates the patient data records
in order to
derive models for one or more corresponding variables that can be used to
identify
anomalous values of those variables. The models may be for a single variable
(a "univariate"
relationship), or for relationships of two or more variables ("bivariate" or
"multivariate"
relationships, respectively). The derivation of the models depends on the data
types of the
variables involved, such as numeric variables (e.g., continuous real numbers
or discrete
integers), binary variables (storing "0" or "1" or the logical equivalent
thereof), and
categorical variables (storing a value from a discrete set of possible values
representing
different categories with no direct quantifiable relationship between the
values). Derivation
of models of the different types of variable relationships is now described in
more detail.
[0026] (A) Univariate Relationships
[0027] Univariate relationships capture the observed relationships of
different values of
a single variable (e.g., height) across a sample set of various patient data
records. The model
for a univariate relationship depends upon the type of the variable in
question. In one
embodiment, for every variable, one model is trained for the sample set of all
the patient data
records, and another model is trained for the sample set defined by each of a
set of patient
clusters. Clustering patients is described later below with respect to
multivariate
relationships.
[0028] (i) Categorical or binary variables
[0029] In one embodiment, the univariate model for a variable is the
probability density
function derived by analyzing the different values of the variable over the
patient data
records.
[0030] (ii) Continuous numeric variables
[0031] In one embodiment, the model is a normal distribution, where the
mean and
CA 02937919 2016-07-25
WO 2015/117056
PCT/US2015/014053
standard deviation of the normal distribution are the trimmed mean and trimmed
standard
deviation of the values of the variable over the patient data records. To
ensure that the
normal distribution function is appropriate, the Box-Cox transformation is
used for the
variable.
[0032] (iii) Discrete numeric variables
[0033] In one embodiment, the model is the best fitting statistical
distribution estimated
by maximum likelihood from the set of geometric, Poisson, negative binomial,
and discrete
lognormal distributions derived from the values of the variable over the
patient data records.
[0034] (13) Bivariate Relationships
[0035] Bivariate relationships capture the relationships of pairs of
variables, such as
height and weight, observed over some set of patient data records. Variables
with
sufficiently strong relationships are clustered, and models are derived for
variable pairs in the
clusters. The models can then be applied to values of the corresponding
variables to detect
anomalous relationships (and, equivalently, the variable values of the
variable pair that
constitute the anomalous relationship). For example, height and weight might
be two
variables with a strong (linear) relationship, and a corresponding derived
height-weight
model could identify that a very large height with a very small weight is
anomalous, and
hence merits further investigation into both the height value and the weight
value.
[0036] Specifically, the relationship strength between different variables
is quantified
using a distance metric between a first variable vi and a second variable vj.
The type of
distance metric employed depends upon the data types of the variables. In one
embodiment,
for example, the following distance metrics are used for variable pairs vi and
vj:
Data Type for Vi Data Type for Vj Distance Metric
Numeric Numeric, Asymmetric 1-abs(correlation)
Binary, Symmetric Binary
Asymmetric Binary Asymmetric Binary 1-Jaccard index
Categorical, Symmetric Categorical, Asymmetric 1-phi coefficient
Binary Binary, Symmetric Binary
Numeric Categorical 1-phi coefficient (after
quantizing the numeric
variable)
[0037] The model derivation module 220 clusters the variables according to
their
respective distances as evaluated using the distance functions. In one
embodiment,
hierarchical clustering is used to group the variables, and the number of
clusters for the
6
CA 02937919 2016-07-25
WO 2015/117056
PCT/US2015/014053
variables is then estimated using (a) the reduction of within cluster distance
as a function of
cluster number, and (b) the stability of the clusters as a function of the
distance threshold.
[0038] The model derivation module 220 derives a model for each pair of
variables vi
and vj in a cluster. The models take, as input, the values of vi and vj and
output a score
representing the degree of anomalousness of the pair of values occurring with
the same
patient data record. The type of model employed depends upon the types of the
variables vi
and vj. For example, in one embodiment the following model types are employed:
Data Type for Vi Data Type for Vj Model formation
Numeric Numeric Fit robust linear regression of vi on vj
and a
robust linear regression of vj on vi, and select as
the model the better of the two.
Categorical or Categorical or Define the model based on cross tabulation
of the
Binary Binary two variables.
Numeric Binary Define the model using a logistic
regression of vj
as a function of vi.
Numeric Categorical Quantize vi by quartile, and then define
the
model based on cross tabulation of the quantized
vi, and
[0039] (C) Multivariate Relationships
[0040] Multivariate relationships define the relationships of individual
patients. The
result identifies how anomalous a particular patient is with respect to other
patients.
[0041] More specifically, a distance metric is defined for any pair of
patients Pi and Pi.
In one embodiment, the distance metric is a weighted version of the Gower
distance metric,
where the weights are determined by categorizing each variable's importance,
relative to
demographic variables which have weights 1. For example, in one embodiment
variables
related to the study drug have weight 2 (reflecting greater than normal
importance), and
variables related to adverse events have weight 3 (reflecting still greater
importance).
[0042] With patient distances defined by the distance metric, the model
derivation
module 220 clusters the patients according to the distances between them. A
distance matrix
may be formed, enumerating the distances between every pair of patients, as
determined with
the distance metric. In one embodiment, the model derivation module 220
clusters the
patients using multi-dimensional scaling (MDS) based on the distance matrix
for the patients.
In another embodiment, the model derivation module 220 instead employs
hierarchical
clustering. The number of patient clusters is then estimated using (a) the
reduction of within
cluster distance as a function of cluster number, and (b) the stability of the
clusters is a
7
CA 02937919 2016-07-25
WO 2015/117056 PCT/US2015/014053
function of the distance threshold.
[0043] The model derivation module 220 identifies anomalous patients based
on their
cluster relationships. In one embodiment, the model derivation module 220
flags patients
that are in "small" clusters, where "small" is defined either on an absolute
basis (e.g., <= N
patients for some integer N, such as 5), or a relative basis (e.g., <= N% of
all patients, for
some number N, such as 2.5). In one embodiment, the model derivation module
220 flags
patients that are far from other members of their cluster, where "far" is
defined according to a
Euclidean distance metric. Specifically, in one embodiment, dimension
reduction (e.g., via
multi-dimensional scaling (MDS)) is used to convert the patient data records
to a reduced
data set, and the distances are measured in the context of components of the
reduced
dimension data (e.g., the first and second MDS components). In one embodiment,
a patient is
flagged as anomalous unless at least N (e.g., 5) members of the cluster are at
less than a
threshold distance (e.g., 0.05) from the patient.
[0044] The model derivation module 220 additionally identifies potentially
fraudulent
patients based on the distance matrix for the patients. In one embodiment, the
model
derivation module 220 flags patient pairs at a clinical site that have a very
small pairwise
distance, where small is defined either on an absolute basis (e.g., <= d for
some distance d,
such as .01), or a relative basis (e.g., <= q% quantile of all pairwise
distances, for some
quantile q, such as .1%).
[0045] SCORING
[0046] The scoring module 230 applies the models 206 derived by the model
derivation
module 220 to variable values of patient data records of the unified records
202, or to entire
patient data records, the result for each data record being an anomaly score
indicating a
probability that an arbitrary record would have the given values, and
therefore indicating
whether the values are likely erroneous. Scoring is performed differently,
according to the
type of model derived by the model derivation module 220.
[0047] (A) Univariate Models
[0048] Univariate models produce scores for a single variable value. In one
embodiment, anomaly scores are computed for univariate models as follows.
[0049] For categorical or binary models for a variable, the anomaly score
for the value
of the variable is computed as sqrt(12 * p(v)1), where sqrt is the square root
function, and
p(v) is the probability of the variable having the value v across the set of
patient data records,
as computed earlier through an analysis of the values of the variable over a
set of patient data
8
CA 02937919 2016-07-25
WO 2015/117056 PCT/US2015/014053
records.
[0050] For continuous numeric variables, the anomaly score for the value of
the
variable is computed as sqrt(12 * p(v)), where p(v) = 2 * (1 ¨ pnorm(1(v ¨ m)
/ s1)), where v
is the value of the variable, m and s are the trimmed mean entry and standard
deviation of the
variable across the set of patient data records, and pnorm is the function for
a normal
distribution.
[0051] For discrete numeric variables, the anomaly score for the value of
the variable is
computed as sqrt(12 * p(v) 1), where p(v) = 2 * min(dist(v), 1- dist(v) +
density(v)), where
dist and density are the cumulative distribution function and density function
of the best
fitting distribution determined earlier by the model derivation module 220.
[0052] In one embodiment, the anomaly score is computed both (a) across the
set of all
patient data records, and also (b) for each patient cluster determined as part
of the
multivariate relationships by the model derivation module 220, across the
patient data records
of that cluster. (The different set of patient data records in (a) and (b)
typically lead to
different probability functions p(v), and hence typically to different
corresponding anomaly
scores.)
[0053] (B) Bivariate Models
[0054] For bivariate models defined by linear regressions, the scoring
module 230
computes the standardized residual from the regression standardized residual =
abs((vi ¨
predicted vi) / se(residuals from regression model), where se is the standard
error, vi is the
value of the variable of the first variable and predicted vi is the predicted
value of that
variable obtained from the regression model. The anomaly score is then
computed as
sqrt(12*p(v)1), where p(v) = 2 * (1 - pnorm(standardized residual)).
[0055] For bivariate models derived where the variables are both
categorical, or are
both binary, the anomaly score for a value pair (vi,v2) is sqrt(12 * p(v) 1),
where p(v) is the
larger of the probability that the first variable = vi given that the second
variable = v2, and the
probability that the second variable = v2 given that the first variable =vi
[0056] For bivariate models defined by logistic regressions, the anomaly
score for a
value pair (v, v2) is the deviance residual = sqrt(12 * p(v) 1), where v is
the value of the binary
variable.
[0057] (C) Multivariate Models
[0058] The anomaly scores for multivariate models are computed for entire
patient data
9
CA 02937919 2016-07-25
WO 2015/117056 PCT/US2015/014053
records. In one embodiment, the anomaly scores are binary, indicating whether
or not the
corresponding patient data records appear anomalous.
[0059] Score aggregation
[0060] The scoring module 230 further aggregates the scores produced by the
models
with respect to individual patient data record values. Specifically, the
various individual
variables within a given patient data record will have an associated score
produced by a
corresponding univariate model, and the various pairs of individual variables
within a patient
data record will have an associated score produced by a corresponding
bivariate model. (The
individual variables may also be thought of as having the score corresponding
to any
bivariate model of which that variable is within the corresponding variable
pair.) In one
embodiment, two scores are calculated for the various variables of the
variable pairs: a score
from a model derived from the set of all patient data records, and a score
from a model
derived from only the patient cluster to which the patient data record in
question belongs. In
this embodiment, the two anomaly scores may be combined into a single overall
anomaly
score for the variable or variable pair, e.g., by taking the maximum of the
two scores, or by
averaging the two scores.
[0061] The scoring module 230 identifies, as anomalies, scores greater than
some
threshold value (e.g., 3). In one embodiment, the scoring module 230 produces
a report of
the identified anomalies and their corresponding anomaly scores.
[0062] In one embodiment, the scoring module 230 produces an aggregate
anomaly
score for each patient data record by computing the percentage of the
variables for that
patient data record with values that were considered anomalous. Specifically,
the scoring
module 230 evaluates, for each variable, the corresponding univariate model
for (a) all
patient data records, and (b) the particular cluster of patient data records
to which the patient
data record belongs. In one embodiment, the scoring module 230 also increases
the anomaly
score for a patient data record if the patient data record was considered
anomalous based on
the cluster relationships derived based on the multivariate relationships. The
scoring module
230 additionally evaluates, for each variable, any bivariate models for which
the variable is
one of the variables of the bivariate model's variable pair. Again, as with
univariate models,
there is a bivariate model both for (a) all patient data records, and (b) the
particular cluster of
patient data records to which the patient data record belongs. A variable for
which any of
these scores¨i.e., those of one of the univariate or bivariate models¨is above
the threshold
indicating anomalousness is considered to be anomalous.
CA 02937919 2016-07-25
WO 2015/117056 PCT/US2015/014053
[0063] In one embodiment, the scoring module 230 produces an aggregate
anomaly
score for each variable of the patient data records by computing the
percentage the set of all
patient data records (or of a representative subset thereof) for which the
variable's value was
considered anomalous.
[0064] In one embodiment, the scoring module 230 produces an aggregate
anomaly
score for each site by computing the percentage of variable values identified
as anomalous
across all patient data records obtained from that site.
[0065] In one embodiment, the scoring module 230 produces an aggregate
anomaly
score for each variable at each site by computing the percentage of values for
that variable
identified as anomalous across all patient data records obtained from that
site.
[0066] In one embodiment, the scoring module 230 produces an aggregate
clinical trial
anomaly score by calculating the percentage of variable values identified as
being anomalous
across all patient data records. For example, if there are 1000 variables, and
2000 patents,
then there are 2 million distinct patient variable values, and if there were
80,000 such patient
variable values identified as being anomalous, then the aggregate clinical
trial anomaly score
could be calculated as 80,000 / 2,000,000 = 4%.
[0067] In one embodiment, the scoring module 230 additionally produces a
set of
average anomaly scores. The average anomaly scores indicate the severity of
the anomalies
for the values identified as being anomalous, whereas the aggregate anomaly
scores indicate
the frequency of the anomalies. In one embodiment, the average anomaly score
for the set of
patients is produced by computing the anomaly scores for the variables across
some or all of
the patients, identifying those scores sufficiently high to be considered
anomalous, and then
computing the average of those scores. In one embodiment, the average anomaly
score for a
variable is produced by identifying, for some or all of the patient data
records, whether the
variable's value is identified as anomalous, and for those that are considered
anomalous,
computing the average anomaly score. As a further example, the average anomaly
score for a
site is produced by computing, for the patient data records produced by a
site, the average of
the anomaly scores identified as being anomalous for variables over the
patient data records
produced by the site. As another example, the average anomaly score for the
trial as a whole
is produced by computing, for the patient data records in the trial
(regardless of the site at
which they were produced), the average of the anomaly scores identified as
being anomalous
for the variables of those patient data records.
[0068] GRADING
11
CA 02937919 2016-07-25
WO 2015/117056 PCT/US2015/014053
[0069] The grading module 240 uses the scores produced by the scoring
module 230 to
assign a grade to the clinical trial as a whole. The assignment of the grade
enables those in
charge of the clinical trial to quickly determine whether the current data
quality of the clinical
trial is sufficient, or whether the anomalies require investigation and/or
whether more data
should be collected. This reduces the expense associated with the clinical
trial by enabling
those in charge to easily determine whether additional work is needed, or
whether the data is
now of an acceptable level of quality and hence the data gathering and
analysis can cease.
[0070] In one embodiment, the aggregate anomaly score for the clinical
trial is mapped
to a letter grade (or other indicator of data quality, such as a
representative image) by
partitioning the space of possible aggregate anomaly scores and assigning a
letter grade to
each. In one embodiment, the partitioning is predetermined, with (for example)
aggregate
anomaly scores of 0-2% being assigned an 'A', 2-3% being assigned a 'B', and
the like. In
another embodiment, the partitioning is empirically determined with respect to
prior studies.
For example, the aggregate anomaly scores of the prior studies can be
computed, and the
average aggregate anomaly score of the highest 10% (for example) of the
anomaly scores can
be used to define the bottom boundary of a first partition corresponding to an
'A', the average
of the next highest 20% of the anomaly scores used to define the bottom
boundary of a
second partition corresponding to a 'B', and the like.
[0071] In one embodiment, the letter grade (or other indicator of data
quality) that was
determined using the aggregate anomaly score for the trial is adjusted
according to the
average anomaly score for the trial. This combines both the frequency and the
severity of the
anomalies when determining the grade. For example, the letter grade determined
according
to the aggregate anomaly score could be associated with a plus (e.g., "A+")
for average
anomaly scores below some threshold, and a minus (e.g., "B-") for average
anomaly scores
above some threshold.
[0072] In one embodiment, a scaled numeric grade is alternatively or
additionally
computed. The scaled numeric grade can be computed as (100 ¨ 10 *
aggregateAnomalyScore), where aggregateAnomalyScore is the aggregate anomaly
score of
the clinical trial
[0073] In some embodiments, the grading module 240 assigns grades in like
manner to
entities other than the clinical trial as a whole, such as to individual
sites.
DATA FLOW
12
CA 02937919 2016-07-25
WO 2015/117056 PCT/US2015/014053
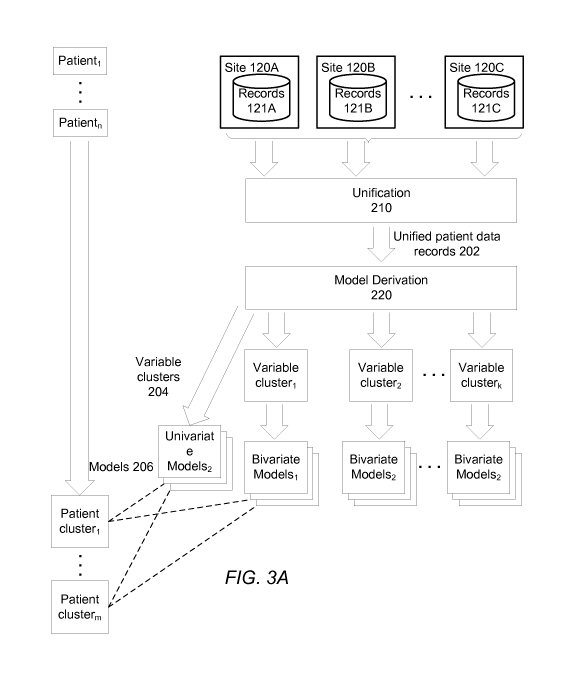
[0074] FIG. 3A is a data flow diagram illustrating the process of forming
models for
assessing likelihoods that errors are present in patient data, according to
one embodiment.
[0075] The various sites 120 each produce a set of patient data records
121, of which
there can be many for a single patient. The unification module 210 of the
analysis server 100
combines and standardizes the different patient data records 121, producing a
set of unified
patient data records 202 containing one record per patient. Each patient data
record has a
number of associated variables, such as patient height, patient weight,
patient daily dose of
drug X, and the like.
[0076] The model derivation module 220 takes the unified patient data
records 202 as
input, producing a set of variable clusters 204. Each variable cluster
contains a set of
variables with sufficiently strong relationships, as determined by a distance
between the
variables as computed by a distance metric evaluated over some analyzed set of
the patient
data records 202. For example, the numerical variables "height" and "weight"
would
typically be placed in the same cluster, since there is a high degree of
correlation between
them in practice.
[0077] Models 206 are trained for the different variables and pairs of
variables from the
unified patent data records 202. Specifically, a univariate model is derived
for each variable,
reflecting how anomalous it is for the variable to have a given value. In one
embodiment, a
number of univariate models are trained for each variable: one is derived from
all patient data
records 202, and others are derived from the patient data records in the
various patient
clusters defined by multivariate analysis, one per patient cluster.
Additionally, a bivariate
model is derived for each pair of variables. In one embodiment, a number of
bivariate
models are trained for each pair of variables: one is derived from all patient
data records 202,
and others are derived from the patient data records in the various patient
clusters defined by
multivariate analysis, one per patient cluster.
[0078] FIG. 3B is a data flow diagram illustrating the usage of the models
of FIG. 3A
to identify potential errors in patient data, according to one embodiment.
FIG. 3B illustrates
a univariate model 360 and a bivariate model 370. The univariate model is
defined with
respect to a first patient variable (indicated by the darkening of the first
of six variable slots
for a simplified example record), and the bivariate model is defined with
respect to a second
and a fifth patient variable. For a particular patient data record, such as
record 355 illustrated
in FIG. 3B, the variable value(s) of the record corresponding to the models
are provided as
input to the models, and the models output anomaly scores. For example, the
value of the
13
CA 02937919 2016-07-25
WO 2015/117056 PCT/US2015/014053
first variable of record 355 is provided to the univariate model 360, and the
output is an
anomaly score indicating a degree of anomalousness of that value with respect
to other values
of the first variable in the other patient data records with respect to which
the univariate
model 360 was derived.
EXAMPLE USER INTERFACE
[0079] FIG. 4 illustrates a sample user interface showing visual output of
the analysis
server 100 after analyzing the collected patient data records for a particular
clinical trial
"XYZ," according to one embodiment.
[0080] Area 264 indicates that there were 264 total patients in the study;
area 407
indicates that 26 of these patients were found to be anomalous at a first
degree of severity,
and area 409 indicates that 9 of these patients were found to be anomalous at
a second, higher
degree of severity. (The degrees of severity are defined as the aggregate
anomaly score for
the patient data records.)
[0081] Area 415 contains an ordered list of the variables found to be most
frequently
identified as anomalous over the set of the patient data records in the
clinical trial, and area
425 lists the corresponding numbers of times that the variables were
identified as being
anomalous. For example, the variable "Start Date" was identified as having
been found to be
anomalous 7 times for the 264 patients in the clinical trial.
[0082] Area 410 shows the aggregate anomaly score for the clinical trial
(i.e., that 4.1%
of the variable values across the set of all the patient data records were
identified as being
anomalous). Area 420 shows the average anomaly score for the clinical trial
(i.e., that of the
variable values identified as being anomalous, their average anomaly score was
2.9).
[0083] Finally, area 430 indicates the overall grade assigned to the
existing data of the
clinical trial¨i.e., a "B+", where the "B" is derived from the aggregate
anomaly score in area
410, and the "+" is derived from the average anomaly score in area 420, as
described above
with respect to the grading module 240.
EXAMPLE COMPUTER ARCHITECTURE
[0084] FIG. 5 is a block diagram illustrating physical components of a
computer system
500, which can serve as the analysis server 100 of FIG. 1, according to one
embodiment.
Illustrated are at least one processor 502 coupled to a chipset 504. Also
coupled to the
chipset 504 are a memory 506, a storage device 408, a keyboard 510, a graphics
adapter 512,
a pointing device 514, and a network adapter 516. A display 518 is coupled to
the graphics
14
CA 02937919 2016-07-25
WO 2015/117056 PCT/US2015/014053
adapter 512. In one embodiment, the functionality of the chipset 504 is
provided by a
memory controller hub 520 and an I/0 controller hub 522. In another
embodiment, the
memory 506 is coupled directly to the processor 502 instead of the chipset
504.
[0085] The storage device 508 is any non-transitory computer-readable
storage
medium, such as a hard drive, compact disk read-only memory (CD-ROM), DVD, or
a solid-
state memory device. The memory 506 holds instructions and data used by the
processor
502. The pointing device 514 may be a mouse, track ball, or other type of
pointing device,
and is used in combination with the keyboard 510 to input data into the
computer 500. The
graphics adapter 512 displays images and other information on the display 518.
The network
adapter 516 couples the computer system 500 to a local or wide area network.
[0086] As is known in the art, a computer system 500 can have different
and/or other
components than those shown in FIG. 4. In addition, the computer 500 can lack
certain
illustrated components. For example, in one embodiment, if a computer system
500 is a
smartphone it may lack a keyboard 510, pointing device 514, and/or graphics
adapter 512,
and have a different form of display 518. Moreover, the storage device 508 can
be local
and/or remote from the computer 500 (such as embodied within a storage area
network
(SAN)).
[0087] As is known in the art, the computer system 500 is adapted to
execute computer
program modules for providing functionality described herein. As used herein,
the term
"module" refers to computer program logic utilized to provide the specified
functionality.
Thus, a module can be implemented in hardware, firmware, and/or software. In
one
embodiment, program modules are stored on the storage device 508, loaded into
the memory
506, and executed by the processor 502.
[0088] Embodiments of the entities described herein can include other
and/or different
modules than the ones described here. In addition, the functionality
attributed to the modules
can be performed by other or different modules in other embodiments. Moreover,
the
description occasionally omits the term "module" for purposes of clarity and
convenience.
[0089] The present invention has been described in particular detail with
respect to one
possible embodiment. Those of skill in the art will appreciate that the
invention may be
practiced in other embodiments. First, the particular naming of the components
and
variables, capitalization of terms, the attributes, data structures, or any
other programming or
structural aspect is not mandatory or significant, and the mechanisms that
implement the
invention or its features may have different names, formats, or protocols.
Also, the particular
CA 02937919 2016-07-25
WO 2015/117056 PCT/US2015/014053
division of functionality between the various system components described
herein is merely
for purposes of example, and is not mandatory; functions performed by a single
system
component may instead be performed by multiple components, and functions
performed by
multiple components may instead performed by a single component.
[0090] Some portions of above description present the features of the
present invention
in terms of algorithms and symbolic representations of operations on
information. These
algorithmic descriptions and representations are the means used by those
skilled in the data
processing arts to most effectively convey the substance of their work to
others skilled in the
art. These operations, while described functionally or logically, are
understood to be
implemented by computer programs. Furthermore, it has also proven convenient
at times to
refer to these arrangements of operations as modules or by functional names,
without loss of
generality.
[0091] Unless specifically stated otherwise as apparent from the above
discussion, it is
appreciated that throughout the description, discussions utilizing terms such
as "determining"
or "displaying" or the like, refer to the action and processes of a computer
system, or similar
electronic computing device, that manipulates and transforms data represented
as physical
(electronic) quantities within the computer system memories or registers or
other such
information storage, transmission or display devices.
[0092] Certain aspects of the present invention include process steps and
instructions
described herein in the form of an algorithm. It should be noted that the
process steps and
instructions of the present invention could be embodied in software, firmware
or hardware,
and when embodied in software, could be downloaded to reside on and be
operated from
different platforms used by real time network operating systems.
[0093] The present invention also relates to an apparatus for performing
the operations
herein. This apparatus may be specially constructed for the required purposes,
or it may
comprise a general-purpose computer selectively activated or reconfigured by a
computer
program stored on a computer readable medium that can be accessed by the
computer. Such
a computer program may be stored in a non-transitory computer readable storage
medium,
such as, but is not limited to, any type of disk including floppy disks,
optical disks, CD-
ROMs, magnetic-optical disks, read-only memories (ROMs), random access
memories
(RAMs), EPROMs, EEPROMs, magnetic or optical cards, application specific
integrated
circuits (ASICs), or any type of computer-readable storage medium suitable for
storing
electronic instructions, and each coupled to a computer system bus.
Furthermore, the
16
CA 02937919 2016-07-25
WO 2015/117056 PCT/US2015/014053
computers referred to in the specification may include a single processor or
may be
architectures employing multiple processor designs for increased computing
capability.
[0094] The algorithms and operations presented herein are not inherently
related to any
particular computer or other apparatus. Various general-purpose systems may
also be used
with programs in accordance with the teachings herein, or it may prove
convenient to
construct more specialized apparatus to perform the required method steps. The
required
structure for a variety of these systems will be apparent to those of skill in
the art, along with
equivalent variations. In addition, the present invention is not described
with reference to
any particular programming language. It is appreciated that a variety of
programming
languages may be used to implement the teachings of the present invention as
described
herein, and any references to specific languages are provided for invention of
enablement and
best mode of the present invention.
[0095] The present invention is well suited to a wide variety of computer
network
systems over numerous topologies. Within this field, the configuration and
management of
large networks comprise storage devices and computers that are communicatively
coupled to
dissimilar computers and storage devices over a network, such as the Internet.
[0096] Finally, it should be noted that the language used in the
specification has been
principally selected for readability and instructional purposes, and may not
have been
selected to delineate or circumscribe the inventive subject matter.
Accordingly, the disclosure
of the present invention is intended to be illustrative, but not limiting, of
the scope of the
invention, which is set forth in the following claims.
17