Note: Descriptions are shown in the official language in which they were submitted.
FORMATION OF MULTICELLULAR TUMOROIDS AND USES THEREOF
STATEMENT REGARDING FEDERALY SPONSORED RESEARCH OR DEVELOPMENT
This invention was made with government support under grant number
HHSN261201300044C awarded by the National Institute of Health. The government
has
certain rights to this invention.
BACKGROUND
Potential anti-cancer drugs entering clinical development have a high level of
attrition
(about 95%) despite the rising cost of new drug development (about 800
million). Such a
high rate of attrition has been attributed to the current approaches used for
anti-cancer drug
.. discovery, efficacy testing, and drug development in two-dimensional (2D)
cell-culture
assays and in vivo animal models. As such, there is an urgent and unmet need
for improved
tools and techniques for anti-cancer drug discovery, efficacy testing, and
drug development.
SUMMARY
Described herein are methods of forming multi-cellular tumoroids. In some
aspects,
the methods can contain the step of co-culturing tumor cells (TCs), cancer
associated
fibroblast cells (CAFs), and epithelial cells (ECs) in a cell culture media,
where the ratio of
the number of TCs to CAFs to ECs is 5 to 1 to 1, and where the cell culture
media comprises
an amount of a mesenchymal stem cell conditioned media. The tumor cells can be
breast
cancer cells. The tumor cells can be derived from a subject. In some
embodiments, the
breast cancer cells are derived from a subject's tumor. In some aspects, the
mesenchymal
stem cell conditioned media is present at least at about 20% of the total
amount of the cell
culture media. In further aspects, the mesenchymal stem cell conditioned media
is present at
least at about 20% to about 50% of the total amount of the cell culture media.
The
mesenchymal stem cell conditioned media can contain at least about 800 pg/mL
VEGF. The
mesenchymal stem cell conditioned media can contain at least about 100 pg/mL
IL-6. the
mesenchymal stem cell conditioned media the mesenchymal stem cell conditioned
media
contains at least about 1200 pg/mL TGF-81. at least about 1200 pg/mL TGF-81.
The
mesenchymal stem cell conditioned media can contain at least about 800 pg/mL
VEGF, at
1
Date Recue/Date Received 2021-09-17
CA 02949673 2016-11-18
WO 2015/179393
PCT/US2015/031571
least about 100 pg/mL IL-6, and at least about 1200 pg/mL TGF-81. In
additional aspects,
the cell culture media can further contain about % to about 10% Matrigel. In
some aspects,
the TCs, CAFs, and ECs are co-cultured on a three-dimensional scaffold. The
three-
dimensional scaffold can be a fibrous induced smart scaffold.
Also described are methods of determining the efficacy of an anti-cancer drug
containing the steps of forming a multicellular tumoroid, where forming the
multicellular
tumoroid contains the step of co-culturing tumor cells (TCs), cancer
associated fibroblast
cells (CAFs), and epithelial cells (ECs) in a cell culture media, where the
ratio of the number
of TCs to CAFs to ECs is 5 to 1 to 1, and where the cell culture media
comprises an amount
of a mesenchymal stem cell conditioned media; and exposing the multicellular
tumoroid to
an amount of the anti-cancer drug. In some aspects, the tumor cells are breast
cancer cells.
The breast cancer cells can be derived from a subject's tumor. The breast
cancer cells can
be from a standard breast cancer cell line. The mesenchymal stem cell
conditioned media
can be present at least at about 20% of the total amount of the cell culture
media. The
mesenchymal stem cell conditioned media can be present at least at about 20%
to about
50% of the total amount of the cell culture media. The mesenchymal stem cell
conditioned
media can contain at least about 800 pg/mL VEGF, at least about 100 pg/mL IL-
6, and at
least about 1200 pg/mL TGF-81. The methods of determining the efficacy of an
anti-cancer
drug can further include the step of measuring the expression of Ki-67 in the
multicellular
tumoroid after exposure to the amount of the anti-cancer drug. The methods of
determining
the efficacy of an anti-cancer drug can also include the step of measuring the
amount of
VEGF or IL-6 present in the culture media after exposure to the amount of the
anti-cancer
drug.
BRIEF DESCRIPTION OF THE DRAWINGS
Further aspects of the present disclosure will be readily appreciated upon
review of
the detailed description of its various embodiments, described below, when
taken in
conjunction with the accompanying drawings.
Figs. 1A-1B show representative fluorescent microscopic images demonstrating
growth of BT474 breast cancer cell derived tumoroids after about 5 days of
culturing with
(Fig. 1B) or without (Fig. 1A) cancer associated fibroblasts (CAFs) and
endothelial cells
(ECs).
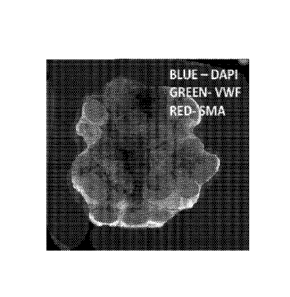
Fig. 2 shows a confocal microscope image (merged z-stacked images) of B1474
breast cancer co-cultured tumoroids showing EVs (vWF, green cells) and CAFs
(SMA
positive, red cells) and nuclei (DAPI, blue).
2
CA 02949673 2016-11-18
WO 2015/179393
PCT/US2015/031571
Fig. 3 shows a graph demonstrating the amount of VEGF in the supernatant of
the
cultured cells of Figs. 1A-1B and 2 as measured by ELISA. Cells were cultured
for 5 days
prior to determining the amount of VEGF produced by the cultured cells.
Figs. 4A and 4B show representative fluorescent microscopic images
demonstrating
growth of HCC1569 breast cancer cell derived tumorids after about 5 days of
culturing with
(Fig. 4B) or without (Fig. 4A) cancer associated fibroblasts (CAFs) and
endothelial cells
(ECs). The results shown are from one representative experiment out of three.
Figs. 5A-5C show graphs demonstrating VEGF (Fig. 5A), IL-6 (Fig. 5B), and
active
TGF-131 (Fig. 5C) present in human mesencymal stem cell (hMSC) conditioned
medium
(CM). Human MSCs were cultured in alpha-MEM and 15% serum. Conditioned medium
of
passages (p) p2-p6 was collected about 48h after each passage. Collected
conditioned
medium was centrifuged, filtered (using a 0.45pm filter), and stored at -800
until use.
Expression of the growth factors in the CM of p2-p6 was examined by ELISA.
Neutralizing
VEGF antibody was used to demonstrate specificity of VEGF. * p < 0.05.
Figs. 6A-6H demonstrate representative fluorescent microscope images of
monoculture (Figs. 6A-6D) of BT474 breast cancer cells or co-culture (Figs. 6E-
6H) of
B1474 breast cancer cells and ECs + CAFs stained by Calcein-AM/EthD-1 to
detect live
(green) and dead (red) cells. Magnification: 100X. The ratio of standard
growth medium
(GM) to CM (GM:CM) ranged from about 100:0 to about 50:50.
Fig. 7 demonstrates tunnorid diameter of the tumoroids shown in Figs. 6A-6H.
Tumoroid diameter was measured using Image J. Three scaffolds/group and 10
tumorids/scaffold examined * p < 0.05.
Figs. 8A to 8B demonstrate BT474 tumoroid cultures stained with calcein-
AM/EthD-1
that stains live cells green and dead cells red (Fig. 8A) and Ki-67 staining
for a monoculture
of BT474 on a 3-0 scaffold (Fig. 8B).
Figs 9A and 19B show graphs demonstrating differential responses to Lapatinib
in
B1474 (Fig. 9A) and HCC1569 (Fig. 9B) tumoroids grown in monoculture or co-
culture. On
day 2 after culturing, cells were treated with the indicated concentrations
(pM) of Lapatinib
for about 72 hours. Cell viability was measured by PrestoBlueOassay.
Figs.10A and 10B show representative images that demonstrate Ki-67 expression
in
Lapatinib treated BT474 (Fig. 10A) co-cultured tumoroids or control untreated
tumoroids
(Fig. 10B). On day 2 after co-culture, cells were treated with 2.5 pM of
Lapatinib for 72
hours, and Ki-67 expression in the control and Lapatinib treated culture was
determined by
immunohistochemistry.
Figs. 11A-11C show graphs demonstrating the effect of Lapatinib on VEGF (Fig.
11A), IL-6 (Fig. 11B), and TGF-[31 (Fig. 11C) on BT474 tumoroids derived from
monocultures or co-culturing B1474 cells with CAFs and ECs on a 3-D scaffold.
B1474
3
CA 02949673 2016-11-18
WO 2015/179393
PCT/US2015/031571
tumoroids were monocultured or co-cultured in the presence or absence of
Lapatinib (2.5-
10pM) and the levels of VEGF, IL-6, and TGF-131 in the day 5 culture
supernatants were
determined by ELISA. * p <0.05.
Figs. 12A-12D demonstrate breast cancer cells forming SCTs when cultured on
the
FiSS. Cells (10 X103) were cultured for about 5 days on FiSS. Tumoroids formed
were
stained with calcein AM/EthD-1 that stains live cells green and dead cells
red.
Fig. 13 shows a graph demonstrating the growth of breast cancer cells on the
FiSS.
Cells (10 X103) were cultured in triplicates on the scaffold for 9 days on the
FiSS. Tumoroid
size was measured by ImageJ analysis.
Figs. 14A-140 demonstrate the growth of breast cancer cells co-cultured with
CAFs
and/or ECs on the FiSS. Day-5 MCF-7 or HCC-1569 tumoroids were cultured with
ECs or
CAFs (5x10³) or a combination of ECs and CAFs (2.5x10³ each) in triplicates on
the FiSS for
another 4 days. MCTs at day 9 were stained with calcein AM/EthD-1 that stains
live cells
green and dead cells red.
Fig. 15 shows a graph demonstrating the results of a Presto Blue assay to
evaluate
the growth of breast cancer cells co-cultured with CAFs and/or ECs on the
FiSS. Growth of
MCTs was monitored using Presto Blue Assay at day-9.
Figs. 16A-16F demonstrate calcein stained SCTs (Figs. 16A-16C) and MCTs (Figs.
16D-16F) derived from MCF7 (Figs. 16A and 16D), HCC1569 (Figs. 16B and 16F),
and
B1474 (Figs. 16C and 16F) breast cancer cell lines. Tumor cells were mono-
cultured (upper)
or co-cultured with CAFs and ECs on FiSS and stained with calcein AM/EthD-1
that stains
live cells green and dead cells red. Day-5 SCTs and MCTs derived from MCF7,
HCC1569
and BT474 are shown.
Figs. 17A-17F demonstrate representative images of fixed tumoroids that were
immunostained for VWF and SMA and counterstained by DAPI. Representative
fluorescent
images (Figs. 17A-17C) and confocal microscopic images (merged z-stacked
images) (Figs.
17D-17F) of MCTs showing ECs (vWF, green cells), CAFs (SMA positive, red
cells) and
DAPI (total cell nuclei) are shown.
Figs. 18A-180 demonstrate representative images of a comparison of FiSS
induced
SCTs with colonies formed by Matrigel based 3D culture. Cells (3 X 10³) were
cultured on a
layer of Matrigel coated plate in the presence of growth medium supplemented
with 10%
Matrigel. Cells were cultured for 5 days and spheroids were stained with
calcein AM and
examined by fluorescent microscope. Figs. 18A and 18C show colonies formed on
the
Matrigel and Figs. 18B and 18D show SCTs formed on FiSS. Figs. 19A-19B show
results
from MCF7 cells and Figs. 18C-18D show results from B1474 cells.
Fig. 19 shows a graph demonstrating VEGF expression in MCF7-SCTs and ¨MCTs.
MCF7 tumoroids were cultured for 5 days and the levels of VEGF in the day 5
culture
4
supernatants were determined by ELISA.
Fig. 20 shows an image of a scan data showing signal intensity of Array 1 and
Array
2. Panels 1-8 contained controls with various standards for a standard curve.
Panels 9-12
contained SCT samples. Panels 13-16 contained MCI samples.
Fig. 21 shows a Table with a list of antibodies used in the array of Fig. 20.
Figs. 22A-22C show graphs demonstrating the protein expression of IL-6 (Fig.
22A),
IL-8 (Fig. 22B), and MCP-1 (Fig. 22C) produced by SCT and MCT tumoroids. BT474
tumoroids (SCTs, blue bars and MCTs, red bars) were cultured in the presence
or absence
of Lapatinib (0.5-12.5 pM), as in Figs. 9A-9B, and the levels of IL-6, IL-8,
MCP-1 in the day 5
culture supernatants were determined by Sandwich ELISA (Figs. 20-21). * p <
0.05.
Figs. 23A-23C show graphs demonstrating the protein expression of PDGF-BB
(Fig.
25A), DKK-1 (Fig. 25B), and OPG (Fig. 25C) produced by SCT and MCT tumoroids.
BT474
tumoroids (SCTs, blue bars and MCTs, red bars) were cultured in the presence
or absence
of Lapatinib (0.5-12.5 pM), as in Figs. 9A-9B, and the levels of PDGF-BB, DKK-
1, OPG in
the day 5 culture supernatants were determined by Sandwich ELISA (Figs. 20-
21). * p <
0.05.
Fig. 24 shows a graph demonstrating the protein expression of MMP-3 produced
by
SCT and MCT tumoroids. BT474 tumoroids (SCTs, blue bars and MCTs, red bars)
were
cultured in the presence or absence of Lapatinib (0.5-12.5 pM), as in Figs. 9A-
9B, and the
levels of MMP-3 in the day 5 culture supernatants were determined by Sandwich
ELISA
(Figs. 20-21). * p < 0.05.
Fig. 25 describes various biomarkers that can be used to determine or predict
clinical
efficacy of a compound.
Figs. 26A-26D show representative images of calcein AM stained tumoroids
demonstrating the comparison of Lapatinib response to FiSS induced SCTs with
Matrigel-
based 3D culture. Cells (3 X 10³) were cultured on a layer of Matrigel coated
plate in the
presence of growth medium supplemented with 10% Matrigel. Three days after
culture, cells
were treated with indicated concentrations of Lapatinib and examined after 72
hrs.
Spheroids were stained with calcein AM and examined by fluorescent microscope.
Figs. 27A-27B show graphs demonstrating the results from a Presto Blue assay
to
determine cell viability of the tumoroids cultured on Matrigel (Fig. 27A) or
FiSS (Fig. 27B).
Figs. 28A-28D show representative Z-stacked images demonstrating HCA using
Operetta. The Z stacked images were acquired using Operetta (Perkin Elmer) and
were
subjected to image J (Figs. 28A-28B) and image J threshold analyses (Figs. 28C
and 28D).
The mean intensity for DAPI and Ki67 were determined.
Fig. 29 shows a graph demonstrating the results from culturing BT474 tumoroids
in
the presence or absence of Lapatinib for about 72 hrs, fixing the tumoroids,
and
5
Date Recue/Date Received 2021-09-17
immunostaining the tumoroids for Ki-67. Quantification of immunostaining was
completed
using Operetta. Relative Ki-67 intensity is demonstrated.
Figs. 30A-30B demonstrate Z'-Factor analysis in tumoroid culture using
PrestoBlue
Assay. LLC1 cells were plated at 5000 cells/well in a 96 well plate pre-loaded
with FiSS.
Forty-eight hours later, wells were replenished with 100 pl of fresh media
containing 10%
DMSO (vehicle). After 72 hours, wells were incubated with PrestoBlue reagent
and
fluorescence was measured (BioTek Synergy plate reader).
Fig. 31 shows a confocal image of a representative SCT showing full Cell Titer-
Glo
reagent penetration.
Fig. 32 shows a graph demonstrating viability of BT474 cells (in replicates of
4
wells/group) determined using CellTiter-Glo 2.0 assay. Luminescence was
measured using
a BioTek Synergy plate reader. Data represent mean SD.
Figs. 33A-33B show graphs demonstrating the minimal well to well variation of
MCF7
(Fig. 33A) and BT-474 (Fig. 33B) tumoroids cultured on fabricated FiSS-96 well
microplates.
DETAILED DESCRIPTION
Before the present disclosure is described in greater detail, it is to be
understood that
this disclosure is not limited to particular embodiments described, and as
such may, of
course, vary. It is also to be understood that the terminology used herein is
for the purpose
of describing particular embodiments only, and is not intended to be limiting.
Where a range of values is provided, it is understood that each intervening
value, to
the tenth of the unit of the lower limit unless the context clearly dictates
otherwise, between
the upper and lower limit of that range and any other stated or intervening
value in that
stated range, is encompassed within the disclosure. The upper and lower limits
of these
smaller ranges may independently be included in the smaller ranges and are
also
encompassed within the disclosure, subject to any specifically excluded limit
in the stated
range. Where the stated range includes one or both of the limits, ranges
excluding either or
both of those included limits are also included in the disclosure.
Unless defined otherwise, all technical and scientific terms used herein have
the
same meaning as commonly understood by one of ordinary skill in the art to
which this
disclosure belongs. Although any methods and materials similar or equivalent
to those
described herein can also be used in the practice or testing of the present
disclosure, the
preferred methods and materials are now described.
6
Date Recue/Date Received 2021-09-17
The citation of any publication is for its disclosure prior to the filing date
and should not be
construed as an admission that the present disclosure is not entitled to
antedate such
publication by virtue of prior disclosure. Further, the dates of publication
provided could be
different from the actual publication dates that may need to be independently
confirmed.
As will be apparent to those of skill in the art upon reading this disclosure,
each of the
individual embodiments described and illustrated herein has discrete
components and
features which may be readily separated from or combined with the features of
any of the
other several embodiments without departing from the scope or spirit of the
present
disclosure. Any recited method can be carried out in the order of events
recited or in any
other order that is logically possible.
Embodiments of the present disclosure will employ, unless otherwise indicated,
techniques of molecular biology, microbiology, nanotechnology, organic
chemistry,
biochemistry, botany and the like, which are within the skill of the art. Such
techniques are
explained fully in the literature.
Definitions
As used herein, "tumoroid" refers to a micrometastatic compact aggregate of
tumor
cells. Tumoroids can respond to the same biochemical, nanotopographical, and
mechanical
cues that drive tumor progression in the extracellular matrix.
As used herein, the terms "cancer," "cancer cells," "neoplastic cells,"
"neoplasia,"
"tumor," and "tumor cells" (used interchangeably) refer to cells which exhibit
relatively
autonomous growth so that they exhibit an aberrant growth phenotype
characterized by a
significant loss of control of cell proliferation (i.e., de-regulated cell
division). Neoplastic cells
can be malignant or benign. A metastatic cell or tissue means that the cell
can invade and
destroy neighboring body structures. The cancer can be selected from
astrocytoma,
adrenocortical carcinoma, appendix cancer, basal cell carcinoma, bile duct
cancer, bladder
cancer, bone cancer, brain cancer, brain stem glioma, breast cancer, cervical
cancer, colon
cancer, colorectal cancer, cutaneous T-cell lymphoma, ductal cancer,
endometrial cancer,
ependymoma, Ewing sarcoma, esophageal cancer, eye cancer, gallbladder cancer,
gastric
cancer, gastrointestinal cancer, germ cell tumor, glioma, hepatocellular
cancer, histiocytosis,
Hodgkin lymphoma, hypopharyngeal cancer, intraocular melanoma, Kaposi sarcoma,
kidney
cancer, laryngeal cancer, leukemia, liver cancer, lung cancer, lymphoma,
macroglobulinemia, melanoma, mesothelioma, mouth cancer, multiple myeloma,
nasopharyngeal cancer, neuroblastoma, non-Hodgkin lymphoma, osteosarcoma,
ovarian
cancer, pancreatic cancer, parathyroid cancer, penile cancer, pharyngeal
cancer, pituitary
cancer, prostate cancer, rectal cancer, renal cell cancer, retinoblastoma,
_________________________________________________________________________ _
_ ________________________________________________________________________
7
Date Recue/Date Received 2021-09-17
CA 02949673 2016-11-18
WO 2015/179393
PCT/US2015/031571
rhabdomyosarcoma, sarcoma, skin cancer, small cell lung cancer, small
intestine cancer,
squamous cell carcinoma, stomach cancer, 1-cell lymphoma, testicular cancer,
throat
cancer, thymoma, thyroid cancer, trophoblastic tumor, urethral cancer, uterine
cancer,
uterine sarcoma, vaginal cancer, vulvar cancer and Wilms tumor. In some
embodiments,
the cancer is prostate cancer.
The terms "cell," "cell line," and "cell culture" include progeny. It is also
understood
that all progeny may not be precisely identical in DNA content due to
deliberate or
inadvertent mutations. Variant progeny that have the same function or
biological property,
as screened for in the originally transformed cell, are included. The "host
cells" used in the
present invention generally are prokaryotic or eukaryotic hosts.
As used herein, "scaffold" refers to a three-dimensional porous sold
biomaterial that
can: (1) promote cell-biomaterial interactions, cell adhesion, and
extracellular matrix
deposition; (2) permit sufficient transport of gasses, nutrients, and/or
regulatory factors to
allow cell survival, proliferation, and/or differentiation.; (3) biodegrade at
a controllable rate
that approximates the rate of tissue regeneration under culture conditions of
interest; and/or
(4) provoke a minimal degree of inflammation or toxicity if introduced in
vivo.
As used herein, "sternness" refers to properties, characteristics (structural
or
functional), and molecular signatures that distinguish stem cells from other
differentiated cell
types.
As used herein, "stennness factors" can refer to genes or proteins that are
required
for or involved in stem cell self-renewal or other property or characteristic
that is unique to
stem cells, including but not limited to OCT-4, SSEAs, 0D133, ABCG2, Nestin,
Sox2,
Naong, C044, EpCAM (ESA, TROP1), CD24 (HSA), CD90, CD200, and ALDH.
As used herein "fibrous scaffold" refers to a three dimensional structure
formed by
randomly oriented fibers. In some embodiments, electrospining methods are used
to achieve
the randomly oriented fiber construction.
A "subject," "individual," or "patient," used interchangeably herein, refers
to a
vertebrate, preferably a mammal, more preferably a human. Mammals include, but
are not
limited to, murines, simians, humans, farm animals, sport animals, and pets.
As used herein, "composition" refers to a combination of active agent and
another
compound or composition, inert (for example, a detectable agent or label) or
active, such as
an adjuvant.
As used herein, "control" is an alternative subject or sample used in an
experiment
for comparison purpose and included to minimize or distinguish the effect of
variables other
than an independent variable.
8
CA 02949673 2016-11-18
WO 2015/179393
PCT/US2015/031571
As used herein, "positive control" refers to a "control" that is designed to
produce the
desired result, provided that all reagents are functioning properly and that
the experiment is
properly conducted.
As used herein, "negative control" refers to a "control" that is designed to
produce no
effect or result, provided that all reagents are functioning properly and that
the experiment is
properly conducted. Other terms that are interchangeable with "negative
control" include
"sham," "placebo," and "mock."
As used herein, "culturing" refers to maintaining cells under conditions in
which they
can proliferate and avoid senescence as a group of cells. "Culturing" can also
include
conditions in which the cells also or alternatively differentiate.
As used herein, "expansion" or "expanded" in the context of cell refers to an
increase
in the number of a characteristic cell type, or cell types, from an initial
population of cells,
which may or may not be identical. The initial cells used for expansion need
not be the same
as the cells generated from expansion. For instance, the expanded cells may be
produced
by ex vivo or in vitro growth and differentiation of the initial population of
cells.
As used herein, "expression" refers to the process by which polynucleotides
are
transcribed into RNA transcripts. In the context of mRNA and other translated
RNA species,
"expression" also refers to the process or processes by which the transcribed
RNA is
subsequently translated into peptides, polypeptides, or proteins.
As used herein, "concentrated" refers to a molecule, including but not limited
to a
polynucleotide, peptide, polypeptide, protein, antibody, or fragments thereof,
that is
distinguishable from its naturally occurring counterpart in that the
concentration or number of
molecules per volume is greater than that of its naturally occurring
counterpart.
As used herein, "diluted" refers to a molecule, including but not limited to a
polynucleotide, peptide, polypeptide, protein, antibody, or fragments thereof,
that is
distinguishable from its naturally occurring counterpart in that the
concentration or number of
molecules per volume is less than that of its naturally occurring counterpart.
As used herein, "mesenchymal stem cell" or "MSC" refers herein to a
multipotent cell
capable of differentiating into cells that compose adipose, bone, cartilage,
and muscle
tissue.
As used herein, "bioconnpatible" or "biocompatibility" refers to the ability
of a material
to be used by a patient without eliciting an adverse or otherwise
inappropriate host response
in the patient to the material or a derivative thereof, such as a metabolite,
as compared to
the host response in a normal or control patient.
As used herein, "biodegradable" refers to the ability of a material or
compound to be
decomposed by bacteria or other living organisms or organic processes.
9
CA 02949673 2016-11-18
WO 2015/179393
PCT/US2015/031571
As used herein, "stem cell" refers to any self-renewing totipotent,
pluripotent cell or
multipotent cell or progenitor cell or precursor cell that is capable of
differentiating into
multiple cell types.
Discussion
Only an estimated 9% of drugs that enter clinical development receive market
approval. Some of the reasons for the high failure rate of new drugs are a
poor
understanding of the biology behind human disease that leads to a lack of
clinical efficacy,
drug toxicity, and side effects. Potential anti-cancer drugs entering clinical
development have
about a 95% attrition rate despite the rising cost of new drug development
(about 800
million). The high attrition rate can be attributed to approaches used for
cancer drug
discovery, testing cancer cell response and drug development using two-
dimensional (2D)
cell culture assays and in vivo animal models.
cell culture systems have several disadvantages with regard to tumor biology,
including: (1) cells in the system exhibit unnatural morphology; (2) cells in
the system have a
15 lower
viability and poor differentiation capability; (3) cells in the system have
changes in
gene and protein expression profiles that differ substantially from the
profiles of the same
genes and proteins when expressed in vivo; (4) cells in the system exhibit an
artificial
metabolism; and (5) fail to accurately predict how well a new drug will
perform in a clinical
trial.
20 Three
dimensional cell culture systems and tumor models can overcome many of
the deficiencies of 20 systems. Generally, 3D systems can have improved
mimicry of in vivo
tumor microenvironments, including physiology, structure, concentration
gradients of
signaling molecules, and composition, structure, and mechanical forces of the
extracellular
matrix over 20 in vitro cell culture systems ad models. Although 30 in vitro
tumor model
systems have been described, current 30 in vitro tumor model systems are not
without
limitations.
The multicellular tumor spheroid (MTS) model is currently considered the best
validated 3D model system. The MTS model has been implemented using a variety
of
biological, natural, and synthetic substrates in the form of hydrogels, films,
or scaffolds.
Further, a number of different techniques, including liquid-overlay, spinner
flask, gyratory
rotation, and the hanging drop methods have been used to grow spheroids.
Despite
advancements, MTS models have yet to be widely adopted. Indeed, the median
level of
adoption of 30 cell culture was less than about 25% of all cell culture work.
Industry
demands models having biological relevance, wide applicability/versatility,
high throughput,
and scalability/automation at a low cost. Current 3D models, including current
MTS models,
do not meet these demands insofar as they require a long cultivation time,
form spheroids
with a wide size distribution, and difficult mechanical accessibility. Little
is understood about
CA 02949673 2016-11-18
WO 2015/179393
PCT/US2015/031571
the biological relevance of current MTS models in relation to their ability to
mimic solid
tumors or their interactions. Further, MTS models that use scaffolds that are
of animal or
human origin to overcome issues with biological relevance suffer from a risk
of disease
transmission and poor reproducibility, which severely limits their potential
for use in
determining clinical efficacy of candidate drug compounds.
Much effort has been expended in developing biomimetic scaffolds for 3D
culture.
The best-developed scaffolds currently are those constructed from polystyrene
or PCL,
which allow cells to grow on an artificial albeit biocompatible surface. One
major limitation of
these scaffolds is that a longer exposure to trypsin is required to pull the
spheroids out of the
scaffold during culture, which stresses the cells and make the results
obtained from any
experiment or efficacy test difficult at best to interpret. Fully synthetic
scaffolds such as the
RGD-modified PEG hydrogels can create artificial cell-cell or cell-matrix
interactions
rendering screening of drugs targeting tumor-stroma interactions difficult.
Non-scaffold based approaches, such as the hanging drop and magnetic nano-30
technologies, exist but are not without limitation. The hanging drop method
limits the growth
of spheroids to 500 pm in diameter because the cells in the center starve,
become unstable,
and die. Moreover, a hanging drop spheroid emerges from a single tumor cell
and thus its
biological relevance is questionable. The magnetic nano-3D system is very
expensive and
the spheroids generated this way also suffer from the same central necrosis as
those
.. produced via the hanging drop method. In both cases, the tumor
microenvironment observed
can be very different from the in vivo tumor microenvironment, where
heterogeneity exists in
the tumor cells and stromal cells.
.With the deficiencies of current models in mind said, described herein are
compositions, methods, and systems for 3D culture of a tumoroid model system
that can
facilitate drug efficacy testing in clinical and drug development settings.
The 3D culture
methods and systems described herein can Other compositions, compounds,
methods,
features, and advantages of the present disclosure will be or become apparent
to one having
ordinary skill in the art upon examination of the following drawings, detailed
description, and
examples. It is intended that all such additional compositions, compounds,
methods,
features, and advantages be included within this description, and be within
the scope of the
present disclosure.
Methods of Forming Multi-Cellular Tumoroids
Described herein are methods of forming multi-cellular tumoroids. The cell
population
of the tumoroids formed can be heterogeneous (i.e. include different cell
types). The
methods can result in large tumoroids (greater than about 500 pm in diameter)
that mimic
the in vivo tumor microenvironment. In some embodiments, the method can
include co-
culturing tumor cells (TCs), cancer associated fibroblast cells (CAFs), and
epithelial cells
11
(ECs) in a cell culture medium. In some embodiments, the co-culture also can
include
macrophages. In some embodiments, the cell co-culture only contains TCs, CAFs,
and ECs.
In other embodiments, the cell co-culture only contains TCs, CAFs, ECs, and
macrophages.
The cell culture can continue through one or more passages of cells until a
tumoroid of a
desired size is formed. The tumoroid formed can be about 1 to about 500 pm,
greater than
500 pm, or 500 pM to about 1,000 pM in diameter. In any given culture, the
tumoroid size
can be substantially uniform.
The cell culture medium can also contain an amount of a mesenchymal stem cell
(MSC) conditioned media. In some embodiments, the co-culture of cells are
cultured on a 3D
scaffold. The 3D scaffold can be a fibrous induced smart scaffold (FiSS). As
used herein the
term FiSS refers to the 3D fibrous scaffold (also referred to as a 3P
scaffold) described in
Girard et al. (2013) PlosONE 8(10) e75345.
Co-culture of cells
TCs, CAFs, ECs, and Macrophages can be co-cultured as described herein. In
some
embodiments, the ratio of TCs to CAFs to ECs can be about 5 to about 1 to
about 1. Stated
differently, the ratio total number of each of the TCs, CAFs, and ECs in the
culture can be
present at a ratio of about 5 to about 1 to about 1. The ratio of TCs to CAFs
to ECs to can
range from about 1 to about 10: about 1 to about 10: about 1 to about 10. The
ratio of TCs to
CAFs to ECs to macrophages can range from 5:1:1:1. The ratio of TCs to CAFs to
ECs to
macrophages can range from about 1 to about 10: about 1 to about 10: about 1
to about 10:
about 1 to about 10. The TCs, CAFs, ECs, and macrophages can be autologous,
heterologous, or combinations thereof.
TCs: The co-culture can include tumor cells. In some embodiments the tumor
cells
can include breast cancer cells. In other embodiments, the tumor cells can be
only breast
cancer cells. In some embodiments, the tumor cells can include lung cancer
cells. In other
embodiments, the tumor cells are only breast cancer cells. The TCs can be
derived from a
subject, such as via a biopsy of a tumor. In some embodiments, the biopsy is
used directly
as the source of TCs (i.e. by culturing the biopsy directly in the co-
culture). In other
embodiments, the biopsy can be cultured in vitro and TC progeny cells from the
in vitro
biopsy culture can be used as the source for the TCs. TCs can be standard cell
lines used
for clinical efficacy studies or other cell line that is commercially
available. The TCs can be
present at a ratio of TCs to macrophages of 1:1 to 10 to 1 to 1 to 10. The TCs
can be
present at a ratio of TCs to ECs of 1:1 to 10 to 1 to 1 to 10. The TCs can be
present at a
ratio of TCs to CAFs of 1:1 to 10 to 1 to 1 to 10.
CAFs: The co-culture can include CAFs. In vivo, CAFs actively participate in
the
growth and invasion of tumor cells by providing a unique tumor
microenvironment. CAFs can
12
Date Recue/Date Received 2021-09-17
CA 02949673 2016-11-18
WO 2015/179393
PCT/US2015/031571
stem from trans¨differentiation of resting resident fibroblasts or pericytes
within the tumor
microenvironment via mesenchymal mesenchymal transition. CAFs can be derived
from
bone marrow mesenchymal stem cells, from normal or transformed epithelial
cells via
epithelial to mesenchymal transition, and/or from endothelial cells via
endothelial to
mesenchymal muscle actin (SMA).
Tumor progression needs a positive and reciprocal feedback between CAFs and
tumor cells. Cancer cells can induce and maintain the fibroblasts active
phenotype, which in
turn, produce a series of growth factors and cytokines that sustain tumor
progression by
promoting extracellular matrix (ECM) remodeling, cell proliferation,
angiogenesis,
maintenance of stemness, regulating inflammation, regulating immune response,
promoting
a hospitable metabolic environment and epithelial-mesenchymal transition. Such
growth
factors can include hepatocyte growth factor (HGF), transforming growth factor
13 (TGF-13),
epidermal growth factor (EGF), stromal derived factor 1 (SDF-1), basic
fibroblast growth
factor (b-FGF), and vascular endothelial growth factor (VEGF). Indirectly,
CAFs can promote
and maintain tumor progression by secreting proteases and other molecules
involved in
proteolysis and degradation of the ECM, such as plasminogen activators and
matrix
metalloproteinases. This can result in the release of growth factors and
cytokines previously
discussed that can sustain tumor progression. CAFs can also have pleiotropic
functions on
immune cells. As previously discussed the variety of growth factors,
cytokines, and
chemokines secreted by CAFs can cause a strong inflammatory yet
immunosuppressive
environment.
The CAFs can be derived from a subject, such as via a biopsy of a tumor. In
some
embodiments, the biopsy is used directly as the source of CAFs. In other
embodiments, the
biopsy can be cultured in vitro and progeny CAFs from the in vitro biopsy
culture can be
used as the source for the CAFs. CAFs can be standard cell lines used for
clinical efficacy
studies or other CAF cell line that is commercially available. The CAFs can be
present at a
ratio of CAFs to macrophages of 1:1 to 10 to 1 to 1 to 10. The CAFs can be
present at a
ratio of CAFs to ECs of 1:1 to 10 to 1 to 1 to 10. The CAFs can be present at
a ratio of CAFs
to TCs of 1:1 to 10 to 1 to 1 to 10.
ECs: The co-culture can contain ECs. The ECs can be present at a ratio of ECs
to
macrophages of 1:1 to 10 to 1 to 1 to 10. The ECs can be present at a ratio of
ECs to CAFs
of 1:1 to 10 to 1 to 1 to 10. The ECs can be present at a ratio of ECs to TCs
of 1:1 to 10 to 1
to 1 to 10.
Macrophages: In some embodiments, the co-culture can also contain macrophages.
The macrophages can be present at a ratio of TCs to macrophages of 1:1 to 10
to 1 to 1 to
10. The macrophages can be present at a ratio of ECs to macrophages of 1:1 to
10 to 1 to 1
to 10. The macrophages can be present at a ratio of CAFs to macrophages of 1:1
to 10 to 1
13
to 1 to 10. Macrophages can promote tumorogenesis through inter alia promoting
angiogenesis. CAFs can regulate immune cell recruitment and function. CAFs
have been
demonstrated to induce macrophage recruitment the tumor microenvironment and
induce an
immunosuppresive phenotype in macrophages via SDF-1 through stimulated by
expression
and/or secretion of MCP/CCL2, IL1-81L-6, CXCL1, CXCL2, CXCL5, and CCL3.
3D-Culture Scaffold: The aforementioned cells can be co-cultured on a 3D
scaffold
for an amount of time. The 3D scaffold can be fibrous induced smart scaffold
(FiSS). As
used herein the term FiSS refers to the 3D fibrous scaffold (also referred to
as a 3P scaffold)
described in Girard et al. (2013) PlosONE 8(10) e75345.
The scaffold can be fabricated by any suitable technique or method. Such
techniques
and methods include, without limitation, electro spinning, solvent
casting/salt leaching, ice
particle leaching, gas foaming/salt leaching, solvent evaporation, freeze
drying, thermally
induced phase separation, micromolding, photolithography, microfluidics,
emulsification,
decellularization processes, self-assemblies, microfiber wet spinning, melt-
blown processing,
sponge replication methods, simple calcium phosphate coting methods, inkjet
printing, melt-
based rapid prototyping processing or a combination thereof. One of skill in
the art will
appreciate that the technique(s) or method(s) used for scaffold fabrication
will vary
depending on, inter alia, the components present in the scaffold.
Scaffold materials can be synthetic, biologic, or combinations thereof. The
scaffold
materials can be degradable or nondegradable. The scaffold materials can be
biocompatible. Synthetic scaffold materials can include, without limitation,
PLA, PLG, PLGA,
and PHA, PLLA, PGA, PCL, PDLLA, PEE based on PEO, and PBT.
Cell Culture Media: The co-culture of cells are cultured in a culture media.
The
culture medium can be altered over the time course of tumoroid formation. For
example, the
cell culture media can be replaced (such as when passing the cells) or
supplemented during
culturing. The replacement media can be the same formulation or have a
different
formulation that the prior media. Other media components can be supplemented
to the
media during culturing, which can result in a change in the media formulation.
The cell culture media can be a suitable standard base medium that can
optionally
.. be supplemented with, without limitation, growth factors, nutrients (e.g.
nitrogen, glucose,
amino acids), anti-fungals, antibiotics, ions, serum, and/or combinations
thereof. Suitable
base mediums include without limitation, DMEM, DME, RMPI-1640, and MEM. Others
will
be appreciated by those in the art.
In some embodiments, the culture media is supplemented with about 5 to about
.. 10% Matrigel. The cell culture media can be supplemented with VEGF, IL6,
TGF-81, or
combinations thereof. In some embodiments, the amount of VEGF can be at least
800
14
Date Recue/Date Received 2021-09-17
CA 02919673 2016-11-18
WO 2015/179393
PCT/US2015/031571
pg/mL, can range from about Ito about 1200 pg/mL, about 100 pg/mL to about
1200 pg/mL,
or about 800 pg/mL to about 1200 pg/mL. In some embodiments, the amount of IL6
can be
at least 100 pg/mL, can range from about 1 to about 500 pg/mL, about 100 pg/mL
to about
500 pg/mL, or about 200 pg/mL to about 500 pg/mL. In some embodiments, the
amount of
TGF-61 can be at least 1200 pg/mL and can range from about 1 to about 1800
pg/mL, about
900 pg/mL to about 1800 pg/mL, or about 1200 pg/mL to about 1800 pg/mL.
In some embodiments, the cell culture media is made of a growth media
configured
to promote growth of the tumoroid and a conditioned media. Formulations for
the growth
media will be appreciated by those of skill in the art. The conditioned media
can be present
at a concentration of about 1% to about 99% of the total culture media. In
some
embodiments the conditioned media is at least 20% of the total culture media.
In further
embodiments, the conditioned media can be about 20% to about 50% of the total
cell culture
media.
The conditioned media can be a human mesenchymal stem cell (MSC) conditioned
media. MSC conditioned media can be obtained by culturing human MSC cells for
one or
more passages and collecting the media that the MSC cells were cultured in. In
some
embodiments, the MSC condition media is obtained from cell culture media
collected at
passaged 5 and/or passage 6. The MSC conditioned media can contain molecules
and other
compounds secreted by the MSC cells. In some embodiments the MSC media can
contain
VEGF, IL6, TGF-61, or combinations thereof. In some embodiments, the amount of
VEGF in
the MSC conditioned media can be at least 800 pg/mL, can range from about 1 to
about
1200 pg/mL, about 100 pg/mL to about 1200 pg/mL, or about 800 pg/mL to about
1200
pg/mL. In some embodiments, the amount of IL6 in the MSC conditioned media can
be at
least 100 pg/mL, can range from about 1 to about 500 pg/mL, about 100 pg/mL to
about 500
pg/mL, or about 200 pg/mL to about 500 pg/mL. In some embodiments, the amount
of TGF-
61 in the MSC conditioned media can be at least 1200 pg/mL and can range from
about 1 to
about 1800 pg/mL, about 900 pg/mL to about 1800 pg/mL, or about 1200 pg/mL to
about
1800 pg/mL.
Methods of Using Multi-Cellular Tumoroids
The tumoroids formed as described herein can be used to determine the efficacy
and/or effect of a compound or composition, such as a drug, including anti-
cancer drugs or
pharmaceuticals. As such, the methods and tumoroids described herein can be
useful as
model systems for clinical trials and drug discovery. In embodiments where the
tumoroid is
formed from a subjects own tumor, the efficacy of a particular treatment
regimen can be
examined. In some embodiments, the tumoroids and culture methods described
herein can
be used to expand the in vitro population of cancer stem cells.
The methods of determining the efficacy and/or effect of a compound or
composition,
such as an anti-cancer drug, can include the step of forming a multicellular
tumoroid, where
the step of forming the tumoroid as described anywhere herein, and exposing
the
multicellular tumoroid to an amount of a compound or composition, such as an
anti-cancer
drug. The step of forming the tumoroid can include the step of co-culturing
TCs, ECS, and
CAFs in a cell culture media, where the ratio of the number of TCs to CAFs to
ECs is 5 to 1
to 1, and where the cell culture media contains an amount of a mesenchymal
stem cell
conditioned media. The cell co-culture can also optionally contain
macrophages. In some
embodiments, the cell co-culture only contains TCs, CAFs, and ECs. In other
embodiments,
the cell co-culture only contains TCs, CAFs, ECs, and macrophages.
The method of determining the efficacy and/or effect of a compound or
composition,
such as an anti-cancer drug, can optionally include the step of measuring the
amount of
expression or presence of a biomarker indicative of tumor growth or sternness
and
comparing the expression or presence to that of a suitable control. A changed
in the amount
(either increased or decreased amount) of expression or presence of the
biomarker in the
sample tested can indicate efficacy or inefficacy of the compound or
composition against the
cancer. The biomarker can be measured in the tumoroid itself or in the culture
media that the
tumoroid is present in. In some embodiments, the method further includes the
step of
measuring the expression of Ki-67 in the tumoroid and comparing the expression
to a
suitable control. A decrease in the expression and/or presence of Ki-67 as
compared to the
control can indicate that the test compound or composition is effective
against the caner. In
other embodiments, the method can further include the step of measuring the
amount of
VEGF and/or IL-6 present in the culture and comparing the expression or
presence to a
suitable control. A decrease in the expression and/or presence of VEGF and/or
IL-6 as
compared to the control can indicate that the test compound or composition is
effective
against the caner.
The following embodiments are provided:
Embodiment 1. A
method of forming multi-cellular tumoroids, the method
comprising:
co-culturing tumor cells (TCs), cancer associated fibroblast cells (CAFs), and
epithelial cells (ECs) in a cell culture media on a three-dimensional
scaffold, where the ratio
of the number of TCs to CAFs to ECs is 5 to 1 to 1, and where the cell culture
media
comprises at least 20% of a mesenchymal stem cell conditioned media.
Embodiment 2. The method of
embodiment 1, where the tumor cells are breast
cancer cells.
16
Date Recue/Date Received 2021-09-17
Embodiment 3. The
method of embodiment 2, wherein the breast cancer cells
are derived from a subject's tumor.
Embodiment 4. The method of
any one of embodiments 1-3, wherein the
mesenchymal stem cell conditioned media is present at least at 20% to 50% of
the total
amount of the cell culture media.
Embodiment 5. The
method of any one of embodiments 1-4, wherein the
mesenchymal stem cell conditioned media contains at least 800 pg/mL VEGF.
Embodiment 6. The
method of any one of embodiments 1-5, wherein the
mesenchymal stem cell conditioned media contains at least 100 pg/mL IL-6.
Embodiment 7. The method of
any one of embodiments 1-6, wherein the
mesenchymal stem cell conditioned media contains at least 1200 pg/mL TGF-81.
Embodiment 8. The
method of any one of embodiments 1-7, wherein the cell
culture media further comprises 5% to 10% Matrigel.
Embodiment 9. The
method of any one of embodiments 1-8, wherein the
three-dimensional scaffold is a fibrous scaffold comprising randomly
orientated fibers.
Embodiment 10. A
method of determining the efficacy of an anti-cancer drug
comprising:
forming a multicellular tumoroid, where forming the multicellular tumoroid
comprises:
co-culturing tumor cells (TCs), cancer associated fibroblast cells
(CAFs), and epithelial cells (ECs) in a cell culture media on a three-
dimensional
scaffold, where the ratio of the number of TCs to CAFs to ECs is 5 to 1 to
1, and
where the cell culture media comprises at least 20% of a mesenchymal stem cell
conditioned media; and
exposing the multicellular tumoroid to an amount of the anti-cancer drug; and
measuring the amount of expression or presence of a biomarker indicative of
tumor growth
or stemness and comparing the expression or presence to that of a suitable
control to
determine the efficacy of the anti-cancer drug.
16a
Date Recue/Date Received 2021-09-17
Embodiment 11. The
method of embodiment 10, where the tumor cells are
breast cancer cells.
Embodiment 12. The method of
embodiment 11, where the breast cancer cells
are derived from a subject's tumor.
Embodiment 13. The
method of embodiment 11, where the breast cancer cells
are derived from a breast cancer cell line.
Embodiment 14. The
method of any one of embodiments 10-13, wherein the
mesenchymal stem cell conditioned media is present at least at 20% to 50% of
the total
amount of the cell culture media.
Embodiment 15. The method of
embodiment 10, wherein the mesenchymal
stem cell conditioned media contains at least 800 pg/mL VEGF, at least 100
pg/mL IL-6, and
at least 1200 pg/mL TGF-61.
Embodiment 16. The
method of any one of embodiments 10-15, further
comprising the step of measuring the expression of Ki-67 in the multicellular
tumoroid after
exposure to the amount of the anti-cancer drug.
Embodiment 17. The
method of any one of embodiments 10-16, further
comprising the step of measuring the amount of VEGF or IL-6 present in the
culture media
after exposure to the amount of the anti-cancer drug.
EXAMPLES
Now having described the embodiments of the present disclosure, in general,
the
following Examples describe some additional embodiments of the present
disclosure. While
embodiments of the present disclosure are described in connection with the
following
examples and the corresponding text and figures, there is no intent to limit
embodiments of
the present disclosure to this description. On the contrary, the intent is to
cover all
alternatives, modifications, and equivalents included within the spirit and
scope of
embodiments of the present disclosure.
16b
Date Recue/Date Received 2021-09-17
CA 02949673 2016-11-18
WO 2015/179393
PCT/US2015/031571
Example 1: Optimizing tumoroid assay (Z factor analysis).
A major stumbling block in 3D cell cultures has been reproducibility, which is
important for its incorporation into high-throughput system screening. To
determine well-to-
well variation in the tumoroid assay, MCF-7 cells on FiSS in different
concentrations in n=8
wells/group and measured the tumorigenicity five days after seeding by a
PrestoBlue0
assay. Z factor, a measure of statistical effect size, was determined using
Equation 1.
Z-fartar
114,¨ 14,1
Equation 1
The assay results showed a small well-to-well variation with the Z factor
being about
0.755, which was in the excellent range suggesting the readiness of the
tumoroid assay
described herein for high-throughput screening.
Example 2: Characterization of tumoroid co-cultures.
BT474 or H001569 cells were co-cultured with ECs and CAFs. The ratio of tumor
cells (BT474 or H001569) to ECs to CAFs in the co-culture was 5:1:1
(tumorcells:ECs:CAFs). As demonstrated in Figs. 2A-5B, co-culture with ECs and
CAFs
induced robust tumoroids that had increased growth potential and high VEGF
expression
(Fig. 3). Figs. 1A-1B show representative fluorescent microscopic images
demonstrating
growth of BT474 breast cancer cell derived tumoroids after about 5 days of
culturing with
(Fig. 1B) or without (Fig. 1A) cancer associated fibroblasts (CAFs) and
endothelial cells
(ECs).
The presence of CAFs and ECs in the multi-cell tumoroids was confirmed by IHC
using anti-smooth muscle actin (SMA) and anti- von Wille brand factor (vWF)
antibodies for
CAFs and ECs, respectively followed by confocal microscopy. Fig. 2 shows a
confocal
microscope image (merged z-stacked images) of B1474 breast cancer co-cultured
tumoroids showing EVs (vWF, green cells) and CAFs (SMA positive, red cells)
and nuclei
(DAPI, blue). The merged z-stacked image of tumoroid immunostained form CAFs
(red, anti-
SMA positive) and ECs( green, anti-vWF-positive) is shown in Fig. 2. CAFs were
found
dispersed throughout the tumoroid whereas ECs were found mostly on the edge of
the multi-
cell tumoroid at day 5 after co-culture.
Fig. 3 shows a graph demonstrating the amount of VEGF in the supernatant of
the
cultured cells of Figs. 1A-1B and 2 as measured by ELISA. Cells were cultured
for 5 days
prior to determining the amount of VEGF produced by the cultured cells. A
comparison of
VGEF levels in the supernatant of tumoroids showed that the B1474-tumoroids
had less
17
CA 02949673 2016-11-18
WO 2015/179393
PCT/US2015/031571
VGEF compared to BT474+CAF + EC induced tumoroids (Fig. 3). As demonstrated in
Figs.
4A-4B, the co-culture using H015969 also produced a similar increase in number
and
diameter of tumoroids as seen with 8T474.
Example 3: Delivery and Control of Growth Factors
To investigate growth factors that can enhance tumoroid growth in the co-
cultures
described herein, the effects of increasing serum concentrations on tumoroid
growth during
culturing. Results (not shown) suggest that increasing the serum concentration
does not
significantly affect tumoroid growth. Adding Matrigel (about 5% to about 10%)
to the growth
media increased tumoroid development of H001569 cells when cultured on FiSS.
This
suggests that supplementation of growth medium (GM) with about 5% to about 10%
Matrigel
can enhance tumoroid growth from other types of breast cancer cells.
To test the factors that affect tumoroid growth, the effect of hMSC CM on
tumoroid
growth was examined. Therefore, growth factors released by hMSCs was examined.
To this
end, CM of hMSCs of different passages, such as passage 2, 3, 5 and 6, were
collected and
the levels of VEGF, IL-6, and TGF-13. Figs. 5A-5C show graphs demonstrating
VEGF (Fig.
5A), IL-6 (Fig. 5B), and active TGF-I31 (Fig. 5C) present in human mesenchymal
stem cell
(hMSC) conditioned medium (CM). Human MSCs were cultured in alpha-MEM and 15%
serum. Conditioned medium of passages (p) p2-p6 was collected about 48h after
each
passage. Collected conditioned medium was centrifuged, filtered, and stored
until use.
Expression of the growth factors in the CM of p2-p6 was examined by ELISA.
Neutralizing
VEGF antibody was used to demonstrate specificity of VEGF. * p <0.05. The data
shown in
Figs. 5A-50 demonstrate significantly higher levels (about 1 ng/rriL) of VEGF
(Fig. 5A) and
IL-6 (about 250-450 pg/mL) (Fig. 5B) were found in the CM of hMSCs-p5 and ¨p6
compared
to ¨p2 and ¨p3. While present in CM, no significant difference in the levels
of TGF-131 was
observed among CM of hMSC passages (Fig. 5C).
BT474 tumoroids were cultured from BT474 cells in the presence of varying
concentrations of CM derived from hMSCs. Insofar as p5-hMSC CM showed greatest
production of VEGF, IL-6, and TGF-131, BT474 GM was supplemented with varying
concentrations of p5-hMSC CM and cultured with BT474 cells only (monoculture)
or in the
presence of CAFs and ECs (co-culture) and tumoroid growth was examined. Figs.
6A-6H
demonstrate representative fluorescent microscope images of monoculture (Figs.
6A-6D) of
BT474 breast cancer cells or co-culture (Figs. 6E-6H) of BT474 breast cancer
cells and ECs
+ CAFs stained by Calcein-AM/EthD-1 to detect live (green) and dead (red)
cells.
Magnification: 100X. The ratio of standard growth medium (GM) to CM (GM:CM)
ranged
from about 100:0 to about 50:50. The data shown in Figs. 6A-7, demonstrate
that the
addition of CM at about 20, about 40, or about 50% increased the tumoroid
diameter in both
18
CA 02949673 2016-11-18
WO 2015/179393
PCT/US2015/031571
monocultures and co-cultures. Addition of GM:CM at about 50% significantly
increased
tumoroid diameter for both tumoroids produced under monoculture culture and co-
culture
tumoroids.
Example 4: Biomarkers for Determination of Clinical Efficacy
K167 as a clinical biomarker of tumoroids. Clinical studies utilizes Ki67 as a
marker
for clinical efficacy. To determine whether Ki67 is expressed in tumoroids,
BT474 cells (104)
were cultured for 5 days on FiSS. Tumoroids formed were fixed and
immunostained using
anti-Ki67 antibodies. Figs. 8A to 8B demonstrate BT474 tumoroid cultures
stained with
calcein-AM/EthD-1 that stains live cells green and dead cells red (Fig. 8A)
and Ki-67 staining
for a monoculture of B1474 on a 3-D scaffold (Fig. 8B).
VEGF and 11_6 as biomarkers of tumoroids. The monoculture tumoroids and co-
culture tumoroids produced significant amounts of VEGF and IL-6 released to
the culture
medium. The co-cultures had a 2-fold increase in the amount of VGEF and IL-6
released to
the culture medium. The increase in the levels of VGEF and IL-6 produced in co-
cultures
suggest that these growth factors may be involved in coin the increase
proliferation of cells
and growth of tumoroids observed in co-cultures. Therefore, the data suggests
that these
two proteins can serve as biomarkers of clinical efficacy.
Example 5: Prediction of Clinical Efficacy with Tumoroids using herceptin and
lapatinib.
The sensitivity of tumoroids derived from monocultre or co-culture of BT474
and
HCC1569 to Lapatinib was examined. Lapatinib is a dual small molecule tyrosine
kinase
inhibitor targeting EGFR and HER2. As demonstrated in the data presented in
Figs. 9A-9B,
tumoroids had varying responsiveness to Lapatinib treatment. BT474 cells were
observed to
be sensitive to Lapatinib when cultured both on 2D or FiSS (IC50 < 2.5pM), but
in the
presence of ECs and CAFs, MT474-MCTs were observed to have significantly
higher
resistance to Laptinib (IC50 > 10 pM). HCC1569 also showed an increase in
resistance to
Lapatinib when cultured in the presence of ECs and CAFs. Similar results were
obtained
when established tumoroids were treated with Lapatinib.
Example 6: Biomarkers of Clinical Efficacy
Ki-67 can be used as a surrogate marker of clinical efficacy in cancer trials.
Expression of Ki-67. Monoculture and Co-culture tumoroids were treated with
increasing
concentrations of Lapatinib (0-10 pM). Tumoroids were fixed and immunostained
for Ki-667.
It was tested whether treatment with Lapatinib (2.5 mM) would affect
expression of Ki-67.
Results demonstrate that Lapatinib treatment not only inhibited tumoroid
formation, but also
19
CA 02949673 2016-11-18
WO 2015/179393
PCT/US2015/031571
completely abrogated Ki-67 staining, which suggested complete inhibition of
the proliferation
of tumor cells (Figs. 10A and 10B).
To identify and evaluate the biomarkers of clinical efficacy, both monoculture
and co-
culture tumoroids were treated with increasing concentrations of Lapatinib
(about 0 to about
10 pM). Five days after culture, the supernatants of the culture were tested
for levels of
VEGF, IL-6, and TGF-[3. Figs. 11A-11C show graphs demonstrating the effect of
Lapatinib
on VEGF (Fig. 11A), IL-6 (Fig. 11B), and TGF-131 (Fig. 11C) on BT474 tumoroids
derived
from monocultures or co-culturing BT474 cells with CAFs and ECs on a 3-D
scaffold. B1474
tumoroids were mono-cultured or co-cultured in the presence or absence of
Lapatinib (2.5-
10pM) and the levels of VEGF, IL-6, and TGF-131 in the day 5 culture
supernatants were
determined by ELISA. * p <0.05. The data demonstrate that both monoculture and
co-culture
tumoroids secreted substantial amounts of VEGF, IL-6, and TGF-I3. Lapatinib
treatment
(about 2.5 pM- 5 pM) significantly decreased the secretion of VEGF, IL-6, and
TGF-13 in the
co-cultured tumoroids. The data demonstrates that in addition to Ki67, these
factors can
serve as biomarkers of clinical efficacy of anti-cancer drugs in co-cultured
tumoroids.
Example 7: Co-Culture of Breast Cancer Tumor Cells with Stromal Cells and
Assessment of TS!
Establishment of tumoroid cultures: Conditions were optimized for tumoroid
development. All breast tumor cell lines, MCF7, BT-474 and MDA-MB-231 but
HCC1569
form tumoroids with seeding density, 3,000 to 10,000 cells/per 96 well, which
is referred to
herein as single cell tumoroids (SCTs). This latter cell line was observed to
be loosely
adherent and had about 50% of cells remain as floaters when cultured on a
monolayer.
While optimizing tumoroid formation with this cell line, it was unexpectedly
observed that
HCC-1569 cells readily develop tumoroids in the same frequency as the other
cell lines
when the culture media is supplemented with 10% matrigel. Figs. 12A-12D show
that all 4
cells lines developed SCTs readily at day 5. Tumoroids growth was monitored
for up to day
9 and the size of SCTs at day 5 and day 9 was measured (Fig. 13). Tumoroids of
each cell
type grew in size by 3-20% differentially.
Example 8: Establishment and Characterization of Tumoroid Co-Culture
To examine whether co-culture of breast cancer cells with stromal cells, such
as
CAFs and ECs will form multi-cell tumoroids (MCTs) that can mimic in vivo
tumors, co-
culture studies were performed. Co-culture of day 5 MCF-7 tumoroids with
either ECs or
CAFs induced discernable MCTs 3-5 days after co-culture (Figs. 14A-14D) but
net growth of
cells reduced (Fig. 15). However, co-culture of MCF-7 cells with both ECs and
CAFs not only
significantly increased tumoroid size and numbers (Figs. 14A-14D), but also
restored cell
CA 02949673 2016-11-18
WO 2015/179393
PCT/US2015/031571
growth (Fig. 15). Similarly, HCC-1569 cell line showed significant increase in
tumoroid size
and numbers when co-cultured with CAFs and ECs simultaneously (Figs. 14A-14D).
Co-
culture conditions were optimized and it was observed that co-culturing tumor
cells (3-5 X
103) with ECs (103) and CAFs (103) induced robust MCTs with slightly increased
growth
.. potential (Figs. 16A-16F). Presence of CAFs and ECs in the MCTs was
confirmed by IHC
using anti-smooth muscle actin (SMA) and anti- von Wille brand factor (vWF)
antibodies that
are specific for CAFs and ECs, respectively followed by confocal microscopy. A
representative fluorescent image and merged z-stacked image of MCTs
immunostained for
CAFs (red, anti- SMA positive) and ECs (green, anti-vWF-positive) was
observed. CAFs
.. were found dispersed throughout the tumoroid whereas ECs were found mostly
on the edge
of the MCI at day 5 after co-culture (Figs. 17A-17F). In another set of
experiments, co-
culture of MDA-MB-231 and ECs also showed tumoroid development, but reduced
net cell
growth. Together, these results show that co cultures of tumoroids with
stromal cells
increase significantly tumoroid development.
Example 9: Comparison of FiSS Culture with Matrigel-based 3D culture
To compare the performance of FiSS tumoroids with other 3D-based culture
platforms,
spheroid formation in two breast cancer cell lines, MCF7 and BT474 using
growth factor
reduced matrigel was assessed. For comparison, same number of cells were
plated on FiSS
and examined. Cells were cultured for 5 days and spheroids were stained with
calcein AM
and examined by fluorescent microscope. Results presented in Figs. 18A-18D
show that in
MCF7 (Figs. 18A-18B), matrigel culture induced similar number and size of
spheroids as in
FiSS, whereas in BT474 (Figs. 180-18D), matrigel culture formed more
disorganized
colonies than in FiSS. However, In addition, few colonies in matrigel culture
were found to
have embedded inside matrigel.
Example 10: Evaluation of Cell-Cell or Cell-ECM Adhesion in Tumoroids
Towards characterizing biomarkers in SCTs and MCTs culture, factors that are
secreted in the culture supernatants of tumoroids were examined. A comparison
of VGEF
.. levels in the supernatant of tumoroids showed that the MCF7-SCTs had less
VGEF
compared to MCF7-MCTs (Fig. 19). Moreover, as shown in Figs. 11A-11C, both the
BT474-
SCTs and -MCTs produced significant amounts of VEGF and IL-6. Interestingly,
the co-
cultures showed a 2 fold increases in the amounts of VGEF and IL-6 released to
the culture
medium. This increase in the levels of VGEF and IL-6 produced in co-cultures
suggest that
they may be critical to increased proliferation of cells and growth of
tumoroids seen in co-
cultures and therefore these two proteins may serve as markers of clinical
efficacy.
21
CA 02949673 2016-11-18
WO 2015/179393
PCT/US2015/031571
Additionally, to characterize factors and molecules released in SCTs and MCTs
culture, a human Quantibody Array (RayBiotech Inc.), which utilizes a
multiplexed sandwich
ELISA assay and enables detection of multiple proteins/factors simultaneously,
was used.
Fig. 20 shows a can data showing signal intensity of Array 1 and 2; panels 1-
8. A human
bone metabolism array containing several factors listed in Table 2 of Fig. 21
was chosen.
This list includes adhesion molecules (E-selectin, ICAM-1, P-Cadherin, VE-
cadherin),\growth
factors (aFGF, activin A, androgen receptor (AR), bFGF, bone morphogenic
protein (BMP)-
2, BMP-4, BMP-6, BMP-7, BMP-9, dickkopf-1 (DKK-1), IGF-1, osteoprotegerin
(OPG),
osteopontin (OPN), PDGF-BB, TGF81, TGF82, TGF83), chemokines (monocyte
chemotactic protein 1 (MCP-1)), macrophage inflammatory protein (MIP)-1a, VCAM-
1),
cytokines (IL-la, IL-13, IL-6, IL-8, IL-11, IL-17, M-CSF), receptor activator
of NFkB (RANK),
osteoactivin, SDF-1 a, TNF related activation induced cytokine (TRANCE)) and
matrix
metalloproteinases (MMPs), such as MMP-2, -3, -9, -13.
To determine whether any of these factors are expressed in SCTs and MCTs, we
incubated QAH-BMA-1000 array with a pool of culture supernatants of BT474-SCTs
and
MCTs in quadruplets. Experiments were conducted using manufacturer's protocol.
An
appropriate positive control was used to normalize the signal intensity.
Results of the raw
data are shown in Fig. 20. Analysis of this data showed that seven of forty-
one factors were
found significantly altered in MCTs compared to SCTs. These include, growth
factors, such
as PDGF-BB, OPG and DKK-1, chemokine such as MCP-1, IL-6 and IL-8, and
protease
MMP-3 (see e.g. Figs. 23A-25.)
Example 11: Determining Growth Factors in Lapatinib Treated Tumoroids Using
ELISA
To further validate these results, culture supernatants of SCTs and MCTs using
quantibody Array, as described in Figs. 20-21, were examined. Lapatinib
treated cultures
were examined for factors that are found differentially expressed in MCTs,
compared to
SCTs. Figs 22A-24 show graphs demonstrating the results. Results showed that
culture
supernatants of MCTs showed > 7 fold increase in IL-6 and IL-8, which were
reduced to
basal level upon Lapatinib treatment in a dose dependent manner (Figs. 22A-
22B). In
contrast, monocyte chemoattractant protein (MCP-1) expression remained
unchanged in
MCTs; however, Lapatinib treatment abolished MCP-1 expression completely in
SCTs, but
moderately (at best 50% in the presence of 12.5 uM Lapatinib) in MCTs,
suggesting that
resistance to Lapatinib in MCTs could be due to sustained MCP-1 (Fig. 22C).
Among growth factors, PDGF-BB (Fig. 23A) was found expressed in both SCTs and
MCTs, but Lapatinib treatment did not alter its expression in any tumoroids.
In contrast,
expression DKK-1 (Fig. 23B), a Wnt signaling inhibitor, and OPG (Fig. 230), a
negative
22
CA 02949673 2016-11-18
WO 2015/179393
PCT/US2015/031571
regulator of bone remodeling were found only expressed in MCTs but not in
SCTs. Only
expression of DKK-1 reduced significantly by Lapatinib treatment (Fig. 23B).
It was also
found that expression of MMP-3 but not other MMPs was found increased >20 fold
in MCTs
compared to SCTs and Lapatinib treatment reduced only marginally (Fig. 24).
Fig. 25 shows
a table that describes clinical relevance of these markers found in MCTs in
patients with
breast cancer.
Example 12: Comparison of 3D FiSS with Matrigel for Predicting Drug Response
To benchmark FiSS-tumoroids against Matrigel-based 3D-culture for prediction
of
clinical efficacy, 3d old BT-474 SCTs (cultured on Matrigel or FiSS) were
treated with
Lapatinib and examined tumoroid formation (Figs. 26A-26D) and cell viability
(Figs. 27A-
27B). Although Matrigel induced numerous smaller size tumoroids compared to
FiSS
tumoroids, their response to Lapatinib was similar as shown in Figs. 27A-27B.
Example 13: Determination of the Feasibility of the FiSS Platform for Use with
High-
Content Screening of Samples.
Automated Imaging and Quantification of Tumoroid Cultures
High-content analysis (HCA) is an automated platform for performing
fluorescence
microscopy and quantitative image analysis, which has been used to analyze
cells that had
been fixed and stained in a microtiter plate and can quantify (by software) a
number of
cellular changes, including the phosphorylation, translocation, abundance of a
protein on a
per cell basis and cytological changes. Data acquisition of FiSS tumoroids in
Operetta
(Perkin Elmer) to perform HCA analysis was initiated.
To optimize quantification of high content imaging for B1474 tumoroids were
incubated for 72 h and then imaged on the Operetta NCI System with a 20x
objective. Single
plane z-stacked images of BT474 tumoroids on scaffolds were stained with DAPI
and
images were acquired using the Operetta high content imaging system from
Perkin Elmer.
Representative fields were selected at 20X magnification and z-stacks of these
fields were
acquired with an interval of 2um between each z-plane. Z-stacks were analyzed
using the
image processing software ImageJ (NIH). The results are shown in Figs. 28A-
28D, which
demonstrate that image J analysis can be used to quantify z stacked image data
of
tumoroids acquired using Operetta (Perkin Elmer). Using HCA we have quantified
changes
in Ki-67 expression in BT474 tumoroids treated with different concentrations
of Lapatinib.
Results show dose-dependent Ki-67 expression in Lapatinib treated BT474
tumoroid
cultures (Fig. 29).
23
CA 02949673 2016-11-18
WO 2015/179393
PCT/US2015/031571
Optimizing a tumoroid assay: (Z factor analysis)
A major stumbling block in 3D cell cultures has been reproducibility, which is
important for its incorporation into high-throughput system screening (HTS).
In previous
studies, the feasibility of PrestoBlue assay was demonstrated, which allows
real-time
monitoring of cell metabolism and viability through conversion of resazurin
(blue) to resorufin
(highly fluorescent red). Conversion is proportional to the number of
metabolically active
cells and therefore can be measured quantitatively. To demonstrate the
precision of the
PrestoBlue assay (Life Technologies, NY) for LLC1 tumoroids, LLC1 cells were
cultured in a
96 well plate preloaded with FiSS. To account for background fluorescence,
some wells
contained FiSS and media only, without LLC1 tumoroids. After 72 hours, the
PrestoBlue
assay was performed. The Z'-factor was calculated to evaluate the suitability
of the assay for
screening applications, which was calculated at 0.63 and 0.72, and considered
excellent for
HTS readiness (Figs. 30A-30B). The results demonstrate that in a 96 well
plate, the
PrestoBlue assay shows minimal well-to-well variation in the tumoroid culture
with standard
deviation (SD) in replicate experiments found to be within 12% and 10%.
Since viability assays require multiple hour incubation, HTS prefers the ATP-
based
assay, e.g. CellTiter- Glo (Promega, MD) where the addition of assay reagent
immediately
ruptures the cells, thereby removing the requirement of incubation of reagent
with a viable
cell population. To discriminate whether cell proliferation inhibition is due
to cytotoxicity or
cytostatic effects of the added compounds, cell death relevant parameters of
dead cells are
measured, e.g. changes in membrane integrity (binding of dye to DNA), caspase-
3/7 activity
(late stage apoptosis), protease activity. To test the feasibility of ATP
based assays for 30
tumoroid cultures, the potential of CellTiter-Glo 2.0, a luminescent viability
assay that uses
the luciferase reaction to measure ATP, a global indicator of cellular
metabolism, was
examined. Luciferase, in the presence of Mg2+ and ATP, converts luciferin into
oryluciferin
and concomitantly releases energy in the form of luminescence. Signal strength
is
directly proportional to the amount of ATP present, which correlates with the
metabolic
activity. This assay can be ideal for HTS, since data can be recorded as soon
as 10
minutes after adding reagent, and the luminescent signal is very stable (half-
life > 5
hours). In a pilot study, we evaluated whether CellTiter- Glo reagent can
penetrate
tumoroids. Addition of CellTox Green (2X) to media of day 5 BT474-SCTs
followed by
incubation with luciferin reagent for 10 and 20 min showed that CellTiter-Glo
reagent
penetrated SCTs (dia: 180 uM) within 20 min of tumoroid lysis (Fig. 31).
A CellTiter-Glo assay was used to evaluate the potential of six compounds in
inhibiting proliferation of tumoroids derived from BT474 breast cancer cell
line. Results
24
CA 02949673 2016-11-18
WO 2015/179393
PCT/US2015/031571
from this pilot study showed, for example, D4 compound to inhibit (>70%) BT474
proliferation at 1:1000 but not at 1:10,000 dose (Fig. 32).
Automation for large volume production of FiSS
In an effort to increase quality of large-scale production of scaffolds, an
adapted
Spraybase system was used, which is the world's first integrated instrument
that enables
electrospinning technology and is compatible with a diverse range of polymers,
chemicals and biologics. Spraybase provides ease of use, safety, flexibility
and
scalability required for FiSS technology. It can be used to form fibers of
varying size
depending on our need. Spraybase combined with roller drum provides the best
approach to produce large volume of FiSS mats for tumoroid technology. Efforts
have
also been expended to develop further automation of this process that can
produce both
96 and 384 microwell FiSS plates for high throughput screening of anti-cancer
drugs and
high content imaging. The potential of a fabricated 96 well FiSS microplate
was used to
examine tumoroid formation and the Z'-factor was calculated. The Z-factor was
used to
evaluate the suitability of the plate for screening applications. Results
showed that MCF7
and BT474 cells cultured on the fabricated 96-well microplate formed tumoroids
with Z'-
factor, 0.87 and 0.846, and Z-factor, 0.812 and 0.501, respectively. These
results
demonstrate that FiSS- fabricated 96 well microplate fabricated shows minimal
well-to-
well variation in the tumoroid culture and thus was considered excellent for
HTS of
anticancer drugs (Figs. 33A-33B).