Note: Descriptions are shown in the official language in which they were submitted.
CA 02949991 2016-11-28
DISPLAYING MULTIPLE-ACTIVATION AREAS ON AN ELECTROANATOMICAL
MAP
FIELD OF THE INVENTION
The present invention relates to the field of
electroanatomical mapping, specifically of the heart.
BACKGROUND
A "local activation time" of a particular area of the
heart is the time at which the wavefront of electrical
propagation passes through the area. A
local activation
time is typically measured from a particular reference time,
such as a particular point in time in the QRS complex of a
body-surface electrocardiogram (ECG) recording.
Nakagawa et al., "Rapid High
Resolution
Electroanatomical Mapping," Circulation: Arrhythmia and
Electrophysiology, 2012; volume 5, issue 2, pages 417-424,
which is incorporated herein by reference, describe a canine
right atrial (RA) linear lesion model that was used to
produce a complex pattern of RA activation to evaluate a
mapping system for rapid, high resolution (HR)
electroanatomical mapping.
U.S. Patent Application Publication 2013/0109945, whose
disclosure is incorporated herein by reference, relates to
the determination and/or representation of physiological
information relating to a heart surface.
SUMMARY OF THE INVENTION
There is provided, in accordance with some embodiments
of the present invention, a method for displaying
electroanatomical information. The
method includes
identifying at least one multiple-activation area of a
surface of a heart, at which multiple-activation area were
1
CA 02949991 2016-11-28
recorded at least two different local activations during a
single cardiac cycle of the heart. The multiple-activation
area is displayed, on an electroanatomical map of the
surface of the heart, in a manner that indicates a time
difference between respective times of the two local
activations.
In some embodiments, displaying the multiple-activation
area includes displaying the multiple-activation area in a
color that indicates the time difference.
In some embodiments, displaying the multiple-activation
area includes displaying the multiple-activation area with
an overlaid indicator, a property of which indicates the
time difference.
In some embodiments, the property of the overlaid
indicator includes a color of the overlaid indicator.
In some embodiments, the property of the overlaid
indicator includes a size of the overlaid indicator.
In some embodiments, displaying the multiple-activation
area includes setting a value of a display property of the
multiple-activation area by applying, to the time
difference, a function that maps a domain of time
differences to a range of values of the display property.
In some embodiments, the function (i) is monotonic for
time differences that lie between an upper limit and a lower
limit, (ii) returns a first value for the lower limit, and
(iii) is constant, at a second value, for differences that
lie above the upper limit.
In some embodiments, the method further includes
receiving from a user, via a user interface, the upper limit
and the lower limit.
2
CA 02949991 2016-11-28
In some embodiments, the method further includes
receiving from the user, via the user interface, the first
value and the second value.
In some embodiments, the method further includes:
identifying at least one single-activation area of the
surface of the heart, at which single-activation area was
recorded only a single local activation during the cardiac
cycle; and
displaying, on the electroanatomical map, the single-
activation area in a manner that indicates a time of the
single local activation.
In some embodiments,
displaying the single-activation area includes setting
a color of the single-activation area by applying, to the
time of the single local activation, a first function that
maps a domain of times to a first range of color values, and
displaying the multiple-activation area includes
setting a color of the multiple-activation area by applying,
to the time difference, a second function that maps a domain
of time differences to a second range of color values that
is distinct from the first range.
In some embodiments, the multiple-activation area
includes an area of the heart that was ablated.
There is further provided, in accordance with some
embodiments of the present invention, apparatus for use with
a display. The apparatus includes an electrical interface,
and a processor, configured to (i) receive, via the
electrical interface, one or more electrocardiogram (ECG)
signals, (ii) from the ECG signals, identify at least one
multiple-activation area of a surface of a heart, at which
multiple-activation area were recorded at least two
different local activations during a single cardiac cycle of
3
CA 02949991 2016-11-28
the heart, and (iii) drive the display to display, on an
electroanatomical map of the surface of the heart, the
multiple-activation area in a manner that indicates a time
difference between respective times of the two local
activations.
There is further provided, in accordance with some
embodiments of the present invention, a computer software
product including a tangible non-transitory computer-
readable medium in which program instructions are stored.
The instructions, when read by a processor, cause the
processor to (i) identify at least one multiple-activation
area of a surface of a heart, at which multiple-activation
area were recorded at least two different local activations
during a single cardiac cycle of the heart, and (ii) drive a
display to display, on an electroanatomical map of the
surface of the heart, the multiple-activation area in a
manner that indicates a time difference between respective
times of the two local activations.
The present invention will be more fully understood
from the following detailed description of embodiments
thereof, taken together with the drawings, in which:
BRIEF DESCRIPTION OF THE DRAWINGS
Fig. 1 is a schematic illustration of a system for
generating an electroanatomical map of an inner or
epicardial surface of a heart, in accordance with some
embodiments of the present invention;
Figs. 2-3 are schematic illustrations of visual output,
displayed in accordance with some embodiments of the present
invention; and
Fig. 4 is a flow diagram for a method for displaying an
electroanatomical map of an inner or epicardial surface of a
4
CA 02949991 2016-11-28
heart, in accordance with some embodiments of the present
invention.
DETAILED DESCRIPTION OF EMBODIMENTS
OVERVIEW
In some procedures, the distal end of a catheter is
moved along the inner or epicardial surface of a heart, and
one or more electrodes at the distal end of the catheter are
used to record the electrical activity of the heart. In
particular, the electrodes may be used to record
intracardiac ECG signals, from which the respective local
activation times at various areas may be identified. Such
information may be used to generate an electroanatomical
map.
In some cases, some areas of the inner or epicardial
surface of the heart, referred to herein as "multiple-
activation areas," exhibit two or more local activations per
cardiac cycle.
Multiple local activations in a particular
area may be indicative of the presence of a line of block in
the area. Such a line of block may be pathological, or may
be the intended result of an ablation procedure, referred to
as a line of ablation.
Moreover, the time difference
between the local activations may indicate the proximity of
the multiple-activation area to an edge of the line of
block, or to an unintended gap in the line of ablation.
In light of the above, embodiments described herein
provide methods and apparatus for displaying multiple-
activation areas on an electroanatomical map, in an
intuitive manner that indicates the respective time
differences for the multiple-activation areas. For example,
a function may be used to map the time differences to
respective colors, such that the color in which a particular
multiple-activation area is displayed on the map indicates
5
CA 02949991 2016-11-28
the time difference for the multiple-activation area. A
physician may then use the electroanatomical map to locate,
with relative precision, a pathological line of block, or to
identify an unintended gap in a line of ablation.
An advantage of embodiments of the present invention is
that the physician need not examine the "raw" intracardiac
ECG signal in order to determine the time difference between
activations for a multiple-activation area.
Rather, the
physician may readily perceive the time difference, simply
by looking at the electroanatomical map.
Moreover, since
the electroanatomical map typically shows all of the
multiple-activation areas at once, the physician may locate
pathological tissue, or an unintended gap in a line of
ablation, much more quickly and/or effectively, relative to
if the physician were to examine each individual
intracardiac ECG signal. Hence, embodiments of the present
invention may improve the diagnosis and/or treatment of the
subject.
It is noted that in the context of the present
application, including the claims, terms that include the
word "line," such as "line of block" and "line of ablation,"
include within their scope any relevant type of open or
closed rectilinear or curvilinear shape, of constant or
varying thickness. For
example, embodiments described
herein may be used to identify an unintended gap in a
circular line of ablation around an opening to a pulmonary
vein, or a straight or curved line of ablation in any area
of the heart.
SYSTEM DESCRIPTION
Reference is initially made to Fig. 1, which is a
schematic illustration of a system 21 for generating an
electroanatomical map of an inner or epicardial surface of a
6
CA 02949991 2016-11-28
heart 23 of a subject 25, in accordance with some
embodiments of the present invention. In
generating the
electroanatomical map, methods disclosed in U.S. Patent
Nos. 6,226,542, 6,301,496, and 6,892,091, whose disclosures
5 are herein incorporated by reference, may be used. One
commercial product embodying elements of system 21 is the
CARTO 3 System, available from Biosense Webster, Inc., 3333
Diamond Canyon Road, Diamond Bar, CA 91765. This system may
be modified by those skilled in the art to embody the
principles of embodiments described herein.
Fig. 1 shows a physician 27 holding a catheter 29, a
distal end 31 of which is disposed within heart 23 of
subject 25. Physician 27 moves distal end 31 of catheter 29
along the inner or epicardial surface of the heart, and one
or more electrodes at the distal end of the catheter are
used to record intracardiac ECG signals, as described above.
A processor (PROC) 28 receives the ECG signals via an
electrical interface 35. By
analyzing the ECG signals,
processor 28 identifies any recorded local activations, and
further measures the respective local activation times of
the local activations, or at least the respective
differences between any multiple local activations. In
response to the measured local activation times and/or the
time differences, processor 28 generates
an
electroanatomical map, and drives a display 26 to display
the map, as described in detail below.
In general, processor 28 may be embodied as a single
processor, or a cooperatively networked or clustered set of
processors. Processor 28 is typically a programmed digital
computing device comprising a central processing unit (CPU),
random access memory (RAM), non-volatile secondary storage,
such as a hard drive or CD ROM drive, network interfaces,
and/or peripheral devices. Program code, including software
7
CA 02949991 2016-11-28
programs, and/or data are loaded into the RAM for execution
and processing by the CPU and results are generated for
display, output, transmittal, or storage, as is known in the
art. The program code and/or data may be downloaded to the
computer in electronic form, over a network, for example, or
it may, alternatively or additionally, be provided and/or
stored on non-transitory tangible media, such as magnetic,
optical, or electronic memory. Such
program code and/or
data, when provided to the processor, produce a machine or
special-purpose computer, configured to perform the tasks
described herein.
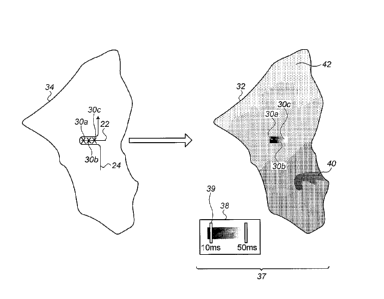
Reference is now additionally made to Fig. 2, which is
a schematic illustration of visual output 37, which is
displayed on display 26 in accordance with some embodiments
of the present invention. Visual
output 37 includes an
electroanatomical map 32 of an inner surface 34 of a heart
(e.g., a portion of the left-ventricular or right-
ventricular myocardium of the heart), which is generated by
processor 28 in response to the local activation times of
the recorded local activations.
The left side of Fig. 2 shows the anatomical scenario
that leads to the display of map 32 as shown. In
this
scenario, an electrical wavefront 24 propagates along
surface 34, as indicated by the arrow. Upon
reaching the
"near" side of a line of block 22, wavefront 24 circumvents
the line of block, and continues along its previous
trajectory at the "far" side of the line of block. As a
result of the circumvention of line of block 22, multiple
local activation times are measured in the vicinity of the
line of block. For example, Fig. 2 depicts, via a plurality
of "x" symbols, the measurement of local activation times at
areas 30a, 30b, and 30c that lie along the line of block.
At each of these areas, at least two local activation times
8
CA 02949991 2016-11-28
are measured per cardiac cycle: a first local activation
time corresponding to the passing of wavefront 24 through
the near side of the area, and a second local activation
time corresponding to the passing of wavefront 24 through
the far side of the area. For example, the measured local
activation times might be as follows:
Area 30a: 300 ms and 310 ms
Area 30b: 290 ms and 320 ms
Area 30c: 280 ms and 330 ms
Areas such as areas 30a, 30b, and 30c are referred to
herein as "multiple-activation areas." On
the other hand,
areas in which only a single local activation is recorded
per cardiac cycle are referred to herein as "single-
activation areas." (As
further described below, areas at
which multiple local activations are recorded, but these
local activations occur relatively close together in time,
may be treated as single-activation areas.) The difference
between the local activation times at a multiple-activation
area is a function of the propagation time needed for
wavefront 24 to circumvent the line of block, and is
therefore a function of the proximity of the multiple-
activation area to the edge of the line of block. Thus, per
the example above, the difference between the local
activation times is 50 ms for area 30c, but only 10 ms for
area 30a, since area 30a is closer to the edge of the line
of block.
Based on the measured local activation times, processor
28 identifies areas 30a, 30b, and 30c as multiple-activation
areas.
Processor 28 then drives display 26 to display, on
electroanatomical map 32, each of the multiple-activation
areas in a manner that indicates the time difference between
the two local activation times measured at the area. For
9
CA 02949991 2016-11-28
example, Fig. 2 shows each of areas 30a, 30b, and 30c
displayed in a color that indicates the time difference
between the two local activation times measured at the area.
In particular, area 30a, at which a relatively small time
difference was measured, is shown in a darker color, while
area 30c, at which a larger time difference was measured, is
shown in a lighter color. Area
30b is shown in an
intermediate color. (It is noted that in the context of the
present application, including the claims, black is
considered to be a color.)
Typically, to display the multiple-activation area such
as to indicate the time difference between the two local
activation times, the processor sets a value of a display
property of the multiple-activation area by applying, to the
time difference, a function that maps a domain of time
differences to a range of values of the display property.
For example, as noted above, Fig. 2 depicts an embodiment in
which the modified display property is the display color;
hence, the processor applies a function that maps a domain
of time differences delta-T (AT) to a range of color values.
Such a range may be expressed in terms of any relevant color
space.
Typically, the function that is used for displaying the
multiple-activation areas (i) is monotonic (e.g., strictly
monotonic) for time differences that lie between an upper
limit and a lower limit, (ii) returns a first value for the
lower limit, and (iii) is constant, at a second value, for
differences that lie above the upper limit. For example, in
the RGBA color space, and assuming a lower limit of 10 ms
and an upper limit of 50 ms, the function may take the
following form:
C2 _R = 02G = 02B = (max(min(AT, 50), 10) - 10)/40,
C2 A = 1,
CA 02949991 2016-11-28
where C2_R, 02_G, and C2_B are, respectively, the red
(R), green (G), and blue (B) components of the color C2 in
which the multiple-activation area is displayed, and C2_A is
the opacity of the color.
(Hence, this function maps the
domain of time differences to the color range between black,
represented by the RGBA vector (0,0,0,1), and white,
represented by (1,1,1,1)J For
each of the color
components, this function (i) is strictly monotonically
(linearly) increasing, from 0 to 1, for AT values between 10
ms and 50 ms, (ii) returns 0 for AT values less than or
equal to 10 ms, and (iii) returns 1 for AT values greater
than or equal to 50 ms.
It is noted that the scope of the present invention
includes setting any relevant display property to indicate
the time difference between the local activation times. For
example, in some embodiments, alternatively or additionally
to setting the color of the multiple-activation area, the
multiple-activation area may be displayed with an overlaid
indicator (e.g., a "+," "x," or "*" symbol), a property of
which indicates the time difference between the two local
activation times. For
example, the color or size of the
overlaid indicator may indicate the time difference. In
such embodiments, a function may be used to map the relevant
domain of time differences to the relevant range of values
for the color or size of the indicator, analogously to that
which was described above. For example, for embodiments in
which the time differences are mapped to different indicator
sizes, the function may, for example, take the form
S = (max(min(AT, 50), 10) - 10)/4,
where S is the size, in pixels, of the indicator. Such
a function returns a size of zero pixels for AT values equal
to or less than 10 ms, a size of 10 pixels for AT values
equal to or greater than 50 ms, and a size that varies
11
CA 02949991 2016-11-28
linearly from zero to 10 pixels for AT values between 10 ms
and 50 ms.
In the above examples, the mapping function is linearly
increasing between the upper and lower time-difference
limits. In
other embodiments, the mapping function may be
exponential or logarithmic, or may take any other suitable
form.
As depicted in Fig. 2, in some embodiments, the upper
and lower limits of the domain for the monotonically varying
portion of the function, and/or the corresponding values of
the range, are received from a user (e.g., the physician)
via a user interface 38, which is included in visual output
37. For
example, Fig. 2 depicts user interface 38 taking
the form of a color bar. By sliding two sliders 39 along
the color bar, the user is able to choose the upper and
lower limits, as well as the colors in which these limits
are displayed.
In other embodiments, the upper and lower limits are
not received from a user, but rather, are calculated based
on the distribution of AT. In yet
other embodiments, the
upper and lower limits are preset, constant values.
Typically, the lower limit of the domain is also the
cutoff for identifying multiple-activation areas. For
example, if the lower limit is 10 ms, areas having time
differences of less than 10 ms may be treated as single-
activation areas, despite these areas exhibiting multiple
activations. In other embodiments, however, the cutoff may
be different from the lower limit. For
example, user
interface 38 may allow the user to separately input a
cutoff. Thus, for example, if the user inputs a cutoff of 5
ms, a lower limit of 10 ms, and an upper limit of 50 ms,
assuming a black color for the lower limit and a white color
for the upper limit:
12
CA 02949991 2016-11-28
(i) areas having a AT value that is less than 5 ms will
be classified as single-activation areas;
(ii) areas having a AT value between 5 ms and 10 ms
will be displayed in black;
(iii) areas having AT values between 10 ms and 50 ms
will be displayed in varying shades of gray; and
(iv) areas having AT values that are 50 ms or greater
will be displayed in white.
Some multiple-activation areas may exhibit more than
two local activation times. In some
embodiments, for such
areas, the processor attempts to identify one or more of the
local activation times as outliers, by, for example,
comparing the local activation times to those of nearby
areas. By disregarding any identified outliers, the number
of local activation times is reduced. If more
than two
local activation times remain even after disregarding the
outliers, the processor may, for example, calculate AT as
the difference between the first and last local activation
times. In other embodiments, the processor does not attempt
to identify any outliers, but rather, simply calculates AT
as the difference between the first and last local
activation times, or uses any other suitable method to
choose the "primary" two local activation times.
In some embodiments, the processor ignores any portions
of the intracardiac ECG that were recorded during portions
of the cardiac cycle in which electrical noise is known to
be relatively high. This may reduce the number of spurious
local activations that are identified.
Typically, processor 28 further identifies at least one
single-activation area, and displays, on map 32, the single-
activation area in a manner that indicates the single local
activation time of the single-activation area. For example,
13
CA 02949991 2016-11-28
in Fig. 2, single-activation areas are identified for the
majority of surface 34, and these single-activation areas
are displayed on the map in different colors (indicated in
Fig. 2 by different dot-pattern densities), which indicate
the different respective local activation times of the
areas.
Typically, to set the display-property values for the
single-activation areas, the processor applies a function
that maps a domain of local activation times to a range of
display-property values. For
example, the processor may
apply a function that maps a domain of local activation
times T to a range of color values Cl, which is distinct
from the range of color values C2 in which the multiple-
activation areas are displayed. For example, C2 may range
between black and white, with Cl ranging across other colors
such as blue, red, violet, etc. The use of distinct color-
value ranges allows the physician to easily distinguish
between multiple-activation areas and single-activation
areas.
In some embodiments, the upper and lower local-
activation-time limits, and/or the range of display-property
values for the single-activation areas, is received via user
interface 38. For example, the user interface may include a
separate color bar, and accompanying sliders, for setting
the relevant values.
For embodiments in which the display color is set to
indicate the relevant time differences (for multiple-
activation areas) and/or the relevant local activation times
(for single-activation areas), color interpolation may be
used to assign color values to certain areas at which ECG
recordings were not performed. Such
interpolation, which
may be performed in accordance with any relevant technique
known in the art, typically gives the electroanatomical map
14
CA 02949991 2016-11-28
a smooth appearance, thus allowing the electroanatomical map
to be more readily interpreted. For
example, if a first
area is assigned a color value of (0,0,0,1), and a nearby,
second area is assigned a color value of (20,20,20,1), areas
that lie between the first and second areas may be assigned
color values that increase (e.g., linearly) from (0,0,0,1)
to (20,20,20,1).
The showing of both the single-activation areas and
multiple-activation areas as described herein, particularly
together on the map at the same time, helps the physician
diagnose the subject's condition and/or decide upon an
appropriate course of treatment. The
respective display-
property values of the single-activation areas indicate to
the physician the direction of electrical propagation, while
the respective display-property values of the multiple-
activation areas additionally indicate the location of any
lines of block. Thus, for example, given the display shown
in Fig. 2, the physician may ascertain, based on the colors
in which the single-activation areas are displayed, that the
wavefront of electrical activity propagates outward from an
area 40 of surface 34, in all directions, including toward
an area 42 of the surface. The
colors in which the
multiple-activation areas are displayed further indicate
that a line of block is located along the route from area 40
to area 42, the edge of the line of block being at area 30a.
Notwithstanding the above, in some embodiments, only
the double-activation areas are displayed with indicative
display-property values. Thus,
for example, the double-
activation areas may be displayed in the black-white color
range, while the single-activation areas are displayed in a
single color.
Typically, display 26 includes a legend that shows the
mapping that was used to display the multiple-activation
CA 02949991 2016-11-28
areas, and/or the mapping that was used to display the
single-activation areas. For example, user interface 38 may
include such a legend, in the form of the color bars
described above.
Reference is now made to Fig. 3, which is a schematic
illustration of visual output 58a and 58b, displayed in
accordance with some embodiments of the present invention.
As noted above, embodiments described herein may be
used to locate a pathological line of block. Analogously,
embodiments described herein may be used to identify an
unintended gap in a line of ablation, which is a line of
electrically non-conductive tissue created by a physician
during an ablation procedure, typically in order to
terminate or alter an arrhythmia of the subject.
In both visual output 58a and visual output 58b, a
plurality of markers 60, superimposed on map 32, mark the
areas that the physician attempted to ablate. Visual output
58a corresponds to a scenario in which the line of ablation
is continuous, as intended. In such a scenario, the varying
colors of the multiple-activation areas provide intuitive,
visual feedback to the physician that the ablation was
successful.
Visual output 58b, on the other hand,
corresponds to a scenario in which the line of ablation has
an unintended gap 62. In
such a scenario, the varying
colors of the multiple-activation areas provide intuitive,
visual feedback to the physician that the ablation was not
entirely successful. In response thereto, the physician may
reablate the area at gap 62.
Reference is now made to Fig. 4, which is a flow
diagram for a method for displaying an electroanatomical map
of an inner or epicardial surface of a heart, in accordance
with some embodiments of the present invention.
16
CA 02949991 2016-11-28
First, via user interface 38 (Fig. 2), user input is
received, at an input-receiving step 46. As
described
above, such input includes the information that is used to
map local-activation-time differences to display-property
values for the multiple-activation areas, and/or the
information that is used to map local activation times to
display-property values for the single-activation areas.
Subsequently, at a measuring step 44, the local activation
times for a plurality of areas of the surface are measured,
as described above. (In some
embodiments, input-receiving
step 46 is performed subsequently to measuring step 44.)
Subsequently, at an identifying step 48, each of the
areas of the surface is identified as being either a single-
activation area or a multiple-activation area. A
single-
activation area is any area for which either (i) only one
local activation time was measured, or (ii) the difference
between local activation times is less than a cutoff. As
described above, the cutoff is typically the lower time-
difference limit for the multiple-activation-area mapping.
Thus, for example, if the user inputs a lower limit of 10
ms, any area for which the difference between local
activation times is less than 10 ms will be classified as a
single-activation area.
Subsequently, at a first-function-applying step 50, a
first function, which is based on the received user input,
is used to map the local activation times of the single-
activation areas to respective display-property values.
Similarly, at a second-function-applying step 52, a second
function, which is also based on the received user input, is
used to map the differences between local activation times
of the multiple-activation areas to respective display-
property values. The
electroanatomical map is then
displayed, at a displaying step 54, with the display-
17
CA 02949991 2016-11-28
property values calculated in steps 50 and 52. The
physician may then use the electroanatomical map to diagnose
the subject.
It is noted that apparatus and methods described herein
may be practiced with both static electroanatomical maps,
which do not change from one heartbeat to the next, and
dynamic electroanatomical maps. Such
dynamic
electroanatomical maps may be used, for example, to
visualize changes in the pattern of electrical propagation
from one heartbeat to the next, in order to better diagnose
and/or treat certain types of arrhythmias.
It will be appreciated by persons skilled in the art
that the present invention is not limited to what has been
particularly shown and described hereinabove.
Rather, the
scope of the present invention includes both combinations
and subcombinations of the various features described
hereinabove, as well as variations and modifications thereof
that are not in the prior art, which would occur to persons
skilled in the art upon reading the foregoing description.
Documents incorporated by reference in the present patent
application are to be considered an integral part of the
application except that to the extent any terms are defined
in these incorporated documents in a manner that conflicts
with the definitions made explicitly or implicitly in the
present specification, only the definitions in the present
specification should be considered.
18