Note: Descriptions are shown in the official language in which they were submitted.
1
COMPUTATIONAL ANALYSIS OF BIOLOGICAL DATA USING MANIFOLD
AND A HYPERPLANE
RELATED APPLICATIONS
This application claims the benefit of priority of U.S. Patent Application
Nos.
62/037,180 filed on August 14, 2014, and 62/105,938 filed on January 21, 2015.
FIELD AND BACKGROUND OF THE INVENTION
The present invention, in some embodiments thereof, relates to computational
analysis, and, more particularly, but not exclusively, to computational
analysis of
biological data, e.g., for the purpose of distinguishing between bacterial
infection and
non-bacterial disease, and/or between a bacterial infection and viral
infection, and/or
between an infectious and non-infectious disease.
Antibiotics (Abx) are the world's most prescribed class of drugs with a 25-30
billion $US global market. Abx are also the world's most misused drug with a
significant fraction of all drugs (40-70%) being wrongly prescribed (Linder,
J.A. and
R.S. Stafford 2001; Scott, J. G. and D. Cohen, et al. 2001; Davey, P. and E.
Brown, et
al. 2006; Cadieux, G. and R. Tamblyn, et al. 2007; Pulcini, C. and E. Cua, et
al. 2007),
("CDC - Get Smart: Fast Facts About Antibiotic Resistance" 2011).
One type of Abx misuse is when the drug is administered in case of a non-
bacterial disease, such as a viral infection, for which Abx is ineffective.
For example,
according to the USA center for disease control and prevention CDC, over 60
Million
wrong Abx prescriptions are given annually to treat flu in the US. The health-
care and
economic consequences of the Abx over-prescription include: (i) the cost of
antibiotics
that are unnecessarily prescribed globally, estimated at >$10 billion
annually; (ii) side
effects resulting from unnecessary Abx treatment are reducing quality of
healthcare,
causing complications and prolonged hospitalization (e.g. allergic reactions,
Abx
associated diarrhea, intestinal yeast etc.) and (iii) the emergence of
resistant strains of
bacteria as a result of the overuse (the CDC has declared the rise in
antibiotic resistance
of bacteria as "one of the world's most pressing health problems in the 21st
century"
(Arias, C.A. and B.E. Murray 2009; "CDC - About Antimicrobial Resistance"
2011).
Antibiotics under-prescription is not uncommon either. For example up to 15%
of adult bacterial pneumonia hospitalized patients in the US receive delayed
or no Abx
Date recue / Date received 202 1-1 1-25
2
treatment, even though in these instances early treatment can save lives and
reduce
complications(Houck, P.M. and D. W. Bratzler, et al. 2002).
Technologies for infectious disease diagnosis have the potential to reduce the
associated health and financial burden associated with Abx misuse. Ideally,
such a
technology should: (i) accurately differentiate between a bacterial and viral
infections;
(ii) be rapid (within minutes); (iii) be able to differentiate between
pathogenic and non-
pathogenic bacteria that are part of the body's natural flora; (iv)
differentiate between
mixed co-infections and pure viral infections and (v) be applicable in cases
where the
pathogen is inaccessible (e.g. sinusitis, pneumonia, otitis-media, bronchitis,
etc).
Current solutions (such as culture, PCR and immunoassays) do not fulfill all
these requirements: (i) Some of the assays yield poor diagnostic accuracy
(e.g. low
sensitivity or specificity)(Uyeki et al. 2009), and are restricted to a
limited set of
bacterial or viral strains; (ii) they often require hours to days; (iii) they
do not
distinguish between pathogenic and non-pathogenic bacteria (Del Mar, C 1992),
thus
leading to false positives; (iv) they often fail to distinguish between a
mixed and a pure
viral infections and (v) they require direct sampling of the infection site in
which traces
of the disease causing agent are searched for, thus prohibiting the diagnosis
in cases
where the pathogen resides in an inaccessible tissue, which is often the case.
Consequentially, there still a diagnostic gap, which in turn often leads
physicians
to either over-prescribe Abx (the "Just-in-case-approach"), or under-prescribe
Abx (the
"Wait-and-see-approach") (Little, P.S. and I. Williamson 1994; Little, P.
2005; Spiro, D.
M. and K. Y. Tay, et al. 2006), both of which have far reaching health and
financial
consequences.
Accordingly, a need exists for a rapid method that accurately differentiates
between bacterial (including mixed bacterial plus viral infection), viral and
non-
bacterial, non-viral disease patients that addresses these challenges.
WO 2013/117746 teaches signatures and determinants for distinguishing
between a bacterial and viral infection.
SUMMARY OF THE INVENTION
According to an aspect of some embodiments of the present invention there is
provided a method of analyzing biological data, the biological data containing
Date recue / Date received 202 1-1 1-25
3
expression values of a plurality of polypeptides in the blood of a subject.
The method
comprises: calculating a distance between a segment of a curved line and an
axis defined
by a direction, the distance being calculated at a point over the curved line
defined by a
coordinate 81 along the direction. The method further comprises correlating
the distance
to the presence of, absence of, or likelihood that the subject has a bacterial
infection.
The coordinate 81 is defined by a combination of the expression values,
wherein at least
90% of the segment is between a lower bound line f(61)-co and an upper bound
line
f(81)+61, wherein the f(61) equals 1/(1+exp(61)), and wherein each of the co
and the al is
less than 0.5.
According to some embodiments of the invention the method comprises
obtaining the likelihood based on the distance, comparing the likelihood to a
predetermined threshold, and, treating the subject for the bacterial infection
when the
likelihood is above the predetermined threshold.
According to an aspect of some embodiments of the present invention there is
provided a method of analyzing biological data, the biological data containing
expression values of a plurality of polypeptides in the blood of a subject.
The method
comprises: calculating a distance between a segment of a curved line and an
axis defined
by a direction, the distance being calculated at a point over the curved line
defined by a
coordinate 80 along the direction. The method further comprises correlating
the distance
to the presence of, absence of, or likelihood that the subject has a viral
infection. The
coordinate 80 is defined by a combination of the expression values, wherein at
least 90%
of the segment is between a lower bound line g(80)-ao and an upper bound line
g(6o)+61,
wherein the f(60) equals 1/(1+exp(80)), and wherein each of the so and the El
is less than
0.5.
According to some embodiments of the invention the method comprises
obtaining the likelihood based on the distance, comparing the likelihood to a
predetermined threshold, and, treating the subject for the viral infection
when the
likelihood is above the predetermined threshold.
According to some embodiments of the invention the combination of the
expression values comprises a linear combination of the expression values.
Date recue / Date received 202 1-1 1-25
4
According to some embodiments of the invention the combination of the
expression values includes at least one nonlinear term corresponding to at
least one of
the expression values.
According to an aspect of some embodiments of the present invention there is
provided a method of analyzing biological data, the biological data containing
expression values of a plurality of polypeptides in the blood of a subject.
The method
comprises: calculating a first distance between a segment of a curved surface
and a plane
defined by a first direction and a second direction. The first distance being
calculated at
a point over the surface defined by first coordinate 60 along the first
direction and a
to second coordinate 61 along the second direction. The method further
comprises
correlating the first distance to the presence of, absence of, or likelihood
that the subject
has a bacterial infection. Each of the coordinates is defined by a different
combination
of the expression values, wherein at least 90% of the segment is between a
lower bound
surface f(60,61)-ao and an upper bound surface f(60,61)+ai, wherein the
f(60,61) equals
exp(61)/(1+exp(60)+exp(61)), and wherein each of the so and the al is less
than 0.5.
According to some embodiments of the invention for at least one of the
coordinates, the combination of the expression values comprises a linear
combination of
the expression values.
According to some embodiments of the invention for at least one of the
coordinates, the combination of the expression values includes at least one
nonlinear
term corresponding to at least one of the expression values.
According to some embodiments of the invention the method comprises
obtaining the likelihood based on the first distance, comparing the likelihood
to a
predetermined threshold, and, treating the subject for the bacterial infection
when the
likelihood is above the predetermined threshold.
According to some embodiments of the invention the method comprises
calculating a second distance between a segment of second curved surface and
the plane;
and correlating the second distance to the presence of, absence of, or
likelihood that the
subject has a viral infection. According to some embodiments of the invention
at least
90% of the segment of the second surface is between a second lower bound
surface
g(6o,61)-62 and a second upper bound surface g(60,61)+83, wherein the g(60,61)
equals
exp(60)/(1+exp(60)+exp(61)), and wherein each of the az and the E3 is less
than 0.5.
Date recue / Date received 202 1-1 1-25
5
According to some embodiments of the invention the method comprises
obtaining the likelihood based on the second distance, comparing the
likelihood to a
second predetermined threshold, and, treating the subject for the viral
infection when the
likelihood is above the second predetermined threshold.
According to some embodiments of the invention the method comprises
obtaining the likelihood that the subject has a bacterial infection based on
the distance,
obtaining the likelihood that the subject has a viral infection based on the
second
distance, comparing each of the likelihoods to a respective predetermined
threshold, and,
when each of the likelihoods is below the respective predetermined threshold,
then
determining that the patient is likely to have a non-infectious disease.
According to an aspect of some embodiments of the present invention there is
provided a method of analyzing biological data, the biological data containing
expression values of a plurality of polypeptides in the blood of a subject.
The method
comprises: calculating a distance between a segment of a curved surface and a
plane
defined by a first direction and a second direction. The distance is
calculated at a point
over the surface defined by first coordinate 80 along the first direction and
a second
coordinate 81 along the second direction. The method comprises correlating the
distance
to the presence of, absence of, or likelihood that the subject has, a viral
infection;
wherein each of the coordinates is defined by a different combination of the
expression
values, wherein at least 90% of the segment is between a lower bound surface
g(60,61)-ao
and an upper bound surface g(60,81)+61, wherein the g(80,6i) equals
exp(80)/(1+exp(80)+exp(81)), and wherein each of the 60 and the si is less
than 0.5.
According to some embodiments of the invention each of the plurality of
polypeptides is selected from the group consisting of CRP, IP-10, TRAIL, IL
lra, PCT
and SAA.
According to some embodiments of the invention the plurality of polypeptides
comprises at least three polypeptides.
According to some embodiments of the invention the plurality of polypeptides
comprises at least three polypeptides selected from the group consisting of
CRP, IP-10,
TRAIL, IL lra, PCT and SAA.
According to some embodiments of the invention the plurality of polypeptides
comprises at least CRP and TRAIL.
Date recue / Date received 202 1-1 1-25
6
According to some embodiments of the invention the plurality of polypeptides
comprises at least CRP, TRAIL and IP-10.
According to some embodiments of the invention the method comprises
generating an output of the likelihood, the output is presented as text.
According to some embodiments of the invention the method comprises
generating an output of the likelihood, the output is presented graphically.
According to some embodiments of the invention the method comprises
generating an output of the likelihood, the output is presented using a color
index.
According to sonic embodiments of the invention the blood sample is whole
to blood.
According to some embodiments of the invention the blood sample is a fraction
of whole blood.
According to some embodiments of the invention the blood fraction comprises
serum or plasma.
According to some embodiments of the invention the method comprises
determining the expression values, and wherein at least one of the expression
values is
determined electrophoretically or immunochemically.
According to some embodiments of the invention the immunochemical
determination is effected by flow cytometry, radioimmunoassay,
immunofluorescence or
by an enzyme-linked immunosorbent assay.
According to some embodiments of the invention the calculating and the
correlating is executed by a computer remote from the subject.
According to some embodiments of the invention the calculating and the
correlating is executed by a computer near the subject.
According to some embodiments of the invention the calculating and the
correlating is executed by a cloud computing resource of a cloud computing
facility.
According to some embodiments of the invention the expression values are
measured by a measuring system performing at least one automated assay
selected from
the group consisting of an automated ELISA, an automated immunoassay, and an
automated functional assay, and the method comprises receiving said the
biological data
from said measuring system.
Date recue / Date received 202 1-1 1-25
7
According to some embodiments of the invention the receiving is over an
internet network via a network interface.
According to an aspect of some embodiments of the present invention there is
provided a computer-implemented method for analyzing biological data. The
method
comprises: displaying on a display device a graphical user interface (GUI)
having a
calculation activation control; receiving expression values of polypeptides in
the blood
of a subject; responsively to an activation of the control by a user,
automatically
calculating a score based on the expression values; generating on the GUI a
graphical
scale having a first end identified as corresponding to a viral infection of
the subject, and
to a second
end identified as corresponding to a bacterial infection the subject; and
generating a mark on the scale at a location corresponding to the score.
According to some embodiments of the invention the expression values are
received by communicating with an external machine that measures the
expression
values. According to some embodiments of the invention the GUI comprises a
communication control, wherein the communication with the external machine is
in
response to an activation of the communication control by the user.
According to some embodiments of the invention the GUI comprises a plurality
of an expression value input fields, wherein the expression values are
received via the
input fields.
According to some embodiments of the invention the score is a likelihood that
the subject has bacterial infection. According to some embodiments of the
invention the
score is a likelihood that the subject has viral infection.
According to an aspect of some embodiments of the present invention there is
provided a computer software product, comprising a computer-readable medium in
which program instructions are stored, which instructions, when read by a
hardware
processor, cause the hardware processor to receive expression values of a
plurality of
polypeptides in the blood of a subject who has an unknown disease, and to
execute the
method as delineated above and optionally as further detailed below.
According to an aspect of some embodiments of the present invention there is
provided a system for analyzing biological data. The system comprises: a user
interface
configured to receive expression values of a plurality of polypeptides in the
blood of a
Date recue / Date received 202 1-1 1-25
8
subject who has an unknown disease; and a hardware processor having a computer-
readable medium storing the computer software product.
According to an aspect of some embodiments of the present invention there is
provided a system for analyzing biological data. The system comprises: a first
compai _______________________________________________________ anent
configured to measure expression values of a plurality of polypeptides in
the blood of a subject who has an unknown disease; a second compai ____ intent
comprising a
hardware processor having a computer-readable storing the computer software
product.
According to some embodiments of the invention the first compartment, the
second compartment and the display are mounted on or integrated with a body of
a
to hand-held device.
According to an aspect of some embodiments of the present invention there is
provided a method of analyzing a dataset. The method comprises: (a) accessing
a
dataset comprising classification groups based on expression values of a
plurality of
polypeptides in the blood of a subject who has an unknown disease in blood
samples of
multiple subjects, wherein the classification groups comprise a bacterial
infection, a viral
infection and a non-viral, non bacterial disease; and (b) analyzing the
classification
groups to provide at least a first probabilistic classification function
f(80,81) representing
the likelihood that a particular subject has a bacterial infection, the first
classification
function being a function of a first coordinate 80 and a second coordinate 81,
and wherein
each of the coordinates is defined by a different combination of the
expression values.
According to some embodiments of the invention the method further comprising
calculating a second classification function g(8o,61) representing the
likelihood that a
particular subject has a viral infection, the second classification function
being also a
function of the first and the second coordinates.
According to some embodiments of the invention the method comprises
calculating a third classification function h(6o,81) representing the
likelihood that a
particular subject has a non-viral, non bacterial disease, the third
classification function
being also a function of the first and the second coordinates.
According to some embodiments of the invention, for at least one of the
coordinates, the combination of the expression values comprises a linear
combination of
the expression values.
Date recue / Date received 202 1-1 1-25
9
According to some embodiments of the invention for at least one of the
coordinates, the combination of the expression values includes at least one
nonlinear
term corresponding to at least one of the expression values.
According to some embodiments of the invention the method comprises
generating an output of the analyzing.
According to some embodiments of the invention the dataset comprises one or
more multidimensional entries.
According to some embodiments of the invention the method wherein each entry
in the dataset comprises at least one clinical parameter of the respective
subject.
to According
to some embodiments of the invention the method wherein the
clinical parameter is selected from the group consisting of a sex, an age, a
temperature, a
time from symptoms onset and a weight.
According to some embodiments of the invention the analysis comprises
machine learning.
According to some embodiments of the invention the machine learning
comprises a supervised machine learning.
According to some embodiments of the invention the machine learning
comprises at least one procedure selected from the group consisting of
clustering,
support vector machine, linear modeling, k-nearest neighbors analysis,
decision tree
learning, ensemble learning procedure, neural networks, probabilistic model,
graphical
model, Bay esian network, logistic regression and association rule learning.
According to some embodiments of the invention the method wherein the
machine learning is selected from the group consisting of support vector
machine, neural
networks and logistic regression.
According to some embodiments of the invention the blood sample is whole
blood.
According to some embodiments of the invention the blood sample is a fraction
of whole blood.
According to some embodiments of the invention the blood fraction comprises
serum or plasma.
According to some embodiments of the invention the expression value is
determined electrophoretically or immunochemically.
Date recue / Date received 202 1-1 1-25
10
According to some embodiments of the invention the immunochemical
determination is effected by flow cytometry, radioimmunoassay,
immunofluorescence or
by an enzyme-linked immunosorbent assay.
According to an aspect of some embodiments of the present invention there is
provided a method of predicting a prognosis for a disease. The method
comprises
measuring the TRAIL protein serum level in subject having the disease, wherein
when
the TRAIL level is below a predetermined level, the prognosis is poorer than
for a
subject having a disease having a TRAIL protein serum level above the
predetermined
level.
According to some embodiments of the invention the method wherein the disease
is an infectious disease.
According to some embodiments of the invention the method wherein the disease
is not an infectious disease.
According to an aspect of some embodiments of the present invention there is
provided a method of determining a treatment course for a disease in a
subject. The
method comprises measuring the TRAIL protein serum level in the subject,
wherein
when the TRAIL level is below a predetermined level, the subject is treated
with a
treatment of last resort.
According to some embodiments of the invention the predetermined level is
below 20 pg/ml.
According to an aspect of some embodiments of the present invention there is
provided a method of determining an infection type in a female subject of
fertility age.
The method comprises comparing the TRAIL protein serum level in the subject
to a predetermined threshold, the predetermined threshold corresponding to the
TRAIL
protein serum level of a healthy female subject of fertility age, or a group
of healthy
female subjects of fertility age, wherein a difference between the TRAIL
protein serum
level and the predetermined threshold is indicative of an infection type.
According to an aspect of some embodiments of the present invention there is
provided a method of determining an infection type in a male subject of
fertility age.
The method comprises comparing the TRAIL protein serum level in the subject
to a predetermined threshold, the predetermined threshold corresponding to the
TRAIL
protein serum level of a healthy male subject of fertility age, or a group of
healthy male
Date recue / Date received 202 1-1 1-25
11
subjects of fertility age, wherein a difference between the TRAIL protein
serum level
and the predetermined threshold is indicative of an infection type.
According to some embodiments of the invention when the TRAIL protein
serum level is above the predetermined threshold, the infection type is viral.
According to some embodiments of the invention when the TRAIL protein
serum level is above the predetermined threshold, the infection type is not
bacterial.
According to some embodiments of the invention when the TRAIL protein
serum level is below the predetermined threshold, the infection type is
bacterial.
According to some embodiments of the invention when the TRAIL protein
serum level is below the predetermined threshold, the infection type is not
viral.
Unless otherwise defined, all technical and/or scientific terms used herein
have
the same meaning as commonly understood by one of ordinary skill in the art to
which
the invention pertains. Although methods and materials similar or equivalent
to those
described herein can be used in the practice or testing of embodiments of the
invention,
exemplary methods and/or materials are described below. In case of conflict,
the patent
specification, including definitions, will control. In addition, the
materials, methods, and
examples are illustrative only and are not intended to be necessarily
limiting.
BRIEF DESCRIPTION OF THE SEVERAL VIEWS OF THE DRAWINGS
Some embodiments of the invention are herein described, by way of example
only, with reference to the accompanying drawings. With specific reference now
to the
drawings in detail, it is stressed that the particulars shown are by way of
example and for
purposes of illustrative discussion of embodiments of the invention. In this
regard, the
description taken with the drawings makes apparent to those skilled in the art
how
embodiments of the invention may be practiced.
In the drawings:
FIGs. 1A-B. Study workflow. (A) An overview of the study workflow. nBacterial,
nViral and ncontrol represent the number of bacterial (including mixed
bacterial plus viral
co-infections), viral and control (with no apparent infectious disease) cases,
respectively. (B) Proteins discovery and validation process.
FIGs. 2A-C. The proteins TRAIL, IP-10 and CRP are differentially expressed in
bacterial, viral and non-infectious patients. Box plots for TRAIL (A), IP-10
(B), and
Date recue / Date received 202 1-1 1-25
12
CRP (C), measured over the Majority cohort (n=765) are presented. Red line and
circle
correspond to group median and average respectively; t-test p-values between
bacterial
and viral groups and between infectious (bacterial and viral) vs. non-
infectious
(including healthy subjects) are depicted.
FIGs. 3A-B. Comparison of the signature to lab parameters and protein
biomarkers for diagnosing bacterial vs. viral patients. (A) Performance of
clinical and
lab parameters as well as the best performing pair (ANC and Lym %), triplet
(ANC,
Lym % and Pulse), and quadruplets (ANC, Lym %, Pulse, Mono %) of parameters,
the
values of which were combined using a logistic regression. Comparison was done
on
the Majority cohort (bacterial and viral patients, n=653), apart from pulse
(recorded in
292 bacterial and 326 viral patients), and respiratory rate (recorded in 292
bacterial and
326 viral patients). The signature performed significantly better (P<1015)
than the
optimal quadruplet. (B) The signature performed significantly better (P<10-8)
than
biomarkers with a well-established role in the host response to infections.
For each of
the select biomarkers, analysis was performed in a subgroup of the Majority
cohort (43
< n <154 for each analysis, a convenience sample, n depended on the strength
of the
signal). Error bars represent 95% CI.
FIG. 4. Signature performance is robust across different patient subgroups.
Signature AUC in subgroups of the Majority cohort (bacterial and viral) are
depicted.
Square size is proportional to number of patients and error bars represent 95%
CI. In the
Pathogens analysis, each virus was compared to bacteria affecting the same
physiological system, indicated in brackets. R-respiratory, S-systemic, C-
central
nervous system, G-gastrointestinal, U-urinary, K-skin. Only pathogens detected
in more
than 5 patients are presented. For subgroup definitions see Table 1 in Example
1.
FIG. 5. Calibration plot of the MLR model. In the top panel patients were
grouped into 10 bins based on their predicted probabilities of a bacterial
infection (x-
axis), and compared to the observed fraction of bacterial infections within
each bin (y-
axis). Dashed line is a moving average (of size 5 bins). The bottom panel
shows the
distribution of predicted probabilities for bacterial (red bars) and viral
(blue bars).
FIGs. 6A-B. Age distribution of the diagnosed patients. A. The entire study
population (n=794); B. Pediatric patients only (n=445).
Date recue / Date received 202 1-1 1-25
13
FIGs. 7A-B. Distribution of detected pathogens in diagnosed patients (n=794).
A. Distribution of detected pathogens by pathogenic subgroups; B. Distribution
of
detected pathogens by strain (strains detected from >1% of patients are
presented).
Distribution represents % of positive detections in patients with diagnosed
infectious
disease.
FIG. 8. Distribution of involved physiologic systems in patients diagnosed
with
an infectious disease (n=673).
FIGs. 9A-B. Distribution of clinical syndromes (all diagnosed patients,
n=794).
A. Major clinical syndromes; B. Specific clinical syndromes.
FIG. 10. Distribution of maximal body temperatures (n=794).
FIG. 11. Distribution of time from initiation of symptoms (n=794). N/A ¨
healthy controls or patients for which data was not obtained.
FIGs. 12A-B. Comorbidities-related characterization of the patient population.
A. Distribution of comorbidities (all chronically ill patients, n=305); B.
Distribution of
chronic medications (all chronically ill patients, n=305). Of note, some of
the patients
presented with several chronic diseases, and treated with several chronic
medications.
FIG. 13. Distribution of recruitment sites (diagnosed patients, n=794).
FIGs. 14A-B. Extrapolated PPV and NPV values for the signature as a function
of the prevalence of bacterial infections, A. Unanimous (bacterial, viral)
cohort (n=527),
B. Majority (bacterial, viral) cohort (n=653).
FIGs. 15A-E. Scatter plots of clinical parameters and laboratory measurements
in bacterial, viral, and non-infectious patients (as indicated) in the
Majority (bacterial,
viral, non-infectious) cohort (n=765). Red line and circle correspond to group
median
and average respectively. T-test p-values between bacterial and viral groups
and
between infectious (bacterial and viral) vs. non-infectious (including healthy
subjects)
are depicted.
FIGs. 16A-B. Comparison of the performance of the signature and PCT using
different cutoffs. A. Performance measured in 76 patients from the Unanimous
(bacterial, viral) cohort; B. Performance measured in 101 patients from the
Majority
(bacterial, viral) cohort. Error bars represent 95% CI. Signature sensitivity
and
specificity were calculated after filtering out 14% of the patients with a
marginal
immune response.
Date recue / Date received 202 1-1 1-25
14
FIGs. 17A-B. Comparison of the performance of the signature and CRP using
different cutoffs. A. Performance measured in the Unanimous (bacterial, viral)
cohort
(n=527); B. Performance measured in the Majority (bacterial, viral) cohort
(n=653).
Error bars represent 95% CI. Signature sensitivity and specificity were
calculated after
filtering out 14% of the patients with a marginal immune response.
FIGs. 18A-H. Scatter plots of levels of selected protein biomarkers (arbitrary
units) in bacterial and viral patients. Red line and circle correspond to
group median and
average respectively. T-test p-values between bacterial and viral groups are
depicted.
FIGs. 19A-B. The clinical accuracy of the signature is robust to reduction in
the
technical accuracy of protein measurements. (A) The AUCs of the signature
distinguishing bacterial from viral infection are estimated using a color map
as a
function of CVs (std/mean) of TRAIL (y-axis) and CRP (x-axis) measurement. (B)
AUC
values on the diagonal of Figure 19A a presented such that CV of TRAIL and CRP
are
equal.
FIG. 20 is a 3-dimensional visualization of bacterial (`+'), viral ('o') and
non-
infectious (`^') patients. Different patients types are mapped to distinct
regions in the
CRP (jig/m1), TRAIL and IP-10 (pg/ml) concentration map.
FIGs. 21A-C. Probability of viral (A) bacterial or mixed (B) and non-
infectious
or healthy (C) as a function of TRAIL (y-axis), CRP (x-axis), and IP-10
concentrations,
as obtained according to some embodiments of the present invention for IP-10
ranging
from 0 to 100.
FIGs. 22A-C. Probability of viral (A) bacterial or mixed (B) and non-
infectious
or healthy (C) as a function of TRAIL (y-axis), CRP (x-axis), and IP-10
concentrations,
as obtained according to some embodiments of the present invention for IP-10
ranging
from 100 to 200.
FIGs. 23A-C. Probability of viral (A) bacterial or mixed (B) and non-
infectious
or healthy (C) as a function of TRAIL (y-axis), CRP (x-axis), and IP-10
concentrations,
as obtained according to some embodiments of the present invention for IP-10
ranging
from 200 to 300.
FIGs. 24A-C. Probability of viral (A) bacterial or mixed (B) and non-
infectious
or healthy (C) as a function of TRAIL (y-axis), CRP (x-axis), and IP-10
concentrations,
Date recue / Date received 202 1-1 1-25
15
as obtained according to some embodiments of the present invention for IP-10
ranging
from 300 to 400.
FIGs. 25A-C. Probability of viral (A) bacterial or mixed (B) and non-
infectious
or healthy (C) as a function of TRAIL (y-axis), CRP (x-axis), and IP-10
concentrations,
as obtained according to some embodiments of the present invention for IP-10
ranging
from 400 to 500.
FIGs. 26A-C. Probability of viral (A) bacterial or mixed (B) and non-
infectious
or healthy (C) as a function of TRAIL (y-axis), CRP (x-axis), and IP-10
concentrations,
as obtained according to some embodiments of the present invention for IP-10
ranging
.. from 500 to 1000.
FIGs. 27A-C. Probability of viral (A) bacterial or mixed (B) and non-
infectious
or healthy (C) as a function of TRAIL (y-axis), CRP (x-axis), and IP-10
concentrations,
as obtained according to some embodiments of the present invention for IP-10
ranging
from 1000 to 2000.
FIGs. 28A-C. Probability of viral (A) bacterial or mixed (B) and non-
infectious
or healthy (C) as a function of TRAIL (y-axis), CRP (x-axis), and IP-10
concentrations,
as obtained according to some embodiments of the present invention for IP-10
which is
2000 or more.
FIGs. 29A-F illustrate exemplary outputs of the method for distinguishing
between bacterial and non-bacterial infection according to an embodiment of
the present
invention.
FIGs. 30A-B are graphs illustrating the correlation between the rapid and slow
protocol for measurement of TRAIL (Figure 30A) and IP-10 (Figure 30B).
FIG. 31 is a flowchart diagram of a method suitable for analyzing biological
data
obtained from a subject, according to various exemplary embodiments of the
present
invention.
FIGs. 32A-B are schematic illustrations describing a procedure for calculating
a
distance of a surface from a plane according to some embodiments of the
present
invention.
FIGs. 33A-D are schematic illustrations describing a procedure for obtaining
the
smooth version of a segment of a surface, according to some embodiments of the
present
invention.
Date recue / Date received 202 1-1 1-25
16
FIG. 34 is a schematic illustration of a block diagram of a system for
analyzing
biological data, according to some embodiments of the present invention.
FIGs. 35A-D are contour plots describing the probability of bacterial (FIG.
35A),
viral (FIG. 35B), non-bacterial (FIG. 35C), and non-infectious (FIG. 35D)
etiologies as a
function of the coordinates 6o and 61. The probability values range between 0%
(black)
to 100% (white).
FIGs. 36A-B. Low TRAIL levels are indicative or poor patient prognosis and
outcome and high disease severity. (A) TRAIL concentrations in the serum of
patients
that were admitted to the ICU compared to all other patients (with infectious
or non-
infectious etiology). (B) TRAIL concentrations in the serum of pediatric
patients that
were admitted to the ICU or died compared to all other patients with
infectious or non-
infectious etiology.
FIGs. 37A-B are graphs illustrating the difference in TRAIL concentrations in
males and females of fertility age.
FIGs. 38A-E are screenshots of a graphical user interface (GUI) suitable for
receiving user input in a computer-implemented method for analyzing biological
data
according to some embodiments of the present invention.
FIGs. 39A and 39B are schematic illustrations of a block diagram of a system
for analyzing biological data, in embodiments of the invention in which the
system
comprises a network interface (FIG. 39A) and a user interface (FIG. 39B).
DESCRIPTION OF SPECIFIC EMBODIMENTS OF THE INVENTION
The present invention, in some embodiments thereof, relates to computational
analysis, and, more particularly, but not exclusively, to computational
analysis of
biological data, e.g., for the purpose of distinguishing between bacterial
infection and
non-bacterial disease, and/or between a bacterial infection and viral
infection, and/or
between an infectious and non-infectious disease.
Before explaining at least one embodiment of the invention in detail, it is to
be
understood that the invention is not necessarily limited in its application to
the details set
forth in the following description or exemplified by the Examples. The
invention is
capable of other embodiments or of being practiced or carried out in various
ways.
Date recue / Date received 202 1-1 1-25
17
Different infectious agents have unique molecular patterns that can be
identified
and targeted by the immune system. Pathogen-associated molecular patterns
(PAMPs)
are an example of such molecules that are associated with different groups of
pathogens
and may be recognized by cells of the innate immune system using Toll-like
receptors
(TLRs) and other pattern recognition receptors (e.g. NOD proteins).
These patterns may vary considerably between different classes of pathogens
and thus elicit different immune responses. For example, TLR-4 can recognize
lipopolysaccharide, a constituent of gram negative bacteria, as well as
lipoteichoic
acids, constituent of gram positive bacteria, hence promoting an anti-
microbial response
to of the immune system. TLR-3 can recognize single stranded RNA (often
indicative of a
viral infection) and thus prompt the appropriate anti-viral response. By
distinguishing
between different classes of pathogens (e.g bacterial versus viral) the immune
system
can mount the appropriate defense.
In the past few decades, several host markers have been identified that can be
used for differential diagnosis of infection source in various indications. By
measuring
markers derived from the host rather than the pathogen, it is possible to
minimize
"false-positive" diagnoses due to non-pathogenic strains of bacteria that are
part of the
body's natural flora. One example is Procalcitonin (PCT), a precursor of the
hormone
calcitonin produced by the C-cells of the thyroid gland. PCT levels in the
blood stream
of healthy individuals is hardly detectable (in the pg/ml range) but it might
increase
dramatically, as a result of a severe infection with levels rising up to 100
ng/ml. PCT is
heavily used to diagnose patients with systemic infection, sepsis, with
sensitivity of
76% and specificity of 70%. However, studies that tested the diagnostic value
of PCT
in other non-systemic infection such as pneumonia or upper respiratory tract
infections
found it to be limited, especially when used in isolation.
The present inventors previously identified novel sets of biomarkers whose
pattern of expression significantly correlates with infection type - as
documented in
International Patent Application W02011132086 and W02013/117746.
The present invention, in some embodiments thereof, is based on the use of
signature of polypeptides for the diagnosis of bacterial infections, viral
infections and
non-bacterial, non-viral diseases. The methods of the present embodiments
employ
pattern recognition algorithms for the identification of the type of infection
a subject is
Date recue / Date received 202 1-1 1-25
18
suffering from, which in turn allows for the selection of an appropriate
treatment
regimen. Various embodiments of the invention address limitations of current
diagnostic
solutions by: (i) allowing accurate diagnostics on a broad range of pathogens;
(ii)
enabling rapid diagnosis (within minutes); (iii) insensitivity to the presence
of non-
pathogenic bacteria and viruses (thus reducing the problem of false-positive);
and (iv)
eliminating the need for direct sampling of the pathogen, thus enabling
diagnosis of
inaccessible infections. Thus, some methods of the invention allow for the
selection of
subjects for whom antibiotic treatment is desired and prevent unnecessary
antibiotic
treatment of subjects having only a viral infection or a non-infectious
disease. Some
methods of the invention also allow for the selection of subjects for whom
anti-viral
treatment is advantageous.
To corroborate the findings in International Patent Application W02013/117746,
the present inventors have now increased the number of patients taking part in
a multi-
center clinical trial, enrolling 1002 hospital patients with different types
of established
infections as well as controls (patients with established non-viral/non-
bacterial disease
and healthy individuals).
Seeking to improve the level of accuracy and sensitivity of the previously
described methods, the present inventors have now used a trinary classifier,
which
classifies patients (those having an established disease type) into one of
three classes:
.. bacterial infection, viral infection and non-bacterial, non-viral disease.
Comparing the
levels of a combination of polypeptides of a test subject with the expression
patterns
obtained in the study yielded superior results in terms of sensitivity and
specificity
compared to a binary classifier as summarized in Example 3 and Tables 9-12.
In the context of the present invention, the following abbreviations may be
used:
ANC = Absolute neutrophil count; ANN = Artificial neural networks; AUC = Area
under the receiver operating curve; BP = Bordetella pertussis; CHF =
Congestive heart
failure; CI = Confidence interval; CID = Congenital immune deficiency; CLL =
Chronic
lymphocytic leukemia; CMV = Cytomegalovirus; CNS = Central nervous system;
COPD = Chronic obstructive pulmonary disease; CP = Chlamydophila pneumonia;
CRP
.. = C-reactive protein; CSF = Cerebrospinal fluid; CV = Coefficient of
variation; DOR =
Diagnostic odds ratio; EBV = Epstein bar virus; eCRF = Electronic case report
form; ED
= Emergency department, ELISA = Enzyme-linked immunosorbent assay; FDR = False
Date recue / Date received 202 1-1 1-25
19
discovery rate; FMF = Familial Mediterranean fever; G-CSF = Granulocyte colony-
stimulating factor; GM-CSF = Granulocyte-macrophage colony-stimulating factor;
HBV
= Hepatitis B virus; HCV = Hepatitis C virus; HI = Haemophilus influenza; HIV
=
Human immunodeficiency virus; IDE = Infectious disease experts; IL =
Interleukin; IRB
= institutional review board; IVIG = Intravenous immunoglobulin; KNN = K-
nearest
neighbors; LP = Legionella pneumophila; LR+ = Positive likelihood ratio; LR- =
Negative likelihood ratio; LRTI = Lower respiratory tract infections; mAb =
Monoclonal
antibodies; MDD = Minimum detectable dose; MDS = Myelodysplastic syndrome; MP
= Mycoplasma pneumonia; MPD = Myeloproliferative disease; NPV = Negative
to predictive value; PCT = Procalcitonin; PED = Pediatric emergency
department; PPV =
Positive predictive value; QA = Quality assurance; RSV = Respiratory syncytial
virus;
RV = Rhinovirus; SIRS = systemic inflammatory syndrome; SP = Streptococcus
pneumonia; STARD = Standards for Reporting of Diagnostic Accuracy; SVM =
Support
vector machine; TNF = Tumor necrosis factor; URTI = Upper respiratory tract
infection;
UTI = Urinary tract infection; WBC = White blood cell; WS = Wilcoxon rank-sum.
In the context of the present invention, the following statistical terms may
be
used:
"TP" is true positive, means positive test result that accurately reflects the
tested-for activity. For example in the context of the present invention a TP,
is for
example but not limited to, truly classifying a bacterial infection as such.
"TN" is true negative, means negative test result that accurately reflects the
tested-for activity. For example in the context of the present invention a TN,
is for
example but not limited to, truly classifying a viral infection as such.
"FN" is false negative, means a result that appears negative but fails to
reveal a
situation. For example in the context of the present invention a FN, is for
example but
not limited to, falsely classifying a bacterial infection as a viral
infection.
"FP" is false positive, means test result that is erroneously classified in a
positive category. For example in the context of the present invention a FP,
is for
example but not limited to, falsely classifying a viral infection as a
bacterial infection.
"Sensitivity" is calculated by TP/(TP+FN) or the true positive fraction of
disease
subj ects.
Date recue / Date received 202 1-1 1-25
20
"Specificity" is calculated by TN/(TN+FP) or the true negative fraction of non-
disease or normal subjects.
"Total accuracy" is calculated by (TN + TP)/(TN + FP +TP + FN).
"Positive predictive value" or "PPV" is calculated by TP/(TP+FP) or the true
positive fraction of all positive test results. It is inherently impacted by
the prevalence
of the disease and pre-test probability of the population intended to be
tested.
"Negative predictive value" or "NPV" is calculated by TN/(TN + FN) or the
true negative fraction of all negative test results. It also is inherently
impacted by the
prevalence of the disease and pre-test probability of the population intended
to be
tested. See, e.g., O'Marcaigh AS, Jacobson RM, "Estimating The Predictive
Value Of
A Diagnostic Test, How To Prevent Misleading Or Confusing Results," Clin. Ped.
1993, 32(8): 485-491, which discusses specificity, sensitivity, and positive
and negative
predictive values of a test, e.g., a clinical diagnostic test.
"MCC" (Mathews Correlation coefficient ) is calculated as follows: MCC = (TP
* TN¨FP * FN)/ {(TP + FN) * (TP + FP) * (TN + FP) * (TN + FN)}^0.5
where TP, FP, TN, FN are true-positives, false-positives, true-negatives, and
false-
negatives, respectively. Note that MCC values range between -1 to +1,
indicating
completely wrong and perfect classification, respectively. An MCC of 0
indicates
random classification. MCC has been shown to be a useful for combining
sensitivity
and specificity into a single metric (Baldi, Brunak et al. 2000). It is also
useful for
measuring and optimizing classification accuracy in cases of unbalanced class
sizes
(Baldi, Brunak et al. 2000).
"Accuracy" refers to the degree of conformity of a measured or calculated
quantity (a test reported value) to its actual (or true) value. Clinical
accuracy relates to
the proportion of true outcomes (true positives (TP) or true negatives (TN)
versus
misclassified outcomes (false positives (FP) or false negatives (FN)), and may
be stated
as a sensitivity, specificity, positive predictive values (PPV) or negative
predictive
values (NPV), Mathews correlation coefficient (MCC), or as a likelihood, odds
ratio,
Receiver Operating Characteristic (ROC) curve, Area Under the Curve (AUC)
among
other measures.
"Analytical accuracy" refers to the reproducibility and predictability of the
measurement process itself, and may be summarized in such measurements as
Date recue / Date received 202 1-1 1-25
21
coefficients of variation (CV), Pearson correlation, and tests of concordance
and
calibration of the same samples or controls with different times, users,
equipment and/or
reagents. These and other considerations in evaluating new biomarkers are also
summarized in Vasan, 2006.
"Performance" is a term that relates to the overall usefulness and quality of
a
diagnostic or prognostic test, including, among others, clinical and
analytical accuracy,
other analytical and process characteristics, such as use characteristics
(e.g., stability,
ease of use), health economic value, and relative costs of components of the
test. Any
of these factors may be the source of superior performance and thus usefulness
of the
test, and may be measured by appropriate "performance metrics," such as AUC
and
MCC, time to result, shelf life, etc. as relevant.
By "statistically significant", it is meant that the alteration is greater
than what
might be expected to happen by chance alone (which could be a "false
positive").
Statistical significance can be determined by any method known in the art.
Commonly
used measures of significance include the p-value, which presents the
probability of
obtaining a result at least as extreme as a given data point, assuming the
data point was
the result of chance alone. A result is often considered highly significant at
a p-value of
0.05 or less.
Aspects of the invention will now be described in detail.
FIG. 31 is a flowchart diagram of a method suitable for analyzing biological
data obtained from a subject, according to various exemplary embodiments of
the
present invention. It is to be understood that, unless otherwise defined, the
operations
described hereinbelow can be executed either contemporaneously or sequentially
in
many combinations or orders of execution. Specifically, the ordering of the
flowchart
diagrams is not to be considered as limiting. For example, two or more
operations,
appearing in the following description or in the flowchart diagrams in a
particular order,
can be executed in a different order (e.g., a reverse order) or substantially
contemporaneously. Additionally, several operations described below are
optional and
may not be executed.
In some embodiments of the present invention the subject has been previously
treated with an antibiotic, and in some embodiments of the present invention
the subject
has not been previously treated with an antibiotic.
Date recue / Date received 202 1-1 1-25
22
Any of the methods described herein can be embodied in many forms. For
example, it can be embodied in on a tangible medium such as a computer for
performing
the method operations. It can be embodied on a computer readable medium,
comprising
computer readable instructions for carrying out the method operations. It can
also be
embodied in electronic device having digital computer capabilities arranged to
run the
computer program on the tangible medium or execute the instruction on a
computer
readable medium.
Computer programs implementing the method of the present embodiments can
commonly be distributed to users on a distribution medium such as, but not
limited to,
to CD-ROMs or flash memory media. From the distribution medium, the computer
programs can be copied to a hard disk or a similar intermediate storage
medium. In
some embodiments of the present invention, computer programs implementing the
method of the present embodiments can be distributed to users by allowing the
user to
download the programs from a remote location, via a communication network,
e.g., the
internet. The computer programs can be run by loading the computer
instructions either
from their distribution medium or their intermediate storage medium into the
execution
memory of the computer, configuring the computer to act in accordance with the
method
of this invention. All these operations are well-known to those skilled in the
art of
computer systems.
The computational operations of the method of the present embodiments can be
executed by a computer, either remote from the subject or near the subject.
When the
computer is remote from the subject, it can receive the data over a network,
such as a
telephone network or the Internet. To this end, a local computer can be used
to transmit
the data to the remote computer. This configuration allows performing the
analysis
while the subject is at a different location (e.g., at home), and also allows
performing
simultaneous analyses for multiple subjects in multiple different locations.
The computational operations of the method can also be executed by a cloud
computing resource of a cloud computing facility. The cloud computing resource
can
include a computing server and optionally also a storage server, and can be
operated by
a cloud computing client as known in the art.
The method according to some embodiments may be used to "rule in" a bacterial
infection. Alternatively, the method may be used to rule out a non-bacterial
infection.
Date recue / Date received 202 1-1 1-25
23
The method according to some embodiments can be used to "rule out" a bacterial
infection and "rule in" a non-bacterial disease.
The method according to some embodiments may be used to "rule in" a viral
infection. Alternatively, the method may be used to rule out a non-viral
infection.
The method according to some embodiments can be used to "rule out" a viral
infection and "rule in" a non-viral disease.
The method according to some embodiments may be used to "rule in" an
infectious disease. Alternatively, the method may be used to rule out a non-
infectious
disease. The method according to some embodiments can be used to "rule out" an
infectious disease and "rule in" a non-infectious disease.
The biological data analyzed by the method contain expression values of a
plurality of polypeptides in the blood of a subject. In some embodiments the
biological
data comprises expression values of only two polypeptides, in some embodiments
the
biological data comprises expression values of at least three polypeptides, in
some
embodiments biological data comprises expression values of only three
polypeptides, in
some embodiments biological data comprises expression values of at least four
polypeptides, in some embodiments biological data comprises expression values
of only
four polypeptides, in some embodiments biological data comprises expression
values of
at least five polypeptides, and in some embodiments biological data comprises
expression values of only five polypeptides.
The present Inventors contemplate many types of polypeptides. Representative
examples include, without limitation, CRP, IP-10, TRAIL, IL lra, PCT and SAA.
In
some embodiments the plurality of polypeptides comprises at least CRP and
TRAIL, and
in some embodiments the plurality of polypeptides comprises at least CRP,
TRAIL and
IP-10.
In some embodiments of the present invention, the biological data is provided
in
the form of a subject-specific dataset, as further detailed herein.
According to a particular embodiment, the levels of secreted (i.e. soluble)
polypeptides (e.g., TRAIL, CRP and IP-10) are analyzed by the method.
The term "subject" as used herein is preferably a human. A subject can be male
or female. The subject may be a newborn, baby, infant or adult. A subject can
be one
who has been previously diagnosed or identified as having an infection, and
optionally
Date recue / Date received 202 1-1 1-25
24
has already undergone, or is undergoing, a therapeutic intervention for the
infection.
Alternatively, a subject can also be one who has not been previously diagnosed
as
having an infection. For example, a subject can be one who exhibits one or
more risk
factors for having an infection. A subject may also have an infection but show
no
symptoms of infection.
The subject whose disease is being diagnosed according to some embodiments of
the present invention is referred to below as the "test subject". The present
Inventors
have collected knowledge regarding the expression pattern of polypeptides, of
a plurality
of subjects whose disease has already been diagnosed, and have devised the
analysis
to technique of the present embodiments based on the collected knowledge.
This plurality
of subjects is referred to below as "pre-diagnosed subjects" or "other
subjects".
As used herein, the phrase "bacterial infection" refers to a condition in
which a
subject is infected with a bacterium. The infection may be symptomatic or
asymptomatic. In the context of this invention, the bacterial infection may
also comprise
a viral component (i.e. be a mixed infection being the result of both a
bacteria and a
virus).
The bacterial infection may be acute or chronic.
An acute infection is characterized by rapid onset of disease, a relatively
brief
period of symptoms, and resolution within days. A chronic infection is an
infection that
develops slowly and lasts a long time. One difference between acute and
chronic
infection is that during acute infection the immune system often produces IgM+
antibodies against the infectious agent, whereas the chronic phase of the
infection is
usually characteristic of IgM-/IgG+ antibodies. In addition, acute infections
cause
immune mediated necrotic processes while chronic infections often cause
inflammatory
mediated fibrotic processes and scaring. Thus, acute and chronic infections
may elicit
different underlying immunological mechanisms.
The bacterial infection may be the result of gram-positive, gram-negative
bacteria or atypical bacteria.
The term "Gram-positive bacteria" as used herein refers to bacteria
characterized
by having as part of their cell wall structure peptidoglycan as well as
polysaccharides
and/or teichoic acids and are characterized by their blue-violet color
reaction in the
Gram-staining procedure. Representative Gram-positive bacteria include:
Actinomyces
Date recue / Date received 202 1-1 1-25
25
spp., Bacillus anthracis, Bifidobacterium spp., Clostridium botulinum,
Clostridium
perfringens, Clostridium spp., Clostridium tetani, Corynebacterium
diphtheriae,
Corynebacterium jeikeium, Enterococcus faecalis, Enterococcus faecium,
Erysipelothrix rhusiopathiae, Eubacterium spp., Gardnerella vaginalis, Gemella
morbillorum, Leuconostoc spp., Mycobacterium abcessus, Mycobacterium avium
complex, Mycobacterium chelonae, Mycobacterium fortuitum, Mycobacterium
haemophilium, Mycobacterium kansasii, Mycobacterium leprae, Mycobacterium
marinum, Mycobacterium scrofulaceum, Mycobacterium smegmatis, Mycobacterium
terrae, Mycobacterium tuberculosis, Mycobacterium ulcerans, Nocardi a spp.,
to Peptococcus niger, Peptostreptococcus spp., Proprionibacterium spp.,
Staphylococcus
aureus, Staphylococcus auricularis, Staphylococcus capitis, Staphylococcus
cohnii,
Staphylococcus epidermidis, Staphylococcus haemolyticus, Staphylococcus
hominis,
Staphylococcus lugdanensis, Staphylococcus saccharolyticus, Staphylococcus
saprophyticus, Staphylococcus schleiferi, Staphylococcus similans,
Staphylococcus
warneri, Staphylococcus xylosus, Streptococcus agalactiae (group B
streptococcus),
Streptococcus anginosus, Streptococcus bovis, Streptococcus canis,
Streptococcus equi,
Streptococcus milleri, Streptococcus mitior, Streptococcus mutans,
Streptococcus
pneumoniae, Streptococcus pyogenes (group A streptococcus), Streptococcus
salivarius,
Streptococcus sanguis.
The term "Gram-negative bacteria" as used herein refer to bacteria
characterized
by the presence of a double membrane surrounding each bacterial cell.
Representative Gram-negative bacteria include Acinetobacter calcoaceticus,
Actinobacillus actinomycetemcomitans, Aeromonas hydrophila, Alcaligenes
xylosoxidans, Bacteroides, Bacteroides fragilis, Bartonella bacilliformis,
Bordetella
spp., Borrelia burgdorferi, Branhamella catarrhalis, Brucella spp.,
Campylobacter spp.,
Chalmydia pneumoniae, Chlamydia psittaci, Chlamydia trachomatis,
Chromobacterium
violaceum, Citrobacter spp., Eikenella corrodens, Enterobacter aerogenes,
Escherichia
coli, Flavobacterium meningosepticum, Fusobacterium spp., Haemophilus
influenzae,
Haemophilus spp., Helicobacter pylori, Klebsiella spp., Legionella spp.,
Leptospira
spp., Moraxella catarrhalis, Morganella morganii, Mycoplasma pneumoniae,
Neisseria
gonorrhoeae, Neisseria meningitidis, Pasteurella multocida, Plesiomonas
shigelloides,
Prevotella spp., Proteus spp., Providencia rettgeri, Pseudomonas aeruginosa,
Date recue / Date received 202 1-1 1-25
26
Pseudomonas spp., Rickettsia prowazekii, Rickettsia rickettsii, Rochalimaea
spp.,
Salmonella spp., Salmonella typhi, Serratia marcescens, Shigella spp.,
Treponema
carateum, Treponema pallidum, Treponema pallidum endemicum, Treponema
pertenue,
Veillonella spp., Vibrio cholerae, Vibrio vulnificus, Yersinia enterocolitica
and Yersinia
pestis.
The term "Atypical bacteria" refers to bacteria that do not fall into one of
the
classical "Gram" groups. Typically they are intracellular bacterial pathogens.
They
include, without limitations, Mycoplasmas spp., Legionella spp. Rickettsiae
spp., and
Chlamy di ae spp.
to The term "non-bacterial disease" as used herein, refers to any disease
or
condition that is not caused by infectious bacteria.
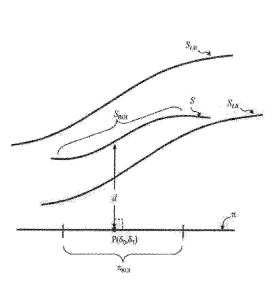
Referring to FIG. 31, the method begins at 310 and continues to 311 at which a
first distance d between a segment SRO I of a first curved object Sand a non-
curved object
7C is calculated. Generally, the first curved object S is a manifold in n
dimensions, where
n is a positive integer, and the non-curved object 7C is a hyperplane in an
n+1
dimensional space.
The concept of n-dimensional manifolds and hyperplanes in n+1 dimensions are
well known to those skilled in the art of geometry. For example, when n=1 the
first
curved object is a curved line, and the non-curved object 7C is a hyperplane
in 2
dimensions, namely a straight line defining an axis. When n=2, the first
curved object is
a curved surface, and the non-curved object 7C is a hyperplane in 3
dimensions, namely a
flat plane, referred to below as "a plane".
The hyperplane it is defined by n directions. For example, when the non-curved
object is an axis, it is defined by a single direction, and when the non-
curved object is a
plane it is defined by two directions, referred to as a first direction and a
second
direction.
The distance between the manifold S and hyperplane 7C is calculated at a point
P
over the hyperplane. P is defined by n coordinates. For example, when the
hyperplane
is an axis, P is defined by a single coordinate 81, along the single
direction, and when the
hyperplane is a plane, P is define by a pair of coordinates denoted (80, 61),
where 80 is
referred to as "a first coordinate" and is defined along the first direction,
and 81 is
referred to as "a second coordinate" and is defined along the second
direction. Unless
Date recue / Date received 202 1-1 1-25
27
explicitly stated otherwise, a reference to coordinate 80 describes an
optional
embodiment which is contemplated when S is a surface and 7C is a plane.
The directions are denoted using the same Greek letters as the respective
coordinates, except that the directions are denoted by underlined Greek
letters to indicate
that these are vectors. Thus, the first direction is denoted 80, and the
second direction is
denoted 81.
FIG. 32A illustrates the hyperplane 7C for the case of n=2. In these
embodiments,
7C is a plane defined by directions 8o and 81. Also shown is a point P at (so,
81).
Directions 80 and 81, are shown orthogonal to each other, but this need not
necessarily be
the case, since the angle between 80 and 81 can be different from 90 . Within
the plane
7C, there is a planar region-of-interest nizoi spanning from a minimal first
coordinate
8o,miN to a maximal first coordinate 8o,mAx along direction 8o, and from a
minimal
second coordinate 81,miN to a maximal second coordinate 81,mAx along direction
81. The
point P is within the region-of-interest nRoi. When n=1 (not shown), 7C is an
axis and the
region-of-interest nizoi is a linear segment of 7C spanning from 81,miN to
81,mAx along
direction 81.
The calculation of the first distance d is illustrated in FIG. 32B which
illustrates
the hyperplane 7C and manifold S. The distance d is measured from S to the
point P.
perpendicularly to 7t. It is to be understood that while each of objects 7C
and S is
illustrated as a one dimensional line, this need not necessarily be the case,
since S and 7C
are generally n-dimensional mathematical objects. For example, when S is a
surface and
7C is a plane both 7C and S are two dimensional mathematical objects. The
segment SROI
of S is above a region-of-interest nRoi. For example, when 7C is a plane nizoi
is a planar
region-of-interest, and when 7C is an axis, nizoi is a linear segment along
the axis. Thus,
7CRoi is the projection of SRoi on 7t. For n=2, SRoi is preferably a non-
planar segment of
(the surface) S, and for 12=1, SROI is preferably a curved segment of (the
curve) S.
Each of the n coordinates is defined by a combination of expression values of
the
polypeptides. For example, for n=1, the coordinate 81 is defined by a
combination of
expression values of the polypeptides, and for n=2 each of the coordinates 80
and 81 is
defined by a different combination of expression values of the polypeptides.
Date recue / Date received 202 1-1 1-25
28
For example, 81 and optionally also 80 are combinations of the polypeptides,
according to the following equation:
80 ao + aith + a2D2 + + (1)0
81 = bo + bith + b2D2 + +
where ao, and bo, are constant and predetermined coefficients, and
each of the
variables Di, D2, ... is an expression levels of one of the polypeptides, and
(1)0 and (1)1 are
functions that are nonlinear with respect to at least one of the expression
levels.
Each of the functions (1)0 and (1)1 is optional and may, independently, be set
to zero
(or, equivalently, not included in the calculation of the respective
coordinate). When
(1)0=0 the coordinate 80 is a combination of the polypeptides, and when (1)1=0
the
coordinate 81 is a combination of the polypeptides.
The nonlinear functions (1)0 and (1)1 can optionally and preferably be
expressed as a
sub of powers of expression levels, for example, according to the following
equations:
(I)o =
(1:11 =
where i is a summation index, qi and ri are sets of coefficients, Xi e {Di,
D2, ...}, and
each of yi and Xi is a numerical exponent. Note that the number of terms in
each of the
nonlinear functions (1)0 and (1)1 does not necessarily equals the number of
the
polypeptides, and that two or more terms in each sum may correspond to the
same
polypeptide, albeit with a different numerical exponent.
Representative examples of coefficients suitable for the present embodiments
are
provided in the Examples section that follows (see Tables 3, 13-17, 29 and 31-
36).
When (1)0=0, (1)1=0 and the polypeptides include TRAIL, 80 is optionally and
preferably an increasing function of an expression value of TRAIL, and 81 is a
decreasing function of TRAIL. When (1)0=0, (1)1=0 and the polypeptides include
CRP, 61
and optionally also 80 are optionally and preferably increasing functions of
an
expression value of CRP. When the polypeptides include IP-10, 61 and
optionally also
80 are optionally and preferably are increasing functions of an expression
value of IP-10.
In embodiments in which (1)0=0, (1)1=0 and the polypeptides include TRAIL, CRP
and IP-10, each 6o and 61 can be a linear combination of TRAIL, CRP and IP-10,
according to the following equation:
Date recue / Date received 202 1-1 1-25
29
8o = ao + aiC + azI + a3T
81 = bo + biC + b21 + b3T,
where C, I and T are, respectively, the expression levels of CRP, IP-10 and
TRAIL.
Preferably, both al and bi are positive. Preferably both az and bz are
positive.
Preferably, a3 is positive, and b3 is negative. Representative examples of
coefficients suitable for the embodiments in which the combination is linear
combination and the polypeptides are CRP, IP-10 and TRAIL are provided in the
Examples section that follows (see Tables 3, 13-17 and 33).
In embodiments in which (1)00, (I)]*) and the polypeptides include TRAIL, CRP
to and IP-10, each 60 and 81 can be a combination of TRAIL, CRP and IP-10,
according to
the following equations:
ö = ao + aiC + azI + a3T + (1)0
81 = bo + biC + b2I + b3T + (1)1,
where each of (Im and (1)1 is a nonlinear function of at least one or at least
two of C, I and
T. As a representative example, (1)0 and (1)1 can be expressed as:
(I)o = q1C71 + q2C72 + q3TY3
4)1 = riC71 + r202 + r3T73.
Representative examples of coefficients suitable for the embodiments in which
the polypeptides are CRP, IP-10 and TRAIL and the nonlinear functions are not
taken to
be zero are provided in the Examples section that follows (see Table 36).
The boundaries Oo,miN, 8o,mAx, 81,miN and Oi,mAx of nizoi preferably
correspond to
the physiologically possible ranges of the expression values of the
polypeptides.
When measured using the protocols described in Example 8, more preferably
Example 9, below, the physiologically possible ranges are typically from 0 to
about 400
ug/ml (CRP), from 0 to about 3000pg/m1 (IP-10), and from 0 to about 700 pg/ml
(TRAIL). Some subjects may exhibit concentrations that lie outside these
ranges. - In
various exemplary embodiments of the invention, when the expression values of
TRAIL,
CRP and IP-10 are measured according to the protocol described in Example 8,
more
preferably Example 9, below, the values of the coefficients ao,..,a3 and bo,..
.,b3 are taken
from Table 3, below, and the boundaries of nRoi are: 80,miN=- -1.3 80,mAx=45
81,miN=-
14.3 and 81,MAX=49.6.
Date recue / Date received 202 1-1 1-25
30
When the expression values of TRAIL, CRP and IP-10 are measured by a
protocol which is different from the protocol described in Example 8, more
preferably
Example 9, below, the values of the coefficients ao,..,a3 and b0,. ..,b3 are
different from
the values in Table 3 below, and therefore the boundaries of nizoi are also
different from
the above values. In such cases, the values of the coefficients and boundaries
are
correlative to the aforementioned values wherein the correlation for each
coefficient and
boundary is derived from the correlation between the expression value of the
respective
protein as measured according to the protocol described in Example 8, more
preferably
Example 9, and the expression value of the respective protein as actually
measured.
to At least a major part of the segment SROI of curved object S is between
two
curved objects referred to below as a lower bound curved object SLB and an
upper bound
curved object SUB.
As used herein "major part of the segment SROI" refers to a part of a smoothed
version SRoi whose length (when n=1), surface area (when n=2) or volume (when
nA)
is 60% or 70% or 80% or 90% or 95% or 99% of a smoothed version of the length,
surface area or volume of SRoi, respectively.
As used herein, "a smooth version of the segment SROI" refers to the segment
SROI, excluding regions of SROI at the vicinity of points at which the
Gaussian curvature
is above a curvature threshold, which is X times the median curvature of SROI,
where X
is 1.5 or 2 or 4 or 8.
The following procedure can be employed for the purpose of determining
whether the major part of the segment SROI is between SLB and SUB. Firstly, a
smoothed
version of the segment SROI is obtained. Secondly, the length (when n=1),
surface area
(when n=2) or volume (when ri3) Ai of the smoothed version of the segment SROI
is
calculated. Thirdly, the length (when n=1) surface area (when n=2) or volume
(when
ri3) Az of the part of the smoothed version of the segment SRoi that is
between SLB and
SUB is calculated. Fourthly, the percentage of Az relative to Ai is
calculated.
FIGs. 33A-D illustrates a procedure for obtaining the smooth version of SROI.
For clarity of presentation, SROI is illustrated as a one dimensional segment,
but
the skilled person would understand that SROI is generally an n-dimensional
mathematical object. The Gaussian curvature is calculated for a sufficient
number of
sampled points on SROI. For example, when the manifold is represented as point
cloud,
Date recue / Date received 202 1-1 1-25
31
the Gaussian curvature can be calculated for the points in the point cloud.
The median
of the Gaussian curvature is then obtained, and the curvature threshold is
calculated by
multiplying the obtained median by the factor X. FIG. 33A illustrates SRoi
before the
smoothing operation. Marked is a region 320 having one or more points 322 at
which
the Gaussian curvature is above the curvature threshold. The point or points
at which
with the Gaussian curvature is maximal within region 320 is removed and region
320 is
smoothly interpolated, e.g., via polynomial interpolation, (FIG. 33B). The
removal and
interpolation is repeated iteratively (FIG. 33C) until the segment SROI does
not contain
regions at which the Gaussian curvature is above the curvature threshold (FIG.
33D).
When n=1 (namely when S is a curved line), SIB is a lower bound curved line,
and SUB an upper bound curved line. In these embodiments, SLB and SUB can be
written
in the form:
SLB = ROO-6o,
SUB = f(031) 61
where f(81) is a probabilistic classification function of the coordinate 81
(along the
direction L) which represents the likelihood that the test subject has a
bacterial
infection. In some embodiments of the invention f(81)=1/(1+exp(81)). Both SLB
and SUB
are positive for any value of 81 within 7cRoi. Also contemplated, are
embodiments in
which f(81) is a probabilistic classification function which represents the
likelihood that
the test subject has a viral infection. Further contemplated, are embodiments
in which
f(81) is a probabilistic classification function which represents the
likelihood that the test
subject has an infection.
When n=2 (namely when S is a curved surface), SLB is a lower bound curved
surface, and SUB an upper bound curved surface. In these embodiments, SLB and
SUB can
be written in the form:
SLB = f(80,81)-E0,
SUB - g80,81)+El
where f(80,81) is a probabilistic classification function of the first and
second coordinates
(along the first and second directions) which represents the likelihood that
the test
subject has a bacterial infection. In some
embodiments of the invention
Date recue / Date received 202 1-1 1-25
32
Po,81)=exp(61)/(1+exp(80)+exp(81)). Both SLB and SUB are positive for any
value of 6o
and 61 within nRoi.
In any of the above embodiments each of the parameters ao and al is less than
0.5
or less than 0.4 or less than 0.3 or less than 0.2 or less than 0.1 or less
than 0.05.
Referring again to FIG. 31, the method proceeds to 312 at which the calculated
distance d is correlated to the presence of, absence of, or likelihood that
the subject has,
a disease or condition corresponding to the type of the probabilistic function
f. For
example, when the probabilistic function f represents the likelihood that the
test subject
has a bacterial infection, the calculated distance d is correlated to the
presence of,
absence of, or likelihood that the subject has, a bacterial infection.
In various exemplary embodiments of the invention the correlation includes
determining that the distance d is the likelihood that the subject has a
bacterial infection.
The likelihood is optionally and preferably compared to a predetermined
threshold coB,
wherein the method can determine that it is likely that the subject has a
bacterial
infection when the likelihood is above coB, and that it is unlikely that the
subject has a
bacterial infection otherwise. Typical values for COB include, without
limitation, about
0.2, about 0.3, about 0.4, about 0.5, about 0.6 and about 0.7. Other
likelihood thresholds
are also contemplated.
In some embodiments of the present invention, when the method determines that
it is likely that the subject has a bacterial infection, the subject is
treated (316) for the
bacterial infection, as further detailed herein.
The present inventors found a probabilistic classification function g(60,81)
which
represents the likelihood that the test subject has a viral infection. In
various exemplary
embodiments of the invention g(60,61) equals exp(60)/(1+exp(60)+exp(61)).
The function g can, according to some embodiments of the present invention, be
utilized also for estimating the presence of, absence of, or likelihood that
the subject has,
a viral infection. Thus, in some embodiments, the method proceeds to 313 at
which a
second distance between a segment of a second curved surface and the plane 7C
is
calculated, and 314 at which the second distance is correlated to the presence
of, absence
of, or likelihood that the subject has, a viral infection. The procedure and
definitions
corresponding to 313 and 314 are similar to the procedure and definitions
corresponding
to 311 and 312 described above, mu/ails mutandis. Thus, for example, a major
part of
Date recue / Date received 202 1-1 1-25
33
the segment of the second surface is between a second lower bound surface
g(80,81)-62
and a second upper bound surface g(80,61)+83, wherein each of az and E3 is
less than 0.5
or less than 0.4 or less than 0.3 or less than 0.2 or less than less than 0.1
or less than
0.05.
In some embodiments of the present invention, when the method determines that
it is likely that the subject has a viral infection, the subject is treated
(316) for the viral
infection, as further detailed herein.
In various exemplary embodiments of the invention the correlation includes
determining that the second distance is the likelihood that the subject has a
viral
infection. The likelihood is optionally and preferably compared to a
predetermined
threshold coy, wherein the method can determine that it is likely that the
subject has a
viral infection when the likelihood is above coy, that it is unlikely that the
subject has a
viral infection otherwise. Typical values for cov include, without limitation,
about 0.5,
about 0.6 about 0.7 and about 0.8. Other likelihood thresholds are also
contemplated.
In embodiments in which operations 313 and 314 are executed, operations 311
and 312 can be either executed or not executed. For example, the present
embodiments
contemplate a procedure in which operations 311 and 312 are not executed, and
the
method determines the likelihood that the subject has a viral infection,
without
calculating the first distance and without correlating the first distance to
the presence of,
absence of, or likelihood that the subject has, a bacterial infection.
Alternatively, all operations 311-314 can be executed, wherein 311 and 312 are
executed irrespectively of the outcome of 314, and 313 and 314 are executed
irrespectively of the outcome of 312. In these embodiments, the method
optionally and
preferably determines both the likelihood that the subject has a bacterial
infection, and
.. the likelihood that the subject has a viral infection. Each of these
likelihoods can be
compared to the respective predetermined threshold (coB or coy). When each of
the
likelihoods is below the respective threshold, the method can determine that
the patient
is likely to have a non-bacterial and non-viral infectious disease. For
example, the
method can determine that it is likely that the subject has a non-infectious
disease, a
fungal disease or a parasitic disease.
Still alternatively, whether or not some operations are executed is dependent
on
the outcome of one or more other operations. For example, the method can
execute 311
Date recue / Date received 202 1-1 1-25
34
and 312, so as to determine the likelihood that the subject has a bacterial
infection.
Thereafter, the determined likelihood is compared to the threshold coB. The
method
skips the execution of 313 and 314 if the determined likelihood is above coB,
and
executes 313 and 314 otherwise. Another example of these embodiments is a
procedure
in which the method executes 313 and 314, so as to determine the likelihood
that the
subject has a viral infection. Thereafter, the determined likelihood is
compared to the
threshold coy. The method skips the execution of 311 and 312 if the determined
likelihood is above cov, and executes 311 and 312 otherwise.
The method optionally and preferably continues to 315 at which an output of
the
likelihood(s) is generated. The output can be presented as text, and/or
graphically and/or
using a color index. The output can optionally include the results of the
comparison to
the threshold coB. FIGs. 29A-F and 38A-E illustrate exemplary outputs suitable
for
distinguishing between bacterial and non-bacterial infection according to an
embodiment
of the present invention.
The method ends at 317.
FIGs. 38A-E are screenshots of a graphical user interface (GUI) suitable for
receiving user input in a computer-implemented method for analyzing biological
data
according to some embodiments of the present invention.
The GUI comprises a calculation activation control 390, that may be in the
form
of a button control. The GUI may also comprise a plurality of expression value
input
fields 380, wherein each expression value input field is configured for
receiving from a
user an expression value of a polypeptide in the blood of a subject. The user
feeds into
the input fields the expression values of the polypeptides. Alternatively, the
expression
values are can be received by establishing a communication between the
computer and
an external machine (not shown) that measures the expression values. In these
embodiments, it is not necessary for the user to manually feed the expression
values into
the input fields. In some embodiments, the GUI comprises a communication
control
392, e.g., in the form of a button control, wherein the communication with the
external
machine is in response to an activation of the communication control by the
user.
Responsively to an activation of control 390 by the user, the computer
calculates
a score based on the expression values as received automatically or via fields
380. The
core can be the likelihood that the subject has a bacterial infection and/or a
viral
Date recue / Date received 202 1-1 1-25
35
infection. The score can be calculated for example, by calculating a distance
between a
curved surface and a plane defined by the two directions as further detailed
hereinabove.
A graphical scale 382 can be generated on the GUI. The graphical scale can
include a first end, identified as corresponding to a viral infection, and a
second end,
identified as corresponding to a bacterial infection.
Once the score is calculated, a mark 394 can optionally and preferably be made
on the graphical 382 at a location corresponding to the calculated likelihood.
FIG. 38A
shows the GUI before the values have been fed into the input fields, FIG. 38B
shows
mark 394 on scale 382 at a location that corresponds to a likelihood of 96%
that the
to infection is bacterial, and FIG. 38C shows mark 394 on scale 382 at a
location that
corresponds to a likelihood of 1% that the infection is bacterial (or,
equivalently,
likelihood of 99% that the infection is viral). Optionally, the GUI also
displays the
calculated score numerically.
The GUI optionally and preferably includes one or more additional controls
386,
388 that may be in the form of button controls. For example, control 388 can
instruct
the computer to clear the input fields 380 when the user activates the control
388. This
allows the user to feed values that correspond to a different sample. In some
embodiments, the GUI also generates an output 384 that summarizes the results
of the
previous samples. Control 386 can instruct the computer to clear the input
fields 380 as
well as the output 384 when the user activates the control 386. This allows
the user to
begin a new run (optionally with multiple samples) without logging out of the
GUI.
A representative example of a protocol suitable for the present embodiments is
as
follows.
The GUI presents an authenticated user with a dialog that allows the user to
feed
in quality control (QC) values of an experiment. The QC is validated, and the
GUI in
FIG. 38A is generated. The user feeds in the expression values in fields 380
and activate
control 390 to receive the result (e.g., FIGs. 38B and 38C). To feed in
expression values
of another blood sample the user activates control 388. The result of each
sample is
added to output 384 which can be, for example, in the form of a table. To
enter a new
experiment without closing the software or logging out the user activates
control 386 to
clear output 384 and enter new QC values. Preferably, all the operations are
logged in
one or more log files.
Date recue / Date received 202 1-1 1-25
36
In some embodiments of the present invention GUI also includes a report screen
(FIGs. 38D and 38E) that displays the results of previous experiments, for
example, in
response to a date based request.
It will be appreciated that the polypeptide names presented herein are given
by
way of example. Many alternative names, aliases, modifications, isoforms and
variations will be apparent to those skilled in the art. Accordingly, it is
intended to
embrace all the alternative protein names, aliases, modifications isoforms and
variations.
Gene products, are identified based on the official letter abbreviation or
gene
to symbol assigned by the international Human Genome Organization Naming
Committee
(HGNC) and listed at the date of this filing at the US National Center for
Biotechnology
Information (NCBI) web site also known as Entrez Gene.
TRAIL: The protein, TNF Related Apoptosis Inducing Ligand (TRAIL),
encoded by this gene is a cytokine that belongs to the tumor necrosis factor
(TNF)
ligand family. Additional names of the gene include without limitations APO2L,
TNF-
related apoptosis-inducing ligand, TNFSF10 and CD253. TRAIL exists in a
membrane
bound form and a soluble form, both of which can induce apoptosis in different
cells,
such as transformed tumor cells. This protein binds to several members of the
TNF
receptor superfamily such as TNFRSF 10A/TRAILR1, NFRSF 10B/TRAILR2,
NFRSF10C/TRAILR3, TNFRSF10D/TRAILR4, and possibly also to NFRSF11B/OPG.
The activity of this protein may be modulated by binding to the decoy
receptors such as
NFRSF 10C/TRAILR3, TNFRSF 10D/TRAILR4, and NFRSF11B/OPG that cannot
induce apoptosis. The binding of this protein to its receptors has been shown
to trigger
the activation of MAPK8/JNK, caspase 8, and caspase 3. Alternatively spliced
transcript variants encoding different isoforms have been found for this gene.
TRAIL
can be proteolytically cleaved from the cell surface to produce a soluble form
that has a
homotrimeric structure.
According to a particular embodiment, the level of the soluble (i.e. secreted)
form of TRAIL is measured.
According to another embodiment, the membrane form of TRAIL is measured.
According to still another embodiment, both the membrane form of TRAIL and
the secreted form of TRAIL are measured.
Date recue / Date received 202 1-1 1-25
37
According to another aspect of the present invention there is provided a
method
of determining an infection type in a subject comprising measuring the
concentration of
soluble TRAIL and insoluble TRAIL, wherein the concentration is indicative of
the
infection type.
In one embodiment, when the concentration of the soluble TRAIL is higher than
a pre-determined threshold value, a bacterial infection is ruled out for the
subject.
In another embodiment, when the concentration of the soluble TRAIL is higher
than a pre-determined threshold value, a viral infection is ruled in for the
subject.
Exemplary protein sequences for soluble TRAIL are set forth in SEQ ID NO: 37
in and SEQ ID NO: 38.
An exemplary mRNA sequence of membrane human TRAIL is set forth in SEQ
ID NO: 1.
An exemplary amino acid sequences of membrane human TRAIL is set forth in
SEQ ID NOs: 4.
Other exemplary cDNA and amino acid sequences for TRAIL are set forth in
SEQ ID NOs: 2, 3 and 5-8.
IP10: This gene encodes a chemokine of the CXC subfamily and ligand for the
receptor CXCR3. Binding of this protein to CXCR3 results in pleiotropic
effects,
including stimulation of monocytes, natural killer and T-cell migration, and
modulation
of adhesion molecule expression. Additional names of the gene include without
limitations: IP-10, CXCL10, Gamma-IP10, INP10 and chemokine (C-X-C motif)
ligand
10.
Exemplary cDNA sequence of human IP10 is set forth in SEQ ID NOs: 9-12.
An exemplary amino acid sequence of human IP10 is set forth in SEQ ID NO: 13.
CRP: C-reactive protein; additional aliases of CRP include without limitation
RP11-419N10.4 and PTX1. The protein encoded by this gene belongs to the
pentaxin
family. It is involved in several host defense related functions based on its
ability to
recognize foreign pathogens and damaged cells of the host and to initiate
their
elimination by interacting with humoral and cellular effector systems in the
blood.
Consequently, the level of this protein in plasma increases greatly during
acute phase
response to tissue injury, infection, or other inflammatory stimuli. CRP
displays several
functions associated with host defense: it promotes agglutination, bacterial
capsular
Date recue / Date received 202 1-1 1-25
38
swelling, phagocytosis and complement fixation through its calcium-dependent
binding
to phosphorylcholine.
Exemplary cDNA sequence of human CRP is set forth in SEQ ID NOs: 14-16.
An exemplary amino acid sequence of human CRP is set forth in SEQ ID
NO: 17.
IL1RA: The protein encoded by this gene is a cytokine receptor that belongs to
the interleukin 1 receptor family. This protein is a receptor for interleukin
alpha (IL1A),
interleukin beta (IL1B), and interleukin 1 receptor, type I (IL1R1/IL1RA). It
is an
important mediator involved in many cytokine induced immune and inflammatory
responses. Additional names of the gene include without limitations: CD121A,
IL-
1RT1, p80, CD121a antigen, CD121A, IL1R and IL lra.
Exemplary cDNA sequences of human IL1RA are set forth in SEQ ID NOs: 18,
19 and 20.
Exemplary amino acid sequences of human IL1RA are set forth in SEQ ID
NOs:21-24.
PCT: Procalcitonin (PCT) is a peptide precursor of the hormone calcitonin, the
latter being involved with calcium homeostasis. Procalcitonin ("pCT") is a
protein
consisting of 116 amino acids and having a molecular weight of about 13,000
dalton. It
is the prohormone of calcitonin which under normal metabolic conditions is
produced
and secreted by the C cells of the thyroid. pCT and calcitonin synthesis is
initiated by
translation of preprocalcitonin ("pre-pCT"), a precursor peptide comprising
141 amino
acids. The amino acid sequence of human pre-pCT was described by Moullec et
al. in
FEBS Letters, 167:93-97 in 1984. pCT is formed after cleavage of the signal
peptide
(first 25 amino acids of pre-pCT).
Exemplary cDNA sequences of human PCT are set forth in SEQ ID
NOs: 31-32.
Exemplary amino acid sequences of human PCT are set forth in SEQ ID
NOs:33-36.
SAA: encodes a member of the serum amyloid A family of apolipoproteins. The
encoded protein is a major acute phase protein that is highly expressed in
response to
inflammation and tissue injury. This protein also plays an important role in
HDL
metabolism and cholesterol homeostasis. High levels of this protein are
associated with
Date recue / Date received 202 1-1 1-25
39
chronic inflammatory diseases including atherosclerosis, rheumatoid arthritis,
Alzheimer's disease and Crohn's disease. This protein may also be a potential
biomarker
for certain tumors. Alternate splicing results in multiple transcript variants
that encode
the same protein.
Exemplary cDNA sequences of human SAA are set forth in SEQ ID
NOs: 25-27.
Exemplary amino acid sequences of human SAA are set forth in SEQ ID NO:28-
3 O.
It will be appreciated that since patient to patient DNA variations may give
rise
to to SNPs
which can cause differences in the amino acid sequence of the proteins, the
present inventors also contemplate proteins having amino acid sequences at
least 90 %,
95 % or 99 % homologous to the sequences provided herein above.
Measuring the polypeptide (for example, TRAIL, IP-10 and CRP) levels is
typically affected at the protein level as further described herein below.
Methods of detecting expression and/or activity of proteins
Expression and/or activity level of proteins expressed in the cells of the
cultures
of some embodiments of the invention can be determined using methods known in
the
arts and typically involve the use of antibodies. Such methods may be referred
to as
immunoassays. Immunoassays may be run in multiple steps with reagents being
added
and washed away or separated at different points in the assay. Multi-step
assays are
often called separation immunoassays or heterogeneous immunoassays. Some
immunoassays can be carried out simply by mixing the reagents and sample and
making
a physical measurement. Such assays are called homogenous immunoassays or less
frequently non-separation immunoassays. The use of a calibrator is often
employed in
immunoassays. Calibrators are solutions that are known to contain the analyte
in
question, and the concentration of that analyte is generally known. Comparison
of an
assay's response to a real sample against the assay's response produced by the
calibrators makes it possible to interpret the signal strength in terms of the
presence or
concentration of analyte in the sample.
The antibody may be monoclonal, polyclonal, chimeric, or a fragment of the
foregoing, and the step of detecting the reaction product may be carried out
with any
suitable immunoassay.
Date recue / Date received 202 1-1 1-25
40
Suitable sources for antibodies for the detection of the polypeptides include
commercially available sources such as, for example, Abazyme, Abnova,
AssayPro,
Affinity Biologicals, Antibody Shop, Aviva bioscience, Biogenesis, Biosense
Laboratories, Calbiochem, Cell Sciences, Chemicon International, Chemokine,
Clontech, Cytolab, DAKO, Diagnostic BioSystems, eBioscience, Endocrine
Technologies, Enzo Biochem, Eurogentec, Fusion Antibodies, Genesis Biotech,
GloboZymes, Haematologic Technologies, Immunodetect, Immunodiagnostik,
Immunometrics, Immunostar, Immunovision, Biogenex, Invitrogen, Jackson
ImmunoResearch Laboratory, KMI Diagnostics, Koma Biotech, LabFrontier Life
Science Institute, Lee Laboratories, Lifescreen, Maine Biotechnology Services,
Mediclone, MicroPharm Ltd., ModiQuest, Molecular Innovations, Molecular
Probes,
Neoclone, Neuromics, New England Biolabs, Novocastra, Novus Biologicals,
Oncogene Research Products, Orbigen, Oxford Biotechnology, Panvera,
PerkinElmer
Life Sciences, Pharmingen, Phoenix Pharmaceuticals, Pierce Chemical Company,
Polymun Scientific, Polysiences, Inc., Promega Corporation, Proteogenix,
Protos
Immunoresearch, QED Biosciences, Inc., R&D Systems, Repligen, Research
Diagnostics, Roboscreen, Santa Cruz Biotechnology, Seikagaku America,
Serological
Corporation, Serotec, SigmaAldrich, StemCell Technologies, Synaptic Systems
GmbH,
Technopharm, Terra Nova Biotechnology, TiterMax, Trillium Diagnostics, Upstate
Biotechnology, US Biological, Vector Laboratories, Wako Pure Chemical
Industries,
and Zeptometrix. However, the skilled artisan can routinely make antibodies,
against
any of the polypeptides described herein.
Polyclonal antibodies for measuring polypeptides include without limitation
antibodies that were produced from sera by active immunization of one or more
of the
following: Rabbit, Goat, Sheep, Chicken, Duck, Guinea Pig, Mouse, Donkey,
Camel,
Rat and Horse.
Examples of additional detection agents, include without limitation: scFv,
dsFv,
Fab, sVH, F(ab')2, Cyclic peptides, Haptamers, A single-domain antibody, Fab
fragments, Single-chain variable fragments, Affibody molecules, Affilins,
Nanofitins,
Anticalins, Avimers, DARPins, Kunitz domains, Fynomers and Monobody.
Enzyme linked immunosorbent assay (ELISA): Performing an ELISA involves
at least one antibody with specificity for a particular antigen. The sample
with an
Date recue / Date received 202 1-1 1-25
41
unknown amount of antigen is immobilized on a solid support (usually a
polystyrene
microtiter plate) either non-specifically (via adsorption to the surface) or
specifically
(via capture by another antibody specific to the same antigen, in a "sandwich"
ELISA).
After the antigen is immobilized, the detection antibody is added, forming a
complex
with the antigen. The detection antibody can be covalently linked to an
enzyme, or can
itself be detected by a secondary antibody that is linked to an enzyme through
bioconjugation. Between each step, the plate is typically washed with a mild
detergent
solution to remove any proteins or antibodies that are aspecifically bound.
After the
final wash step, the plate is developed by adding an enzymatic substrate to
produce a
visible signal, which indicates the quantity of antigen in the sample.
Enzymes commonly employed in this method include horseradish peroxidase
and alkaline phosphatase. If well calibrated and within the linear range of
response, the
amount of substrate present in the sample is proportional to the amount of
color
produced. A substrate standard is generally employed to improve quantitative
accuracy.
Western blot: This method involves separation of a substrate from other
protein
by means of an acrylamide gel followed by transfer of the substrate to a
membrane
(e.g., nylon or PVDF). Presence of the substrate is then detected by
antibodies specific
to the substrate, which are in turn detected by antibody binding reagents.
Antibody
binding reagents may be, for example, protein A, or other antibodies. Antibody
binding
reagents may be radiolabeled or enzyme linked as described hereinabove.
Detection
may be by autoradiography, colorimetric reaction or chemiluminescence. This
method
allows both quantitation of an amount of substrate and determination of its
identity by a
relative position on the membrane which is indicative of a migration distance
in the
acrylamide gel during electrophoresis.
Fluorescence activated cell sorting (FA CS): This method involves detection of
a substrate in situ in cells by substrate specific antibodies. The substrate
specific
antibodies are linked to fluorophores. Detection is by means of a cell sorting
machine
which reads the wavelength of light emitted from each cell as it passes
through a light
beam. This method may employ two or more antibodies simultaneously.
Automated Immunoassay: An automated analyzer applied to an immunoassay
(often called "Automated Immunoassay") is a medical laboratory instrument
designed to
measure different chemicals and other characteristics in a number of
biological samples
Date recue / Date received 202 1-1 1-25
42
quickly, with minimal human assistance. These measured properties of blood and
other
fluids may be useful in the diagnosis of disease. Many methods of introducing
samples
into the analyzer have been invented. This can involve placing test tubes of
sample into
racks, which can be moved along a track, or inserting tubes into circular
carousels that
rotate to make the sample available. Some analyzers require samples to be
transferred to
sample cups. However, the effort to protect the health and safety of
laboratory staff has
prompted many manufacturers to develop analyzers that feature closed tube
sampling,
preventing workers from direct exposure to samples. Samples can be processed
singly,
in batches, or continuously. Examples of automated immunoassay machines
include,
without limitation, ARCHITECT ci4100, ci8200 (2003), ci16200 (2007), ARCHITECT
i1000SR, ARCHITECT i2000õ i2000SR, i4000SR, AxSYM/AxSYM Plus, 1994 U.S.,
DS2, AIMS, AtheNA, DSX, ChemWell, UniCel DxI 860i Synchron Access
Clinical System, UniCel DxC 680i Synchron Access Clinical System,
Access/Access 2
Immunoassay System, UniCel DxI 600 Access Immunoassay System, UniCel DxC 600i
Synchron Access Clinical System, UniCel DxI 800 Access Immunoassay System,
UniCel DxC 880i Synchron Access Clinical System, UniCel DxI 660i Synchron
Access
Clinical System, SPA PLUS (Specialist Protein Analyzer), VIDAS Immunoassay
Analyzer, BioPlex 2200, PhD System EVOLIS PR 3100TSC Photometer, MAGO
4S/2011 Mago Plus Automated EIA Processor, LIAISON XL/2010 LIAISON, ETI-
MAX 3000 Agility, Triturus, HYTEC 288 PLUSDSX, VITROS ECi Immunodiagnostic
System, VITROS 3600 Immunodiagnostic System, Phadia Laboratory System 100E,
Phadia Laboratory System 250, Phadia Laboratory System 1000, Phadia Laboratory
System 2500, Phadia Laboratory System 5000, cobas e 602/2010, cobas e411,
cobas
e601, MODULAR ANALYTICS E170, Elecsys 2010, Dimension EXL 200/2011,
Dimension Xpand Plus Integrated Chemistry System, Dimension RxL Max/Max
Suite Integrated Chemistry System,: Dimension RxL Integrated Chemistry System,
Dimension EXL with LM Integrated Chemistry System, Stratus CS Acute Care
Diagnostic System, IMMULITE 2000 XPi Immunoassay System, ADVIA Centaur CP
Immunoassay System, IMMULITE 2000, IMMULITE 1000, Dimension Vista 500
Intelligent Lab System, Dimension Vista 1500 Intelligent Lab System, ADVIA
Centaur XP, AIA-900, AIA-360, AIA-2000, AIA-600 II, AIA-1800. Measurements of
CRP, IP-10 and TRAIL can also be performed on a Luminex machine.
Date recue / Date received 202 1-1 1-25
43
Lateral Flow Immunoassays (LFIA): This is a technology which allows rapid
measurement of analytes at the point of care (POC) and its underlying
principles are
described below. According to one embodiment, LFIA is used in the context of a
hand-
held device.
The technology is based on a series of capillary beds, such as pieces of
porous
paper or sintered polymer. Each of these elements has the capacity to
transport fluid
(e.g., urine) spontaneously. The first element (the sample pad) acts as a
sponge and
holds an excess of sample fluid. Once soaked, the fluid migrates to the second
element
(conjugate pad) in which the manufacturer has stored the so-called conjugate,
a dried
to format of
bio-active particles (see below) in a salt-sugar matrix that contains
everything
to guarantee an optimized chemical reaction between the target molecule (e.g.,
an
antigen) and its chemical partner (e.g., antibody) that has been immobilized
on the
particle's surface. While the sample fluid dissolves the salt-sugar matrix, it
also
dissolves the particles and in one combined transport action the sample and
conjugate
mix while flowing through the porous structure. In this way, the analyte binds
to the
particles while migrating further through the third capillary bed. This
material has one
or more areas (often called stripes) where a third molecule has been
immobilized by the
manufacturer. By the time the sample-conjugate mix reaches these strips,
analyte has
been bound on the particle and the third 'capture' molecule binds the complex.
After a while, when more and more fluid has passed the stripes, particles
accumulate and the stripe-area changes color. Typically there are at least two
stripes:
one (the control) that captures any particle and thereby shows that reaction
conditions
and technology worked fine, the second contains a specific capture molecule
and only
captures those particles onto which an analyte molecule has been immobilized.
After
passing these reaction zones the fluid enters the final porous material, the
wick, that
simply acts as a waste container. Lateral Flow Tests can operate as either
competitive or
sandwich assays.
Immunohistochemical analysis: Immunoassays carried out in accordance with
some embodiments of the present invention may be homogeneous assays or
heterogeneous assays. In a homogeneous assay the immunological reaction
usually
involves the specific antibody (e.g., anti- TRAIL, CRP and/or IP-10 antibody),
a labeled
analyte, and the sample of interest. The signal arising from the label is
modified,
Date recue / Date received 202 1-1 1-25
44
directly or indirectly, upon the binding of the antibody to the labeled
analyte. Both the
immunological reaction and detection of the extent thereof can be carried out
in a
homogeneous solution. Immunochemical labels, which may be employed, include
free
radicals, radioisotopes, fluorescent dyes, enzymes, bacteriophages, or
coenzymes.
In a heterogeneous assay approach, the reagents are usually the sample, the
antibody, and means for producing a detectable signal. Samples as described
above may
be used. The antibody can be immobilized on a support, such as a bead (such as
protein
A and protein G agarose beads), plate or slide, and contacted with the
specimen
suspected of containing the antigen in a liquid phase.
According to a particular embodiment, the antibody is immobilized to a porous
strip to form a detection site. The measurement or detection region of the
porous strip
may include a plurality of sites, one for TRAIL, one for CRP and one for IP-
10. A test
strip may also contain sites for negative and/or positive controls.
Alternatively, control sites can be located on a separate strip from the test
strip.
Optionally, the different detection sites may contain different amounts of
antibodies,
e.g., a higher amount in the first detection site and lesser amounts in
subsequent sites.
Upon the addition of test sample, the number of sites displaying a detectable
signal
provides a quantitative indication of the amount of polypeptides present in
the sample.
The detection sites may be configured in any suitably detectable shape and are
typically
in the shape of a bar or dot spanning the width of a test strip.
The support is then separated from the liquid phase and either the support
phase
or the liquid phase is examined for a detectable signal employing means for
producing
such signal. The signal is related to the presence of the analyte in the
sample. Means
for producing a detectable signal include the use of radioactive labels,
fluorescent
labels, or enzyme labels. For example, if the antigen to be detected contains
a second
binding site, an antibody which binds to that site can be conjugated to a
detectable
group and added to the liquid phase reaction solution before the separation
step. The
presence of the detectable group on the solid support indicates the presence
of the
antigen in the test sample. Examples of suitable immunoassays are
oligonucleotides,
immunoblotting, immunofluorescence methods, immunoprecipitation,
chemiluminescence methods, electrochemiluminescence (ECL) or enzyme-linked
immunoassays.
Date recue / Date received 202 1-1 1-25
45
Those skilled in the art will be familiar with numerous specific immunoassay
formats and variations thereof which may be useful for carrying out the method
disclosed herein. See generally E. Maggio, Enzyme-Immunoassay, (1980) (CRC
Press,
Inc., Boca Raton, Fla.); see also U.S. Pat. No. 4,727,022 to Skold et al.
titled "Methods
for Modulating Ligand-Receptor Interactions and their Application," U.S. Pat.
No.
4,659,678 to Forrest et al. titled "Immunoassay of Antigens," U.S. Pat. No.
4,376,110 to
David et al., titled "Immunometric Assays Using Monoclonal Antibodies," U.S.
Pat.
No. 4,275,149 to Litman et al., titled "Macromolecular Environment Control in
Specific
Receptor Assays," U.S. Pat. No. 4,233,402 to Maggio et al., titled "Reagents
and
HI Method
Employing Channeling," and U.S. Pat. No. 4,230,767 to Boguslaski et al.,
titled
"Heterogenous Specific Binding Assay Employing a Coenzyme as Label."
Antibodies can be conjugated to a solid support suitable for a diagnostic
assay
(e.g., beads such as protein A or protein G agarose, microspheres, plates,
slides or wells
formed from materials such as latex or polystyrene) in accordance with known
techniques, such as passive binding. Antibodies as described herein may
likewise be
conjugated to detectable labels or groups such as radiolabels (e.g., 35s,
1251, 1311),
enzyme labels (e.g., horseradish peroxidase, alkaline phosphatase), and
fluorescent
labels (e.g., fluorescein, Alexa, green fluorescent protein, rhodamine) in
accordance
with known techniques.
Monoclonal antibodies for measuring TRAIL include without limitation: Mouse,
Monoclonal (55B709-3) IgG; Mouse, Monoclonal (2E5) IgGl; Mouse, Monoclonal
(2E05) IgGl; Mouse, Monoclonal (M912292) IgG1 kappa; Mouse, Monoclonal (IIIF6)
IgG2b; Mouse, Monoclonal (2E1-1B9) IgGl; Mouse, Monoclonal (RIK-2) IgGl,
kappa; Mouse, Monoclonal MI81 IgGl; Mouse, Monoclonal VIIOE IgG2b; Mouse,
Monoclonal MAB375 IgGl; Mouse, Monoclonal MAB687 IgGl; Mouse, Monoclonal
H5501 IgGl; Mouse, Monoclonal clone 75411.11 Mouse IgGl; Mouse, Monoclonal
T8175-50 IgG; Mouse, Monoclonal 2B2.108 IgGI; Mouse, Monoclonal B-T24 IgGl;
Mouse, Monoclonal 55B709.3 IgGl; Mouse, Monoclonal D3 IgGl; Goat, Monoclonal
C19 IgG; Rabbit, Monoclonal H257 IgG; Mouse, Monoclonal 500-M49 IgG; Mouse,
Monoclonal 05-607 IgG; Mouse, Monoclonal B-T24 IgGl; Rat, Monoclonal (N2B2),
IgG2a, kappa; Mouse, Monoclonal (1A7-2B7), IgGl; Mouse, Monoclonal (55B709.3),
IgG and Mouse, Monoclonal B-S23* IgGl, Human TRAIL/TNFSF10 MAb (Clone
Date recue / Date received 202 1-1 1-25
46
75411), Mouse IgGl, Human TRAIL/TNFSF10 MAb (Clone 124723), Mouse IgGl,
Human TRAIL/TNFSF10 MAb (Clone 75402), Mouse IgGl.
Antibodies for measuring TRAIL include monoclonal antibodies and polyclonal
antibodies for measuring TRAIL. Antibodies for measuring TRAIL include
antibodies
that were developed to target epitopes from the list comprising of: Mouse
myeloma cell
line NSO-derived recombinant human TRAIL (Thr95-Gly281 Accession # P50591),
Mouse myeloma cell line, NSO-derived recombinant human TRAIL
(Thr95-Gly281,with an N-terminal Met and 6-His tag Accession # P50591), E.
coli-
derived, (Va1114-Gly281, with and without an N-terminal Met Accession
#:Q6IBA9),
Human plasma derived TRAIL, Human serum derived TRAIL, recombinant human
TRAIL where first amino acid is between position 85 - 151 and the last amino
acid is at
position 249 - 281.
Examples of monoclonal antibodies for measuring CRP include without
limitation: Mouse, Monoclonal (108-2A2); Mouse, Monoclonal (108-7G41D2);
Mouse,
Monoclonal (12D-2C-36), IgGl; Mouse, Monoclonal (IGI), IgGl; Mouse, Monoclonal
(5A9), IgG2a kappa; Mouse, Monoclonal (63F4), IgGl; Mouse, Monoclonal (67AI),
IgGl; Mouse, Monoclonal (8B-5E), IgGl; Mouse, Monoclonal (B893M), IgG2b,
lambda; Mouse, Monoclonal (Cl), IgG2b; Mouse, Monoclonal (C11F2), IgG; Mouse,
Monoclonal (C2), IgGl; Mouse, Monoclonal (C3), IgGl; Mouse, Monoclonal (C4),
IgGl; Mouse, Monoclonal (C5), IgG2a; Mouse, Monoclonal (C6), IgG2a; Mouse,
Monoclonal (C7), IgGl; Mouse, Monoclonal (CRP103), IgG2b; Mouse, Monoclonal
(CRP11), IgGl; Mouse, Monoclonal (CRP135), IgGl; Mouse, Monoclonal (CRP169),
IgG2a; Mouse, Monoclonal (CRP30), IgGl; Mouse, Monoclonal (CRP36), IgG2a;
Rabbit, Monoclonal (EPR283Y), IgG; Mouse, Monoclonal (KT39), IgG2b; Mouse,
Monoclonal (N-a), IgGI; Mouse, Monoclonal (N1G1), IgGl; Monoclonal (P5A9AT);
Mouse, Monoclonal (S5G1), IgGl; Mouse, Monoclonal (SB78c), IgGl; Mouse,
Monoclonal (SB78d), IgG1 and Rabbit, Monoclonal (Y284), IgG, Human C-Reactive
Protein/CRP Biot MAb (Cl 232024), Mouse IgG2B, Human C-Reactive Protein/CRP
MAb (Clone 232007), Mouse IgG2B, Human/Mouse/Porcine C-Reactive Protein/CRP
MAb (C1232026), Mouse IgG2A.
Antibodies for measuring CRP include monoclonal antibodies for measuring
CRP and polyclonal antibodies for measuring CRP.
Date recue / Date received 202 1-1 1-25
47
Antibodies for measuring CRP also include antibodies that were developed to
target epitopes from the list comprising of: Human plasma derived CRP, Human
serum
derived CRP, Mouse myeloma cell line NSO-derived recombinant human C-Reactive
Protein/CRP (Phe17-Pro224 Accession # P02741).
Examples of monoclonal antibodies for measuring IP-10 include without
limitation: IP-10 / CXCL10 Mouse anti-Human Monoclonal (4D5) Antibody
(LifeSpan
BioSciences), IP-10 / CXCL10 Mouse anti-Human Monoclonal (A00163.01) Antibody
(LifeSpan BioSciences), MOUSE ANTI HUMAN IP-10 (AbD Serotec), RABBIT
ANTI HUMAN IP-10 (AbD Serotec), IP-10 Human mAb 6D4 (Hycult Biotech), Mouse
io Anti-Human
IP-10 Monoclonal Antibody Clone B-050 (Diaclone), Mouse Anti-Human
IP-10 Monoclonal Antibody Clone B-055 (Diaclone), Human CXCL10/IP-10 MAb
Clone 33036 (R&D Systems), CXCL10/INP10 Antibody 1E9 (Novus Biologicals),
CXCL10/INP10 Antibody 2C1 (Novus Biologicals), CXCL10/INP10 Antibody 6D4
(Novus Biologicals), CXCL10 monoclonal antibody MO1A clone 2C1 (Abnova
Corporation), CXCL10 monoclonal antibody (M05), clone 1E9 (Abnova
Corporation),
CXCL10 monoclonal antibody, clone 1 (Abnova Corporation), IP10 antibody 6D4
(Abeam), IP10 antibody EPR7849 (Abeam), IP10 antibody EPR7850 (Abeam).
Antibodies for measuring IP-10 include monoclonal antibodies for measuring
IP-10 and polyclonal antibodies for measuring IP-10.
Antibodies for measuring IP-10 also include antibodies that were developed to
target epitopes from the list comprising of: Recombinant human CXCL10/IP-10,
non-
glycosylated polypeptide chain containing 77 amino acids (aa 22-98) and an N-
terminal
His tag Interferon gamma inducible protein 10 (125 aa long), IP-10 His Tag
Human
Recombinant IP-10 produced in E. Coli containing 77 amino acids fragment (22-
98)
and having a total molecular mass of 8.5 kDa with an amino-terminal
hexahistidine tag,
E. coli-derived Human IP-10 (Va122-Pro98) with an N-terminal Met, Human plasma
derived IP-10, Human serum derived IP-10, recombinant human IP-10 where first
amino acid is between position 1-24 and the last amino acid is at position 71-
98.
It will be appreciated that the expression level of the polypeptides described
herein can be an absolute expression level, a normalized expression and/or a
relative
expression level.
Date recue / Date received 202 1-1 1-25
48
In general scientific context, normalization is a process by which a
measurement
raw data is converted into data that may be directly compared with other so
normalized
data. In the context of the present invention, measurements of expression
levels are
prone to errors caused by, for example, unequal degradation of measured
samples,
different loaded quantities per assay, and other various errors. More
specifically, any
assayed sample may contain more or less biological material than is intended,
due to
human error and equipment failures. Thus, the same error or deviation applies
to both
the polypeptide of the invention and to the control reference, whose
expression is
essentially constant. Thus, division of TRAIL, IP-10 or CRP raw expression
value by
to the control reference raw expression value yields a quotient which is
essentially free
from any technical failures or inaccuracies (except for major errors which
destroy the
sample for testing purposes) and constitutes a normalized expression value of
the
polypeptide. Since control reference expression values are equal in different
samples,
they constitute a common reference point that is valid for such normalization.
According to a particular embodiment, each of the polypeptide expression
values are normalized using the same control reference.
It will further be appreciated that absolute expression values are dependent
upon
the exact protocol used, since each protocol typically leads to different
signal to noise
ratios, and consequentially to different concentrations being measured. More
specifically, while the overall trend of the biomarkers will be preserved
regardless of
the protocol (e.g. TRAIL increases in viral infections and decreases in
bacterial), the
measurement scale is protocol dependent.
Such alterations in measured concentrations of proteins across different
protocols can be compensated for by correlating the measurements of the two
protocols
and computing a transformation function, as illustrated in Example 5 herein
below.
Typically, the samples which are analyzed are blood sample comprising whole
blood, serum, plasma, leukocytes or blood cells. Preferably, the sample is
whole blood,
serum or plasma.
Of note, TRAIL and IP-10 and CRP are highly expressed in other tissues and
samples including without limitation CSF, saliva and epithelial cells, bone
marrow
aspiration, urine, stool, alveolar lavage, sputum. Thus, some embodiments of
the present
invention can be used to measure TRAIL, CRP and IP-10 in such tissues and
samples.
Date recue / Date received 202 1-1 1-25
49
Preferably, the level of the polypeptides is measured within about 24 hours
after
the sample is obtained. Alternatively, the concentration of the polypeptides
is measured
in a sample that was stored at 12 C or lower, when storage begins less than
24 hours
after the sample is obtained.
Once the tests are carried out to determine the level of the polypeptides, a
subject specific dataset is optionally generated which contains the results of
the
measurements.
The subject-specific dataset may be stored in a computer readable format on a
non-volatile computer readable medium, and is optionally and preferably
accessed by a
hardware processor, such as a general purpose computer or dedicated circuitry.
As mentioned, the levels of the polypeptides in the test subjects blood are
compared to the levels of the identical polypeptides in a plurality of
subjects' blood,
when the subjects have already been verified as having a bacterial infection,
viral
infection or non-bacterial/non-viral disease on the basis of parameters other
than the
blood level of the polypeptides. The levels of the polypeptides of the
plurality of
subjects together with their verified diagnosis can be stored in a second
dataset, also
referred to herein as the "group dataset" or "prediagnosed dataset", as
further described
herein below.
The phrase "non-bacterial/non-viral disease" refers to disease that is not
caused
by a bacteria or virus. This includes diseases such as acute myocardial
infarction,
physical injury, epileptic attack, inflammatory disorders etc, fungal
diseases, parasitic
diseases etc.
The phrase "viral infection" as used herein refers to a disease that is caused
by a
virus and does not comprise a bacterial component.
Methods of analyzing a dataset, for example, for the purpose of calculating
one
or more probabilistic classification function representing the likelihood that
a particular
subject has a bacterial infection, or the likelihood that a particular subject
has a viral
infection or the likelihood that a particular subject has a non-bacterial non-
viral disease,
may be performed as described in Example 1 herein below. For example,
diagnosis may
be supported using PCR diagnostic assays such as (i) Seeplex RV15 for
detection of
parainfluenza virus 1, 2, 3, and 4, coronavirus 229E/NL63, adenovirus
A/B/C/D/E,
bocavirus 1/2/3/4, influenza virus A and B, metapneumovirus, coronavirus 0C43,
Date recue / Date received 202 1-1 1-25
50
rhinovirus A/B/C, respiratory syncytial virus A and B, and Enterovirus, or
(ii) Seeplex
PB6 for detection of Streptococcus pneumoniae, Haemophilus influenzae,
Chlamydophila pneumoniae, Legionella pneurnophila, Bordetella pertussis, and
Mycoplasma pneumoniae.
Blood cultures, urine cultures and stool cultures may be analyzed for Shigella
spp., Campylobacter spp. and Salmonella spp.; serological testing (IgM and/or
IgG) for
cytomegalovirus (CMV), Epstein-Barr virus (EBV), Mycoplasma Pneumonia, and
Coxiella burnetii (Q-Fever).
Radiological tests (e.g. chest X-ray for suspected lower respiratory tract
infection [LRTID may be used to confirm chest infections.
Alternatively, or additionally at least one trained physician may be used to
establish the diagnosis.
Methods of determining the expression level of the polypeptides in the pre-
diagnosed subjects have been described herein above.
Preferably, the same method which is used for determining the expression level
of the polypeptides in the pre-diagnosed subjects is used for determining the
level of the
polypeptides in the test subject. Thus, for example if an immunoassay type
method is
used for determining the expression level of the polypeptides in the pre-
diagnosed
subjects, then an immunoassay type method should be used for determining the
level of
the polypeptides in the test subject.
It will be appreciated that, the type of blood sample need not be identical in
the
test subject and the pre-diagnosed subjects. The present inventors were able
to show
that serum and plasma levels for TRAIL are very similar. Thus, for example, if
a serum
sample is used for determining the expression level of the polypeptides in the
pre-
diagnosed subjects, then a plasma sample may be used for determining the level
of the
polypeptides in the test subject.
The group dataset is preferably stored in a computer readable format on a non-
volatile computer readable medium, and is optionally and preferably accessed
by a
hardware processor, such as a general purpose computer or dedicated circuitry.
Both
datasets can be stored on the same medium and are optionally and preferably
accessed
by the same hardware processor.
Date recue / Date received 202 1-1 1-25
51
In the subject-specific dataset, each entry can optionally and preferably be
described as a tuple (D, L) where D represents the polypeptide in the dataset
and L
represents the blood level of the polypeptide D. Thus, the dataset may be a
two-
dimensional dataset in which all the elements can be described by a vector in
a two-
dimensional space spanned by the polypeptide and respective response. In the
group
dataset, each entry can be described as a tuple (5, G, D, L) where S
represents the
particular subject, G represents the diagnosis of the subject S in the group
dataset, D
represents the polypeptide and L represents blood level of the polypeptide D.
Thus, the
exemplified illustration is of a four-dimensional dataset in which all the
elements can be
lo described by a vector in a four-dimensional space spanned by the
subjects, diagnosis,
polypeptide and respective responses. Some embodiments of the present
invention
contemplate use of datasets of higher dimensions. Such datasets are described
hereinafter.
The group dataset may optionally and preferably also include one or more of,
more preferably all, the entries of the subject-specific dataset. In
embodiments in which
group dataset includes all the entries of the subject-specific dataset, it is
not necessary to
use two separate datasets, since the entire dataset is contained in one
inclusive dataset.
Yet, such an inclusive dataset is optionally and preferably annotated in a
manner that
allows distinguishing between the portion of the inclusive dataset that is
associated with
the subject under analysis, and the portion of the inclusive dataset that is
associated only
with the other subjects. In the context of the present disclosure, the portion
of the
inclusive dataset that is associated with the subject under analysis is
referred to as the
subject-specific dataset even when it is not provided as a separate dataset.
Similarly, the
portion of the inclusive dataset that is associated only with the other
subjects is referred
to as the group dataset even when it is not provided as a separate dataset.
The group dataset preferably includes polypepti de levels of many subjects
(e.g.,
at least 10 subjects being prediagnosed as having a viral infection, at least
10 subjects
being prediagnosed as having a bacterial infection and at least 10 subjects
being
prediagnosed as having a non-bacterial/non-viral disease; or at least 20
subjects being
prediagnosed as having a viral infection, at least 20 subjects being
prediagnosed as
having a bacterial infection and at least 20 subjects being prediagnosed as
having a non-
bacterial/non-viral disease; or at least 50 subjects being prediagnosed as
having a viral
Date recue / Date received 202 1-1 1-25
52
infection, at least 50 subjects being prediagnosed as having a bacterial
infection and at
least 50 subjects being prediagnosed as having a non-bacterial/non-viral
disease.
The group-specific dataset can include additional data that describes the
subjects.
Datasets that include additional data may be advantageous since they provide
additional
information regarding the similarities between the subject under analysis and
the other
subject, thereby increasing the accuracy of the predictability.
Representative examples of types of data other than the level of the
polypeptides
include, without limitation traditional laboratory risk factors and/or
clinical parameters,
as further described herein above.
The present embodiments contemplate subject-specific and group datasets that
include additional data, aside from the polypeptides and respective levels. In
some
embodiments at least one of the datasets comprises one or more (e.g., a
plurality of)
multidimensional entries, each entry having at least three dimensions, in some
embodiments at least one of the datasets comprises one or more (e.g., a
plurality of)
multidimensional entries, each entry having at least four dimensions, in some
embodiments at least one of the datasets comprises one or more (e.g., a
plurality of)
multidimensional entries, each entry having at least five dimensions, and in
some
embodiments at least one of the datasets comprises one or more (e.g., a
plurality of)
multidimensional entries, each entry having more than five dimensions.
The additional dimensions of the datasets provides additional information
pertaining to the subject under analysis, to the other subjects and/or to
levels of
polypeptides other than TRAIL, CRP and IP-10.
In some embodiments of the present invention the additional information
pertains to at least one of traditional laboratory risk factors, clinical
parameters, blood
chemistry and/or a genetic profile.
"Traditional laboratory risk factors" encompass biomarkers isolated or derived
from subject samples and which are currently evaluated in the clinical
laboratory and
used in traditional global risk assessment algorithms, such as absolute
neutrophil count
(abbreviated ANC), absolute lymphocyte count (abbreviated ALC), white blood
count
(abbreviated WBC), neutrophil % (defined as the fraction of white blood cells
that are
neutrophils and abbreviated Neu (%)), lymphocyte % (defined as the fraction of
white
blood cells that are lymphocytes and abbreviated Lym (%)), monocyte % (defined
as
Date recue / Date received 202 1-1 1-25
53
the fraction of white blood cells that are monocytes and abbreviated Mon
(%)),Sodium
(abbreviated Na), Potassium (abbreviated K), Bilirubin (abbreviated Bili).
Preferably, at least one of the traditional laboratory risk factors of the
subject
under analysis is included in the subject specific dataset, and at least one
of the
traditional laboratory risk factors of one or more (more preferably all) of
the other
subjects is included in the group dataset. When the subject specific dataset
includes at
least one of the traditional laboratory risk factors, the risk factors can be
included as a
separate entry. When the group dataset includes the risk factors, the risk
factors is
optionally and preferably included per subject. Thus, for example, a group
dataset entry
to can be described by the tuple (S, G, D, L {R}), where S, G, D and L have
been
introduced before and {R} is the at least one risk factor of subject S.
"Clinical parameters" encompass all non-sample or non-analyte biomarkers of
subject health status or other characteristics, such as, without limitation,
age (Age),
ethnicity (RACE), gender (Sex), core body temperature (abbreviated
"temperature"),
maximal core body temperature since initial appearance of symptoms
(abbreviated
"maximal temperature"), time from initial appearance of symptoms (abbreviated
"time
from symptoms"), pregnancy, or family history (abbreviated FamHX).
Preferably, at least one of the clinical parameters of the subject under
analysis is
included in the subject specific dataset, and at least one of the clinical
parameters of one
or more (more preferably all) of the other subjects is included in the group
dataset.
When the subject specific dataset includes at least one of the clinical
parameters, the
clinical parameters can be included as a separate entry. When the group
dataset includes
the clinical parameters, the clinical parameters is optionally and preferably
included per
subject. Thus, for example, a group dataset entry can be described by the
tuple (S, G, D,
L {C}), where S, G, D and L have been introduced before and {C} is the
clinical
parameter of subject S.
As used herein "blood chemistry" refers to the concentration, or
concentrations,
of any and all substances dissolved in, or comprising, the blood.
Representative
examples of such substances, include, without limitation, albumin, amylase,
alkaline
phosphatase, bicarbonate, total bilirubin, BUN, C-reactive protein, calcium,
chloride,
LDL, HDL, total cholesterol, creatinine. CPK, y-GT, glucose. LDH, inorganic
Date recue / Date received 202 1-1 1-25
54
phosphorus, lipase, potassium, total protein, AST, ALT, sodium, triglycerides,
uric acid
and VLDL.
According to one embodiment, the blood chemistry of the subject under analysis
is included in the subject specific dataset, and the blood chemistry of one or
more (more
preferably all) of the other subjects is included in the group dataset. When
the subject
specific dataset includes the blood chemistry, the blood chemistry can be
included as a
separate entry. When the group dataset includes the blood chemistry, the blood
chemistry is optionally and preferably included per subject. Thus, for
example, a group
dataset entry can be described by the tuple (S, G, D, L {C}), where S. G, D
and L have
been introduced before and {C} is the blood chemistry of subject S.
In some embodiments of the present invention the additional information
pertains to a genetic profile of individual.
As used herein "genetic profile" refers to the analysis of a number of
different
genes. A genetic profile can encompass the genes in an entire genome of the
individual,
or it can encompass a specific subset of genes. The genetic profile may
include genomic
profile, a proteomic profile, an epigenomic profile and/or a transcriptomic
profile.
Preferably, the genetic profile of the subject under analysis is included in
the
subject specific dataset, and the genetic profile of one or more (more
preferably all) of
the other subjects is included in the group dataset. When the subject specific
dataset
includes the genetic profile, the genetic profile can be included as a
separate entry.
When the group dataset includes the genetic profile, the genetic profile is
optionally and
preferably included per subject. Thus, for example, a group dataset entry can
be
described by the tuple (S, G, D, L {P}), where S, G, D and L have been
introduced
before and {P} is the genetic profile of subject S.
The method optionally and preferably continues to a step of storing the levels
of
the polypeptide, at least temporarily, on a non-volatile computer readable
medium from
which it can be extracted or displayed as desired.
Once the two datasets are accessed, the method continues to the analysis phase
in
order to diagnose the test subject.
The analysis is performed so as to compute one or more probabilistic
classification functions f(60,61), g(6o,61), h(60,61), representing the
likelihoods that a
particular subject has a bacterial infection, viral infection or non-viral,
non-bacterial
Date recue / Date received 202 1-1 1-25
55
disease, respectively. Typically, f, g and h satisfy the relation f(60,61) +
g(80,6i) +
h(80,81) = 1. Each classification function is a function of the first
coordinate 60 and the
second coordinate 61, wherein each of the coordinates 60 and 61 is defined by
a different
combination of the expression values as further detailed hereinabove.
The analysis can be executed in more than one way.
According to one embodiment, the analysis uses a binary or, more preferably,
trinary classifier to compute one or more of the probabilistic classification
functions.
Preferably, the analysis sums the probability of the viral and the non-viral,
non-
bacterial disease in order to assign the likelihood of a non-bacterial
infection. In another
to preferred embodiment, the analysis sums the probability of the viral and
bacterial to
assign the likelihood of an infectious disease. Yet in another preferred
embodiment the
analysis ignores the probability of the non-viral, non-bacterial disease, and
performs a
direct comparison of the bacterial and the viral probabilities. Exemplified
interpretation
functions suitable for analyzing the datasets according to some embodiments of
the
present invention are provided hereinunder.
The analysis of the datasets according to some embodiments of the present
invention comprises executing a machine learning procedure.
As used herein the term "machine learning" refers to a procedure embodied as a
computer program configured to induce patterns, regularities, or rules from
previously
collected data to develop an appropriate response to future data, or describe
the data in
some meaningful way.
Use of machine learning is particularly, but not exclusively, advantageous
when
the dataset includes multidimensional entries.
The group and subject datasets can be used as a training set from which the
machine learning procedure can extract parameters that best describe the
dataset. Once
the parameters are extracted, they can be used to predict the type of
infection.
In machine learning, information can be acquired via supervised learning or
unsupervised learning. In some embodiments of the invention the machine
learning
procedure comprises, or is, a supervised learning procedure. In supervised
learning,
global or local goal functions are used to optimize the structure of the
learning system.
In other words, in supervised learning there is a desired response, which is
used by the
system to guide the learning.
Date recue / Date received 202 1-1 1-25
56
In some embodiments of the invention the machine learning procedure
comprises, or is, an unsupervised learning procedure. In unsupervised learning
there are
typically no goal functions. In particular, the learning system is not
provided with a set
of rules. One form of unsupervised learning according to some embodiments of
the
present invention is unsupervised clustering in which the data objects are not
class
labeled, a priori.
Representative examples of "machine learning" procedures suitable for the
present embodiments, including, without limitation, clustering, association
rule
algorithms, feature evaluation algorithms, subset selection algorithms,
support vector
to machines,
classification rules, cost-sensitive classifiers, vote algorithms, stacking
algorithms, Bayesian networks, decision trees, neural networks, instance-based
algorithms, linear modeling algorithms, k-nearest neighbors analysis, ensemble
learning
algorithms, probabilistic models, graphical models, logistic regression
methods
(including multinomial logistic regression methods), gradient ascent methods,
singular
value decomposition methods and principle component analysis. Among neural
network
models, the self-organizing map and adaptive resonance theory are commonly
used
unsupervised learning algorithms. The adaptive resonance theory model allows
the
number of clusters to vary with problem size and lets the user control the
degree of
similarity between members of the same clusters by means of a user-defined
constant
called the vigilance parameter.
Following is an overview of some machine learning procedures suitable for the
present embodiments.
Association rule algorithm is a technique for extracting meaningful
association
patterns among features.
The term "association", in the context of machine learning, refers to any
interrelation among features, not just ones that predict a particular class or
numeric
value. Association includes, but it is not limited to, finding association
rules, finding
patterns, performing feature evaluation, performing feature subset selection,
developing
predictive models, and understanding interactions between features.
The term "association rules" refers to elements that co-occur frequently
within
the datasets. It includes, but is not limited to association patterns,
discriminative
patterns, frequent patterns, closed patterns, and colossal patterns.
Date recue / Date received 202 1-1 1-25
57
A usual primary step of association rule algorithm is to find a set of items
or
features that are most frequent among all the observations. Once the list is
obtained,
rules can be extracted from them.
The aforementioned self-organizing map is an unsupervised learning technique
often used for visualization and analysis of high-dimensional data. Typical
applications
are focused on the visualization of the central dependencies within the data
on the map.
The map generated by the algorithm can be used to speed up the identification
of
association rules by other algorithms. The algorithm typically includes a grid
of
processing units, referred to as "neurons". Each neuron is associated with a
feature
to vector referred to as observation. The map attempts to represent all the
available
observations with optimal accuracy using a restricted set of models. At the
same time
the models become ordered on the grid so that similar models are close to each
other and
dissimilar models far from each other. This procedure enables the
identification as well
as the visualization of dependencies or associations between the features in
the data.
Feature evaluation algorithms are directed to the ranking of features or to
the
ranking followed by the selection of features based on their impact.
The term "feature" in the context of machine learning refers to one or more
raw
input variables, to one or more processed variables, or to one or more
mathematical
combinations of other variables, including raw variables and processed
variables.
Features may be continuous or discrete.
Information gain is one of the machine learning methods suitable for feature
evaluation. The definition of information gain requires the definition of
entropy, which
is a measure of impurity in a collection of training instances. The reduction
in entropy
of the target feature that occurs by knowing the values of a certain feature
is called
information gain. Information gain may be used as a parameter to determine the
effectiveness of a feature in explaining the type of infection. Symmetrical
uncertainty is
an algorithm that can be used by a feature selection algorithm, according to
some
embodiments of the present invention. Symmetrical uncertainty compensates for
information gain's bias towards features with more values by normalizing
features to a
[0,1] range.
Subset selection algorithms rely on a combination of an evaluation algorithm
and
a search algorithm. Similarly to feature evaluation algorithms, subset
selection
Date recue / Date received 202 1-1 1-25
58
algorithms rank subsets of features. Unlike feature evaluation algorithms,
however, a
subset selection algorithm suitable for the present embodiments aims at
selecting the
subset of features with the highest impact on the type of infection, while
accounting for
the degree of redundancy between the features included in the subset. The
benefits from
feature subset selection include facilitating data visualization and
understanding,
reducing measurement and storage requirements, reducing training and
utilization times,
and eliminating distracting features to improve classification.
Two basic approaches to subset selection algorithms are the process of adding
features to a working subset (forward selection) and deleting from the current
subset of
to features
(backward elimination). In machine learning, forward selection is done
differently than the statistical procedure with the same name. The feature to
be added to
the current subset in machine learning is found by evaluating the performance
of the
current subset augmented by one new feature using cross-validation. In forward
selection, subsets are built up by adding each remaining feature in turn to
the current
subset while evaluating the expected performance of each new subset using
cross-
validation. The feature that leads to the best performance when added to the
current
subset is retained and the process continues. The search ends when none of the
remaining available features improves the predictive ability of the current
subset. This
process finds a local optimum set of features.
Backward elimination is implemented in a similar fashion. With backward
elimination, the search ends when further reduction in the feature set does
not improve
the predictive ability of the subset. The present embodiments contemplate
search
algorithms that search forward, backward or in both directions. Representative
examples of search algorithms suitable for the present embodiments include,
without
limitation, exhaustive search, greedy hill-climbing, random perturbations of
subsets,
wrapper algorithms, probabilistic race search, schemata search, rank race
search, and
Bayesian classifier.
A decision tree is a decision support algorithm that forms a logical pathway
of
steps involved in considering the input to make a decision.
The term "decision tree" refers to any type of tree-based learning algorithms,
including, but not limited to, model trees, classification trees, and
regression trees.
Date recue / Date received 202 1-1 1-25
59
A decision tree can be used to classify the datasets or their relation
hierarchically.
The decision tree has tree structure that includes branch nodes and leaf
nodes. Each
branch node specifies an attribute (splitting attribute) and a test (splitting
test) to be
carried out on the value of the splitting attribute, and branches out to other
nodes for all
possible outcomes of the splitting test. The branch node that is the root of
the decision
tree is called the root node. Each leaf node can represent a classification
(e.g., whether a
particular portion of the group dataset matches a particular portion of the
subject-specific
dataset) or a value. The leaf nodes can also contain additional information
about the
represented classification such as a confidence score that measures a
confidence in the
to
represented classification (i.e., the likelihood of the classification being
accurate). For
example, the confidence score can be a continuous value ranging from 0 to 1,
which a
score of 0 indicating a very low confidence (e.g., the indication value of the
represented
classification is very low) and a score of 1 indicating a very high confidence
(e.g., the
represented classification is almost certainly accurate).
Support vector machines are algorithms that are based on statistical learning
theory. A support vector machine (SVM) according to some embodiments of the
present invention can be used for classification purposes and/or for numeric
prediction.
A support vector machine for classification is referred to herein as "support
vector
classifier," support vector machine for numeric prediction is referred to
herein as
"support vector regression".
An SVM is typically characterized by a kernel function, the selection of which
determines whether the resulting SVM provides classification, regression or
other
functions. Through application of the kernel function, the SVM maps input
vectors into
high dimensional feature space, in which a decision hyper-surface (also known
as a
separator) can be constructed to provide classification, regression or other
decision
functions. In the simplest case, the surface is a hyper-plane (also known as
linear
separator), but more complex separators are also contemplated and can be
applied using
kernel functions. The data points that define the hyper-surface are referred
to as support
vectors.
The support vector classifier selects a separator where the distance of the
separator from the closest data points is as large as possible, thereby
separating feature
vector points associated with objects in a given class from feature vector
points
Date recue / Date received 202 1-1 1-25
60
associated with objects outside the class. For support vector regression, a
high-
dimensional tube with a radius of acceptable error is constructed which
minimizes the
error of the data set while also maximizing the flatness of the associated
curve or
function. In other words, the tube is an envelope around the fit curve,
defined by a
collection of data points nearest the curve or surface.
An advantage of a support vector machine is that once the support vectors have
been identified, the remaining observations can be removed from the
calculations, thus
greatly reducing the computational complexity of the problem. An SVM typically
operates in two phases: a training phase and a testing phase. During the
training phase, a
to set of support vectors is generated for use in executing the decision
rule. During the
testing phase, decisions are made using the decision rule. A support vector
algorithm is
a method for training an SVM. By execution of the algorithm, a training set of
parameters is generated, including the support vectors that characterize the
SVM. A
representative example of a support vector algorithm suitable for the present
embodiments includes, without limitation, sequential minimal optimization.
Regression techniques which may be used in accordance with the present
invention include, but are not limited to linear Regression, Multiple
Regression, logistic
regression, probit regression, ordinal logistic regression ordinal Probit-
Regression,
Poisson Regression, negative binomial Regression, multinomial logistic
Regression
(MLR) and truncated regression.
A logistic regression or logit regression is a type of regression analysis
used for
predicting the outcome of a categorical dependent variable (a dependent
variable that
can take on a limited number of values, whose magnitudes are not meaningful
but whose
ordering of magnitudes may or may not be meaningful) based on one or more
predictor
.. variables. Logistic regressions also include a multinomial variant. The
multinomial
logistic regression model, is a regression model which generalizes logistic
regression by
allowing more than two discrete outcomes. That is, it is a model that is used
to predict
the probabilities of the different possible outcomes of a categorically
distributed
dependent variable, given a set of independent variables (which may be real-
valued,
.. binary-valued, categorical-valued, etc.).
The advantage of logistic regression is that it assigns an interpretable
measure of
prediction confidence ¨ a probability. For example, patients predicted of
having a
Date recue / Date received 202 1-1 1-25
61
bacterial infection with a probability of 75% and 99%, would both be assigned
as
bacterial when using an SVM interpretation function but the fact that the
latter has a
higher probability would be masked. Assigning the likelihood level of
confidence adds
valuable clinical information that may affect clinical judgment.
Importantly, calculating the likelihood of infection type for each patients,
allows
to rationally filter out patients for which the system knows that it cannot
classify with
high certainty. This is demonstrated in Figure 5, herein. Thus, when the
product assigns
a likelihood of say 40% bacterial infection (40 out of 100 patients with the
"40%" score
will be bacterial).
Additionally, by using thresholds on the likelihood scores, one can assign non-
binary classifications of the test-subject. By way of example a test-subject
with a
bacterial likelihood below 30% can be assigned a low probability of bacterial
infection;
between 30% and 70% an intermediate probability of bacterial infection and
above 70%
a high probability of a bacterial infections. Other thresholds may be used.
The Least Absolute Shrinkage and Selection Operator (LASSO) algorithm is a
shrinkage and/or selection algorithm for linear regression. The LASSO
algorithm may
minimizes the usual sum of squared errors, with a regularization, that can be
an Li norm
regularization (a bound on the sum of the absolute values of the
coefficients), an L2
norm regularization (a bound on the sum of squares of the coefficients), and
the like.
The LASSO algorithm may be associated with soft-thresholding of wavelet
coefficients,
forward stagewise regression, and boosting methods. The LASSO algorithm is
described in the paper: Tibshirani, R, Regression Shrinkage and Selection via
the Lasso,
J. Royal. Statist. Soc B., Vol. 58, No. 1, 1996, pages 267-288.
A Bayesian network is a model that represents variables and conditional
interdependencies between variables. In a Bayesian network variables are
represented as
nodes, and nodes may be connected to one another by one or more links. A link
indicates a relationship between two nodes. Nodes typically have corresponding
conditional probability tables that are used to determine the probability of a
state of a
node given the state of other nodes to which the node is connected. In some
embodiments, a Bayes optimal classifier algorithm is employed to apply the
maximum a
posteriori hypothesis to a new record in order to predict the probability of
its
classification, as well as to calculate the probabilities from each of the
other hypotheses
Date recue / Date received 202 1-1 1-25
62
obtained from a training set and to use these probabilities as weighting
factors for future
predictions of the type of infection. An algorithm suitable for a search for
the best
Bayesian network, includes, without limitation, global score metric-based
algorithm. In
an alternative approach to building the network, Markov blanket can be
employed. The
Markov blanket isolates a node from being affected by any node outside its
boundary,
which is composed of the node's parents, its children, and the parents of its
children.
Instance-based algorithms generate a new model for each instance, instead of
basing predictions on trees or networks generated (once) from a training set.
The term "instance", in the context of machine learning, refers to an example
from a dataset.
Instance-based algorithms typically store the entire dataset in memory and
build
a model from a set of records similar to those being tested. This similarity
can be
evaluated, for example, through nearest-neighbor or locally weighted methods,
e.g.,
using Euclidian distances. Once a set of records is selected, the final model
may be built
using several different algorithms, such as the naive Bayes.
The present invention can also be used to screen patient or subject
populations in
any number of settings. For example, a health maintenance organization, public
health
entity or school health program can screen a group of subjects to identify
those requiring
interventions, as described above, or for the collection of epidemiological
data.
Insurance companies (e.g., health, life or disability) may screen applicants
in the process
of determining coverage or pricing, or existing clients for possible
intervention. Data
collected in such population screens, particularly when tied to any clinical
progression to
conditions like infection, will be of value in the operations of, for example,
health
maintenance organizations, public health programs and insurance companies.
Such data
arrays or collections can be stored in machine-readable media and used in any
number of
health-related data management systems to provide improved healthcare
services, cost
effective healthcare, improved insurance operation, etc. See, for example,
U.S. Patent
Application No. 2002/0038227; U.S. Patent Application No. US 2004/0122296;
U.S.
Patent Application No. US 2004/ 0122297; and U.S. Patent No. 5,018,067. Such
systems
can access the data directly from internal data storage or remotely from one
or more data
storage sites as further detailed herein.
Date recue / Date received 202 1-1 1-25
63
A machine-readable storage medium can comprise a data storage material
encoded with machine readable data or data arrays which, when using a machine
programmed with instructions for using said data, is capable of use for a
variety of
purposes. Measurements of effective amounts of the biomarkers of the invention
and/or
the resulting evaluation of risk from those biomarkers can implemented in
computer
programs executing on programmable computers, comprising, inter alia, a
processor, a
data storage system (including volatile and non- volatile memory and/or
storage
elements), at least one input device, and at least one output device.
Program code can be applied to input data to perform the functions described
above and generate output information. The output information can be applied
to one or
more output devices, according to methods known in the art. The computer may
be, for
example, a personal computer, microcomputer, or workstation of conventional
design.
Each program can be implemented in a high level procedural or object oriented
programming language to communicate with a computer system. However, the
programs can be implemented in assembly or machine language, if desired. The
language can be a compiled or interpreted language. Each such computer program
can
be stored on a storage media or device (e.g., ROM or magnetic diskette or
others as
defined elsewhere in this disclosure) readable by a general or special purpose
programmable computer, for configuring and operating the computer when the
storage
media or device is read by the computer to perform the procedures described
herein.
The health-related data management system of the invention may also be
considered to be implemented as a computer-readable storage medium, configured
with
a computer program, where the storage medium so configured causes a computer
to
operate in a specific and predefined manner to perform various functions
described
herein.
The recorded output may include the assay results, findings, diagnoses,
predictions and/or treatment recommendations. These may be communicated to
technicians, physicians and/or patients, for example. In certain embodiments,
computers
will be used to communicate such information to interested parties, such as,
patients
and/or the attending physicians. Based on the output, the therapy administered
to a
subject can be modified.
Date recue / Date received 202 1-1 1-25
64
In one embodiment, the output is presented graphically. In another embodiment,
the output is presented numerically (e.g. as a probability). In another
embodiment, the
output is generated using a color index (for example in a bar display) where
one color
indicates bacterial infection and another color non-bacterial infection. The
strength of
the color correlates with the probability of bacterial infection/non-
infection. Such a
graphic display is presented in Figures 29A-F.
In some embodiments, the output is communicated to the subject as soon as
possible after the assay is completed and the diagnosis and/or prediction is
generated.
The results and/or related information may be communicated to the subject by
the
to subject's
treating physician. Alternatively, the results may be communicated directly to
a
test subject by any means of communication, including writing, such as by
providing a
written report, electronic forms of communication, such as email, or
telephone.
Communication may be facilitated by use of a computer, such as in case of
email
communications. In certain embodiments, the communication containing results
of a
diagnostic test and/or conclusions drawn from and/or treatment recommendations
based
on the test, may be generated and delivered automatically to the subject using
a
combination of computer hardware and software which will be familiar to
artisans
skilled in telecommunications. One example of a healthcare-oriented
communications
system is described in U.S. Pat. No. 6,283,761; however, the present
disclosure is not
limited to methods which utilize this particular communications system. In
certain
embodiments of the methods of the disclosure, all or some of the method steps,
including the assaying of samples, diagnosing of diseases, and communicating
of assay
results or diagnoses, may be carried out in diverse (e.g., foreign)
jurisdictions.
In some embodiments, the methods described herein are carried out using a
system 330, which optionally and preferably, but not necessarily, comprises a
hand-held
device, which comprises at least two compartments the first which measures the
amount
of polypeptides in the blood (e.g. using an immunohistochemical method) and
the
second which computationally analyzes the results measured in the first compai
anent
and provides an output relating to the diagnosis.
A block diagram of representative example of system 330 according to some
embodiments of the present invention is illustrated in FIG. 34. System 330 can
comprise a device 331 which can be, but is not necessarily a hand-held device.
Date recue / Date received 202 1-1 1-25
65
Alternatively, device 331 which can be a desktop mountable or a desktop
placeable
device. System 330 can comprise a first compartment 332 having a measuring
system
333 configured to measure the expression value of the polypeptides in the
blood of a
subject. Measuring system 333 can perform at least one automated assay
selected from
the group consisting of an automated ELISA, an automated immunoassay, and an
automated functional assay. System 330 can also comprise a second compai __
anent 334
comprising a hardware processor 336 having a computer-readable medium 338 for
storing computer program instructions for executing the operations described
herein
(e.g., computer program instructions for defining the first and/or second
coordinates,
1() computer program instructions for defining the curved line and/or
plane, computer
program instructions for calculating the first and/or distances, computer
program
instructions for correlating the calculated distance(s) to the presence of,
absence of, or
likelihood that the subject has, a bacterial and/or viral infection). Hardware
processor
336 is configured to receive expression value measurements from first
compartment 332
and execute the program instructions responsively to the measurements.
Optionally and
preferably hardware processor 336 is also configured to output the processed
data to a
display device 340.
In some optional embodiments of the present invention, system 330
communicates with a communication network. In these embodiments, system 330 or
hardware processor 336 comprises a network interface 350 that communicates
with a
communication network 352. In the representative illustration shown in FIG.
34,
network 352 is used for transmitting the results of the analysis performed by
hardware
processor 336 (for example, the presence of, absence of, or likelihood that
the subject
has, a bacterial and/or viral infection) to one or more remote locations. For
example,
system 330 can transmit the analysis results to at least one of a laboratory
information
system 360, and/or a central server 362 that collects data from a plurality of
systems like
system 330.
FIG. 39A is a schematic illustration showing a block diagram of system 330 in
embodiments in which communication network 352 is used for receiving
expression
value measurements. In these embodiments, system 330 can comprise computer-
readable medium 338, as further detailed hereinabove, and a hardware
processor, such
as, but not limited to, processor 336. Hardware processor 336 can comprise
network
Date recue / Date received 202 1-1 1-25
66
interface 350. Via interface 350, hardware processor 336 receives expression
value
measurements from a measuring system, such as, but not limited to, measuring
system
333, and executes the computer program instructions in computer-readable
medium 338,
responsively to the received measurements. Hardware processor 336 can then
output the
processed data to display device 340.
Combinations of the embodiments shown in FIGs. 34 and 39A are also
contemplated. For example, interface 350 can be used both for receiving
expression
value measurements from network 352 and for transmitting the results of the
analysis to
network 352.
In some embodiments of the present invention system 330 communicates with a
user, as schematically illustrated in the block diagram of FIG. 39B. In these
embodiments, system 330 can comprise computer-readable medium 338, as further
detailed hereinabove, and a hardware processor, such as, but not limited to,
processor
336. Hardware processor 336 comprises a user interface 354 that communicates
with a
user 356. Via interface 350, hardware processor 336 receives expression value
measurements from user 356. User 356 can obtain the expression value from an
external
source, or by executing at least one assay selected from the group consisting
of an
immunoassay and a functional assay, or by operating system 333 (not shown, see
FIGs.
39A and 34). Hardware processor 336 executes the computer program instructions
in
computer-readable medium 338, responsively to the received measurements.
Hardware
processor 336 can then output the processed data to display device 340.
Once the diagnosis has been made, it will be appreciated that a number of
actions
may be taken.
Thus, for example, if a bacterial infection is ruled in, then the subject may
be
treated with an antibiotic agent.
Examples of antibiotic agents include, but are not limited to Daptomycin;
Gemifloxacin; Telavancin; Ceftaroline; Fidaxomicin; Amoxicillin; Ampicillin;
Bacampicillin; Carbenicillin; Cloxacillin; Dicloxacillin; Flucloxacillin;
Mezlocillin;
Nafcillin; Oxacillin; Penicillin G; Penicillin V; Piperacillin; Pivampicillin;
Pivmecillinam; Ticarcillin; Aztreonam; Imipenem; Doripenem; Meropenem;
Ertapenem;
Clindamycin; Lincomycin; Pristinamycin; Quinupristin; Cefacetrile
(cephacetrile);
Cefadroxil (cefadroxyl); Cefalexin (cephalexin); Cefaloglycin (cephaloglycin);
Date recue / Date received 202 1-1 1-25
67
Cefalonium (cephalonium); Cefaloridine (cephaloradine); Cefalotin
(cephalothin);
Cefapirin (cephapirin); Cefatrizine; Cefazaflur; Cefazedone; Cefazolin
(cephazolin);Cefradine (cephradine); Cefroxadine; Ceftezole; Cefaclor;
Cefamandole;
Cefmetazole; Cefonicid; Cefotetan; Cefoxitin; Cefprozil (cefproxil);
Cefuroxime;
Cefuzonam; Cefcapene; Cefdaloxime; Cefdinir; C efdi toren; Cefetamet;
Cefixime;
Cefmenoxime; Cefodizime; Cefotaxime; Cefpimizole; Cefpodoxime; Cefteram;
Ceftibuten; Ceftiofur; Ceftiolene; Ceftizoxime; Ceftriaxone; Cefoperazone;
Ceftazidime;
Cefclidine; Cefepime; Cefluprenam; Cefoselis; Cefozopran; Cefpirome;
Cefquinome;
Fifth Generation; Ceftobiprole; Ceftaroline; Not Classified; Cefaclomezine;
Cefaloram;
Cefaparole; Cefcanel; Cefedrolor; Cefempidone; Cefetrizole; Cefivitril;
Cefmatilen;
Cefmepidium; Cefovecin; Cefoxazole; Cefrotil; Cefsumide; Cefuracetime;
Ceftioxide;
Azithromy cm; Erythromy cm; Clarithromy cm; Dirithromycin; Roxithromy cm;
Telithromycin; Amikacin; Gentamicin; Kanamycin; Neomycin; Netilmicin;
Paromomycin; Streptomycin; Tobramycin; Flumequine; Nalidixic acid; Oxolinic
acid;
Piromidic acid; Pipemidic acid; Rosoxacin; Ciprofloxacin; Enoxacin;
Lomefloxacin;
Nadifloxacin; Norfloxacin; Ofloxacin; Pefloxacin; Rufloxacin; Balofloxacin;
Gatifloxacin; Grepafloxacin; Levofloxacin; Moxifloxacin; Pazufloxacin;
Sparfloxacin;
Temafloxacin; Tosufloxacin; Besifloxacin; Clinafloxacin; Gemifloxacin;
Sitafloxacin;
Trovafloxacin; Prulifloxacin; Sulfamethizole; Sulfamethoxazole; Sulfisoxazole;
Trimethoprim-Sulfamethoxazole; Demeclocycline; Doxycycline; Minocycline;
Oxytetracycline; Tetracycline; Tigecycline; Chloramphenicol; Metronidazole;
Tinidazole; Nitrofurantoin; Vancomycin; Teicoplanin; Telavancin; Linezolid;
Cycloserine 2; Rifampin; Rifabutin; Rifapentine; Bacitracin; Polymyxin B;
Viomycin;
Capreomycin.
If a viral infection is ruled in, the subject may be treated with an antiviral
agent.
Examples of antiviral agents include, but are not limited to Abacavir;
Aciclovir;
Acyclovir; Adefovir; Amantadine; Amprenavir; Ampligen; Arbidol; Atazanavir;
Atripla;
Balavir; Boceprevirertet; Cidofovir; Combivir; Dolutegravir; Darunavir;
Delavirdine;
Didanosine; Docosanol; Edoxudine; Efavirenz; Emtricitabine; Enfuvirtide;
Entecavir;
Ecoliever; Famciclovir; Fomivirsen; Fosamprenavir; Foscamet; Fosfonet; Fusion
inhibitor; Ganciclovir; Ibacitabine; Imunovir; Idoxuridine; Imiquimod;
Indinavir;
Inosine; Integrase inhibitor; Interferon type III; Interferon type II;
Interferon type I;
Date recue / Date received 202 1-1 1-25
68
Interferon; Lamivudine; Lopinavir; Loviride; Maraviroc; Moroxydine;
Methisazone;
Nelfinavir; Nevirapine; Nexavir; Oseltamivir; Peginterferon alfa-2a;
Penciclovir;
Peramivir; Pleconaril; Podophyllotoxin; Raltegravir; Reverse transcriptase
inhibitor;
Ribavirin; Rimantadine; Ritonavir; Pyramidine; Saquinavir; Sofosbuvir;
StavudineTelaprevir; Tenofovir; Tenofovir disoproxil; Tipranavir;
Trifluridine; Trizivir;
Tromantadine; Truvada; traporved; Valaciclovir; Valganciclovir; Vicriviroc;
Vidarabine;
Viramidine; Zalcitabine; Zanamivir; Zidovudine; RNAi antivirals; inhaled
rhibovirons;
monoclonal antibody respigams; neuriminidase blocking agents.
The information gleaned using the methods described herein may aid in
additional patient management options. For example, the information may be
used for
determining whether a patient should or should not be admitted to hospital. It
may also
affect whether or not to prolong hospitalization duration. It may also affect
the decision
whether additional tests need to be performed or may save performing
unnecessary tests
such as CT and/or X-rays and/or MRI and/or culture and/or serology and/or PCR
assay
for specific bacteria and/or PCR assays for viruses and/or perform procedures
such as
lumbar puncture.
It is often clinically useful to assess patient prognosis, disease severity
and
outcome. The present inventors have now found that low levels of TRAIL (lower
than
about 20pg/m1 or about 15pg/m1 or about 10pg/m1 or about 5pg/m1 or about 2
pg/ml) are
significantly correlated with poor patient prognosis and outcome, and high
disease
severity. For example, the present inventors showed that adult patients in the
intensive
care unit (ICU), which are generally severely ill, had significantly lower
TRAIL levels
compared to all other patients, which were less ill regardless of whether they
had an
infectious or non-infectious etiology.
Thus, according to another aspect of the present invention there is provided a
method of predicting a prognosis for a disease comprising measuring the TRAIL
protein
serum level in subject having the disease, wherein when the TRAIL level is
below a
predetermined level, the prognosis is poorer than for a subject having a
disease having a
TRAIL protein serum level above the predetermined level.
Methods of measuring TRAIL protein serum levels are described herein above.
The disease may be an infectious disease or a non-infectious disease. The
subject may have a disease which has been diagnosed or non-diagnosed.
Date recue / Date received 202 1-1 1-25
69
Particular examples of diseases include without limitation bacterial
infections
(e.g. bacteremia, meningitis, respiratory tract infections, urinal tract
infections etc.),
sepsis, physical injury and trauma, cardiovascular diseases, multi-organ
failure
associated diseases, drug-induced nephrotoxicity, acute kidney disease, renal
injury,
advanced cirrhosis and liver failure, acute or chronic left heart failure,
pulmonary
hypertension with/without right heart failure, and various types of
malignancies.
According to another embodiment, additional polypeptides are measured which
aid in increasing the accuracy of the prediction. Thus, for example, other
polypeptide
which may be measured include IP-10, CRP, IL1RA, PCT and SAA.
According to a particular embodiment, IP-10, CRP and TRAIL are measured.
According to another embodiment, only TRAIL is measured.
The present inventors have found that patients having very low levels of TRAIL
(as classified herein above) have lower chance of recovery, and higher chance
of
complications. Accordingly, the present inventors propose that when it is
found that a
subject has very low levels of TRAIL they should be treated with agents that
are only
used as a last resort.
Such agents for example may be for example experimental agents that have not
been given full FDA approval. Other last resort agents are those that are
known to be
associated with severe side effects. Another exemplary last resort agent is an
antibiotic
such as vancomycin (which is typically not provided so as to prevent the
spread of
antibiotic resistance).
It will be appreciated that agents that are not typically considered as last
resort
agents can also be provided, but in doses which exceed the clinically
acceptable dose.
According to this aspect of the present invention, if the TRAIL level is above
a
predetermined level, then the patient should typically not be treated with a
last resort
agent.
The present inventors have now found that basal levels of TRAIL in healthy
individuals or patients with a non-infectious disease are lower in females
compared to
males during fertility age (t-test P<0.001) (see Figure 37A), but is invariant
in pre- or
post-fertility age (t-test P=0.9, Figure 37A). This trend was not observed in
patients
with an infectious disease.
Date recue / Date received 202 1-1 1-25
70
This age dependent dynamics can be used to improve models distinguishing
between bacterial, viral and non-infectious or healthy individuals, as would
be evident to
one skilled in the art.
For example, the model can include age and gender parameters. If the subject's
age is within a certain range indicative of fertility (e.g. about 13 to 45
years) and the
subject is male, then TRAIL model coefficients of males at fertility age can
be used. If
the subject's age is within the range indicative of fertility and the subject
is female then
TRAIL model coefficients of females at fertility age can be used. If the
subject's age is
outside the range indicative of fertility then TRAIL model coefficients that
are gender
invariant can be used.
Thus, according to another aspect of the invention there is provided a method
of
determining an infection type in a female subject of fertility age, the method
comprising
comparing the TRAIL protein serum level in the subject to a predetermined
threshold,
said predetermined threshold corresponding to the TRAIL protein serum level of
a
healthy female subject of fertility age, or a group of healthy female subjects
of fertility
age, wherein a difference between said TRAIL protein serum level and said
predetermined threshold is indicative of an infection type.
Thus, according to another aspect of the invention there is provided a method
of
determining an infection type in a male subject of fertility age, the method
comprising
comparing the TRAIL protein serum level in the subject to a predetermined
threshold,
said predetermined threshold corresponding to the TRAIL protein serum level of
a
healthy male subject of fertility age, or a group of healthy male subjects of
fertility age,
wherein a difference between said TRAIL protein serum level and said
predetermined
threshold is indicative of an infection type.
It will be appreciated that predetermined thresholds can be used to either
rule in
or rule out an infection type.
Thus, for example if the TRAIL protein serum level is above a first
predetermined threshold, the infection type is viral.
If, for example the TRAIL protein serum level is above a second predetermined
threshold, the infection type is not bacterial.
If for example, the TRAIL protein serum level is below a third predetermined
threshold, the infection type is bacterial.
Date recue / Date received 202 1-1 1-25
71
If for example the TRAIL protein serum level is below a fourth predetermined
threshold, the infection type is not viral.
Typically, the healthy male or female subject, referred to herein has no known
disease. According to a particular embodiment, the control subject has no
infectious
disease.
Typically, the difference between the TRAIL protein serum level of the subject
and the predetermined threshold is a statistically significant difference, as
further
described herein above.
As used herein the term "about" refers to 10 %.
to The terms "comprises", "comprising", "includes", "including", "having"
and
their conjugates mean "including but not limited to".
The term "consisting of' means "including and limited to".
The term "consisting essentially of' means that the composition, method or
structure may include additional ingredients, steps and/or parts, but only if
the
additional ingredients, steps and/or parts do not materially alter the basic
and novel
characteristics of the claimed composition, method or structure.
Throughout this application, various embodiments of this invention may be
presented in a range format. It should be understood that the description in
range format
is merely for convenience and brevity and should not be construed as an
inflexible
limitation on the scope of the invention. Accordingly, the description of a
range should
be considered to have specifically disclosed all the possible subranges as
well as
individual numerical values within that range. For example, description of a
range such
as from 1 to 6 should be considered to have specifically disclosed subranges
such as
from 1 to 3, from 1 to 4, from 1 to 5, from 2 to 4, from 2 to 6, from 3 to 6
etc., as well
as individual numbers within that range, for example, 1, 2, 3, 4, 5, and 6.
This applies
regardless of the breadth of the range.
As used herein the term "method" refers to manners, means, techniques and
procedures for accomplishing a given task including, but not limited to, those
manners,
means, techniques and procedures either known to, or readily developed from
known
manners, means, techniques and procedures by practitioners of the chemical,
pharmacological, biological, biochemical and medical arts.
Date recue / Date received 202 1-1 1-25
72
As used herein, the term "treating" includes abrogating, substantially
inhibiting,
slowing or reversing the progression of a condition, substantially
ameliorating clinical
or aesthetical symptoms of a condition or substantially preventing the
appearance of
clinical or aesthetical symptoms of a condition.
It is appreciated that certain features of the invention, which are, for
clarity,
described in the context of separate embodiments, may also be provided in
combination
in a single embodiment. Conversely, various features of the invention, which
are, for
brevity, described in the context of a single embodiment, may also be provided
separately or in any suitable subcombination or as suitable in any other
described
to embodiment of the invention. Certain features described in the context
of various
embodiments are not to be considered essential features of those embodiments,
unless
the embodiment is inoperative without those elements.
Various embodiments and aspects of the present invention as delineated
hereinabove and as claimed in the claims section below find experimental
support in the
following examples.
EXAMPLES
Reference is now made to the following examples, which together with the above
descriptions illustrate some embodiments of the invention in a non limiting
fashion.
Generally, the nomenclature used herein and the laboratory procedures utilized
in the present invention include molecular, biochemical, microbiological and
recombinant DNA techniques. Such techniques are thoroughly explained in the
literature. See, for example, "Molecular Cloning: A laboratory Manual"
Sambrook et
al., (1989); "Current Protocols in Molecular Biology" Volumes I-III Ausubel,
R. M., ed.
(1994); Ausubel et al., "Current Protocols in Molecular Biology", John Wiley
and Sons,
Baltimore, Maryland (1989); Perbal, "A Practical Guide to Molecular Cloning",
John
Wiley & Sons, New York (1988); Watson et al., "Recombinant DNA", Scientific
American Books, New York; Birren et al. (eds) "Genome Analysis: A Laboratory
Manual Series", Vols. 1-4, Cold Spring Harbor Laboratory Press, New York
(1998);
methodologies as set forth in U.S. Pat. Nos. 4,666,828; 4,683,202; 4,801,531;
5,192,659
and 5,272,057; "Cell Biology: A Laboratory Handbook", Volumes I-III Cellis, J.
E., ed.
(1994); "Culture of Animal Cells - A Manual of Basic Technique" by Freshney,
Wiley-
Date recue / Date received 202 1-1 1-25
73
Liss, N. Y. (1994), Third Edition; "Current Protocols in Immunology" Volumes I-
III
Coligan J. E., ed. (1994); Stites et al. (eds), "Basic and Clinical
Immunology" (8th
Edition), Appleton & Lange, Norwalk, CT (1994); Mishell and Shiigi (eds),
"Selected
Methods in Cellular Immunology", W. H. Freeman and Co., New York (1980);
available immunoassays are extensively described in the patent and scientific
literature,
see, for example, U.S. Pat. Nos. 3,791,932; 3,839,153; 3,850,752; 3,850,578;
3,853,987; 3,867,517; 3,879,262; 3,901,654; 3,935,074; 3,984,533; 3,996,345;
4,034,074; 4,098,876; 4,879,219; 5,011,771 and 5,281,521; "Oligonucleotide
Synthesis" Gait, M. J., ed. (1984); "Nucleic Acid Hybridization" Hames, B. D.,
and
Higgins S. J., eds. (1985); "Transcription and Translation" Hames, B. D., and
Higgins
S. J., eds. (1984); "Animal Cell Culture" Freshney, R. I., ed. (1986);
"Immobilized
Cells and Enzymes" IRL Press, (1986); "A Practical Guide to Molecular Cloning"
Perbal, B., (1984) and "Methods in Enzymology" Vol. 1-317, Academic Press;
"PCR
Protocols: A Guide To Methods And Applications", Academic Press, San Diego, CA
(1990); Marshak et al., "Strategies for Protein Purification and
Characterization - A
Laboratory Course Manual" CSHL Press (1996). Other general references are
provided
throughout this document. The procedures therein are believed to be well known
in the
art and are provided for the convenience of the reader.
EXAMPLE 1
A host-proteome signature for distinguishing between bacterial and viral
infections:
A prospective multi-center observational study
Methods
Study population: A total of 1002 patients took part in the study. Pediatric
patients (<18 years) were recruited from pediatric emergency departments
(PED),
pediatric wards and surgical departments, and adults (>18 years) from
emergency
departments (ED), internal medicine depai ____________________________ intents
and surgical departments. Informed
consent was obtained from each participant or legal guardian, as applicable.
Inclusion
criteria for the infectious disease cohort included: clinical suspicion of an
acute
infectious disease, peak fever >37.5 C since symptoms onset, and duration of
symptoms
<12 days. Inclusion criteria for the control group included: clinical
impression of a non-
infectious disease (e.g. trauma, stroke and myocardial infarction), or healthy
subjects.
Date recue / Date received 202 1-1 1-25
74
Exclusion criteria included: evidence of any episode of acute infectious
disease in the
two weeks preceding enrollment; diagnosed congenital immune deficiency;
current
treatment with immunosuppressive or immunomodulatory therapy; active
malignancy,
proven or suspected human immunodeficiency virus (HIV)-1, hepatitis B virus
(HBV),
or hepatitis C virus (HCV) infection (Figure 1A). Importantly, in order to
enable broad
generalization, antibiotic treatment at enrollment did not cause exclusion
from the
study.
Enrollment process and data collection: For each patient, the following
baseline variables were recorded: demographics, physical examination, medical
history
(e.g. main complaints, underlying diseases, chronically-administered
medications,
comorbidities, time of symptom onset, and peak temperature), complete blood
count
(CBC) obtained at enrollment, and chemistry panel (e.g. creatinine, urea,
electrolytes,
and liver enzymes). A nasal swab was obtained from each patient for further
microbiological investigation, and a blood sample was obtained for protein
screening
and validation. Additional samples were obtained as deemed appropriate by the
physician (e.g. urine and stool samples in cases of suspected urinary tract
infection
[UTI], and gastroenteritis [GI] respectively). Radiological tests were
obtained at the
discretion of the physician (e.g. chest X-ray for suspected lower respiratory
tract
infection [LRTI1). Thirty days after enrollment, disease course and response
to
treatment were recorded. All information was recorded in a custom electronic
case
report form (eCRF).
Microbiological investigation: Patients underwent two multiplex-PCR
diagnostic assays from nasal swab samples: (i) Seeplex RV15 (n=713), for
detection
of parainfluenza virus 1, 2, 3, and 4, coronavirus 229E/NL63, adenovirus
A/B/C/D/E,
bocavirus 1/2/3/4, influenza virus A and B, metapneumovirus, coronavirus 0C43,
rhinovirus A/B/C, respiratory syncytial virus A and B, and Enterovirus, and
(ii)
Seeplex PB6 (n=633) for detection of Streptococcus pneumoniae, Haemophilus
influenzae, Chlamydophila pneumoniae, Legionella pneumophila, Bordetella
pertussis,
and Mycoplasma pneumoniae. Multiplex-PCR assays were performed by a certified
service laboratory. Patients were also tested for additional pathogens
according to their
Date recue / Date received 202 1-1 1-25
75
suspected clinical syndrome, including: blood culture (n=420), urine culture
(n=188)
and stool culture for Shigella spp., Campylobacter spp. and Salmonella spp.
(n=66);
serological testing (IgM and/or IgG) for cytomegalovirus (CMV), Epstein-Barr
virus
(EBV), Mycoplasma Pneumonia, and Coxiella burnetii (Q-Fever) (n=167, n=130,
n=206 and n=41 respectively).
Establishing the reference standard: The Clear Diagnosis, Unanimous and
Majority cohorts: A rigorous composite reference standard was created
following
recommendations of the Standards for Reporting of Diagnostic Accuracy
(STARD).'
1() First, a thorough clinical and microbiological investigation was
performed for each
patient as described above. Then, all the data collected throughout the
disease course
was reviewed by a panel of three physicians. For adult patients (>18 years)
the panel
included the attending physician and two infectious disease specialists, while
for
children and adolescents (<18 years) it included the attending pediatrician,
an infectious
disease expert and a senior attending pediatrician. Each panel member assigned
one of
the following diagnostic labels to each patient: (i) bacterial; (ii) viral;
(iii) no apparent
infectious disease or healthy (controls); and (iv) indeterminate. Patients
with mixed
infections (bacteria plus virus) were labeled as bacterial because they are
managed
similarly (e.g. treated with antibiotics). Importantly, the panel members were
blinded to
the labeling of their peers and to the results of the signature.
This process was used to create three cohorts with an increasing level of
diagnostic certainty (Figure 1A):
(i) Majority cohort: Patients were assigned the same label by at least
two of the
three panel members;
(ii) Unanimous cohort (a subgroup of the Majority cohort): Patients were
assigned
the same label by all three panel members (the terms "unanimous cohort" and
"consensus cohort" are used herein interchangeably); and
(iii) Clear Diagnosis cohort (a subgroup of the Unanimous cohort):
Bacterial labeled
patients were unanimously diagnosed by all three panel members, had WBC
>15,000/ 1 (a cutoff indicative of increased bacterial infection risk") and
one of
the following microbiological confirmations: bacteremia (with positive blood
culture), bacterial meningitis (with positive CSF culture), pyelonephritis
(with
Date recue / Date received 202 1-1 1-25
76
positive urine culture and ultrasound demonstration of renal involvement), UTI
(with positive urine culture), septic shock (with positive blood culture), or
peritonsillar abscess (proven by surgical exploration or computerized
tomography). Viral labeled patients were unanimously diagnosed by panel
members and had and a positive test result of a virus.
Additionally, control labeled patients were unanimously diagnosed by all three
panel members.
Samples, procedures and protein measurements: Venous blood samples were
stored at 4 C for up to 5 hours on site and subsequently fractionated into
plasma, serum
and total leukocytes and stored at -80 C. Nasal swabs and stool samples were
stored at
4 C for up to 72 hours and subsequently transported to a certified service
laboratory for
multiplex PCR-based assay. In the screening phase, host-proteins were measured
in
serum and leukocytes using enzyme linked immunosorbent assay (ELISA), Luminex
technology, protein arrays and Flow cytometry (on freshly isolated
leukocytes). After
screening and signature construction (see Host-proteome screening section),
three
proteins were selected and measured as follows: CRP was measured via either
Cobas
6000, Cobas Integra 400, Cobas Integra 800, or Modular Analytics P800 (Roche).
TRAIL and IP-10 were measured using commercial ELISA kits (MeMed Diagnostics).
Statistical analysis: The primary analysis was based on area under the
receiver
operating characteristics curve (AUC), Sensitivity (TP/P), Specificity (TN/N),
Positive
likelihood ratio (LR+ = Sensitivity / [1-Specificityl), Negative likelihood
ratio (LR- =
[1¨ Sensitivity] / Specificity ) and Diagnostic odds ratio (DOR = LR+ / LR-),
where P,
N, TP and TN correspond to positives (bacterial patients), negatives (viral
patients), true
positives (correctly diagnosed bacterial patients), and true negatives
(correctly
diagnosed viral patients), respectively. Statistical analysis was performed
with
MATLAB. Sample size calculations are presented in Example 2 herein below.
Host-proteome screening: A general overview of the process for developing,
training and testing the multivariate logistic model is depicted in Figure 1B.
Briefly, a
systematic literature screen and bioinformatics analysis was performed that
identified
Date recue / Date received 202 1-1 1-25
77
600 protein candidates that were likely to be differentially expressed in
peripheral blood
samples of bacterial versus viral patients, some of which have a known role in
the host
immune response to infection and others with no direct link to the immune
system. Next,
each protein candidate was measured on 20-30 patients from the training set
(50% viral
and 50% bacterial) and a Wilcoxon rank-sum (WS) P-value <0.01 was used to
screen
proteins with statistically significant differential measurements. This
resulted in a set of
86 proteins (false discovery rate [FDR] of 0.07). Each of these proteins was
then
evaluated in 100 additional patients (50% viral and 50% bacterial) and further
screened
using a t-test cutoff of P<10', resulting in 14 proteins that were
significantly
1() differentially expressed in viral versus bacterial patients
(FDR<0.001).
Signature development and validation: A feature selection process was applied
to identify the optimal combination of proteins. Two feature selection schemes
were
used: mutual-information min-max' and forward greedy wrapper', which use a
series
of iterations to add or remove features. The process was terminated when the
increase in
performance on the training set was no longer statistically significant
(P>0.05). Both
processes converged to the same final set of three proteins. To integrate the
protein
levels into a single score, multiple computational models were examined. Their
performances were not significantly different (P>0.1 as further detailed in
Example 2
herein below). A Multinomial Logistic Regression (MLR) model was chosen
because
provides a probabilistic interpretation by assigning a likelihood score to a
patient's
diagnosis. The signature uses this property to filter out patients whose
probability of
bacterial infection is intermediate: between 0.35 and 0.55. The term 'marginal
immune
response' is used to describe these patients because their profile borders
between
bacterial and viral host-responses. The patients in the Majority cohort were
divided into
training and test sets, each comprising 50% of the patients (Figure 1B). The
training set
included the 120 patients who participated in the screening process and
additional
patients that were randomly assigned. The test set included the remaining
patients and
was used for independent assessment of the signature performance. Importantly,
none of
the test set patients were used to train the algorithms, or to select the
proteins. A leave-
10%-out cross-validation was used to estimate model performance. More details
on the
model construction are provided in Example 2 herein below).
Date recue / Date received 202 1-1 1-25
78
RESULTS
Patient characteristics: Three physicians independently assigned a label to
each
patient (either bacterial, viral, controls, or indeterminate). The labels were
used to create
three cohorts with increasing level of diagnostic certainty: Majority (n=765),
Unanimous (n=639) and Clear Diagnosis (n=312) cohorts (Figure 1A).
Additionally, 98
patients were labeled as indeterminate, because the physicians could not
establish
disease etiology or there was no majority labeling. A detailed
characterization of the
Majority cohort is depicted in Table I. Briefly, the cohort was balanced with
respect to
.. gender (47% females, 53% males) and included 56% pediatric patients (<18
years) and
44% adults (>18 years). Patients presented with a wide range of clinical
syndromes (e.g.
RTI, UTI, and systemic infections), maximal temperatures (36-41.5 C), time
from
symptoms onset (0-12 days), comorbidities, and medications (Table 1 and
Figures 6A-
12B). Altogether, 56 pathogen species were detected that are responsible for
the vast
majority of acute infectious diseases in the Western world (Figures 7A-B).
Table 1
Date recue / Date received 202 1-1 1-25
79
Criteria Total Children Adults
(518 years) (>18 years)
n=765 n=432 n=333
Age (years)
<3 211 (28)
3-6 93 (12)
6-9 46 (6)
9-18 82 (11)
18-30 55 (7)
30-60 161 (21)
>60 117 (15)
Gender
Female 363 (47) 205 (47) 158
(47)
Maximal Teirpemture (*C)
<37.5 106 (14) 28 (6) 78 (23)
37.5-38.4 154 (20) 68 (16) 86 (26)
38.5-39.4 294 (38) 164 (38) 130
(39)
39.5-40.4 196 (26) 157 (36) 39 (12)
>40.5 15 (2) 15 (3) 0 (0)
Time from symptoms onset (days)
0-1 175 (24) 118 (27) 57 (17)
2-3 265 (36) 161 (37) 104
(31)
4-5 161 (22) 89 (21) 72 (22)
6-7 109 (15) 52 (12) 57 (17)
8-9 10 (1) 2 (0.5) 8 (2)
10-12 14 (2) 2 (0.5) 12 (4)
N/A 31 (4) 8 (2) 23 (7)
Clinical syndrome
Cellulkis 28 (4) 7 (2) 21 (6)
CNS 14 (2) 9 (2) 5 (2)
GI 89 (11.5) 66 (15) 23 (7)
LRTI 158 (21) 84 (19) 74 (22)
Non-infectious 112 (14.5) 29 (7) 83 (25)
Other 12 (1.5) 4 (1) 8 (2.5)
Systemic 150 (19.5) 110 (26) 40 (12)
URTI 145 (19) 104 (24) 41 (12)
UTI 57 (7) 19 (4) 38 (11)
Recruiting site
Pediatrics 84 internal 293 (38) 137 (32) 156
(47)
PED & ED 472 (62) 295 (68) 177
(53)
Hospitalization durallon (days)
Not hospitakzed 272 (36) 174 (40) 98 (29)
1-2 206 (28) 126 (29) 80 (24)
3-4 170 (22) 94 (22) 76 (23)
5-6 53 (7) 24 (6) 29 (9)
7-8 31 (4) 7 (1.5) 24
(7)
>8 33 (4) 7 (1.5) 26
(8)
Season
Autumn 181 (24) 111 (26) 70 (21)
Spring 208 (27) 124 (29) 84 (25)
Summer 170 (22) 98 (23) 72 (22)
Winter 206 (27) 99 (23) 107 (32)
Smoking
Yes 74 (10) 0 (0) 74
(22)
No 691 (90) 432 (100)
259 (78)
Antibiotic prescription
Yes 432 (56) 207 (48) 225 (68)
No 333 (44) 225 (52) 108 (32)
Date regue / Date received 2021-11-25
80
Criteria Total Children Adults
(518 years) (>18 years)
n=765 n=432 n=333
Detected microorganisms
Not detected 219 (29) 79 (18) 140 (42)
Viruses
Adenovirus NB/C/D/E 50 (7) 47 (11) 3 (1)
Bocavirus 1/2/3/4 9 (1) 9 (2) 0 (0)
CMV & EBV 25 (3) 23 (5) 2 (0.6)
Coronavirus 229E/NL63/0C43 19 (2) 14 (3) 5 (2)
Enteric viruses 19 (2) 16 (4) 3 (1)
Enterovirus 21 (3) 20 (5) 1 (0.3)
Influenza A virus 45 (6) 24 (6) 21 (6)
Influenza B virus 19 (2) 14 (3) 5 (2)
Meta pneum virus 17 (2) 13 (3) 4 (1)
Parainfluenza 1/2/3/4 48 (6) 41 (9) 7 (2)
Respiratory syncytiall virus NB 40 (5) 38 (9) 2 (0.6)
Rhinovirus NB/C 87 (11) 73 (17) 14 (4)
Bacteria
Atypical bacteria 27 (4) 7 (2) 20 (6)
E.coli 44 (6) 17 (4) 27 (8)
Enterococcus faecalis 10 (1) 0 (0) 10 (3)
Group A Strep 19 (2) 16 (4) 3 (1)
Haemophilus influenzae 179 (23) 148 (34) 31 (9)
Streptococcus pneumoniae 306 40 207 48 99 30
Table 1 - Baseline characteristics of the majority cohort patients. Values are
numbers (percentages). Only microorganisms that were detected in more than 5
patients
are presented. CNS- central nervous system, GI - gastroenteritis, LRTI ¨ lower
respiratory tract infection, UTRI - upper respiratory tract infection, UTI -
urinary tract
infection, N/A ¨ healthy controls or patients in which data was not obtained.
Influenza A
subgroup included H1N1 strains. The atypical bacteria subgroup included
Chlamydophila pneumoniae, Mycoplasma pneumonia and Legionella pneumophila. The
to Enteric
viruses subgroup included Rota virus, Astrovirus, Enteric Adenovirus and
Norovirus G I/II. In the clinical syndrome analysis the LRTI group included
pneumonia,
bronchiolitis, acute bronchitis, and laryngitis; URTI group included
pharyngitis, acute
otitis media, acute sinusitis and acute tonsillitis.
Signature performance on the Clear Diagnosis, Unanimous and Majority
cohorts: Of the 600 screened host-proteins and their combinations, the best
signature for
discriminating bacterial, viral and control patients in the Majority cohort
training set
included three soluble proteins: TNF-related apoptosis-inducing ligand
(TRAIL),
Interferon gamma-induced protein 10 (IP-10), and C-reactive protein (CRP)
(Figures
2A-C). Signature AUC for distinguishing between bacterial and viral infections
on the
Date recue / Date received 202 1-1 1-25
81
test set of the Majority cohort was 0.94 0.04. Similar results were obtained
using leave-
10%-out cross-validation on the entire Majority cohort (AUC=0.94 0.02). The
signature
significantly outperformed all the individual proteins evaluated in the
screening phase
(P<10-6). The training and testing procedures were repeated on the Unanimous
and Clear
Diagnosis cohorts, yielding AUCs of 0.96 0.02 and 0.99 0.01, respectively.
This
stepwise increase in performance is aligned with the increased certainty of
reference
standard assignment in the three cohorts (Table 2, herein below).
Table 2- Signature measures of accuracy for diagnosing bacterial vs. viral
infections
B. Marginal immune response
A. All patients
filter
Majority Unanimous Clear Clear
Majority Unanimous Accuracy
cohort cohort diagnosis diagnosis
cohort cohort
measure
cohort cohort
0.94 0.97 0.99 0.94 0.96 0.99
AUC
(0.92,0.96) (0.95,0.99) (0.98,1.00) (0.92,0.96) (0.94,0.98) (0.98,1.00)
0.91 0.93 0.96 0.88 0.90 0.94 Total
(0.88,0.94) (0.9,0.96) (0.93,0.99) (0.85,0.90) (0.87,0.92) (0.91,0.97)
accuracy
0.92 0.94 0.96 0.87 0.88 0.96
(0.88,0.96) (0.9,0.98) (0.88,1.00) (0.83,0.91) (0.84,0.91) (0.88,1.00)
Sensitivity
0.89 0.93 0.97 0.90 0.92 0.93
(0.86,0.89) (0.9,0.96) (0.89,0.97) (0.86,0.93) (0.89,0.96) (0.89,0.97)
Specificity
8.4 13.4 32.0 8.7 11.0 13.7
LR+
(6,12) (8,21) (13,78) (6,12) (7,16) (8,24)
0.09 0.07 0.04 0.14 0.13 0.04
LR-
(0.06,0.13) (0.04,0.11) (0.01,0.26) (0.11,0.19) (0.09,0.18) (0.01,0.27)
93 208 776 60 84 319
(53,164) (99,436) (92,6528) (37,98) (47,150)
(43,2383) DOR
A. Performance estimates and their 95% CIs were obtained using a leave-10%-
out cross-validation on all patients in the Clear Diagnosis cohort (nBac
27 ,
TIViral=173), Unanimous (nuacteriai-256, nvirai=271), and Majority (nuacteriai-
319,
nvirai=334) cohorts. B. The analysis was repeated after filtering out patients
with a
marginal immune response (Clear Diagnosis [nuacteria1=27, nvirg-159,
nmarging=141,
Unanimous [nBacterial-233, nv iral-232, nmargina1=621, and Majority [nuac
?on terial-- ,
nvirai=277, nmarging=881), which resembles the way clinicians are likely to
use the
signature.
Date recue / Date received 202 1-1 1-25
82
Next, the present inventors used the signature to distinguish between
infectious
(bacterial or viral) and non-infectious controls on the Majority cohort test
set, yielding
an AUC of 0.96 0.02. Further evaluation using leave-10%-out cross-validation
gave
similar results (AUC=0.96 0.01). The signature outperformed any of the
individual
proteins (P<10-8). Again, evaluation on the Unanimous and Clear Diagnosis
cohorts
showed improved AUCs of 0.97 0.02, and 0.97 0.03, respectively. To obtain
conservative estimations of signature performance, the analysis that follows
focuses on
the Majority cohort.
Comparison with laboratory measurements, clinical parameters, and well-
established biomarkers: The signature was compared with well-established
clinical
parameters and laboratory measurements, including white blood count (WBC),
absolute
neutrophil count (ANC), percentage neutrophils, maximal temperature, pulse,
and
respiratory rate (Figure 3A and Example 2). The signature surpassed all
individual
parameters (P<10-18). Next, the signature was compared to a combination of
several
clinical parameters. To this end, multinomial logistic models were generated
for all
combinations of up to four clinical parameters. The best performing pair,
triplet and
quadruplet are depicted in Figure 3A (adding a fifth parameter did not improve
performance). The signature was significantly better than the best performing
clinical
parameters combination (P<10-15), which consisted of ANC, pulse, % lymphocytes
and
% monocytes, (AUC=0.94 0.02 vs. 0.77 0.04). Next, the signature performance
was
compared to PCT and CRP, two proteins routinely used in clinical practice to
diagnose
sepsis and bacterial infections (Example 2). The signature performed
significantly better
than both proteins (P<10-8 and P<106, respectively). The signature also
performed better
than a wide range of host-proteins with an established role in the immune
response to
infection, including sepsis and bacterial-related (e.g. TREM, IL-6 and IL-8),
virus-
related (e.g. IFN-y and IL-2), and inflammation-related (e.g. IL-la and TNF-a)
proteins
(P<10-8) (Figure 3B and Example 2, herein below).
Signature performance is robust across different patient subgroups: Patient
and pathogen heterogeneity, which are inherent in real-life clinical settings,
might
negatively affect the diagnostic utility of any individual host-biomarker. To
examine
Date recue / Date received 202 1-1 1-25
83
whether the signature, a combination of multiple biomarkers, can maintain
steady
performance despite patient-to-patient variability, subgroup analyses were
performed.
The signature was robust (AUCs between 0.87 and 1.0) across a wide range of
patient
characteristics, including age, clinical syndrome, time from symptom onset,
maximal
temperature, pathogen species, comorbidities, treatment with medications for
chronic
diseases, and clinical site (Figure 4 and Example 2, herein below). The
signature was
also tested on the subgroup of patients who were technically excluded, but had
unanimous labeling by the expert panel, which yielded an AUC of 0.96 0.06
(nBacterial-27, nvirg=14). This might suggest that the signature is applicable
more broadly
to conditions that were initially excluded (e.g. sub-febrile patients).
Signature performance remains unaffected by the presence of potential
colonizers: Many disease-causing bacteria are also part of the natural flora,
and are
frequently found in asymptomatic subjects.12,42-44 Such bacteria pose a
considerable
diagnostic challenge, because merely detecting them does not necessarily imply
a
causative role in the disease; therefore, appropriate treatment may remain
unclear. The
present inventors asked whether the signature performance is affected by their
presence.
Streptococcus pneumoniae (SP) and Haemophilus influenzae (HI), detected by
PCR on nasal swabs, were the two most common bacteria in the Majority group
(Table
1, herein above). High rates of SP and HI were found amongst both bacterial
and viral
patients (SP: 36% and 47%; HI: 20% and 32%), substantiating the understanding
that
their mere presence does not necessarily cause a disease.12 The patients were
stratified
based on whether or not they had SP (SP+: nBacterial-116, nvirai=157; SP-:
nBacterial =203,
nviral =177) and AUC performance of the two groups was compared. A significant
difference was not observed (0.93 0.03 vs. 0.94 0.02, P=0.31). The presence or
absence of HI did not affect signature performance either (0.94 0.04 vs. 0.93
0.02;
HI+: nBacteriai=63, nvirai=106; HI-: nBacterial ¨256, nvu-ai =228, P=0.34).
This indicates that
the signature remains unaffected by carriage of SP and HI.
Discussion
A rigorous composite reference standard strategy was constructed that included
the collection of clinical data, a chemistry panel, and a wide array of
microbiological
Date recue / Date received 202 1-1 1-25
84
tests, followed by labeling by three independent physicians. This process
generated a
hierarchy of three sub-cohorts with decreasing size and increasing reference
standard
certainty: Majority, Unanimous and Clear Diagnosis. The respective signature
AUCs
were 0.94+0.02, 0.96+0.02, and 0.99+0.01. This stepwise increase in
perfoiniance may
be attributed to the increase in reference standard certainty. However, the
increased
accuracy, particularly in the Clear Diagnosis cohort, may also be partially
due to a
selection bias of patients with severe illness or straightforward diagnosis.
Therefore, the
primary analysis presented herein focused on the Majority cohort, which
captures a
wider spectrum of illness severity and difficult-to-diagnose cases. This
cohort
potentially includes some erroneous labeling, thereby leading to conservative
estimations of the signature accuracy.
The signature addresses several challenges of current microbiological tests.
(i)
The difficulty of diagnosing inaccessible or unknown infection sites. The
signature
accurately diagnosed such cases, including lower respiratory tract infections
(AUC
0.95+0.03, n=153) and fever without source (AUC=0.97 0.03, n=123). (ii)
Prolonged
time to results (hours to days). The signature measures soluble proteins,
which are
readily amenable to rapid measurement (within minutes) on hospital-deployed
automated immunoassay machines and point-of-care devices. (iii) Mixed
infections may
lead to diagnostic uncertainty, because detection of a virus does not preclude
bacterial
co-infection.14'15 The signature addresses this by classifying mixed
infections together
with pure bacterial infections, thus prompting physicians to manage both
groups
similarly with regard to antibiotics treatment. The fact that mixed co-
infections elicited
a proteome host-response that is similar to pure bacterial, rather than a
mixture of
responses, may indicate pathway dominance of bacterial over viral. (iv) A
significant
drawback of microbiological tests, PCRs in particular, is detection of
potential
colonizers in subjects with non-bacterial diseases.12'13 The signature
performance was
unaffected by the presence or absence of potential colonizers.
Host-proteins, such as PCT, CRP and IL-6, are routinely used to assist in the
diagnosis of bacterial infections because they convey additional information
over
clinical symptoms, blood counts and microbiology." However, inter-patient and
pathogen variability limit their usefullness.' Combinations of host-proteins
have the
potential to overcome this, but have thus far yielded insignificant-to-
moderate
Date recue / Date received 202 1-1 1-25
85
diagnostic improvement over individual proteins.11-35-37 This modest
improvement may
be due to the reliance on combinations of bacterial-induced proteins that are
sensitive to
the same factors, and are therefore less capable of compensating for one
another.
Accordingly, a larger improvement was observed in combinations that included
host-
proteins, clinical parameters and other tests.11-35-37 Obtaining these
multiple parameters
in real-time, however, is often not feasible.
To address this, a combination of proteins with complementary behaviors was
identified. Specifically, it was found that TRAIL was induced in response to
viruses and
suppressed by bacteria, IP-10 was higher in viral than bacterial infections,
and CRP was
to higher in
bacterial than viral infections. While the utility of elevated CRP to suggest
bacterial infections is well established3145, the inclusion of novel viral-
induced proteins,
to complement routinely used bacterial-induced proteins, substantially
contributed to
the signature's robustness across a wide range of subgroups, including time
from
symptom onset, pathogen species and comorbidities among others. For example,
adenoviruses, an important subgroup of viruses that cause 5%-15% of acute
infections
in children are particularly challenging to diagnose because they induce
clinical
symptoms that mimic a bacterial infection.' Routine laboratory parameters
perform
poorly on this subgroup compared to the signature (AUCs=0.60 0.10 [WBC],
0.58 0.10 [ANC], 0.88 0.05 [signature]; n=223).
Despite advances in infectious disease diagnosis, timely identification of
bacterial infections remains challenging, leading to antibiotic misuse with
its profound
health and economic consequences. To address the need for better treatment
guidance,
the present inventors have developed and validated a signature that combines
novel and
traditional host-proteins for differentiating between bacterial and viral
infections. The
present finding in a large sample size of patients is promising, suggesting
that this host-
signature has the potential to help clinicians manage patients with acute
infectious
disease and reduce antibiotic misuse.
Date recue / Date received 202 1-1 1-25
86
EXAMPLE 2
A host-proteome signature for distinguishing between bacterial and viral
infections:
A prospective multi-center observational study ¨ supplementary material
Measures of accuracy: The signature integrates the levels of three protein
biomarkers measured in a subject, and computes a numerical score that reflects
the
probability of a bacterial vs. viral infection. To quantify the diagnostic
accuracy of the
signature a cutoff on the score was used and the following measures were
applied:
Sensitivity, specificity, positive predictive value (PPV), negative predictive
value
(NPV), total accuracy, positive likelihood ratio (LR+), negative likelihood
ratio
(LR-), and diagnostic odds ratio (DOR). These measures are defined as follows:
TP
Sensitivity = _______________________________
TP + FN
TN
Specificity = _______________________________
TN + FP
TP + TN
total accuracy = __________
TP + FN + TN + FP
= TP sensitivity = prevalence
PPV _____________
TP + FP = sensitivity = prevalence + (1 ¨ specificity) = (1 ¨ prevalence)
NPV _____________
TN specif icity = (1 ¨ prevalence)
= = ________________________________________________
TN + FN specif icity = (1 ¨ prevalence) + (1 ¨ sensitivity) = (prevalence)
Sensitivity
LR+ = _______________________________________
1 ¨ Specificity
LR
1 ¨ Sensitivity
= ___________________________________________
Specificity
LR +
DOR = LR ¨
P. N, TP, FP, TN, FN are positives, negatives, true-positives, false-
positives, true-
negatives, and false-negatives, respectively. Prevalence is the relative
frequency of the
Date recue / Date received 202 1-1 1-25
87
positive class (i.e., prevalence = P/(P + N)). Unless mentioned otherwise,
positives and
negatives refer to patients with bacterial and viral infections, respectively.
The area under the receiver operating curve (AUC) was also used to perform
cutoff independent comparisons of different diagnostic methods. For details on
formulation and confidence interval (CI) computation of the AUC see Hanley and
McNeil.' 95% CIs of the accuracy measures throughout this document are
reported.
Sample size: The primary study objective was to obtain the performance of the
signature for classifying patients with viral and bacterial etiologies. It was
estimated that
the sample size required to reject the null hypothesis that the sensitivity
and specificity
over the entire population, P, are lower than P0=75% with significance level
of 1%,
power of 90% for a difference of 15% (P1 - P0? 15%), which yielded 394
patients (197
viral and 197 bacterial). Additionally it was anticipated that roughly 15% of
the
patients will have an indeterminate source of infection, 10% would be excluded
for
technical reasons and 10% will be healthy or non-infectious controls. Taken
together,
the study required the recruitment of at least 607 patients. This requirement
was
fulfilled because 1002 patients were recruited.
Constructing a computation model logistic model: To integrate the protein
levels into a single predictive score, multiple computational models were
examined
including Artificial Neural Networks (ANN), Support Vector Machines (SVM),
Bayesian Networks (BN), K-Nearest Neighbor (KNN) and Multinomial Logistic
Regression (MLR).2'3 The AUCs for distinguishing between bacterial and viral
infections obtained on the Majority cohort using a leave-10%-out cross
validation were
0.93 0.02 (ANN), 0.93 0.02 (SVM flinear1), 0.94 0.02 [SVM (radial basis
function)1,
0.92 0.02 (BN), 0.91 0.02 (KNN) and 0.94 0.02 (MLR). Significant difference in
the
performances of ANN, SVM and MLR models (P>0.1 when comparing their AUCs)
were not observed. The present inventors chose to use MLR because it provides
a
probabilistic interpretation by assigning a likelihood score to a patient's
diagnosis.
The present inventors trained and tested the MLR signature for distinguishing
between bacterial and non-bacterial etiologies. Since the prevalence of
underlying
etiologies varies across different clinical settings, the model priors were
adjusted to
reflect equal baseline prevalence (50% bacterial and 50% non-bacterial).
Within the
Date recue / Date received 202 1-1 1-25
88
non-bacterial group the priors were adjusted to 45% viral and 5% non-
infectious, to
reflect the anticipated higher prevalence of viral versus non-infectious
patients among
subjects with suspicious for acute infection. The MLR weights and their
respective 95%
confidence intervals, as well as the p-values associated with each coefficient
are
summarized in Tables 3-4 herein below. In the bacterial versus viral infection
analysis
the probabilities were adjusted to sum up to 1 P b adjusted¨[Pb + Pv] and P b
adjusted¨[Pb +
Pa where Pb and Pv correspond to the probability of bacterial and viral
infections
respectively).
Table 3. MLR coefficients and their respective standard error
Second Coordinate First Coordinate
61 (bacterial) 6o (viral)
bo = -0.378 0.732 ao = -1.299 0.651 Constant
bi = -0.020 0.0084 al = 0.0088 0.0064 TRAIL
bz = 0.0875 0.015 az = 0.0605 0.0145 CRP
b3 = 0.0050 0.0014 a3 = 0.0053 0.0014 IP-10
to Table 4. The p-values associated with each MLR coefficient.
Class (bacterial) Class (viral)
<0.001 <0.001 Constant
<0.001 0.008 TRAIL
<0.001 <0.001 CRP
<0.001 <0.001 IP-10
Logistic calibration curves: In order to assess the validity of the MLR model,
the calculated prediction probabilities were compared with the actually
observed
outcomes (Figure 5). The predicted probabilities are highly compatible with
the
observed ones, further demonstrating the model validity.
Summary of the patient cohorts used in this study: A total of 1002 patients
were recruited and 892 were enrolled (110 were excluded based on pre-
determined
exclusion criteria). Based on the reference standard process described in the
'Methods'
section of Example 1, patients were assigned to four different diagnosis
groups: (i)
Date recue / Date received 202 1-1 1-25
89
bacterial; (ii) viral; (iii) no apparent infectious disease or healthy
(controls); and (iv)
indeterminate. Patients with mixed infections (bacteria plus virus) were
labeled as
bacterial because they are managed similarly (e.g. treated with antibiotics)
(Figure 1A).
In total, 89% of all enrolled patients were assigned a diagnosis, a rate which
approaches
the literature-documented limit.4-6 The following sections provide a detailed
description
of patient characteristics, which includes all the patients with a final
diagnosis (n=794):
765 patients of the Majority cohort and 29 patients for which the serum
samples were
depleted during the screening phase (Figures 1A-B).
Age and gender distribution: Patients of all ages were recruited to the study.
The
patients with agreed diagnosis (diagnosed patients; n=794) included more
pediatric (<18
years) than adult (>18 years) patients (445 patients [56%] vs. 349 [44%1). The
age
distribution was relatively uniform for patients aged 20-80 years and peaked
at <4 years
of age for pediatric patients (Figures 6A-B). The observed age distribution
for pediatric
patients is consistent with that expected and represents the background
distribution in
the inpatient setting' (e.g., the emergency department [ED], pediatrics
departments, and
internal depai __ intents). Patients of both genders were recruited to the
study. The patient
population was balanced in respect to gender distribution (47 % females, 53 %
males).
Detected pathogens: A wide panel of microbiological tools were used in order
to
maximize pathogen detection rate. At least one pathogen was detected in 65% of
patients with an acute infectious disease (56% of all 794 diagnosed patients).
A total of
36 different pathogens were actively detected using multiplex PCR, antigen
detection,
and serological investigation. Additional 20 pathogens were detected using
standard
culture techniques or in-house PCR. Altogether, 56 different pathogens from
all major
pathogenic subgroups were detected (Figure 7A). This rate of pathogen
identification is
similar to that reported in previously published studies and included
pathogens from all
major pathogenic subgroups (Gram-negative bacteria, Gram-positive bacteria,
atypical
bacteria, RNA viruses, and DNA viruses). In 13% of the patients, pathogens
from more
than one of the aforementioned pathogenic subgroups were detected (Figure 7A).
The pathogenic strains found in this study are responsible for the vast
majority of
.. acute infectious diseases in the Western world and included key pathogens
such as
influenza A/B, respiratory syncytial virus (RSV), parainfluenza, E. Coil,
Group A
Date recue / Date received 202 1-1 1-25
90
Streptococcus, etc. Notably, analysis of the detected pathogens revealed that
none of the
pathogens is dominant (Figure 7B).
Involved physiologic systems and clinical syndromes: The infectious disease
patients (all diagnosed patients [n=794], excluding those with non-infectious
diseases or
healthy subjects, n=673) presented with infections in a variety of physiologic
systems
(Figure 8). The most frequently involved physiologic system was the
respiratory system
(46%), followed by systemic infections (22%). All infections that did not
involve the
aforementioned systems and were not gastrointestinal, urinary, cardiovascular,
or central
nervous system (CNS) infections were categorized as 'Other' (e.g., cellulitis,
abscess).
The observed distribution of physiologic system involvement represents the
natural
distribution and is consistent with that reported for large cohorts of
patients sampled
year-round.
The diagnosed patients in the present study (n=794) presented with a variety
of
clinical syndromes (Figures 9A-B) that reflects the expected clinical
heterogeneity in a
cohort of pediatric and adult patients collected year-round. The most frequent
clinical
syndrome was LRTI (21%) including mainly pneumonia, bronchitis, bronchiolitis,
chronic obstructive pulmonary disease (COPD) exacerbation, and non-specific
LRTI.
The second most frequent syndrome was systemic infection (19%) including
mainly
fever without a source and occult bacteremia cases. Systemic infections were
primarily
detected in children <3 years of age but were also detected in a few adult
patients.
Systemic infections constitute a real clinical challenge as balancing between
patient risk
and the costs of testing/treatment is unclear. The third most frequent
clinical syndrome
was URTI (19%) including mainly acute tonsillitis, acute pharyngitis, non-
specific
URTI, acute sinusitis, and acute otitis media. The next most frequent
syndromes were
gastroenteritis (12%), UTI (7%), and cellulitis (4%). CNS infections (2%)
included
septic and aseptic meningitis. Additional clinical syndromes (1%) were
classified as
'Other' and included less common infections (e.g., otitis externa,
epididymitis, etc.). The
observed pattern of clinical syndrome distribution represents most of the
frequent and
clinically relevant syndromes and is consistent with previously published
large studies.
Core body temperature: Core body temperature is an important parameter in
evaluating infectious disease severity. The distribution of maximal body
temperatures
was examined in all of the diagnosed patients (n=794) using the highest
measured body
Date recue / Date received 202 1-1 1-25
91
temperature (per-os or per-rectum). The distribution of the maximal body
temperatures
was relatively uniform between 38 C and 40 C with a peak of at 39 C (Figure
10). Body
temperature <37.5 C was reported for 15% of patients (the subgroup of patients
with
non-infectious diseases or healthy subjects). Body temperature >40.5 C was
rare (<3%
of patients). Altogether, the observed distribution represents the normal
range of
temperatures in the clinical setting.
Time from symptoms onset: 'Time from symptoms' was defined as the duration
(days) from the appearance of the first presenting symptom (the first
presenting
symptom could be fever but could also be another symptom such as nausea or
headache
preceding the fever). The distribution of 'time from symptoms' in our cohort
(all
diagnosed patients, n=794) peaked at 2-4 days after the initiation of symptoms
(35% of
patients) with substantial proportions of patients turning to medical
assistance either
sooner or later (Figure 11).
Comorbidities and chronic drug regimens: Comorbidities and chronic drug
regimens may, theoretically, affect a diagnostic test. Out of the diagnosed
patients 62%
had no comorbidities whereas 38% had >1 chronic disease. In addition, 75% of
patients
were not treated with chronic medications and 25% were treated with >1 chronic
medication. The most frequent chronic diseases in our patient population were
hypertension, hyperlipidemia, lung diseases (e.g., COPD, asthma, etc.),
diabetes mellitus
(mostly type 2), and ischemic heart disease, minoring the most common chronic
diseases in the Western world (Figure 12A). The distribution of chronic drugs
used by
our patient population strongly correlated with the range of reported chronic
diseases
(e.g., 29% of the patients with comorbidities had hyperlipidemia and lipid
lowering
agents were the most frequently used drugs). Other frequently used drugs
included
aspirin, blood glucose control drugs, and beta blockers (Figure 12B).
Patient recruitment sites: Pediatric patients (<18 years) were recruited from
pediatric emergency deparnnents (PED), pediatric wards and surgical
departments, and
adults (>18 years) from emergency deparnnents (ED), internal medicine
departments
and surgical departments. The pediatric ED was the most common recruitment
site
(39%) and the other sites were comparable (17-20%) reflecting a relatively
balanced
recruitment process. The ratio between ED patients and hospitalized patients
was ¨1:1
for adults and ¨2:1 for children (Figure 13).
Date recue / Date received 202 1-1 1-25
92
Characteristics of excluded patients: Of the 1002 patients recruited for the
study, 110 patients (11%) were excluded (some patients fulfilled more than one
exclusion criterion). The most frequent reason for exclusion was having a
fever below
the study threshold of 37.5 C (n=54), followed by time from symptom initiation
of >12
days (n=26) and having a recent (in the preceding 14 days) infectious disease
(n=22).
Other reasons for exclusion included having an active malignancy (n=14), and
being
immunocompromised (e.g., due to treatment with an immunosuppressive drug;
n=2).
Characteristics of indeterminate patients: A total of 98 patients were defined
as
indeterminate based on the inability of the expert panel to reliably establish
a composite
reference standard, despite the rigorous collection of laboratory and clinical
information. While it is not possible to directly examine the signature
performance in
these patients in the absence of a reference standard, it is possible to
analyze their host-
protein response in order to assess whether they differ from patients with a
reference
standard. We compared the distribution of TRAIL, IP-10 and CRP in acute
infection
patients with a reference standard (n=653) to those without a reference
standard (n=98).
No statistically significant difference was observed (Kolmogorov Smirnov test
P = 0.20,
0.25, 0.46 for TRAIL, IP-10 and CRP, respectively). The similarity in the host-
protein
response between patients with and without a reference standard implies that
the present
.. approach may be useful for diagnosing indeterminate patients in the
clinical setting.
The signature performance remains robust across different patient subgroups:
In Example 1, the present inventors demonstrated that the signature remained
robust
across a wide range of patient characteristics including age, clinical
syndrome, time
from symptom onset, maximal temperature, pathogen species, comorbidities, and
the
clinical site with AUCs ranging from 0.87 to 1.0 (Figure 4). In this Example,
a review
of the performance of the signature across additional patient subgroups is
provided.
Stratification by chronic drug regimens: In real-world clinical practice,
patients
.. are often under various chronic drug regimens, which could, potentially,
affect the level
of proteins comprising the signature. The present inventors therefore examined
whether
the most used drugs (by categories) in our cohort impact the signature's
performance.
Date recue / Date received 202 1-1 1-25
93
None of the evaluated drug groups were associated with significant alterations
in the
signature's accuracy (Table 5).
Table 5. Evaluation of the signature's sensitivity to various types of chronic
drug
regimens.
Viral Bacterial Total
AUC [95% CI] Drug category
patients, n patients, n patients, n
7 43 50 [0.90, 1.00] 0.95 Anti Hypertensive
6 48 54 [0.96, 1.00] 0.99 Anti platelets
7 35 42 [0.80, 1.00] 0.90 Anti-acid
4 25 29 [0-93, 1-00] 0.98 Antidepressants
35 40 [0.88, 1.00] 0.95 Beta Blocker
5 34 39 [0.86, 1.00] 0.94 Ca Channel Blocker
11 53 64 [0.89, 1.00] 0.94 Cholesterol/TG
Lowering
5 35 40 [0.74, 1.00] 0.87 Diabetic
5 25 30 [0-83, 1-00] 0.93 Diuretics
4 14 18 [0.93, 1.00] 0.98 Hormonal
8 18 26 [0.87, 0.99] 0.95 Inhaled CS
4 21 25 [0.84, 1.00] 0.94 Prostate Hypertrophy
5 Sepsis
based stratification: Sepsis is a potentially fatal medical condition
characterized by a whole-body inflammatory state (called systemic inflammatory
response syndrome [SIRS]) and the presence of a known or suspected infection.
Patients
with a bacterial sepsis benefit from early antibiotic therapy; delayed or
misdiagnosis can
have serious or even fatal consequences. The present inventors focused on
adult patients
for whom the definition of SIRS is clear and examined the ability of the
signature to
distinguish between adult patients with bacterial sepsis and those with viral
infections as
well as between adult patients with bacterial sepsis and those with viral
sepsis.
Adult patients with bacterial sepsis were defined according to the American
College of Chest Physicians and the Society of Critical Care Medicine. SIRS
was
defined by the presence of at least two of the following findings: (i) body
temperature
<36 C or >38 C, (ii) heart rate >90 beats per minute, (iii) respiratory rate
>20 breaths
per minute or, on blood gas, a PaCO2 <32 mm Hg (4.3 kPa), and (iv) WBC <4,000
cells/mm3 or >12,000 cells/mm3 or >10% band forms. It was found that the
signature
achieved very high levels of accuracy in distinguishing between adult patients
with
bacterial sepsis and those with viral sepsis (AUC of 0.97 and 0.93 for the
Unanimous
[adult bacterial sepsis, adult viral sepsis] and the Majority [adult bacterial
sepsis, adult
Date recue / Date received 202 1-1 1-25
94
viral sepsis] cohorts, respectively). These results demonstrate the utility of
the signature
in differentiating adult patients with bacterial sepsis from adult patients
with viral
infections.
Table 6. Signature accuracy in diagnosing bacterial sepsis vs. viral sepsis in
adult patients
Viral Bacterial Total
AUC [95% CI]
patients, n patients, n patients, n
21 93 114 10.94, 1.00] 0.97 Unanimous
35 112 147 [0.89, 0.97] 0.93 Majority
Bacterial vs. non-bacterial patients stratification: Antibiotic misuse
typically
stems from the use of these drugs to treat non-bacterial (viral or non-
infectious) patients
or due to delayed or missed diagnosis of bacterial infections.
Therefore, the present inventors further examined the signature performance
for
distinguishing between bacterial and non-bacterial patients. The entire
Majority cohort
was evaluated using leave-10%-out cross-validation, yielding an AUC of 0.94
0.02.
Improved performances were shown when evaluating the Unanimous cohort (AUC of
0.96 0.02), and after filtering out patients with a marginal immune response
(Table 7).
Table 7. Signature measures of accuracy for diagnosing bacterial vs. non-
bacterial (viral and non-infectious) patients. A. Performance estimates and
their 95%
Cis were obtained using a leave-10%-out cross-validation on all patients in
the
Unanimous (nBacteria1=256, nNon-bacterial=383), and Majority (nBacterial=319,
nN011-
bacterial=446) cohorts. B. The analysis was repeated after filtering out
patients with a
marginal immune response (Unanimous MBacteria1237, nNon-bacterial=343,
nMarginal=591,
and Majority inBacterial=292, nNon-bac1eria1=387, nMarginal=861), which
resembles the way
clinicians are likely to use the signature.
B. Marginal A. All patients
immune response filter
Majority Unanimous Majority Unanimous
Accuracy
cohort cohort cohort cohort measure
0.95 0.96 0.94 0.96
(0.93, 0.97) (0.94, 0.98) (0.92, 0.96) (0.94, 0.98) AUC
Date recue / Date received 2021-11-25
95
0.91 0.93 0.88 0.91
(0.89, 0.93) (0.91, 0.95) (0.85, 0.91) (0.89, 0.93) Total
accuracy
0.91 0.92 0.87 0.88
(0.88, 0.95) (0.88, 0.95) (0.83, 0.91) (0.85, 0.91)
Sensitivity
0.92 0.94 0.90 0.93
(0.89, 0.95) (0.91, 0.96) (0.87, 0.93) (0.91, 0.95)
Specificity
11.4 15.3 8.7 12.6
(8, 16) (10, 23) (6, 12) (9, 18) LR+
0.1 0.08 0.14 0.13
(0.07, 0.14) (0.05, 0.13) (0.11, 0.19) (0.09, 0.18) LR-
116 180 60 97
(67, 200) (94, 344) (38, 94) (56, 168) DOR
Protein stability at different temperatures can affect the assay performance:
The utility of a biomarker depends on its stability in real-life clinical
settings (e.g., its
decay rate when the sample is stored at room temperature prior to analyte
measurement).
To address this, we examined the stability of TRAIL, CRP and IP-10 in serum
samples
from four independent individuals during 24 hours at 4 C and 25 C. Aliquots of
100 lit
from each plasma sample were pipetted into 0.2 mL tubes and kept at 4 C or 25
C from
0 to 24 hours. Subsequently, the levels of the analytes were measured
(different time-
points of the same analytes were measured using the same plate and reagents).
The
analyte half-lives at 4 and 25 C were greater than 72 hours for TRAIL, CRP
and IP-10
(Figures 15A-C). Of note, in the real clinical setting, if the samples are
stored at room
temperature, the concentrations of TRAIL, IP-10 and CRP should be measured
within
about 24 after the sample is obtained. Preferably they should be measured
within 5
hours, 4 hours, 3 hours, 2 hours, 1 hour, or even immediately after the sample
was
obtained. Alternatively, the sample should be stored at a temperature lower
than 10 C,
and then TRAIL can be measured more than 24 after obtaining the sample.
The three protein combination outperforms any individual and pairs of
proteins: The combination of the three proteins outperforms that of the
individual and
pairs of proteins for distinguishing bacterial vs. viral and infectious vs.
non-infectious
patients.
Table 8: Bacterial vs. viral
Proteins Protein Protein
AUC #3 #2 #1
0.89 - - TRAIL
Date recue / Date received 202 1-1 1-25
96
0.88 CRP
0.66 IP-10
0.95 CRP TRAIL
0.93 IP-10 CRP
0.90 IP-10 TRAIL
0.96 IP-10 CRP TRAIL
Table 9: Infectious vs. Noninfectious
Proteins Protein Protein
AUC #3 #2 #1
0.60 TRAIL
0.87 CRP
0.89 IP-10
0.90 CRP TRAIL
0.95 IP-10 CRP
0.89 IP10 TRAIL
0.96 IP-10 CRP TRAIL
Performance analysis as a function of the prevalence of bacterial infections:
The prevalence of bacterial and viral infections is setting dependent. For
example, in the
winter, a pediatrician in the outpatient setting is expected to encounter
substantially
more viral infections than a physician in the hospital internal depai __ anent
during the
summer. Notably, some measures of diagnostic accuracy such as AUC,
sensitivity, and
specificity are invariant to the underlying prevalence, whereas other measures
of
accuracy, such as PPV and NPV are prevalence dependent. In this section, the
expected
signature performance in terms of PPV and NPV in clinical settings with
different
prevalence of bacterial and viral infections is reviewed.
As the basis for this analysis the signature accuracy measures were used that
were obtained using the Unanimous (bacterial, viral) and Majority (bacterial,
viral)
cohorts. The prevalence of bacterial infections in the Unanimous cohort was
51.7%
yielding a PPV of 93% 3% and NPV of 93% 3%. The prevalence of bacterial
infections in the Majority cohort was 48.7% yielding a PPV of 89% 3% and NPV
of
92% 3%.
The measured sensitivity and specificity was used to compute the expected
changes in the signature PPV and NPV as a function of the prevalence of
bacterial
infections (Figures 14A-B).
Date recue / Date received 202 1-1 1-25
97
Examples of different clinical settings and the extrapolated signature PPV and
NPV for each of them are presented in Table 10A.
Table 10A. Extrapolated signature PPV and NPV in different clinical settings,
based on the Unanimous cohort.
Prevalence
of Bacterial
NPV PPV infections* Age Setting
98% 76% 20% Children Outpatient
97% 85% 35% Adults Outpatient
94% 93% 50% Children Inpatient
78% 98% 80% Adults Inpatient
*An average annual prevalence. Estimates of bacterial infection prevalence are
based on data reported in
the Bacterial etiology chapter, Part 7 of Harrison's Internal Medicine 17th
Edition.
The signature outperforms standard laboratory and clinical parameters for
diagnosing bacterial vs. viral infections: Standard laboratory and clinical
parameters,
some of which are routinely used in clinical practice to aid in the
differential diagnosis
of an infection source, were evaluated in the Majority cohort (bacterial,
viral, non-
infectious, n=765). The evaluated parameters included ANC, % neutrophils, %
lymphocytes, WBC, and maximal temperature. In accordance with the well-
established
clinical role of these parameters, we observed a statistically significant
difference in
their levels between bacterial and viral patients (Figures 15A-E). For
example, bacterial
patients had increased levels of ANC (P <10-24), and WBC (P <10-m), whereas
viral
patients had a higher % lymphocytes (P <10-3'). The signature was
significantly more
accurate than any of the individual features (P<10-") and their combinations
(P<1045),
see Figure 3A).
The signature outperforms protein biomarkers with a well-established
immunological role: The signature outperformed all clinical parameters and the
600
proteins that were evaluated during the screening phase (see Figures 3A-B).
The
following section further compares the signature to selected proteins that are
routinely
used in the clinical setting or that have an immunological role.
One of the most widely used and useful protein biomarkers for differentiating
sepsis from other non-infectious causes of SIRS in critically ill patients is
procalcitonin
(PCT). Whether PCT can be used to distinguish between local bacterial and
viral
infections is less clear. To test this, we measured PCT concentrations in 76
randomly
Date recue / Date received 202 1-1 1-25
98
selected patients from the Unanimous (bacterial, viral) cohort
(11Bacterial=39, nViral=37) and
101 randomly selected patients from the Majority (bacterial, viral) cohort
(nBacterial-51,
TIViral=50) and compared the diagnostic accuracy based on PCT levels to that
of the
signature. PCT accuracy was calculated using the standard cutoffs routinely
applied in
the clinical setting (0.1 ng/mL, 0.25 ng/mL, 0.5 ng/mL, and 1 ng/mL.19-23
Maximal PCT
sensitivity of 69% was attained at a cutoff of 0.1mg/mL and resulted in a
specificity of
62% (for the Unanimous [bacterial, viral] cohort). For the same cohort, the
signature
showed significantly higher sensitivity of 94% (P < 0.001) and specificity of
93% (P <
0.001) (Figure 16A). A comparison using the patients from the Majority
(bacterial, viral)
cohort showed similar results (Figure 16B).
Overall, despite its high diagnostic and prognostic value for sepsis detection
in
critically ill patients, our results indicate that PCT is less accurate in
distinguishing
between patients with local infections (bacterial vs. viral).
Another protein biomarker used in the clinical setting is the C-reactive
protein
(CRP), an acute phase response protein that is up-regulated in infections and
other
inflammatory conditions. The performance of CRP was compared to that of the
signature using the entire Unanimous (bacterial, viral) and Majority
(bacterial, viral)
cohorts. CRP accuracy was determined using several standard cutoffs applied in
the
clinical setting.24-26 Maximal CRP sensitivity of 92% was attained at 20 mg/mL
cutoff
resulting in a specificity of 60% (for the Unanimous [bacterial, viral]
cohort) (Figure
17A). The signature had a similar sensitivity (94%) and a significantly higher
specificity
(93%, P <10-9) in the same cohort. Similar results were observed using the
Majority
(bacterial, viral) cohort (Figure 17B). Overall, the signature has a similar
sensitivity to
CRP with a 20 mg/L cutoff but a considerably higher specificity for
distinguishing
bacterial from viral patients.
Next, the differential response of protein biomarkers with a well-established
role
in the host response to infections was examined (Table 10B and Figures 18A-H).
Each
biomarker was tested on at least 43 patients (about half bacterial and half
viral), and if it
showed promising results, it was further tested on additional patients (up to
150).
Date recue / Date received 202 1-1 1-25
99
Table 10B. A list of protein biomarkers with a well-established role in the
host
response against infections, and the number of patients used to test each
biomarker
(for each analysis the analyzed patients included approximately half bacterial
and
half viral patients).
No. of Protein
patients Short description biomarker
120 CD11 a is expressed by all leukocytes as part of the integrin
CD1la
lymphocyte
function-associated antigen-1 (LFA-1). LFA-1 plays a central role in
leukocyte intercellular adhesion through interactions with its ligands,
ICAMs 1-3 (intercellular adhesion molecules 1 through 3). CD ii a
also functions in lymphocyte co-stimulatory signaling.
79 CD11C is an integrin a X chain protein and mediates cell-cell
CD11C
interactions during inflammatory responses.
82 CD80 is a membrane receptor involved in the co-stimulatory signal
CD80
essential for T-lymphocyte activation. The binding of CD28 or
CTLA-4 to CD80 induces T-cell proliferation and cytokine
production.
65 These are MHC class I antigens associated with132-microglobulin
HLA-A,B,C
and are expressed by all human nucleated cells. HLA-A,B,C are
central in cell-mediated immune response and tumor surveillance.
49 IFN-y is a soluble cytokine. IFN-y participates in innate and
adaptive IFN-y
immunity against viral and intracellular bacterial infections and in
tumor control.
43 IL-la is a member of the IL-1 cytokine family. IL-la is a
pleiotropic IL-la
cytokine involved in various immune responses, inflammatory
processes, and hematopoiesis. IL-la is produced by monocytes and
macrophages as a proprotein, which is proteolytically processed and
released in response to cell injury, thereby inducing apoptosis.
49 IL-2 is produced by T-cells in response to antigenic or mitogenic
IL-2
stimulation. IL-2 is required for T-cell proliferation and other
activities crucial for regulation of the immune response.
43 IL-6 is a cytokine that functions in inflammation and maturation
of B IL-6
cells. IL-6 is an endogenous pyrogen capable of inducing fever in
people with autoimmune diseases or infections.
43 IL-8 is a member of the CXC chemokine family and functions as one
IL-8
of the major mediators of the inflammatory response.
43 IL-9 is a cytokine that acts as a regulator of a variety of
hematopoietic IL-9
cells.
IL-9 supports IL-2 independent and IL-4 independent growth of
helper T-cells.
Date recue / Date received 2021-11-25
100
48 IL-10 is a cytokine produced primarily by monocytes and to a
lesser IL-10
extent by lymphocytes. IL-10 has pleiotropic effects in
immunoregulation and inflammation.
49 IL-15 is a cytokine that stimulates the proliferation of T-
lymphocytes. IL-15
49 IL-16 functions as a chemo-attractant, a modulator of T cell IL-
16
activation, and an inhibitor of HIV replication.
54 sTNFRSF1A is a receptor for TNFSF2/TNF-a and homo-trimeric
sTNFRSF1A
TNFSF1/1ymphotoxin-a that contributes to the induction of non-
cytocidal TNF effects including anti-viral state and activation of the
acid sphingomyelinase.
43 TNF-a is a cytokine secreted mainly by macrophages. TNF-a can
TNF-a
induce cell death of certain tumor cell lines. It is a potent pyrogen
causing fever directly or by stimulation of IL-1 secretion.
43 TNF-I3 is a potent mediator of inflammatory and immune responses.
TNF-I3
It is produced by activated T and B lymphocytes and is involved in
the regulation of various biological processes including cell
proliferation, differentiation, apoptosis, lipid metabolism,
coagulation, and neurotransmission.
150 TREM is a pro-inflammatory amplifier present on neutrophils and
TREM
monocytes.
Since these biomarkers do not have a well-established cutoff in the clinical
setting, we used their AUCs as a basis for comparison (Figure 3B) The most
informative biomarker was TREM (AUC of 0.68 0.09). The accuracy of TREM was
significantly lower than that of the signature (P <1 0' when comparing the two
AUCs;
Figure 3B). These results demonstrate that mere participation of a protein in
the host
response to an infection does not necessarily imply diagnostic utility. For
example,
although IFN-y has a well-established role in the immune response to viruses
and intra-
cellular bacteria, its short half-life (<20 h)27 limits its diagnostic utility
(as its
concentration in the blood is highly dependent on the time from infection
onset).
EXAMPLE 3
Trinary classifier outperforms a binary classifier
In the binary model the classifier is trained by classifying all samples as
either
'Bacterial' or 'Non-bacterial' ('Viral' and 'Non-infectious' are grouped). In
the trinary
model, the classifier learns to distinguish between three classes 'Bacterial',
'Viral' and
Date recue / Date received 2021-11-25
101
'Non-infectious'. The probability of the viral and the non-infectious are then
grouped
together to give the probability of 'non-bacterial'. This was demonstrated on
the present
data.
Both of the above classifiers were evaluated using a leave 10%- out cross-
validation on both the Majority and Unanimous cohorts.
RESULTS
Running the binary classifier on the majority cohort yields the results as
summarized in Table 10C, herein below:
Table 10C
Reference class
Viral and
non-
Bacterial infectious
(B) (V+NI)
63 411 V+NI
256 35 B
The sensitivity of the classifier on the Majority cohort is 80.3% and the
specificity is 92.2%.
Running the multinomial based classifier on the same dataset yields the
following results summarized in Table 10D.
Table 10D
Reference class
(B) (V+NI)
54 417 V+NI
265 29 B
Date recue / Date received 202 1-1 1-25
102
It can be seen that this classifier outperforms the previous one both in terms
of
sensitivity and in terms of specificity. The sensitivity was improved to 83.1%
and the
specificity to 93.5%.
Running the binary classifier on the Unanimous cohort yields the results
summarized in Table 11.
Table 11
Reference class
(B) (V+NI)
39 358 V+NI
217 25 B
The sensitivity of the classifier on the Unanimous cohort is 84.8% and the
specificity is 93.5%.
Running the multinomial based classifier on the same dataset yields the
results
summarized in Table 12.
Table 12
Reference class
(B) (V+NI)
38 364 V+NI
218 19 B
This classifier outperforms the previous one both in terms of sensitivity and
in
terms of specificity. The sensitivity was improved to 85.2% and the
specificity to
95.0%.
In summary, the trinary classifier outperforms the binary based classifier
both in
terms of sensitivity and in terms of specificity on both datasets tested.
Date recue / Date received 202 1-1 1-25
103
EXAMPLE 4
The clinical accuracy of the signature remains robust even when analytical
accuracy
is reduced
It is important to assess how clinical accuracy is affected by the increase in
the
CV (std/mean) of the proteins measurements, because often different
measurement
devices, particularly those that are useful at the point-of-care, show
increased CVs (i.e.
reduced analytical accuracy).
The present inventors examined the change in AUC of the signature for
distinguishing bacterial from viral infection as a function of the increase in
CV of both
TRAIL and CRP. This was done by taking the original patient data of the
Unanimous
cohort and simulating an increase in CV using monte-carlo simulations (Figures
19A-
B). Specifically, for each combination of TRAIL and CRP CVs, 100 simulated
measurements were assigned to each of the patients and the AUC in each case
was
recomputed. The average AUC per CV combination is depicted. It can be seen
that the
signature clinical accuracy (in terms of AUC) is robust to the increases in
technical CV.
For example, increasing the ELISA CV by 0, 0.24 and 0.4 leads to a reduction
in AUCs
of 0.96, 0.95 and 0.94 respectively. Similar results are obtained when
increasing the CV
of IP-10, and when repeating the simulations on the Majority cohort.
This result may be explained by the usage of multiple biomarkers that
compensate for one another. This surprising finding is useful because it opens
the way
to perform measurements of the proteins on cheap and rapid technologies (such
as POC
technologies), which often show reduced analytical sensitivity (compared for
example
to automated immunoassays or ELISA), without losing clinical accuracy.
EXAMPLE 5
Different ELISA protocols can be applied for measuring TRAIL and IP-10,
which would lead to different signal to noise ratios, and consequentially to
different
concentrations being measured. More specifically, while the overall trend of
the
biomarkers will be preserved regardless of the protocol (e.g. TRAIL increases
in viral
infections and decreases in bacterial), the measurement scale is protocol
dependent. In
the following subsections, examples of protocols are described that lead to
different
measured concentrations of IP-10 and TRAIL.
Date recue / Date received 202 1-1 1-25
104
Measurements of soluble IP-10 and TRAIL using ELISA ¨ Protocol no. 1: To
determine the concentrations of soluble IP-10 and TRAIL in human plasma and
serum
samples, a standard Sandwich ELISA (Enzyme-linked immunosorbent assay) was
used.
Briefly, the wells of 96-well plate were coated with capture-antibody specific
to TRAIL
and IP-10 and diluted in coating buffer (e.g. 1xPBS) followed by overnight
incubation
at 4 C. The wells were washed twice with washing buffer (e.g. 1xPBS with 0.2%
Tween-20) and subsequently blocked with blocking buffer containing proteins
(e.g.
1xPBS with 0.2% Tween-20 and 5% non-fat milk) for at least 2 hours at room
temperature or overnight at 4 C. Wells were then washed twice with washing
buffer.
Protein standards and plasma or serum samples were incubated for two hour at
room
temperature. Then, the wells were washed three times with a washing buffer and
subsequently incubated with an HRP conjugated detection-antibody specific to
TRAIL
and IP-10, diluted in blocking buffer for two hours at room temperature.
The wells were washed four times with a washing buffer and incubated with a
reaction solution that contained an HRP substrate (e.g. TMB; 3, 3', 5,5'-
Tetramethylbenzidine). After adequate color development, a stop solution was
added to
each well. The absorbance of the HRP reaction product in 450 nm was determined
using
standard spectrophotometer. This protocol took 5 (TRAIL) and 4.75 (IP10) hours
respectively and is referred to herein as the slow protocol.
Measurements of soluble IP-10 and TRAIL using ELISA ¨ Protocol no. 2:
Reducing assay time allows for increased clinical utility. To further reduce
the
protocol run time, the protocol was optimized for measuring TRAIL and IP10 and
reduced to less than 100 minutes. The rapid protocol was performed as follows:
50 1 of assay diluent and 50 1 of Standards was added to samples or controls
per well. The reaction was incubated for 30 minutes at room temperature on a
horizontal orbital microplate shaker (3mm orbit) set at 550 rpm. Each well was
then
aspirated and washed four times by using a wash buffer. Next, 200 1 of
Conjugate was
added to each well and the reactions were incubated for 45 minutes at room
temperature
on the shaker. The wells were washed four times with a washing buffer and
incubated
with a reaction solution that contained an HRP substrate (e.g. TMB; 3, 3',
5,5'-
Tetramethylbenzidine). After 10-25 minutes, a stop solution was added to each
well.
The absorbance of the HRP reaction product in 450 nm was determined using a
Date recue / Date received 202 1-1 1-25
105
standard spectrophotometer. This protocol took 99 (TRAIL) and 85 (IP-10)
minutes
respectively and is referred to herein as the rapid protocol.
The slow and the rapid protocol measurements were compared using 357
samples for TRAIL and 189 samples for IP-10, and showed highly correlated
results
(Figures 30A-B).
Of note, the average TRAIL concentration obtained using the rapid protocol was
roughly 70 percent less than that obtained using the slow protocol
concentration. Such
alterations in measured concentrations of proteins across different protocols
often occur
and can be compensated for by correlating the measurements of the two
protocols and
.. computing a transformation function. For example, the transformation
function y slow
= 0.709 x y rapid ¨ 3e-12 may be used to translate the concentrations of the
rapid
protocol and the slow protocol. This translation preserves TRAIL's accuracy.
Other,
translation functions and protocols can be developed by one skilled in the art
that also
preserve the accuracy. In summary, the behavior of TRAIL remains the same
across the
.. two protocols (i.e. highest in viral, lower in non-infectious and lowest in
bacterial),
despite a shift in the calculated concentrations.
Different protocols and cohorts lead to different model coefficients:
An example of the multinomial logistic model coefficients generated on the
majority patients cohort when measuring IP-10 and TRAIL with the slow protocol
is
shown in Table 13:
Table 13
Second Coordinate First Coordinate
81 (bacterial) 8o (viral)
bo = -1.5389 0.75676 ao =4.7331 0.62936 Const
b = 0.0851 0.015288 ai = 0.0514 0.014896 CRP (mg/ml)
bz = 0.0046 0.001372 az = 0.0049 0.001372 IP10 (pg/ml)
b3 = -0.0155 0.007056 a3 = 0.0048 0.005096 TRAIL (pg/ml)
An example of the multinomial logistic model coefficients generated on the
consensus patients cohort when measuring IP-10 and TRAIL with the slow
protocol is
shown in Table 14.
Date recue / Date received 202 1-1 1-25
106
Table 14
Second Coordinate First Coordinate
81 (bacterial) 80 (viral)
bo = 2.6091 0.9357 ao =-2.6866 0.75048 Const
bi = 0.0866 0.016856 ai = 0.0499 0.016464 CRP (mg/mt)
bz = 0.0052 0.001568 az = 0.0059 0.001568 IP10 (pg/m1)
b3 = -0.0115 0.008232 a3 = 0.0084 0.005684 TRAIL (pg/m1)
Since the frequency of the subgroups in the patient cohort deviates from the
anticipated frequency in the general population, one can further adjust the
model
coefficients to reflect a predetermined prior probability using standard
techniques for
coefficient adjustment (for example see G. King and L Zeng, Statistics in
Medicine
2002). For example, the following examples show multinomial logistic model
coefficients generated on the majority patients cohort when measuring IP-10
and
TRAIL with the slow protocol, reflecting prior probability of 45% bacterial,
45% viral
and 10% non-infectious.
Model coefficients (trained on majority cohort) after prior adjustment are
summarized in Table 15:
Table 15
Second Coordinate First Coordinate
81 (bacterial) 60 (viral)
bo = -1.1302 0.75676 ao =4.4151 0.62936 Const
bi = 0.0851 0.015288 = 0.0514 0.014896 CRP (mg/mt)
bz = 0.0046 0.001372 az = 0.0049 0.001372 IP10 (pg/m1)
b3 = -0.0155 0.007056 a3 = 0.0048 0.005096 TRAIL (pg/m1)
Model coefficients (trained on consensus cohort) after prior adjustment are
summarized in Table 16.
Table 16
Second Coordinate First Coordinate
81 (bacterial) 80 (viral)
bo = -1.7833 0.9357 ao =-2.083 0.75048 Const
bi = 0.0866 0.016856 ai = 0.0499 0.016464 CRP (mg/mt)
bz = 0.0052 0.001568 az = 0.0059 0.001568 IP10 (pg/m1)
b3 = -0.0115 0.008232 a3 = 0.0084 0.005684 TRAIL (pg/m1)
Date recue / Date received 202 1-1 1-25
107
Of note, other combinations of coefficients can be chosen to produce similar
results, as would be evident to one skilled in the art. Other protocols for
measuring
proteins that affect the measured protein concentrations would yield different
model
coefficients. For example, the rapid protocol for measuring TRAIL reduces the
computed concentrations to roughly 70% of the concentrations computed in the
slow
protocol. Thus, one way to adjust for this is to alter the model coefficients
of TRAIL to
account for this change. Another way is to divide the rapid protocol
measurements of
TRAIL by 70% and plug in to the above mentioned models that were developed for
the
slow protocol.
It is often preferable to use a log transformation on the protein measurements
in
order to improve model accuracy and calibration (i.e. better fit between the
predicted
risk of a certain infection and the observed risk).
An example of a model with log transformation of TRAIL and IP-10 is depicted
in Table 17 (model was trained on the consensus cohort):
Table 17
Second Coordinate First Coordinate
81 (bacterial) 8o (viral)
bo = -5.9471 3.3391 ao =44.8487 3.3839 Const
= 0M833 0M16856 ai = 0M437 0M17052 CRP (mg/m1)
bz = 1.3868 0.48608 az = 2.0148 0.4408 IP10 (pg/m1)
b3 = -0.788 0.60505 a3 = 0.8946 0.61348 TRAIL (pg/m1)
EXAMPLE 6
Hypersurface parameterization
Given the concentrations of CRP [C], TRAIL [T] and IP-10 [P] we define:
oo = -1.299 + 0.0605 x [C] + 0.0053 x [P] + 0.0088 x [T]
oi = -0.378 + 0.0875 x [Cl + 0.0050 x [P] - 0.0201 x [T]
The probabilities can then be calculated by:
e 0
P(Viral)= ____________________________________
1 + e80 e81
e81
P(Bacteria0= ___________________________________
1 + e80 e81
1
P(Non¨ infectious) = _________
1+ e80 e81
Date recue / Date received 202 1-1 1-25
108
We define the hyper surface in the [C], [T], [P] space:
e81-
1 + ea + eat = 6)
that is used to distinguish between bacterial and non-bacterial patients. In
one preferred
embodiment. In other preferred embodiments. Given a patient's [C], [T], [P]
values that
e(51
patient is classified as bacterial if 1 e60 e61 > a), else he/she are
classified as non-
bacterial.
We define the set all hyper plains that can be used to distinguish between
bacterial and non-bacterial infections as those that reside within the
following two hyper
surfaces:
est
______________________________________________ = co + El
1 + ealt + eat
eat
______________________________________________ co EO
1 + e8 + eat = ¨
El can be any number between 0 and 1-. In some preferred embodiments E1 is
smaller
then 0.5, 0.4, 0.3, 0.2 or 0.1.
co can be any number between 0 and co. In some preferred embodiments co is
smaller
then 0.5, 0.4, 0.3, 0.2 or 0.1.
Illustrated examples of surfaces are provided in Example 7.
EXAMPLE 7
Graphical Representation Of Classification
FIG. 20 is a 3-dimensional visualization of bacterial (`+'), viral ('o') and
non-
infectious (`^') patients. Different patients types are mapped to distinct
regions in the
CRP (Kg/nil), TRAIL and IP-10 (pg/ml) concentration map.
By way of example probability surfaces were generated using a multinomial
logistic regression. Contour plots of the surfaces are shown in FIGs. 21A-28C,
as a
function of TRAIL (y-axis), CRP (x-axis), and IP-10 concentrations. FIGs. 21A,
22A,
23A, 24A, 25A, 26A, 27A, 28A, show probabilities of viral infectious, FIGs.
21B, 22B,
23B, 24B, 25B, 26B, 27B, 28B, show probabilities of bacterial or mixed
infectious, and
Date recue / Date received 202 1-1 1-25
109
FIGs. 21C, 22C, 23C, 24C, 25C, 26C, 27C, 28C, show probabilities of non-
infectious or
healthy. FIGs. 21A-C correspond to IP10pg ranging from 0 to 100, FIGs. 22A-C
correspond to IP10pg ranging from 100 to 200, FIGs. 23A-C correspond to IP10pg
ranging from 200 to 300, FIGs. 24A-C correspond to IP10pg ranging from 300 to
400,
FIGs. 25A-C correspond to IP10pg ranging from 400 to 500, FIGs. 26A-C
correspond to
IP10pg ranging from 500 to 1000, FIGs. 27A-C correspond to IP10pg ranging from
1000 to 2000 and FIGs. 28A-C correspond to IP10pg which is 2000 or above.
Patients with bacterial or mixed are marked with a `+'; viral with a 'o' and
non-
infectious or healthy with a `A'. It can be seen in that low levels of IP-10
are associated
with non-infectious disease, higher levels with bacterial and highest with
viral. Low
levels of TRAIL are associated with bacterial infections, higher with non-
infectious and
healthy, and highest with viral. Low levels of CRP are associated with non-
infectious
disease and healthy subjects, higher with viral infection and highest with
bacterial. The
combination of the three proteins generates a probability function whose
diagnostic
performance outperfoinis any of the individual or pairs of proteins.
FIGs. 35A-D are contour plots describing the probability of bacterial (FIG.
35A),
viral (FIG. 35B), non-bacterial (FIG. 35C), and non-infectious (FIG. 35D)
etiologies as a
function of the coordinates 60 and 61. The probability values range between 0%
(black)
to 100% (white).
EXAMPLE 8
Exemplified Protocols for Measuring Expression Levels
In general, without limitation expression value of TRAIL can be measured using
an ELISA or automated immunoassay; expression value of IP-10 can be measured
using
an ELISA assay; and expression value of CRP can be measured using an ELISA or
automated immunoassay. The expression value of CRP can also be measured using
a
functional assay based on its calcium-dependent binding to phosphorylcholine.
Protocol A:
Suitable Protocol For Measurin2 An Expression Value Of TRAIL
(a) immobilize TRAIL present in a sample using an antibody to a solid
support;
(b) contact immobilized TRAIL with a second antibody that specifically
binds to
TRAIL; and
Date recue / Date received 202 1-1 1-25
110
(c) quantify the amount of antibody that binds to the immobilized TRAIL.
Suitable Protocol For Measuring An Expression Value Of IP-10
(a) immobilize IP-10 present in a sample using a capture antibody to a
solid support;
(b) contact immobilized IP-10 with a second antibody that specifically
binds to IP-
10; and
(c) quantify the amount of antibody that binds to the immobilized IP-10.
Suitable Protocol For Measuring An Expression Value Of CRP
(a) immobilize CRP present in a sample using a capture antibody to a solid
support;
(b) contact immobilized CRP with a second antibody that specifically
binds to I
CRP; and
(c) quantify the amount of antibody that binds to the immobilized CRP.
Protocol B:
Suitable Protocol For Measuring An Expression Value Of TRAIL
(a) Incubate a sample with a first antibody that specifically binds to
TRAIL, wherein
the said first antibody is immobilized to a solid phase;
(b) Wash;
(c) Add second antibody that specifically binds to TRAIL, wherein the
second
antibody is conjugated to an enzyme; wash
(d) Add enzyme substrate and quantify the amount of antibody that binds
to the
immobilized sample.
Suitable Protocol For Measuring An Expression Value Of IF-10
(a) Incubate a sample with a first antibody that specifically binds to IP-
10, wherein
the said first antibody is immobilized to a solid phase;
(b) Wash;
(c) Add second antibody that specifically binds to IP-10, wherein the
second
antibody is conjugated to an enzyme; wash
(d) Add enzyme substrate and quantify the amount of antibody that binds to
the
immobilized sample.
Date recue / Date received 202 1-1 1-25
111
Suitable Protocol For Measurin2 An Expression Value Of CRP
(a) Incubate a sample with a first antibody that specifically binds to CRP,
wherein
the said first antibody is immobilized to a solid phase;
(b) Wash;
(c) Add second antibody that specifically binds to CRP, wherein the second
antibody is conjugated to an enzyme; wash
(d) Add enzyme substrate and quantify the amount of antibody that binds
to the
immobilized sample.
to Protocol C:
Suitable Protocol For Measurin2 An Expression Value Of CRP
(a) measure the turbidity of a mixture of lipids;
(b) contact sample with a known amount of the lipids (preferably
phosophorylcholine) in the presence of Calcium; and
(c) measure the turbidity of the solution, wherein increase in turbidity
correlates with
the amount of CRP.
EXAMPLE 9
Detailed description of ELISA for analyzing the amount of TRAIL and IP-10
Sample collection and storage: Exposure of samples to room temperature
should be minimized (less than 6 hours). A serum separator tube (SST) is used
and the
samples are allowed to clot for at least 30 minutes before centrifugation (5
minutes at
1200 x g). Serum may be assayed immediately, or aliquoted and stored at 4-8 C
for up
to 24 hours or at <-20 C for up to 3 months. Repeated freeze-thaw cycles
should be
avoided.
Reagent preparation: All reagents should be brought to room temperature
before use.
Substrate solution: Color Reagents A and B should be mixed together in equal
volumes within 10 minutes of use. Protect from light.
QC-1V, QC-2B and Standards: Thaw all QC and Standards and remove 150uL
from each vial to a separate marked Polypropylene test tube. Move back to -20
C
immediately after use.
Date recue / Date received 202 1-1 1-25
112
Trail measurements:
The materials used for analyzing TRAIL are provided in Table 18, herein below.
Table 18
Storage Description Part
conditions
96 well microplate (12 strips of 8 wells) TRAIL
coated with anti-TRAIL antibody Microplate
21 ml of anti-TRAIL specific antibody
TRAIL
conjugated to horseradish peroxidase with
Conjugate
preservatives
Assay
11 ml of a buffered protein base with
diluent
preservatives
Store at MM 1S
21 mL of a 25-fold concentrated solution of Wash Buffer
2-8 C* buffered surfactant with preservative Concentrate
Color
12 mL of stabilized hydrogen peroxide
reagent A
12 mL of tetramethylbenzidine (TMB) Color
reagent B
Stop
6 mL of 2 N sulfuric acid
solution
4 adhesive strips Plate sealer
6 vials containing 0.7 ml of recombinant
Store at -
human TRAIL in buffered protein base with 6 TRAIL
20C
preservatives at the following concentrations Standards
immediate]
500, 250, 125, 62.5, 31.2 and 0 [pg/mL1
y after
receiving. lml QC-1V
lml QC-2B
TRAIL ELISA procedure
a) Prepare samples, reagents and standards as indicated above.
b) Remove excess microplate strips from the plate frame, return them to the
foil pouch
containing the desiccant pack, and reseal.
c) Add 50 pL of Assay Diluent MM1S to each well.
d) Add 50 pL of Standard, samples, or QC per well. Cover with the adhesive
strip
provided.
e) Incubate for 30 minutes at room temperature on a microplate shaker (3 mm
orbit) set
at 550 rpm.
f) Aspirate each well and wash, repeating the process 4 times. Wash by filling
each
well with Wash Buffer (300 pL). After the last wash, remove any remaining Wash
Date recue / Date received 2021-11-25
113
Buffer by aspirating or decanting. Invert the plate and blot it against clean
paper
towels.
g) Add 200 pt of TRAIL Conjugate to each well. Cover with a new adhesive
strip.
Incubate for 45 minutes at room temperature on a microplate shaker (3 mm
orbit) set
at 550 rpm.
h) Repeat the aspiration/wash as in step (g).
i) Add 200 pi., of Substrate solution to each well. Incubate for 24 to 30
minutes at room
temperature. Protect from light.
j) Add 50 pL of Stop solution to each well. The color in the wells should
change from
blue to yellow. If the color in the wells is green or the color change does
not appear
uniform, gently tap the plate to ensure thorough mixing.
k) Determine the optical density of each well immediately, using a microplate
reader set
to 450 nm. Set wavelength correction to 570 nm, which will correct for optical
imperfections in the plate.
TRAIL calculation of concentrations: Average the duplicate readings for each
sample and subtract the average zero standard optical density (0.D.). Create a
standard curve by plotting the mean absorbance for each standard (y-axis)
against the
concentration (x-axis) and draw a best-fit linear curve. The minimal r2 should
not fall
below 0.96. In case lower r2 values are present, repeat the experiment to get
reliable
results.
Precision: Precision was evaluated based on the CLSI (formerly NCCLS) EPOS-
A2 guidelines. Three samples with concentrations at the low (11.4pg/m1),
intermediate (58.8 pg/ml), and high (539.0 pg/ml) physiological concentrations
were
used to assess precision. Results are summarized in Table 19, where Sr is
within-run
precision and ST is within-device precision:
Date recue / Date received 202 1-1 1-25
114
Table 19
High Medium Low
(539.0pg/m1) (58.8pg/m1) (11.4 pg/ml)
18 18 18 fi of runs
36 36 36 fi of duplicates
13.2 2.45 0.84 Sr pg/mL
2.5% 4.2% 7.3% Sr CV (%)
29.7 3.6 1.3 ST pg/mL
5.5% 6.1% 11.5% ST CV (%)
Recovery: Recovery was evaluated by spiking three levels of human
recombinant TRAIL (250, 125 and 62.5pg/mL) into 5 human serum samples with no
detectable levels of TRAIL. The spiked values and the average recovery was
then
measured and calculated, as shown in Table 20 below.
Table 20
Range Average % Recovery Sample
75-78% 77% Serum (n=5)
Linearity: To assess the linearity of the assay, five clinical samples
containing
high concentrations of TRAIL were serially diluted using a serum substitute to
produce
samples with values within the physiological range of the assay. Linearity
was, on
average, 97%, 100% and 105% for 1:2, 1:4 and 1:8 dilutions, respectively, as
summarized in Table 21 below.
Table 21
Serum (n=5)
Average % of
97% expected
90-104% Range % 1:2
Average % of
100% expected
90-108% Range % 1:4
Date recue / Date received 202 1-1 1-25
115
Average % of
105% expected
90-121% Range % 1:8
Sensitivity: To estimate the Limitation of Blank (LOB), we tested 72 blank
samples of serum substitute. The mean of the blank samples was 0.78 pg/ml and
the
standard deviation was 1.39 pg/ml. Therefore, the calculated LOB is 3.07
pg/ml.
To estimate the Limitation of Detection (LOD), the CLSI EP17-A guidelines were
followed. Briefly, the measurement distribution around seven predetermined
concentrations were characterized, each with 30 independent measurements (210
measurements) yielding an LOD of 10pg/ml.
Calibration: This immunoassay is calibrated against a purified NSO-expressed
to recombinant human TRAIL.
Expected values: Samples from apparently healthy adult (>18 years) were
measured for the presence of TRAIL. The range and mean values are summarized
in
Table 22.
Table 22
Range pg/ml Mean pg/ml Sample Type
17-157 90 Serum (n=34)
Cross reactivity and interference: This assay recognizes natural and
recombinant human TRAIL. The factors 4-1BB Ligand, APRIL, BAFF/BLyS, CD27
Ligand, CD30 Ligand, CD40 Ligand, Fos Ligand, GITR Ligand, LIGHT, LT al/132,LT
a2/31,0PG,0X40 Ligand, TNF-a, TNF-13, TRAIL R3, TRAIL R4, TRANCE and
TWEAK were prepared at 50 ng/mL in serum substitution and assayed for cross-
reactivity. Additionally, preparations of these factors at 50 pg/mL in a mid-
range
recombinant human TRAIL control were tested for interference. No significant
cross-
reactivity or interference was observed.
IF-10 measurements: The materials used for analyzing IP-10 are provided in
Table 23, herein below.
Date recue / Date received 202 1-1 1-25
116
Table 23
Storage
Description Part
conditions
96 well microplate (12 strips of 8 wells) IP-10
coated with anti-IP-10 antibody Microplate
21 ml of anti-IP-10 specific antibody
IP-10
conjugated to horseradish peroxidase with
Conjugate
preservatives
Assay
11 ml of a buffered protein base with
diluent
re servatives
Store at P MM56
2-8 C. 21 mL of a 25-fold concentrated solution of Wash Buffer
buffered surfactant with preservative Concentrate
Color
12 mL of stabilized hydrogen peroxide
reagent A
12 mL of tetramethylbenzidine (TMB) Color
reagent B
Stop
6 mL of 2 N sulfuric acid
solution
4 adhesive strips Plate sealer
Store at -20 6 vials containing 0.7 ml of recombinant
C human IP-10 in buffered protein base with 6 IP-10
immediatel preservatives at the following concentrations Standards
y after 1000, 500, 250, 125, 62.5 and 0 1pg/mL1
receiving lml QC-1V
lml QC-2B
IP-10 ELISA procedure
a) Prepare samples, reagents and standards as indicated herein above.
b) Remove excess microplate strips from the plate frame, return them to the
foil pouch
containing the desiccant pack, and reseal.
c) Add 50 pL of Assay Diluent MM56 to each well.
d) Add 50 pt of Standard, sample or QC per well. Cover with the adhesive strip
provided.
e) Incubate for 30 minutes at room temperature on a microplate shaker (3 mm
orbit) set
at 550 rpm.
f) Aspirate each well and wash, repeating the process 4 times. Wash by filling
each
well with Wash Buffer (300 pL). After the last wash, remove any remaining Wash
Buffer by aspirating or decanting. Invert the plate and blot it against clean
paper
towels.
Date recue / Date received 2021-11-25
117
g) Add 200 pt of IP-10 Conjugate to each well. Cover with a new adhesive
strip.
Incubate for 45 minutes at room temperature on a microplate shaker (3 mm
orbit) set
at 550 rpm.
h) Repeat the aspiration/wash as in step (g).
i) Add 200 pt of Substrate solution to each well. Incubate for 10 minutes at
room
temperature. Protect from light.
j) Add 50 pt of Stop solution to each well. The color in the wells should
change from
blue to yellow. If the color in the wells is green or the color change does
not appear
uniform, gently tap the plate to ensure thorough mixing.
k) Determine the
optical density of each well immediately, using a
microplate reader set to 450 nm. Set wavelength correction to 570 nm, which
will
correct for optical imperfections in the plate.
IP-10 calculation of concentrations: Average the duplicate readings for each
sample and subtract the average zero standard optical density (0.D.). Create a
standard
curve by plotting the mean absorbance for each standard (y-axis) against the
concentration (x-axis) and draw a best-fit linear curve. The minimal r2 should
not fall
below 0.96. In case lower r2 values are present, repeat the experiment to get
reliable
results.
Precision: Precision was evaluated based on the CLSI (formerly NCCLS) EPOS-A2
guidelines. Three samples with concentrations at the low (69.4 pg/ml),
intermediate
(228.2 pg/ml), and high (641.5 pg/ml) physiological concentrations were used
to assess
precision. Results are summarized in Table 24 where Sr is within-run precision
and ST is
within-device precision:
Table 24
High Medium Low
(641.5 pg/ml) (228.2 pg/ml) (69.4 pg/ml)
18 18 18 fi of runs
36 36 36 fi of duplicates
21.1 5.6 4.0 Sr pg/mL
3.3% 2.4% 5.8% Sr CV (%)
37.2 12.9 4.9 ST pg/mL
5.8% 5.7% 7.1% ST CV (%)
Date recue / Date received 202 1-1 1-25
118
Recovery: Recovery was evaluated by spiking three levels of human IP-10, 500,
250 and 125pg/mL into 5 human serum samples with no detectable levels of IP-
10. The
spiked values and the average recovery was than measured and calculated as
illustrated
in Table 25 below.
Table 25
Range Average % Recovery Sample
72-80% 77 Serum/plasma (n=5)
Linearity: To assess the linearity of the IP-10 assay, 5 clinical samples
containing high concentrations of IP-10 ranging between 873.7 to 1110.4 pg/mL
were
serially diluted with a serum substitute to produce samples with values within
the
physiological range of the assay. Linearity was, on average, 98%, 102% and
104% in
1:2, 1:4 and 1:8 dilutions, respectively, as summarized in Table 26 herein
below.
Table 26
Serum (n=5)
Average % of
98% expected
93-102% Range % 1:2
Average % of
102% expected
97-107% Range % 1:4
Average % of
104% expected
96-111% Range % 1:8
Sensitivity: To estimate the Limitation of Blank (LOB), we tested 72 blank
samples of serum substitute. The mean of the blank samples was 0.23pg/m1 and
the
standard deviation was 1.26pg/ml, yielding an LOB of 2.29pg/ml.
To estimate the Limitation of Detection (LOD), the CLSI EP17-A guidelines
were applied. Briefly, the measurement distribution around seven predetermined
Date recue / Date received 202 1-1 1-25
119
concentrations were characterized, each with 30 independent measurements (210
measurements) yielding an LOD of 10pg/ml.
Calibration: This immunoassay is calibrated against a highly purified E-coli-
expressed recombinant human IP-10.
Expected values: Samples from apparently healthy adult volunteers were
measured for the presence of IP-10. The range and mean values are shown in
Table 27
below.
Table 27
Range pg/ml Mean pg/ml Sample Type
29-525 119 Serum (n=34)
Cross reactivity and interference: This assay recognizes natural and
recombinant human IP-10. The factors BLC/BCA-1,ENA-78,GCP-2,GROa,GRO
y,IFN-y,IL-8,I-TAC,MIG,NAP-2,SDF-1 a and SDF-113 were prepared at 50 ng/mL in
serum substitution and assayed for cross-reactivity. Additionally,
preparations of these
factors at 50 pg/mL in a mid-range recombinant human IP-10 control were tested
for
interference. No significant cross- reactivity or interference was observed.
EXAMPLE 10
TRAIL AND DISEASE PROGNOSIS
It is often clinically useful to assess patient prognosis, disease severity
and
outcome. The present inventors found that low levels of TRAIL are
significantly
correlated with poor patient prognosis and outcome, and high disease severity.
For
example, adult patients in the intensive care unit (ICU) had significantly
lower TRAIL
levels compared to all other patients, which were less ill regardless of
whether they had
an infectious or non-infectious etiology. Median serum concentrations were
9pg/m1 vs.
80pg respectively, (ranksum P<0.001, Figure 36A), for severely ill and all
other patients
respectively.
40 Dutch pediatric patients, 3 months to 5 years of age. The TRAIL serum level
was measured in 40 Dutch pediatric patients, 3 months to 5 years of age. It
was found
that those patients that were eventually admitted to the ICU (an indication of
disease
complication and poor prognosis) or even died had significantly lower TRAIL
serum
Date recue / Date received 202 1-1 1-25
120
concentrations compared to the rest of the patients (median of 11 vs. 85,
respectively;
ranksum P<0.001) as depicted in Figure 36B. Strikingly, the lowest TRAIL
levels
(<5pgm1) were measured in the only two children that died in the entire
cohort. These
results indicate that TRAIL could be used as a prognostic marker for
predicting disease
severity and outcome.
EXAMPLE 11
TRAIL AGE AND GENDER PARAMETERS
Basal levels of TRAIL in healthy individuals or patients with a non-infectious
disease are lower in females compared to males during fertility age (t-test
P<0.001)
(Figure 37A), but is invariant in pre- or post-fertility age (t-test P=0.9,
Figure 37B).
This trend was not observed in patients with an infectious disease.
EXAMPLE 12
Exemplified Manifolds, Hyperplanes and Coordinates
One-dimensional Manifold
When n=1, the manifold S is a curved line and the hyperplane 7C is an axis
defining a single direction 61. The coordinate 61 in this Example is
optionally and
preferably a linear combination b0+b1D1+b2D2+..., of the polypeptides Di, D2,
etc.
Table 28 below lists diagnostic performance (in AUCs) attained for n=1. The
performance were computed using a leave-10%-out cross validation on the cohort
specified in each row. In rows 1-4, the analyzed subjects had either bacterial
or viral
infections and the coordinate 61 was calculated so that the probabilistic
classification
function f(61) represented the likelihood that the test subject had a
bacterial infection.
In rows 5-8, the analyzed subjects were infectious or non-infections and the
coordinate
81 was calculated so that the probabilistic classification function f(61)
represented the
likelihood that the test subject had an infection. In rows 10-12, the analyzed
subjects
had either bacterial or non-bacterial infection and the coordinate 61 was
calculated so
that the probabilistic classification function f(61) represented the
likelihood that the test
subject had a bacterial infection. In rows 1-4, the columns P and N correspond
to the
number of Bacterial and Viral patients respectively, in rows 5-8, the columns
P and N
correspond to the number of infectious and non-infectious patients,
respectively, and in
rows 9-12, the columns P and N correspond to the number Bacterial and non-
Bacterial
Date recue / Date received 202 1-1 1-25
121
patients respectively. Majority and Consensus indicate the type of cohort on
which the
model was validated.
Table 28
N P AUC Polypeptides Cohort No.
334 319 0.93 TRAIL CRP Majority 1
334 319 0.94 TRAIL IP-10 CRP Majority 2
271 256 0.95 TRAIL CRP Consensus 3
271 256 0.96 TRAIL IP-10 CRP Consensus 4
112 653 0.93 TRAIL CRP Majority 5
112 653 0.96 TRAIL IP-10 CRP Majority 6
112 527 0.93 TRAIL CRP Consensus 7
112 527 0.97 TRAIL IP-10 CRP Consensus 8
446 319 0.94 TRAIL CRP Majority 9
446 319 0.94 TRAIL IP-10 CRP Majority 10
383 256 0.95 TRAIL CRP Consensus 11
383 256 0.96 TRAIL IP-10 CRP Consensus 12
Table 29 below lists the coefficients bo, b1, b2, etc that were used to define
the
coordinate 61, for each of the 12 cases listed in Table 28, respectively. The
first
coefficient on the left is bo, and then from left to right, the coefficients
correspond to the
order of the polypeptides in each row of Table 28. The coefficients correspond
to the
following concentration scales for each polypeptide: TRAIL (pg/ml), IP-10
(pg/ml) and
CRP (ug/ml).
For a given set of polypeptides, the obtained coefficients have small
variations
among the different cohorts. Nevertheless, the coefficients for the
probabilistic
classification functions and coordinates of the present embodiments preferably
correspond to those obtained for the Majority Cohort.
Table 29
Coefficients No.
-0.029953 0.027472 0.64814 1
-0.029013 -0.00028168 0.028119 0.71542 2
-0.033669 0.034565 0.636 3
-0.03195 -0.00058691 0.035748 0.79543 4
0.016837 0.17237 -2.0549 5
0.005213 0.00592 0.1263 -2.3344 6
0.018624 0.16625 -2.3469 7
0.0079169 0.0061124 0.12261 -2.7949 8
-0.027839 0.034954 -0.08503 9
-0.027916 2.2524e-05 0.034878 -0.088207 10
Date recue / Date received 202 1-1 1-25
122
-0.030997 0.044289 -0.26606 11
-0.03042 -0.00018635 0.044938 -0.23907 12
Table 30 below lists diagnostic performance (in AUCs) attained for one-
dimensional manifold. The performance were computed using a leave-10%-out
cross
validation on the Majority cohort. In rows 1-55, the analyzed subjects had
either
bacterial or viral infections and the probabilistic classification function
f(61) represented
the likelihood that the test subject had a bacterial infection. In rows 56-
110, the
analyzed subjects were infectious or non-infections and the probabilistic
classification
function f(81) represented the likelihood that the test subject had an
infection. In rows 1-
55, the columns P and N correspond to the number of Bacterial and Viral
patients
respectively, and in rows 56-110, the columns P and N correspond to the number
of
infectious and noninfectious patients, respectively.
Table 30
N P AUC Polypeptides No.
141 142 0.88 ILlra CRP 1
299 295 0.90 IP-10 CRP 2
50 51 0.87 PCT CRP 3
241 255 0.90 SAA CRP 4
142 142 0.64 IP-10 IL 1 ra 5
14 19 0.62 PCT ILlra 6
122 124 0.83 SAA ILlra 7
142 142 0.88 TRAIL ILlra 8
49 51 0.74 PCT IP-10 9
242 251 0.85 SAA IP-10 10
297 295 0.88 TRAIL IP-10 11
40 45 0.78 SAA PCT 12
50 51 0.87 TRAIL PCT 13
244 255 0.90 TRAIL SAA 14
141 142 0.90 IP-10 IL lra CRP
15
14 19 0.82 PCT ILlra CRP 16
121 124 0.89 SAA ILlra CRP 17
141 142 0.94 TRAIL ILlra CRP 18
49 51 0.89 PCT IP-10 CRP 19
239 251 0.91 SAA IP-10 CRP 20
40 45 0.88 SAA PCT CRP 21
50 51 0.93 TRAIL PCT CRP 22
241 255 0.94 TRAIL SAA CRP 23
14 19 0.62 PCT IP-10 ILlra 24
122 124 0.85 SAA IP-10 IL lra 25
Date recue / Date received 202 1-1 1-25
123
142 142 0.88 TRAIL IP-10 ILlra 26
13 17 0.76 SAA PCT ILlra 27
14 19 031 TRAIL PCT ILlra 28
122 124 0.92 TRAIL SAA ILlra 29
39 45 0.81 SAA PCT IP-10 30
49 51 0.86 TRAIL PCT IP-10 31
242 251 0.91 TRAIL SAA IP-10 32
40 45 0.86 TRAIL SAA PCT 33
14 19 0.83 PCT IP-10 ILlra CRP 34
121 124 0.92 SAA IP-10 ILlra CRP 35
141 142 0.94 TRAIL IP-10 ILlra CRP 36
13 17 0.74 SAA PCT ILlra CRP 37
14 19 0.90 TRAIL PCT ILlra CRP 38
121 124 0.94 TRAIL SAA ILlra CRP 39
39 45 0.88 SAA PCT IP-10 CRP 40
49 51 0.92 TRAIL PCT IP-10 CRP 41
239 251 0.94 TRAIL SAA IP-10 CRP 42
40 45 0.92 TRAIL SAA PCT CRP 43
13 17 0.70 SAA PCT IP-10 ILlra 44
14 19 0.70 TRAIL PCT IP-10 ILlra 45
122 124 0.91 TRAIL SAA IP-10 ILlra 46
13 17 0.82 TRAIL SAA PCT ILlra 47
39 45 0.85 TRAIL SAA PCT IP-10 48
13 17 0.82 SAA PCT IP-10 ILlra CRP 49
14 19 0.75 TRAIL PCT IP-10 ILlra CRP 50
121 124 0.94 TRAIL SAA IP-10 ILlra CRP 51
13 17 0.78 TRAIL SAA PCT ILlra CRP 52
39 45 0.92 TRAIL SAA PCT IP-10 CRP 53
13 17 0.62 TRAIL SAA PCT IP-10 ILlra 54
13 17 0.74 TRAIL SAA PCT IP-10 IL 1 ra CRP
55
87 283 0.91 ILlra CRP 56
102 594 0.96 IP-10 CRP 57
6 101 0.85 PCT CRP 58
78 496 0.91 SAA CRP 59
87 284 0.89 IP-10 IL lra 60
6 33 0.79 PCT ILlra 61
64 246 0.91 SAA ILlra 62
87 284 0.86 TRAIL ILlra 63
6 100 0.73 PCT IP-10 64
81 493 0.96 SAA IP-10 65
107 592 0.91 TRAIL IP-10 66
3 85 0.89 SAA PCT 67
7 101 0.60 TRAIL PCT 68
81 499 0.93 TRAIL SAA 69
87 283 0.95 IP-10 ILlra CRP 70
Date recue / Date received 202 1-1 1-25
124
6 33 0.76 PCT ILlra CRP 71
64 245 0.92 SAA ILlra CRP 72
87 283 0.93 TRAIL ILlra CRP 73
6 100 0.81 PCT IP-10 CRP 74
78 490 0.97 SAA IP-10 CRP 75
3 85 0.88 SAA PCT CRP 76
6 101 0.87 TRAIL PCT CRP 77
78 496 0.95 TRAIL SAA CRP 78
6 33 0.77 PCT IP-10 ILlra 79
64 246 0.94 SAA IP-10 ILlra 80
87 284 0.90 TRAIL IP-10 ILlra 81
3 30 0.72 SAA PCT ILlra 82
6 33 0.67 TRAIL PCT ILlra 83
64 246 0.90 TRAIL SAA ILlra 84
3 84 0.98 SAA PCT IP-10 85
6 100 0.68 TRAIL PCT IP-10 86
81 493 0.96 TRAIL SAA IP-10 87
3 85 0.98 TRAIL SAA PCT 88
6 33 0.77 PCT IP-10 ILlra CRP 89
64 245 0.95 SAA IP-10 ILlra CRP 90
87 283 0.95 TRAIL IP-10 ILlra CRP 91
3 30 0.73 SAA PCT ILlra CRP 92
6 33 0.74 TRAIL PCT ILlra CRP 93
64 245 0.92 TRAIL SAA ILlra CRP 94
3 84 0.98 SAA PCT IP-10 CRP 95
6 100 0.77 TRAIL PCT IP-10 CRP 96
78 490 0.97 TRAIL SAA IP-10 CRP 97
3 85 0.80 TRAIL SAA PCT CRP 98
3 30 0.91 SAA PCT IP-10 ILlra 99
6 33 0.67 TRAIL PCT IP-10 IL Ira
100
64 246 0.94 TRAIL SAA IP-10 ILlra 101
3 30 0.78 TRAIL SAA PCT ILlra 102
3 84 0.65 TRAIL SAA PCT IP-10 103
3 30 0.91 SAA PCT IP-10 ILlra CRP 104
6 33 0.66 TRAIL PCT IP-10 ILlra CRP 105
64 245 0.95 TRAIL SAA IP-10 ILlra CRP 106
3 30 0.73 TRAIL SAA PCT ILlra CRP 107
3 84 0.97 TRAIL SAA PCT IP-10 CRP 108
3 30 0.78 TRAIL SAA PCT IP-10 ILlra 109
3 30 0.73 TRAIL SAA PCT IP-10 ILlra CRP
110
Table 31 below list the coefficients bo, bi, b2, etc that were used to define
the
coordinate 81, for each of the 110 cases listed in Table 30, respectively. The
first
coefficient on the left is bo, and then from left to right, the coefficients
correspond to the
Date recue / Date received 202 1-1 1-25
125
order of the polypeptides in each row of Table 30. The coefficients correspond
to the
following concentration scales for each polypeptide: TRAIL (pg/ml), IP-10
(pg/ml),
CRP (ug/ml), PCT (ng/ml), SAA (g/m1) and IL lra (g/m1).
Table 31
Coefficients No.
-9849178.8 0.0363 -1.997
1
-0.0009 0.039722 -1.6069
2
0.6405 0.054137 -2.9681 3
1098.3777 0.034353 -2.33196 4
-0.00089 47954608.09 0.4715979 5
4.5607 -69280395.624 -0.74822 6
5283.68 -33345728.8342 -1.706206 7
-0.03151 43833567.7377 3.0601663 8
0.86013 -0.00060898 -0.13268 9
4677.8311 -0M009684361 -L01872 10
-0.0288 0.00031349
2.5632 11
2349.8702 1.1895403 -1.35195 12
-0.019169 0.4382 1.4742
13
-0.02176 2962.7685
1.08972 14
-0.00165 6.264E+7 0.039986 -1.27532 15
1.07655 -8.42E+7 0.0475326 -2.3376 16
2098.4 -2.22E+7 0.027867 -2.23709 17
-0.0266 2.0497E+7 0.030146
0.9001561 18
0.65349 -0.0005 0.051698 -2.5383 19
1378.2 -0.00109 0.034481544 -1.6940577 20
-1243.01 1.4735726 0.054245413 -
2.7487888 21
-0.010529 0.42793 0.04535 -1.421 22
-0.01891 183.3117 0.0312776
0.1044034 23
4.8755 -0.001241 -4107077 -0.0013248 24
5777 -0.001377 21179055 -1.054077 25
-0.03151 -1.118-06 43882108 3.0605
26
4823 2.91 -68741718 -1.9806377 27
-0.0342 1.941 113905139.6 2.844483 28
-0.0264 3745.49 -7296968.1
1.4399 29
2427.6 1.3263344 -0.000765 -0.8562752 30
-0.020588 0.38993 0.00045394 1.357 31
-0.021174 3048.4182 -0.000163 1.0917705 32
-0.013629 1431.011 0.89320046 0.48274 33
1.5 -0.003888 75533424 0.07214 -0.6620 34
2425.771 -0.002 59894763 0.034006 -1.433018 35
-0.0251 -0.00084 50294164 0.03259 1.074937 36
893.395 1.1316 -70994467 0.038 -2.302 37
-0.0477 -0.084 -81575254 0.061632 1.903272 38
-0.02483 1236 10145313 0.025
0.65146 39
-949.2 1.528887 -5.5688E-4 0.04984696 -2.32016 40
Date recue / Date received 2021-11-25
126
-0.011113 0.40033 0.00021523 0.045264
-1.4662 41
-0.0177 329.7448 -0.0003975 0.03169 0.14333 42
-0.011 -1930.2 1.24 0.050385
-1.109923 43
6082.17 4.286 -0.002014 2715886 -
1.087150 44
-0.0397 2.126 0.00092636 -1508120
2.9154 45
-0.0252 4082.939 -0.00062 17100158 1.55114 46
-0.0560 7639.7 0.68134 -27909258 2.85226 47
-0.0134 1423.99 0.87764371 6.13e-05 0.446
48
4736.86 1.250 -0.00652 172681901 0.07676 -0.3021
49
-0.044 -0.121 -0.000873 -4.62E+7 0.0671 1.937 50
-0.0219 1576.6 -0.00134 54069432 0.029267 0.78878 51
-0.055 3598 -0.098620 -74159142 0.041577 2.309 52
-0.0116 -2055 1.188 0.00023 0.0512
-1.1542 53
-0.055 8903.82 1.03 -0.0012627 14035678
3.2 54
-0.078 14133 -0.687 -0.009695 1.062E+8 0.10 5.59 55
3.996E+8 0.11089 -
1.021759 56
0.0063336 0.11347 -1.9467
57
860.3249 0.0639025 -
84.98948 58
9898.8177 0.091563631 -
0.3299621 59
0.00721
107920251.6624 -1.0006445 60
419.2 596535240 -
41.585735 61
14320
234257296.8937 -0.4789050 62
0.00066
812307573.5455 0.09918792 63
1089.4251
0.00069423293 -107.18015 64
12590.5
0.00967490979 -2.05501 65
-0.00905 0.0092076 0.19189 66
165893.71 122.7205081 -11.30895 67
0.0041105 6.5788 0.98581
68
0.010541 19453.2163 -1.366750 69
0.0062 -77782071 0.10876 -
2.301980 70
393.7 559628637 0.048935 -39.915
71
8656.83 244256710 0.0663 -
0.885780 72
0.0129 157875482 0.142003 -
2.694252 73
846.608 0.0014
0.07831107 -84.66684 74
5900.1661 0.00927 0.081369191 -
2.5885198 75
131629 108.84
0.06793071342 -10.12169 76
0.011421 822.6365 0.08303337 -82.88872 77
0.013257 10662.5415 0.106214424 -2.33978 78
417.43 -0.000381
744190123.3893 -41.369532 79
12128
0.0091619 -130390666 -2.266204 80
-0.005459 0.007583 82287681 -0.50010
81
377360 -8.1908 6837963488 -2.47028 82
0.00099 418.212 560182293 -41.5502 83
0.011194 17111.2 29398797 -1.8577 84
21649017 28.96307 0.4328 -156.16
85
0.00330 1086.1672
0.00029753173 -107.01823 86
Date recue / Date received 2021-11-25
127
-9.3941e-05 12572.6828 0.00969 -2.0464 87
24.2 80696477 471.6 -2614.99 88
392.929 -0.0001 611767730 0.0491 -39.82 89
6854 0.00937 -157521601 0.070555 -2.81351 90
0.005871 0.00552 -61236289 0.118 -2.9416 91
403954 -8.6576 7107285383 -0.07356 -2.349 92
0.00857 373.75 383823513 0.05763 -38.781 93
0.013998 9692.125 -4665192.1 0.0965657 -2.782 94
4998296 -132.70 0.3202 10.567847038 -132.7427 95
0.00927 827.6066 0.000498 0.08349426 -83.41464 96
0.00369 6461.9905 0.008696 0.084631596 -2.9639303 97
2.32E+12 4.83248e+18 -1.05E+14 9037614498892 1.185E+14 98
9471186 -296 0.196688 116933544267 -99.64 99
0.002761 413.88 -0.00058 713679677.7954 -41.177966 100
0.00349 12684.8 0.0088176 -124943185 -2.6391378 101
1.3718 8853215 -272.0191 68076716508 -163.16785 102
0.9352 11007611 24.21772 0.09197 -134.8402 103
5448434 -195 0.1975318 32157214873 5.367 -82.7 104
0.024158 327.2 -0.002344 823767988 0.0803 -35.325 105
0.0065 7390.9 0.008791 -151905670 0.080040 -3.579 106
2.78 -1129873 -106.418 43593035460 29.2 -338.972 107
1.563 -96788.08 -22.217 0.4843 8.2370 -237.8248 108
4.06E+12 1.757e+18 2.798E+13 3.97E+12 -5.96133e+22 -8.51E+14 109
1.839 -9.83E+5 -16.687 0.58062 -4575512593 9.549 -276.3 110
Two-dimensional Manifold
When n=2, the manifold S is a curved surface and the hyperplane 7C is a flat
plane
defined by the first direction 6o and the second direction 61. The coordinate
6o in this
Example is optionally and preferably a linear combination ao+aiDi+a2D2+..., of
the
polypeptides Di, D2, etc; and the coordinate 61 in this Example is optionally
and
preferably a linear combination bo+biDi+b2D2+..., of the polypeptides Di, D2,
etc.
Tables 32-35 below list diagnostic performance (in AUCs) attained for n=2. The
performance were computed using a leave-10%-out cross validation on a subset
of the
majority cohort that had sufficient serum to measure all the proteins. The
coordinates 6o
and 61 were calculated so that the probabilistic classification function
f(6o,61)
represented the likelihood that the test subject had a bacterial infection.
The AUC
values correspond to classifications according to Bacterial versus Viral
(second column
from right - B vs. V) and infectious vs. non-infectious (rightmost column - I
vs. NI).
Shown are results for the embodiments in which the plurality of polypeptides
includes
two polypeptides (Table 32), three polypeptides (Table 33), four polypeptides
(Table 34)
Date recue / Date received 202 1-1 1-25
128
and five polypeptides (Table 35). The coefficients for the coordinates 60 and
81 are
presented for each polypeptide, wherein "const" correspond to ao when applied
to the
coordinate 80 and bo when applied to the coordinate 81. The coefficients
correspond to
the following concentration scales for each protein: TRAIL (pg/ml), IP-10
(pg/ml), CRP
(ug/ml), PCT (ng/ml), SAA (g/m1) and ILlra (g/m1).
Table 32
AUC AUC
(I vs. NI) (B vs. V)
0.91 0.88 TRAIL IP-10 Const
0.0006 0.0086 -0.3333 80
-0.0294 0.0089 2.4481 81
0.95 0.89 IP-10 CRP Const
0.0055 0.0517 -0.474 80
0.0046 0.0902 -1.9201 81
0.96324 0.85647 SAA IP-10 Const
9623.7195 0.0089 -1.0634 80
14280.3897 0.0079 -2.0098 81
0.89408 0.63901 IP-10 IL lra Const
0.0077 77589304.64 -0.2347 80
0.0069 122880671.4 0.3245 81
0.735 0.70468 PCT IP-10 Const
0.1778 0.0012 1.3717 80
0.9426 0.0007 1.3073 81
0.93 0.94 TRAIL CRP Const
0.0129 0.0647 -0.551 80
-0.0077 0.0953 -0.1177 81
0.92719 0.90714 TRAIL SAA Const
0.0146 15457.6689 -1.0101 80
-0.0081 18311.8735 0.2736 81
0.85523 0.88673 TRAIL IL lra Const
0.0118 660539652.3 -0.1638 80
-0.0224 691029794.9 3.3011 81
Date recue / Date received 202 1-1 1-25
129
0.69731 0.86706 TRAIL PCT Const
0.0095 0.6699 0.7941 60
-0.0105 1.0871 2.4419 61
0.92 0.89 SAA CRP Const
7927.9578 0.0371 0.9937 60
9043.9184 0.0704 -1.2549 61
0.93 0.87 ILlra CRP Const
357544464 0.0549 0.9321 60
345095895 0.0895 -0.8849 61
0.85 0.88 PCT CRP Const
0.1493 0.0543 1.225 60
0.71 0.1052 -1.48 61
0.9154 0.82529 SAA ILlra Const
11965 233885248 0.9453 60
17194.2625 201037678 -0.6599 61
0.84314 0.78722 SAA PCT Const
6627 -0.6192 1.4185 60
8964 0.2744 0.1417 61
0.82323 0.58647 PCT ILlra Const
-1.0932 601268546 1.3547 60
0.7431 600085479 0.7175 61
Table 33
AUC AUC
(I vs. NI) (B vs. V)
0.96 0.94 TRAIL IP-10 CRP Const
0.005 0.0053 0.0555 -1.0317 60
-0.0143 0.005 0.0884 -0.6693
61
0.96 0.91 TRAIL SAA IP-10 Const
0.0047 9804.469 0.0087 -1.636 60
-0.0167 12810.9197 0.0085
-0.435 61
0.90 0.89 TRAIL IP-10 IL lra Const
0.0056 0.0072 24233992.13 -0.7474 60
Date recue / Date received 2021-11-25
130
-0.0282 0.0073 57162308.55 2.6252
61
0.66 0.85 TRAIL PCT IP-10 Const
0.008 0.7463 0.0005 0.71 60
-0.0136 1.1103 0.001 2.1832 61
0.97318 0.91325 SAA IP-10 CRP Const
4964.9078 0.0079 0.0389 -1.1506 60
6345.7097 0.0069 0.0729 -2.7684 61
0.95695 0.90645 IP-10 IL lra CRP Const
0.0062 72572842.54 0.0635 -0.5109 60
0.0046 16278785.64 0.1025 -1.6901 61
0.8 0.88475 PCT IP-10 CRP Const
0.1083 0.0016 0.0598 0.1233 60
0.6599 0.0011 0.1081 -2.1504 61
0.94944 0.85722 SAA IP-10 IL lra Const
9571.3145 0.0094 -141670519.4 -0.97 60
15309.775 0.008 -119518794.5 -1.932 61
0.95635 0.79658 SAA PCT IP-10 Const
6137.1652 -0.6596 0.0047 -0.5085 60
8580.4524 0.2775 0.004 -1.3306 61
0.73737 0.69549 PCT IP-10 IL lra Const
-1.1448 0.0005 540518195.3 1.0752
60
0.7431 -0.0003 578154355.6 0.9893 61
0.94489 0.93838 TRAIL SAA CRP Const
0.0147 8741.563 0.0419 -1.1898 60
-0.0045 8922.431 0.0715 -0.9205
61
0.92941 0.94316 TRAIL IL lra CRP Const
0.0158 142723684.3 0.0735 -1.1214 60
-0.0124 142922206.2 0.1005
0.254 61
0.85644 0.91373 TRAIL PCT CRP Const
0.0132 0.3236 0.066 -0.695 60
0.0019 0.6114 0.1084 -1.7666 61
Date recue / Date received 2021-11-25
131
0.91298 0.91698 TRAIL SAA IL lra Const
0.0165 13897.6693 19314215.49 -1.1796 60
-0.0114 17471.1789 -373899.4284 0.5955 61
0.9451 0.85 TRAIL SAA PCT Const
0.0281 13902.8636 -0.0348 -2.1844 60
0.0141 15302.3132 0.7361 -1.6348 61
0.73737 0.8797 TRAIL PCT IL lra Const
0.0126 1.6517 445497461.8 -0.3418 60
-0.0203 2.4203 638669048.4 2.2766
61
0.91932 0.88856 SAA IL lra CRP Const
7641.7563 224710899.2 0.0265 0.8638 60
9730.7248 201425116.6 0.0536 -1.256 61
0.90588 0.88556 SAA PCT CRP Const
8520.704 -1.4792 0.0207 1.1579 60
7599.3621 -0.2234 0.0695 -1.3994 61
0.84343 0.86842 PCT IL lra CRP Const
-0.6599 547844063.4 0.0388
0.8368 60
-0.1506 473174484.1 0.0873
-1.6604 61
0.9 0.81448 SAA PCT IL lra Const
10349.4815 -2.3088 565967860.9 1.0109 60
15172.8663 -0.2687 515166286.4 -1.0283 61
Table 34
AUC AUC
(I vs. (B vs.
NI) V)
0.97 0.94 TRAIL SAA IP-10 CRP Const
0.0058 5383.841 0.0075 0.0394 -1.7981 60
-0.012 5731.9467 0.007 0.0702
-1.5541 61
0.96 0.94 TRAIL IP-10 IL lra CRP Const
0.0091 0.0053 -6.995E+7 0.0703 -1.5229 60
-0.0166 0.0046 -3.228E+7 0.101
-0.2128 61
0.78667 0.903 TRAIL PCT IP-10 CRP Const
Date recue / Date received 2021-11-25
132
0.0101 0.2921 0.0007 0.0651 -0.6733 60
-0.0021 0.5293 0.001 0.1077 -
1.8383 61
0.94957 0.91777 TRAIL SAA IP-10 ILlra Const
-
0.0091 10289.5699 0.0088 153195983.2 -2.036 60
_
-0.0169 14282.9357 0.0082
138993063.2 -0.2825 61
0.93254 0.8433 TRAIL SAA PCT IP-10 Const
0.0218 12161.0003 -0.2264 0.0068 -3.3387 60
0.0083 13578.3133 0.5366 0.0068 -2.9001 61
0.65657 0.86842 TRAIL PCT IP-10 ILlra Const
0.0147 1.6805 -0.0004 481673333.4 -0.356 60
-0.0268 2.4993 0.001 491494579.8
2.4805 61
0.95829 0.92002 SAA IP-10 ILlra CRP Const
6131.1692 0.0088 -1.5446E+8 0.028 -1.0249 60
8579.4749 0.0067 -9.6352E+7 0.0614 -2.3655 61
0.9881 0.8735 SAA PCT IP-10 CRP Const
4377.1407 -1.4641 0.0064 0.0419 -1.4913 60
3810.7522 -0.1982 0.0059 0.0857 -3.62 61
0.74242 0.89098 PCT IP-10 ILlra CRP Const
-0.4843 0.0004 4.54739E+8
0.0378 0.6379 60
-0.2044 -0.0018 4.84865E+8
0.0969 -0.7642 61
0.94444 0.77828 SAA PCT IP-10 ILlra Const
-
4951.1109 -2.8236 0.0095 212692846.6 -0.802 60
-
10430.5725 -0.1446 0.008 210027138.1 -2.0339 61
0.92564 0.93742 TRAIL SAA ILlra CRP Const
0.0163 8701.5399 2.10729E+7 0.0386 -1.3076 60
-0.0099 9890.6956
1.31614E+7 0.062 -0.2694 61
0.95294 0.91111 TRAIL SAA PCT CRP Const
0.0253 11551.5028 -1.3285 0.0278 -1.8221 60
0.0141 9802.9581 -0.2648 0.0748 -2.7829 61
Date recue / Date received 2021-11-25
133
0.79798 0.89474 TRAIL PCT IL lra CRP Const
0.0137 -0.1689 2.756E+8 0.0476 -0.6344 60
-0.0264 -0.236 2.7563E+8
0.0994 0.5587 61
0.85556 0.92308 TRAIL SAA PCT IL lra Const
0.0343 12347.4916 -0.5098 432026875.9 -2.2741 60
-0.0152 19586.5686 -0.4124
426850211.8 0.0383 61
0.9 0.85068 SAA PCT IL lra CRP Const
2665.2949 -0.5099 6.42961E+8 0.0552 0.5611 60
3734.4091 -0.3614 5.88426E+8 0.0941 -1.8313 61
Table 35
AUC AUC
(I vs. NI) (B vs. V)
0.95963 0.94381 TRAIL SAA IP-10 IL lra CRP Const
0.0092 6688.18 0.0082 -1.6265E+8 0.0336 -2.1333 60
-0.0136 8261.93 0.0069 -1.17187E+8
0.0619 -1.1202 61
0.95635 0.89972 TRAIL SAA PCT IP-10 CRP Const
0.0178 6302.89 -1.297 0.0074 0.0517 -3.4117 60
0.0063 4437.96 -0.249 0.0076 0.1 -4.4957 61
0.71717 0.88346 TRAIL PCT IP-10 IL lra CRP Const
0.0246 -0.2302 -0.0017 5.4749E+8 0.0616 -
1.3864 60
-0.017 -0.2819 -
0.0012 5.0261E+8 0.1096 -0.1627 61
0.85556 0.87783 TRAIL SAA PCT IP-10 IL lra Const
0.0529 5922.72 -0.7334 0.0149 2530173.292 -6.1686
60
0.0043 14225.92 -0.282 0.0139 32115407.24 -3.7073 61
0.91111 0.819 SAA PCT IP-10 IL lra CRP Const
-22863.96 -0.2611 0.0141 -8.7081E+8 0.1586 -2.8588 60
-18573.7 -0.3918 0.008 7.27742E+8
0.2362 -3.2596 61
0.87778 0.90045 TRAIL SAA PCT IL lra CRP Const
0.0397 -7661.57 -0.4075 6.98426E+8 0.1355
-3.522 60
-0.008 -4178.89 -
0.4915 6.53495E+8 0.1689 -1.7514 61
Date recue / Date received 2021-11-25
134
EXAMPLE 13
Exemplified Coordinates That Include Nonlinear Functions
It was unexpectedly found by the present Inventor that incorporation of the
nonlinear functions 4)0 and (1)1 in the calculation of the coordinates 81 and
62 captures
more subtle trends in the data, while retaining a probabilistic framework that
allows
meaningful interpretation of the results. In this Example, the coordinates 80
and 81 were
calculated according to the following equations:
80 = ao + aiC + a2I + a3T + (1)0
81 = bo + biC + b2I + b3T + (1)1,
to and the nonlinear functions were defined as:
(I)o = qiC71 + q2C72 + q3TY3
(1)1 = riC71 + r2C72 + r3]73.
where y1=0.5, y2=2 and y3=0.5.
Table 36 details the coefficients and constants used in this Example.
Table 36
First Coordinate Second Coordinate
80 (viral) 61 (bacterial)
ao = -0.8388 bo = 5.5123 Const
ai = -0.0487 bi = -0.0636 CRP (mg/m1)
qi =1.1367 ri= 1.4877 CRP" (mg/m1)"
q2 ¨5.14x 10- 5 r2 =3.50x10- 5 CRP2 (mg/m1)2
a2 = 0.0089 b2 = 0.0085 IP10 (pg/m1)
a3 = 0.0408 b3 = 0.0646 TRAIL (pg/ml)
q3 ¨0.6064 r3 ¨1.8039 TRAIL" (p g/m1)"
The performance of the model presented in Table 36 was examined on the
Microbiologically Confirmed Cohort (AUC of 0.95 0.03), Unanimous Cohort (AUC
of
0.95 0.02) and the Study cohort (AUC of 0.93 0.02). The signature performance
improved as the size of the equivocal region increases.
Tables 37A-C below detail signature measures of accuracy for diagnosing
bacterial versus viral infections when using the nonlinear model of the
present Example.
Performance estimates and their 95% CIs were obtained on the Microbiologically
Confirmed sub-cohort (Table 37A; n=241), Unanimous sub-cohort (Table 37B;
n=527),
and Study Cohort (Table 37C; n=653), using different sizes of equivocal
regions as
Date recue / Date received 202 1-1 1-25
135
indicated. Tables 37D-F below detail percentage of patients who had equivocal
immune
response in the Study Cohort when applying different thresholds, and Tables
37G-H
below detail signature sensitivity and specificity when applying different
equivocal
immune response thresholds obtained on the Study Cohort. In Tables 37D-H the
leftmost columns represents a minimal equivocal immune response threshold and
the
uppermost row represents a maximal equivocal immune response threshold.
Table 37A
Equivocal Equivocal Equivocal Equivocal All patients Accuracy
immune immune immune immune measure
response response response response
filter (10-90) filter (20-80) filter (30-70) filter (35-65)
0.98, 0.96, 0.94, 0.93, 0.89, Total
(0.96, 1.00) (0.93, 0.99) (0.91, 0.97) (0.90, 0.97) (0.85,
0.93) accuracy
0.96, 0.96, 0.95, 0.93, 0.88,
(0.90, 1.00) (0.91, 1.00) (0.89, 1.00) (0.87, 1.00) (0.80,
0.96) Sensitivity
0.99, 0.96, 0.94, 0.94, 0.90,
(0.97, 1.00) (0.93, 0.99) (0.90, 0.98) (0.90, 0.97) (0.87,
0.94) Specificity
65% 78% 87% 90% 100% % of patients
included
Table 37B
Equivocal Equivocal Equivocal Equivocal All patients Accuracy
immune immune immune immune measure
response response response response
filter (10-90) filter (20-80) filter (30-70) filter (35-65)
0.97, 0.95, 0.93, 0.92, 0.88, Total
(0.95, 0.99) (0.93, 0.97) (0.90, 0.95) (0.89, 0.94) (0.85,
0.91) accuracy
0.96, 0.93, 0.91, 0.90, 0.85,
(0.93, 0.99) (0.90, 0.97) (0.87, 0.95) (0.86, 0.94) (0.81,
0.89) Sensitivity
0.98, 0.96, 0.94, 0.93, 0.91,
(0.96, 1.00) (0.93, 0.99) (0.91, 0.97) (0.90, 0.97) (0.87,
0.94) Specificity
63% 76% 86% 90% 100% % of patients
included
Table 37C
Equivocal Equivocal Equivocal Equivocal All patients Accuracy
immune immune immune immune measure
response response response response
filter (10-90) filter (20-80) filter (30-70) filter (35-65)
0.95, 0.92, 0.90, 0.89, 0.85, Total
(0.93, 0.98) (0.90, 0.95) (0.87, 0.92) (0.86, 0.91) (0.83,
0.88) accuracy
Date recue / Date received 202 1-1 1-25
136
0.95, 0.92, 0.89, 0.87, 0.83,
(0.91, 0.98) (0.88, 0.95) (0.85, 0.92) (0.83, 0.91) (0.79,
0.87) Sensitivity
0.95, 0.93, 0.91, 0.90, 0.87,
(0.92, 0.98) (0.89, 0.96) (0.88, 0.95) (0.87, 0.94) (0.84,
0.91) Specificity
58% 72% 84% 88% 100% % of patients
included
Table 37D
0.95 0.9 0.85 0.8 0.75 0.7 0.65 0.6 0.55 0.5 0.45 0.4 0.35 0.3 0.25 0.2 0.15
0.1
52.8 47.2 44.0 40.9 38.6 36.3 34.8 33.2 31.2 29.1 26.3 24.0 22.7 20.517.6
13.910.4 6.6 0.05
46.2 40.6 37.4 34.3 32.0 29.7 28.2 26.6 24.7 22.5 19.8 17.5 16.1 13.911.0 7.4
3.8 0.1
42.4 36.8 33.5 30.5 28.2 25.9 24.3 22.8 20.8 18.7 15.9 13.6 12.3 10.1 7.2 3.5
0.15
38.9 33.2 30.0 27.0 24.7 22.4 20.8 19.3 17.3 15.2 12.4 10.1 8.7 6.6 3.7 0.2
35.2 29.6 26.3 23.3 21.0 18.7 17.2 15.6 13.6 11.5 8.7 6.4 5.1 2.9 0.25
32.3 26.6 23.4 20.4 18.1 15.8 14.2 12.7 10.7 8.6 5.8 3.5 2.1 0.3
30.2 24.5 21.3 18.2 15.9 13.6 12.1 10.6 8.6 6.4 3.7 1.4 0.35
28.8 23.1 19.9 16.8 14.5 12.3 10.7 9.2 7.2 5.1 2.3 0.4
26.5 20.8 17.6 14.5 12.3 10.0 8.4 6.9 4.9 2.8 0.45
23.7 18.1 14.9 11.8 9.5 7.2 5.7 4.1 2.1 0.5
21.6 15.9 12.7 9.6 7.4 5.1 3.5 2.0 0.55
19.6 13.9 10.7 7.7 5.4 3.1 1.5 0.6
18.1 12.4 9.2 6.1 3.8 1.5 0.65
16.5 10.9 7.7 4.6 2.3 0.7
14.2 8.6 5.4 2.3 0.75
11.9 6.3 3.1 0.8
8.9 3.2 0.85
5.7 0.9
Table 37E
0.95 0.9 0.85 0.8 0.75 0.7 0.65 0.6 0.55 0.5 0.45 0.4 0.35 0.3 0.25 0.2 0.15
0.1
53.6 43.6 38.2 33.5 29.5 26.0 23.5 21.6 18.8 16.6 13.8 11.3 10.3 9.1 7.5 5.3
3.4 2.5 0.05
51.1 41.1 35.7 31.0 27.0 23.5 21.0 19.1 16.3 14.1 11.3 8.8 7.8 6.6 5.0 2.8 0.9
0.1
50.2 40.1 34.8 30.1 26.0 22.6 20.1 18.2 15.4 13.2 10.3 7.8 6.9 5.6 4.1 1.9
0.15
48.3 38.2 32.9 28.2 24.1 20.7 18.2 16.3 13.5 11.3 8.5 6.0 5.0 3.8 2.2 0.2
46.1 36.1 30.7 26.0 21.9 18.5 16.0 14.1 11.3 9.1 6.3 3.8 2.8 1.6 0.25
44.5 34.5 29.2 24.5 20.4 16.9 14.4 12.5 9.7 7.5 4.7 2.2 1.3 0.3
43.3 33.2 27.9 23.2 19.1 15.7 13.2 11.3 8.5 6.3 3.4 0.9 0.35
42.3 32.3 27.0 22.3 18.2 14.7 12.2 10.3 7.5 5.3 2.5 0.4
39.8 29.8 24.5 19.7 15.7 12.2 9.7 7.8 5.0 2.8 0.45
37.0 27.0 21.6 16.9 12.9 9.4 6.9 5.0 2.2 0.5
34.8 24.8 19.4 14.7 10.7 7.2 4.7 2.8 0.55
Date recue / Date received 2021-11-25
137
32.0 21.9 16.6 11.9 7.8 4.4 1.9 0.6
30.1 20.1 14.7 10.0 6.0 2.5 0.65
27.6 17.6 12.2 7.5 3.4 0.7
24.1 14.1 8.8 4.1 0.75
20.1 10.0 4.7 0.8
15.4 5.3 0.85
10.0 0.9
Table 37F
0.95 0.9 0.85 0.8 0.75 0.7 0.65 0.6 0.55 0.5 0.45 0.4 0.35 0.3 0.25 0.2 0.15
0.1
52.1 50.6 49.4 47.9 47.3 46.1 45.5 44.3 43.1 41.0 38.3 36.2 34.4 31.4 27.2
22.2 17.1 10.5 0.05
41.6 40.1 38.9 37.4 36.8 35.6 35.0 33.8 32.6 30.5 27.8 25.7 24.0 21.0 16.8
11.7 6.6 0.1
35.0 33.5 32.3 30.8 30.2 29.0 28.4 27.2 26.0 24.0 21.3 19.2 17.4 14.4 10.2 5.1
0.15
29.9 28.4 27.2 25.7 25.1 24.0 23.4 22.2 21.0 18.9 16.2 14.1 12.3 9.3 5.1
0.2
24.9 23.4 22.2 20.7 20.1 18.9 18.3 17.1 15.9 13.8 11.1 9.0 7.2 4.2 0.25
20.7 19.2 18.0 16.5 15.9 14.7 14.1 12.9 11.7 9.6 6.9 4.8 3.0 0.3
17.7 16.2 15.0 13.5 12.9 11.7 11.1 9.9 8.7 6.6 3.9 1.8 0.35
15.9 14.4 13.2 11.7 11.1 9.9 9.3 8.1 6.9 4.8 2.1 0.4
13.8 12.3 11.1 9.6 9.0 7.8 7.2 6.0 4.8 2.7 0.45
11.1 9.6 8.4 6.9 6.3 5.1 4.5 3.3 2.1 0.5
9.0 7.5 6.3 4.8 4.2 3.0 2.4 1.2 0.55
7.8 6.3 5.1 3.6 3.0 1.8 1.2 0.6
6.6 5.1 3.9 2.4 1.8 0.6 0.65
6.0 4.5 3.3 1.8 1.2 0.7
4.8 3.3 2.1 0.6 0.75
4.2 2.7 1.5 0.8
2.7 1.2 0.85
1.5 0.9
Table 37G
0.95 0.9 0.85 0.8 0.75 0.7 0.65 0.6 0.55 0.5 0.45 0.4 0.35 0.3 0.25 0.2 0.15
0.1
98.0 98.3 98.5 98.6 98.7 98.7 98.8 98.8 98.8 98.9 95.6 92.9 92.090.7 89.2 87.1
85.484.6 0.05
92.9 94.1 94.6 95.0 95.3 95.5 95.6 95.7 95.9 96.0 92.9 90.4 89.5 88.3 86.8
84.8 83.2 0.1
91.2 92.7 93.3 93.7 94.1 94.3 94.5 94.6 94.8 94.9 92.0 89.5 88.6 87.4 85.9
84.0 0.15
87.9 89.8 90.7 91.3 91.7 92.1 92.3 92.5 92.8 92.9 90.1 87.7 86.8 85.7 84.3
0.2
84.3 86.8 87.8 88.6 89.2 89.6 89.9 90.1 90.5 90.7 88.0 85.7 84.8 83.8 0.25
81.9 84.7 85.8 86.7 87.4 87.9 88.3 88.5 88.9 89.2 86.5 84.3 83.5 0.3
80.1 83.1 84.3 85.3 86.0 86.6 87.0 87.3 87.7 88.0 85.4 83.2 0.35
78.8 81.9 83.3 84.3 85.1 85.7 86.1 86.4 86.8 87.1 84.6 0.4
75.5 79.0 80.5 81.6 82.5 83.2 83.7 84.0 84.5 84.8 0.45
Date recue / Date received 2021-11-25
138
72.1 76.0 77.6 78.9 79.9 80.6 81.1 81.5 82.1 0.5
73.1 76.7 78.2 79.4 80.4 81.1 81.6 81.9 0.55
74.2 77.5 78.9 80.1 81.0 81.6 82.1 0.6
74.9 78.0 79.4 80.5 81.3 82.0 0.65
75.8 78.7 80.0 81.0 81.8 0.7
76.9 79.6 80.8 81.7 0.75
78.0 80.5 81.6 0.8
79.3 81.5 0.85
80.5 0.9
Table 37H
0.95 0.9 0.85 0.8 0.75 0.7 0.65 0.6 0.55 0.5 0.45 0.4 0.35 0.3 0.25 0.2 0.15
0.1
97.5 94.5 92.3 89.7 88.6 86.7 85.7 83.9 82.1 79.2 80.1 80.8 81.3 82.1 83.1
84.2 85.286.3 0.05
97.9 95.5 93.6 91.4 90.5 88.8 88.0 86.4 84.9 82.3 83.0 83.5 83.9 84.5 85.3
86.1 86.9 0.1
98.2 95.9 94.2 92.2 91.4 89.9 89.1 87.7 86.2 83.9 84.4 84.8 85.1 85.7 86.3
87.1 0.15
98.3 96.2 94.7 92.7 92.0 90.6 89.8 88.5 87.1 84.9 85.4 85.7 86.086.5 87.1
0.2
98.4 96.5 95.0 93.2 92.5 91.1 90.5 89.2 87.9 85.8 86.2 86.5 86.8 87.2 0.25
98.5 96.7 95.3 93.5 92.9 91.6 90.9 89.7 88.5 86.4 86.8 87.1 87.3 0.3
98.5 96.8 95.4 93.8 93.1 91.9 91.2 90.0 88.9 86.9 87.2 87.5 0.35
98.6 96.9 95.5 93.9 93.3 92.0 91.4 90.2 89.1 87.1 87.5 0.4
98.6 96.9 95.6 94.0 93.4 92.2 91.6 90.4 89.3 87.4 0.45
98.7 97.0 95.8 94.2 93.6 92.4 91.8 90.7 89.6 0.5
96.4 94.8 93.6 92.1 91.6 90.4 89.9 88.8 0.55
95.1 93.6 92.4 91.0 90.4 89.3 88.8 0.6
93.9 92.4 91.3 89.9 89.3 88.3 0.65
93.3 91.8 90.7 89.3 88.8 0.7
92.1 90.7 89.6 88.3 0.75
91.6 90.2 89.1 0.8
90.2 88.8 0.85
89.1 0.9
The signature performance was further examined on the Study Cohort when
excluding the following two subgroups: (i) patients whose blood sample was
taken after
more than 3 days of antibiotic treatment in the hospital and (ii) patients
with a suspected
gastroenteritis. Details of the model performance on the Microbiologically
Confirmed
Cohort (AUC of 0.96 0.04), Unanimous Cohort (AUC of 0.96 0.02) and the Study
cohort (AUC of 0.95 0.02) is further depicted in Table 38A-C.
Date recue / Date received 2021-11-25
139
Tables 38A-C detail signature measures of accuracy for diagnosing bacterial
vs.
viral infections using the non-linear MLR model. Performance estimates and
their 95%
CIs were obtained on the Microbiologically Confirmed sub-cohort (Table 38A;
n=200),
Unanimous sub-cohort (Table 38B; n=402), and Study Cohort (Table 38C; n=491),
when excluding patients with over 3 days of antibiotics treatment at the
hospital and/or
suspicion of gastroenteritis.
Table 38A
Equivocal Equivocal Equivocal Equivocal All patients Accuracy
immune immune immune immune measure
response response response response
filter (10-90) filter (20-80) filter (30-70) filter (35-65)
0.98, 0.96, 0.95, 0.95, 0.91, Total
(0.96, 1) (0.93, 0.99) (0.92, 0.99) (0.92, 1) (0.86, 0.95)
accuracy
0.94, 0.95, 0.96, 0.96, 0.90,
(87, 1) (0.89, 1) (0.89, 1) (0.89, 1) (0.82, 0.99)
Sensitivity
1, 0.97, 0.95, 0.95, 0.91,
(1,1) (0.93, 1) (0.92, 0.99) (0.91, 0.99) (0.86, 0.95)
Specificity
65% 80% 88% 90% 100% % of patients
included
Table 38B
Equivocal Equivocal Equivocal Equivocal All patients Accuracy
immune immune immune immune measure
response response response response
filter (10-90) filter (20-80) filter (30-70) filter (35-65)
0.98, 0.96, 0.95, 0.94, 0.91,
(0.96, 1) (0.94, 0.98) (0.93, 0.97) (0.92, 0.97) (0.88,
0.94) Total accuracy
0.98, 0.95, 0.94, 0.93, 0.89,
(0.95,1) (0.92, 0.99) (0.90, 0.98) (0.89, 0.97) (0.85,
0.94) Sensitivity
0.99, 0.97, 0.95, 0.95, 0.92,
(0.97, 1) (0.94, 0.99) (0.93, 0.98) (0.92, 0.98) (0.88,
0.96) Specificity
65% 79% 88% 91% 100% % of
patients
included
Table 38C
Equivocal Equivocal Equivocal Equivocal All patients Accuracy
immune immune immune immune measure
response response response response
filter (10-90) filter (20-80) filter (30-70) filter (35-65)
0.97, 0.94, 0.93, 0.91, 0.88, Total
(0.95, 0.99) (0.92, 0.97) (0.90, 0.95) (0.89, 0.94) (0.85,
0.91) accuracy
Date recue / Date received 202 1-1 1-25
140
0.97, 0.95, 0.92, 0.91, 0.87,
(0.94, 1) (0.91, 0.98) (0.88, 0.96) (0.87, 0.95) (0.83,
0.92) Sensitivity
0.97, 0.94, 0.93, 0.92, 0.89,
(0.94, 1) (0.91, 0.97) (0.90, 0.96) (0.89, 0.96) (0.85,
0.92) Specificity
59% 74% 85% 88% 100% % of
patients
included
EXAMPLE 14
Antibiotics based stratification
Of the 653 patients with suspicion of acute infection, 427 received
antibiotics
(299 had bacterial diagnosis and 128 had viral diagnosis). The AUC of the
signature for
distinguishing between the bacterial and viral infected patients in the
antibiotics treated
patients sub-cohort was 0.93 0.02. No statistically significant difference was
observed
between the performance on the antibiotics treated patients and the general
cohort
(0.94 0.02 versus 0.93 0.02; P = 0.5).
Although the invention has been described in conjunction with specific
embodiments thereof, it is evident that many alternatives, modifications and
variations
will be apparent to those skilled in the art.
Citation or identification of any reference in this application shall not be
construed as an admission that such reference is available as prior art to the
present
invention. To the extent that section headings are used, they should not be
construed as
necessarily limiting.
Date recue / Date received 202 1-1 1-25