Note: Descriptions are shown in the official language in which they were submitted.
CA 02958245 2017-02-17
IMAGE GENERATOR FOR LOCATION BASED ARRANGEMENTS OF ELEMENTS
BACKGROUND
[0001] It can be difficult to envision or otherwise specify locations for
elements in an
arrangement. This is particularly true when there are constraints as to
locations where the
elements can be placed in an arrangement.
BRIEF DESCRIPTION OF DRAWINGS
[0002] Illustrative embodiments are shown by way of example in the
accompanying drawings
and should not be considered as a limitation of the present disclosure:
[0003] FIG. 1 illustrates an exemplary network environment of a computing
system in
accordance with exemplary embodiments of the present disclosure;
[0004] FIG. 2 is a block diagram of an example computing system for
implementing exemplary
embodiments of the present disclosure;
[0005] FIG. 3 is a block diagram that illustrates example data flow for
creating a two-
dimensional image file in accordance with exemplary embodiments of the present
disclosure;
[0006] FIG. 4 illustrates a model according to exemplary embodiments of the
present disclosure;
[0007] FIG. 5 illustrates a sample two-dimensional image file after according
to exemplary
embodiments of the present disclosure; and
[0008] FIG. 6 is a flowchart illustrating producing a two-dimensional image
including the
arrangement of elements according to exemplary embodiments of the present
disclosure.
DETAILED DESCRIPTION
[0009] Described in detail herein are methods, systems, and computer-readable
media associated
with generation of two-dimensional images of the objects including
arrangements of elements
within the objects. In exemplary embodiments, object data related to an object
can be input and
element data regarding elements associated with the object can be extracted
from the object data.
CA 02958245 2017-02-17
Using the element data, one or more queries to one or more databases can be
created to retrieve
sub-element data regarding one or more sub-elements associated with the
elements.
[0010] Embodiments of the system can determine an affinity associated with the
elements and
sub-elements based on the element data and/or the sub-element data, and can
execute multiple
iterations of one or more regression models to generate a text file containing
text strings
associated with the element data as well as text strings for coordinates for
the element data. For
example, the one or more regression models can be executed to determine the
coordinates for the
elements based on one or more constraints and/or based on the affinity between
the element data
and/or the sub-element data. In some embodiments, the text file can be a comma
separate flat file
that uses commas to demarcate the text strings for the element data and
coordinates.
Embodiments of the system can generate image file including a two-dimensional
image of the
object based one the text file. For example, in some embodiments, the system
can convert the
comma separated flat file into a two-dimensional image of the object including
a visual
arrangement of the elements in the object based on the coordinates in the flat
file.
[0011] In accordance with embodiments of the present disclosure, a system and
method for
creating a two-dimensional image can include one or more data storage devices
including a non-
transitory computer-readable media storing one or more data sources and a
computing system
including one or more servers having one or more processors communicatively
coupled to the
one or more data storage devices through a network to facilitate communication
between the one
or more processors and the one or more data sources. In exemplary embodiments,
the computing
system can be programmed to receive input (e.g., a first flat file) including
object data associated
with an object to be visualized, extract, from the object data, element data
associated with
elements to be associated with the object to be visualized, query the one more
data sources for
sub-element data associated with sub-elements of elements. The computer system
can be
further programmed to determine affinities between the elements and/or sub-
elements, execute
regression models utilizing the element data, the sub-element data, the
affinities, and one or more
constraints, and create a two-dimensional image representing the object that
include graphical
representations of the elements in an arrangement defined in response to
execution of the
regression models.
1
CA 02958245 2017-02-17
[0012] According to exemplary embodiments, in response to executing the
regression models,
the computing system can creates a second flat file based on an outcome of the
execution of the
regression models. The second flat file can include strings of alphanumeric
characters.
[0013] According to exemplary embodiments, the two-dimensional image can be
created by
converting the strings of alphanumeric characters in the second flat file into
the graphical
representations of the elements in the two-dimensional image arranged
according to a coordinate
system, where the coordinates can be specified in the second flat file.
[0014] According exemplary embodiments, the constraints utilized by the
regression models can
include, for example, location based constraints, adjacency based constraints,
angle constraints,
affinity constraints, and/or logical constraints.
[0015] The following description is presented to enable any person skilled in
the art to create
two-dimensional image files that can be viewed to visually depict an
arrangement of elements
within an object based on results of a regression model. Various modifications
to the example
embodiments will be readily apparent to those skilled in the art, and the
generic principles
defined herein may be applied to other embodiments and applications without
departing from the
scope of the invention. Moreover, in the following description, numerous
details are set forth for
the purpose of explanation. However, one of ordinary skill in the art will
realize that example
embodiments of the present disclosure may be practiced without the use of
these specific details.
In other instances, well-known structures and processes are shown in block
diagram form in
order not to obscure the description of example embodiments with unnecessary
detail. Thus, the
present disclosure is not intended to be limited to the embodiments shown, but
is to be accorded
the widest scope consistent with the principles and features disclosed herein.
[0016] FIG. 1 illustrates an exemplary network environment of a computing
system 100
according to exemplary embodiments. In exemplary embodiments, the computing
system 100 is
in communication with data sources 105 and a server 110 via a communications
network 115.
[0017] In an example embodiment, one or more portions of communications
network 115 can be
an ad hoc network, an intranet, an extranet, a virtual private network (VPN),
a local area network
(LAN), a wireless LAN (WLAN), a wide area network (WAN), a wireless wide area
network
2
CA 02958245 2017-02-17
(WWAN), a metropolitan area network (MAN), a portion of the Internet, a
portion of the Public
Switched Telephone Network (PSTN), a cellular telephone network, a wireless
network, a WiFi
network, a WiMax network, any other type of network, or a combination of two
or more such
networks.
[0018] The server 110 and the data source 105 are connected to the network 115
via a wired
connection. Alternatively, the server 110 and the data source 105 can be
connected to the
network 115 via a wireless connection. The server 110 includes one or more
computers or
processors configured to communicate with the computing system 100 and the
data source 105,
via the network 115. The server 110 hosts one or more applications configured
to interact with
one or more components computing system 100 and/or facilitates access to the
content of the
data source 105. The data source 105 may store information/data, as described
herein. For
example, the data source 105 may include a metadata source 130 and element
data flat files 135.
Each of the element data flat files 135 can be a comma separated file
including element data
associated with specific element that can be used to from an object to be
visualized. The element
data in each of the element data flat files 135 can include, for example,
location constraints, an
element size (e.g., footprint), sub-element data, element type data, and/or
element format data.
The metadata source 130 may include metadata corresponding to various elements
within the
object and sub-elements associated with sub-element data identified in the
element data flat file
135. The data source 105 can include one or more storage devices for storing
the sales data
source, the flat files 135, instructions (or code) for use by the server 110
and the computing
system 100, and/or any other suitable data or instructions for implementing
embodiments of the
present disclosure. The data source 105 and server 110 can be located at one
or more
geographically distributed locations from each other or from the computing
system 100.
Alternatively, the data source 105 can be included within server 110.
[0019] In some embodiments, the server 100 hosts an application. In exemplary
embodiments,
the server 110 can execute one or more instances of the visualization
application 120 residing on
the server 110 to facilitate retrieval of element data, metadata, define
affinity data, generate one
or more regression models based on the retrieved data, generating a second
flat file containing
alphanumeric characters, and generating a two-dimensional image including a
graphical
representation of an elements within an object.
3
CA 02958245 2017-02-17
[0020] The visualization application 120 can receive input regarding data
associated with an
object. The input may include object size, type, location, and format. The
visualization
application 120 may extract, from the element flat file 135, data associated
with the plurality of
elements or a specific element, to be associated with the object. The data may
include, element
constraints, element size data, sub-elements associated, element type data,
and element format
data. The visualization application 120 can query the metadata 130 for data
associated with a
plurality of sub-elements associated with each element within the object. The
visualization
application 120 may determine an affinity of the elements within the object.
[0021] The visualization application 120 may execute regression models
associated with
elements, the affinity of the elements and sub-elements, and constraints. In
exemplary
embodiments, the visualization application 120 may execute multiple iterations
of the regression
models based on variations of the constraints. The visualization model 120 may
create a second
flat file based on the execution of the regression models. The second flat
file may be a comma
separated file containing alphanumeric characters. The alphanumeric characters
may represent
multiple elements associated with objects and the coordinates of the multiple
departments with
respect to the object. The coordinates may represent an arrangement of the
elements within the
object based on the execution of the regression models. The visualization
application 120 may
convert the second flat file into a two-dimensional image file including
graphical representation
of an arrangement of the elements within the object. For example, the two-
dimensional image
file may be a layout of the object including different elements positioned in
the object based on
the regression models executed by the visualization application 120. In
exemplary embodiments,
the visualization application 120 may use the coordinates from the second flat
file to position the
elements with respects to the object in the correct location in the two-
dimensional image file.
[0022] In a non-limiting example, the object may be a retail store, the
elements may be various
departments within the retail store, and the sub-elements maybe items within
the departments.
The visualization application 120 may receive input associated with a retail
store. The input may
include retail store size, format, and location. The visualization application
120 may query the
metadata source 130 for sales data associated with the retail store and the
department and items
within the retail store. The visualization application 120 may also extract
department data for a
specific department from the element flat file 135. The element flat file 135
may include,
4
CA 02958245 2017-02-17
department constraints, department size data, department item data, department
type data, and
department format data. The constraints may be logical constraints, physical
constraints, legal
constraints, angle constraints and business constraints. The visualization
application 120 may run
a first iteration of a regression model based on the retail store data, sales
data and the department
data extracted from the element flat file 135. The visualization application
120 may calculate the
affinity of various departments within the retail store. The affinity includes
an index that
represents the actual rate at which two departments or categories sell
together relative to their
expected rate of sale.
[0023] The visualization application 120 may run several iterations of the
regression model
using the affinity calculation and adjusted constraints. The visualization
application 120 may
generate a comma separated second flat file. The second flat file may contain
alpha numeric
characters representing the positions of the various departments throughout
,the retail store. The
second flat file may contain coordinates for the departments with respect to
the layout of the
retail store. The data in the second flat file may represent a recommended
layout for the retail
store. The visualization application 120 may generate a two-dimensional image
file depicting a
visual layout of the retail store using the second flat file. The two-
dimensional image file may be
a blueprint of the retail store or a map of the retail store. The
visualization application 120 may
use the coordinates from the second flat file to accurately position the
departments within the
facility in the two-dimensional image file.
[0024] FIG. 2 is a block diagram of an example computing system for
implementing exemplary
embodiments of the present disclosure. The computing system 100 includes one
or more non-
transitory computer-readable media for storing one or more computer-executable
instructions or
software for implementing exemplary embodiments. The non-transitory computer-
readable
media may include, but are not limited to, one or more types of hardware
memory, non-transitory
tangible media (for example, one or more magnetic storage disks, one or more
optical disks, one
or more flash drives, one or more solid state disks), and the like. For
example, memory 206
included in the computing system 100 may store computer-readable and computer-
executable
instructions or software (e.g., applications 230) for implementing exemplary
operations of the
computing system 100. The computing device 100 also includes configurable
and/or
programmable processor 202 and associated core(s) 204, and optionally, one or
more additional
CA 02958245 2017-02-17
configurable and/or programmable processor(s) 202' and associated core(s) 204'
(for example, in
the case of computer systems having multiple processors/cores), for executing
computer-
readable and computer-executable instructions or software stored in the memory
206 and other
programs for implementing exemplary embodiments of the present disclosure.
Processor 202
and processor(s) 202' may each be a single core processor or multiple core
(204 and 204')
processor.
[0025] Virtualization may be employed in the computing system 100 so that
infrastructure and
resources in the computing system 100 may be shared dynamically. A virtual
machine 212 may
be provided to handle a process running on multiple processors so that the
process appears to be
using only one computing resource rather than multiple computing resources.
Multiple virtual
machines may also be used with one processor.
[0026] Memory 206 may include a computer system memory or random access
memory, such as
DRAM, SRAM, EDO RAM, and the like. Memory 206 may include other types of
memory as
well, or combinations thereof.
[0027] A user may interact with the computing system 100 through a visual
display device 214,
such as a computer monitor, which may display one or more graphical user
interfaces 216, multi
touch interface 220, and a pointing device 218.
[0028] The computing system 100 may also include one or more storage devices
226, such as a
hard-drive, CD-ROM, or other computer readable media, for storing data and
computer-readable
instructions and/or software that implement exemplary embodiments of the
present disclosure
(e.g., applications). For example, the one or more storage devices 226 can
store the visualization
application 120, which can be executed by the processor 202 of the computer
device 200, and/or
can include a client-side application for access and interacting with the
visualization application
120 hosted by a server (e.g., the server 110 shown in FIG. 1). The one or more
databases 228
can store any suitable information required to implement exemplary
embodiments. For example,
exemplary storage device 226 can include one or more databases 228 for storing
information,
such as the metadata source 130 and the element data flat file 135. The
databases 228 may be
6
CA 02958245 2017-02-17
updated manually or automatically at any suitable time to add, delete, and/or
update one or more
data items in the databases.
[0029] The computing system 100 can include a network interface 208 configured
to interface
via one or more network devices 224 with one or more networks, for example,
Local Area
Network (LAN), Wide Area Network (WAN) or the Internet through a variety of
connections
including, but not limited to, standard telephone lines, LAN or WAN links (for
example, 802.11,
Ti, T3, 56kb, X.25), broadband connections (for example, ISDN, Frame Relay,
ATM), wireless
connections, controller area network (CAN), or some combination of any or all
of the above. In
exemplary embodiments, the computing system can include one or more antennas
222 to
facilitate wireless communication (e.g., via the network interface) between
the computing system
100 and a network and/or between the computing device 100 and other computing
devices. The
network interface 208 may include a built-in network adapter, network
interface card, PCMCIA
network card, card bus network adapter, wireless network adapter, USB network
adapter, modem
or any other device suitable for interfacing the computing device 100 to any
type of network
capable of communication and performing the operations described herein.
[0030] The computing system 100 may run any operating system 210, such as any
of the
versions of the Microsoft Windows operating systems, the different releases
of the Unix and
Linux operating systems, any version of the MacOS for Macintosh computers,
any embedded
operating system, any real-time operating system, any open source operating
system, any
proprietary operating system, or any other operating system capable of running
on the computing
device 200 and performing the operations described herein. In exemplary
embodiments, the
operating system 210 may be run in native mode or emulated mode. In an
exemplary
embodiment, the operating system 210 may be run on one or more cloud machine
instances.
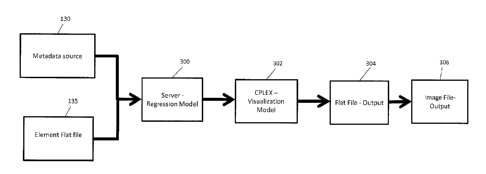
[0031] FIG. 3 is a block diagram that illustrates example data flow for
creating an two-
dimensional image file in accordance with exemplary embodiments of the present
disclosure. In
exemplary embodiments, the visualization application 120 (as shown in FIG. 1)
extracts data
from the element data flat file 135. The visualization application 120 may use
Teradata to extract
the data from the department data flat file 135. The visualization application
120 can also query
the metadata source 130 for data for a particular object associated with the
elements. The
7
CA 02958245 2017-02-17
visualization application 120 may also receive input associated with data
about the object. The
data may include object size, location and type.
The visualization application 120 may input the element data, metadata, and
object data into an
initial iteration of a regression model 300. The visualization application 120
may produce
resultant data from the first iteration of the regression model 300. The
resultant data may
represent an initial arrangement of the elements within the object. The
visualization application
120 may receive further constraints for the resultant data. The visualization
application 120 may
calculate affinity data for the elements. Based on the new constraints and
calculated affinity the
visualization application 120 may run a final iteration of the regression
model also known as the
visualization model 302.
[0032] The visualization model 302 may produce a second flat file 304. The
second flat file 304
may be a comma separated file containing alphanumeric characters. The
alphanumeric characters
may represent multiple departments of a retail store and the coordinates of
the elements with
respect to the object. The coordinates may represent an arrangement of the
elements within the
retail store based on the execution of the regression models.
[0033] The visualization application 120 may convert the second flat file 304
into a two-
dimensional image file 306 including graphical representation of an
arrangement of the
departments within the retail store. For example, the two-dimensional image
file 306 may be a
layout of the retail store including different departments positioned in the
retail store based on
the regression models executed by the visualization application 120. In
exemplary embodiments,
the visualization application 120 may use the coordinates from the second flat
file 304 to
position the departments in the correct location in the two-dimensional image
file 306. In
exemplary embodiments, the two-dimensional image file may be a map, blueprint
or layout of
the retail store.
[0034] FIGS. 4-7 illustrate a non-limiting example of the implementation of
the visualization
application 120 (as shown in FIG. 1) generating a recommended layout for a
retail store. In this
example an object is a retail store, the elements are departments within the
retail store and sub-
elements are items within the departments.
8
CA 02958245 2017-02-17
[0035] FIG. 4 illustrates the visualization model according to exemplary
embodiments of the
present disclosure. In exemplary embodiments, the visualization model 302 (as
shown in FIG. 3)
may determine a recommended arrangement of the departments within the retail
store. The
visualization model 302 may calculate the departments' affinity to determine
the arrangement of
the departments. In order to calculate affinity the visualization model 302
may execute a lift
calculation 400. In exemplary embodiments, the lift calculation 400 reflects
the maximum
location based revenue and the maximum adjacency based revenue. For example,
the
visualization model 302 may calculate in which areas of the retail store a
particular department is
generating the most revenue and which departments is the particular department
adjacent to
when generating the most revenue. The visualization model 302 may calculate a
maximum sales
lift based on the maximum location based revenue and the maximum adjacency
based revenue.
The visualization model 302 may calculate the maximum lift using the following
equation:
Maximize Sales Liftmx =sf {Department Adjacency, Department Location} (1)
[0036] The maximum sales lift is subject to logical constraints, business
constraints, physical
constraints, and legal constraints. For example, even though a certain
department may generate
the most revenue adjacent to another department, the two departments may be
legally restricted
to be positioned next to each other, and consequently may be a legal
constraint. The visualization
model 302 may further calculate the maximum lift based on the current layout
and the optimized
layout. The optimized model 302 may calculate an incremental revenue based on
the current
layout and the optimized layout. The optimized model 302 may execute the lift
calculation 400
based on the following equation:
Lift= (Incremental revenue)/(Current Revenue) (2)
[0037] Based on the calculated lift, the optimized model 302 may generate
coordinates for the
departments. The coordinates may represent the positioning of the departments
within the retail
store. The optimized model 302 may generate a second flat file 304 including
the departments
and the coordinates for the positioning of the departments within the retail
store.
[0038] FIG. 5 illustrates an example two-dimensional image after the
visualization process
according to exemplary embodiments of the present disclosure. For example, the
visualization
9
CA 02958245 2017-02-17
application 120 (as shown in FIG. 1) may produce a two-dimensional image file
illustrating the
layout of the retail store including the arrangement of the departments based
on the maximum lift
calculation 400 as shown in FIG. 4. In exemplary embodiments, the two-
dimensional image 500
may illustrate the layout of the retail store where a position of the
different departments is
determined at least in part by using the lift calculation 400. For example, in
Department E is
placed to the right side of Department D and the left side of Department F.
The positioning of
Department E may result in a higher lift than the positioning shown based on
the affinity to
Departments D and F. The higher lift may cause higher revenue.
[0039] FIG. 6 is a flowchart illustrating producing a two-dimensional image
including the
arrangement of elements according to exemplary embodiments of the present
disclosure. In
exemplary embodiments, in operation 600 the visualization application 120 (as
shown in FIG. 1)
can receive input regarding data associated with a retail store. The input may
include retail store
size, type, location and format.
[0040] In operation 602, the visualization application 120 may extract, from
the element flat file
135, data associated with the plurality of departments associated with the
retail store. The data
may include, department constraints, department size data, department item
data, department
type data, and department format data. In exemplary embodiments, the
constraints may be
logical constraints, physical constraints, legal constraints, angle
constraints and business
constraints.
[0041] In operation 604, the visualization application 120 can query the
metadata source 130 for
sales data associated with a plurality of be items within a department. The
visualization
application 120 may retrieve data associated with the items including sales
data, revenue data
and pricing data.
[0042] In operation 606, the visualization application 120 may execute
regression models
associated with the multiple departments, and constraints. In exemplary
embodiments, the
visualization application 120 may execute multiple iterations of the
regression models based on
variations of the constraints. The initial regression model iteration may
generate resultant data.
The visualization application 120 may receive further constraints for the
resultant data. The
CA 02958245 2017-02-17
constraints may be logical constraints, business constraints, legal
constraints and physical
constraints. For example, adjacency constraints may restrict certain
departments to be adjacent
to each other and angle constraints may restrict a department to be facing a
certain angle in the
retail store. In exemplary embodiments, the visualization model 302 (as shown
in FIG. 3), may
determine an optimized layout to uncover newer opportunities for each
department while
simultaneously minimizing conflicting scenarios between demand fulfillments of
the
departments using the constraints.
[0043] In operation 608, the visualization application 120 determine an
affinity of the items
between the multiple departments. In exemplary embodiments, the affinity
includes an index that
represents the actual rate at which two departments or categories sell
together relative to their
expected rate of sale.
[0044] In operation 610, the visualization application 120 may run a final
iteration of the
regression model based on the received constraints, affinity calculation and
resultant data
through a visualization model 302. The visualization model 302 may determine a
recommended
arrangement of the departments within the retail store using affinity
visualization. Affinity is an
index that represents the actual rate at which two departments or categories
sell together relative
to their expected rate of sale. Affinity may assist the visualization model
302 in determining
which departments should be positioned next to each other. The visualization
model 302
determine the affinity of the departments by executing a lift calculation 400
(as shown in FIG. 4)
and determining a lift factor based on the constraints and resultant data. The
lift factor may
reflect the rise in revenue for a department based on a new position of the
department in the retail
store. The visualization model 302 may determine an arrangement of the
departments based on
the highest lift factor.
[0045] In operation 612, the visualization application 120 may create a second
flat file based on
the execution of the regression models. The second flat file may be a comma
separated file
containing alphanumeric characters. The alphanumeric characters may represent
multiple
departments of a retail store and the coordinates of the multiple departments
with respect to the
retail store. The coordinates may represent an arrangement of the departments
within the retail
store based on the execution of the regression models.
11
CA 02958245 2017-02-17
[0046] In operation 614, the visualization application 120 may convert the
second flat file into a
two-dimensional image file 500 including graphical representation of an
arrangement of the
departments within the retail store. For example, the two-dimensional image
file 500 may be a
layout of the retail store including different departments positioned in the
retail store based on
the regression models executed by the visualization application 120. In
exemplary embodiments,
the visualization application 120 may use the coordinates from the second flat
file to position the
departments in the correct location in the two-dimensional image 500 (as shown
in FIG. 5).
[0048] Exemplary flowcharts are provided herein for illustrative purposes and
are non-limiting
examples of methods. One of ordinary skill in the art will recognize that
exemplary methods
may include more or fewer steps than those illustrated in the exemplary
flowcharts, and that the
steps in the exemplary flowcharts may be performed in a different order than
the order shown in
the illustrative flowcharts.
12