Note: Descriptions are shown in the official language in which they were submitted.
CA 02959599 2017-02-28
WO 2016/034993 PCT/1B2015/056511
METHOD AND SYSTEM FOR DETERMINING SAMPLING PLAN FOR
INSPECT/ON OF COMPOSITE COMPONENTS
CROSS-REFERENCE TO RELATED APPLICATIONS
[0001] This application claims priority under 35 U.S.C. 119(e) to U.S.
application
No. 62/044,618 filed September 2, 2014, entitled "Method and System for
Determining Sampling Plan for Inspection of Composite Components", the entire
contents of which are hereby incorporated by reference.
TECHNICAL FIELD
[0002] The present invention relates to the field of inspecting composite
components fabricated by automated manufacturing processes and more
particularly, to a dynamic method of determining a sampling plan for the
inspection
of composite components.
BACKGROUND OF THE ART
[0003] Inspecting the dimensional requirements of a manufactured component is
an important part of the manufacturing process. Manual inspection of every
component is extremely time consuming. Sampling is thus used to lower the
costs
and reduce the overall time needed for inspection. Acceptance sampling, which
consists of sampling only one or two components of a batch to accept or reject
the
entire batch, is used to determine if a production lot of material meets the
specification. However, in certain industries, acceptance sampling is
incompatible
with the nature of the components. In some instances, rejecting an entire
batch
based on one or two samples is cost-prohibitive. In other instances, accepting
an
entire batch based on one or two components does not meet industry standards
with regards to safety requirements.
[0004] There is therefore a need to improve the inspection phase of the
manufacturing process for certain components.
CA 02959599 2017-02-28
WO 2016/034993 PCT/IB2015/056511
SUMMARY
[0005] There is described a method and system for determining a sampling plan
using a statistical analysis of different regions of at least one component
and
determining a level of performance for each of the regions. Subsequent
components are then inspected using the sampling plan. Results from the
inspection may be used to update and/or modify the sampling plan in a feedback
loop.
[0006] In accordance with a first broad aspect, there is provided a computer-
implemented method for determining a sampling plan for inspection of composite
components, the composite components each comprising at least one ply
comprising a plurality of regions, each one of the regions having a plurality
of
fibers. The method comprises receiving deviation data for all of the regions
of at
least one ply of at least a first composite component, the deviation data
corresponding to a deviation of a measured value from a nominal value for a
given
fiber; applying a statistical model to the deviation data to obtain a
performance
indicator for each one of the regions and generating a mapping of performance
indicators for the at least one ply; and establishing the sampling plan for
inspection
of the at least one ply of at least one subsequent composite component as a
function of the mapping of performance indicators.
[0007] In some embodiments of the method, establishing the sampling plan
comprises assigning a sampling criteria to each of the performance indicators,
the
sampling criteria being indicative of how many regions having a given
performance
indicator are to be inspected.
[0008] In some embodiments of the method, the sampling criteria is indicative
of
how many regions from one of the at least one ply, the at least one subsequent
composite component, and a plurality of subsequent composite components, are
to
be inspected.
- 2 -
CA 02959599 2017-02-28
WO 2016/034993 PCT/IB2015/056511
[0009] In some embodiments of the method, establishing the sampling plan
comprises establishing a first sampling plan for a first ply as a function of
a first
sampling criteria, and establishing a second sampling plan for a second ply as
a
function of a second sampling criteria different from the first sampling
criteria.
[0010] In some embodiments of the method, establishing the sampling plan
comprises establishing a first sampling plan for a first subsequent component
as a
function of a first sampling criteria, and establishing a second sampling plan
for a
second subsequent component as a function of a second sampling criteria
different
from the first sampling criteria.
[0011] In some embodiments of the method, establishing the sampling plan
further
comprises selecting regions for inspection as a function of the performance
indicators and the sampling criteria.
[0012] In some embodiments of the method, applying a statistical model
comprises
using at least three levels of performance indicators, the at least three
levels
comprising a lowest level of performance, an intermediate level of
performance,
and a highest level of performance.
[0013] In some embodiments of the method, selecting regions comprises
selecting
all regions of the lowest level and selecting some regions of the intermediate
level.
[0014] In some embodiments of the method, selecting regions comprises
selecting
a number of regions of the highest level that is less than a number of
selected
regions of the intermediate level.
[0015] In some embodiments, the method further comprises receiving updated
deviation data of the selected regions from inspection of the at least one
subsequent composite component; applying the statistical model to the updated
deviation data of the selected regions to obtain updated performance
indicators for
the selected regions; and generating an updated mapping of performance
indicators with the updated performance indicators.
- 3 -
CA 02959599 2017-02-28
WO 2016/034993 PCT/IB2015/056511
[0016] In some embodiments, the method further comprises receiving updated
deviation data of the selected regions from inspection of the at least one
subsequent composite component; applying the statistical model to the updated
deviation data of the selected regions to obtain updated performance
indicators for
the selected regions; and generating an updated mapping of performance
indicators with the updated performance indicators.
[0017] In some embodiments, the method further comprises comparing the
updated performance indicators of the selected regions with the performance
indicators for corresponding regions; selecting for inspection regions
adjacent to a
selected region for which the updated performance indicator is lower than the
performance indicator; receiving deviation data for the adjacent regions; and
quantifying a degradation of a manufacturing process using the deviation data
from
the adjacent regions.
[0018] In some embodiments of the method, receiving deviation data comprises
receiving measurement data for at least one of the fibers of a region, for all
regions
of the at least one ply, and determining the deviation data from the
measurement
data.
[0019] In some embodiments, the method further comprises receiving a signal
indicative of a change in a manufacturing process of the composite components,
and updating the statistical model to reflect the change.
[0020] In some embodiments of the method, the signal is indicative of a
maintenance of equipment used in the manufacturing process.
[0021] In some embodiments of the method, receiving deviation data for all of
the
regions of the at least one ply of at least a first composite component
comprises
receiving deviation data for a plurality of composite components, and wherein
mapping the performance indicators comprises mapping averaged performance
indicators for the plurality of composite components.
- 4 -
CA 02959599 2017-02-28
WO 2016/034993 PCT/IB2015/056511
[0022] In some embodiments of the method, the deviation data corresponds to
measurements of at least one of the fibers of a given region.
[0023] In accordance with another broad aspect, there is provided system for
determining a sampling plan for inspection of composite components, the
composite components each comprising at least one ply comprising a plurality
of
regions, each one of the regions having a plurality of fibers. The system
comprises
a memory, a processor, and at least one application stored in the memory and
executable by the processor. The application is executable for receiving
deviation
data for all of the regions of at least one ply of at least a first composite
component,
the deviation data corresponding to a deviation of a measured value from a
nominal value for a given fiber; applying a statistical model to the deviation
data to
obtain a performance indicator for each one of the regions and generating a
mapping of performance indicators for the at least one ply; and establishing
the
sampling plan for inspection of the at least one ply of at least one
subsequent
composite component as a function of the mapping of performance indicators.
[0024] In some embodiments of the system, establishing the sampling plan
comprises assigning a sampling criteria to each of the performance indicators,
the
sampling criteria being indicative of how many regions having a given
performance
indicator are to be inspected.
[0025] In some embodiments of the system, the sampling criteria is indicative
of
how many regions from one of the at least one ply, the at least one subsequent
composite component, and a plurality of subsequent composite components, are
to
be inspected.
[0026] In some embodiments of the system, establishing the sampling plan
comprises establishing a first sampling plan for a first ply as a function of
a first
sampling criteria, and establishing a second sampling plan for a second ply as
a
function of a second sampling criteria different from the first sampling
criteria.
- 5 -
CA 02959599 2017-02-28
WO 2016/034993 PCT/IB2015/056511
[0027] In some embodiments of the system, establishing the sampling plan
comprises establishing a first sampling plan for a first subsequent component
as a
function of a first sampling criteria, and establishing a second sampling plan
for a
second subsequent component as a function of a second sampling criteria
different
from the first sampling criteria.
[0028] In some embodiments of the system, establishing the sampling plan
further
comprises selecting regions for inspection as a function of the performance
indicators and the sampling criteria.
[0029] In some embodiments of the system, applying a statistical model
comprises
using at least three levels of performance indicators, the at least three
levels
comprising a lowest level of performance, an intermediate level of
performance,
and a highest level of performance.
[0030] In some embodiments of the system, selecting regions comprises
selecting
all regions of the lowest level and selecting some regions of the intermediate
level.
[0031] In some embodiments of the system, selecting regions comprises
selecting
a number of regions of the highest level that is less than a number of
selected
regions of the intermediate level.
[0032] In some embodiments of the system, the application is further
configured for
receiving updated deviation data of the selected regions from inspection of
the at
least one subsequent composite component; applying the statistical model to
the
updated deviation data of the selected regions to obtain updated performance
indicators for the selected regions; and generating an updated mapping of
performance indicators with the updated performance indicators.
[0033] In some embodiments of the system, the application is further
configured for
comparing the updated performance indicators of the selected regions with the
performance indicators for corresponding regions; selecting for inspection
regions
adjacent to a selected region for which the updated performance indicator is
lower
- 6 -
CA 02959599 2017-02-28
WO 2016/034993 PCT/IB2015/056511
than the performance indicator; receiving deviation data for the adjacent
regions;
and quantifying a degradation of a manufacturing process using the deviation
data
from the adjacent regions.
[0034] In some embodiments of the system, receiving deviation data comprises
receiving measurement data for at least one of the fibers of a region, for all
regions
of the at least one ply, and determining the deviation data from the
measurement
data.
[0035] In some embodiments of the system, the application is further
configured for
receiving a signal indicative of a change in a manufacturing process of the
composite components, and updating the statistical model to reflect the
change.
[0036] In some embodiments of the system, the signal is indicative of a
maintenance of equipment used in the manufacturing process.
[0037] In some embodiments of the system, receiving deviation data for all of
the
regions of the at least one ply of at least a first composite component
comprises
receiving deviation data for a plurality of composite components, and wherein
mapping the performance indicators comprises mapping averaged performance
indicators for the plurality of composite components.
[0038] In some embodiments of the system, the deviation data corresponds to
measurements of at least one of the fibers of a given region.
[0039] In accordance with yet another broad aspect, there is provided a
computer
readable medium having stored thereon program code executable by a processor
for determining a sampling plan for inspection of composite components, the
composite components each comprising at least one ply comprising a plurality
of
regions, each one of the regions having a plurality of fibers. The program
code is
executable for receiving deviation data for all of the regions of at least one
ply of at
least a first composite component, the deviation data corresponding to a
deviation
of a measured value from a nominal value for a given fiber; applying a
statistical
- 7 -
CA 02959599 2017-02-28
WO 2016/034993 PCT/IB2015/056511
model to the deviation data to obtain a performance indicator for each one of
the
regions and generating a mapping of performance indicators for the at least
one
ply; and establishing the sampling plan for inspection of the at least one ply
of at
least one subsequent composite component as a function of the mapping of
performance indicators.
[0040] In accordance with another broad aspect, there is provided a computer-
implemented method for guiding inspection of at least one ply of a composite
component. The method comprises receiving a mapping of performance indicators
and a sampling criteria associated with the at least one ply, each one of the
performance indicators corresponding to a region of the at least one ply, each
region comprising a plurality of fibers, the sampling criteria being
indicative of how
many regions having a given performance indicator are to be inspected;
selecting
regions of the at least one ply for inspection as a function of the
performance
indicators and the sampling criteria; and displaying on a graphical user
interface an
identification of selected regions of the at least one ply for inspection.
[00411 In some embodiments of the method, displaying on a graphical user
interface selected regions for inspection comprises displaying a graphical
identification of the selected regions of the at least one ply for inspection.
[0042] In some embodiments, the method further comprises receiving, via a user
actionable object on the graphical user interface, an indication that at least
one
selected region of the at least one ply for inspection has been inspected.
[0043] In accordance with yet another broad aspect, there is provided a
graphical
user interface for guiding inspection of a composite component having at least
a
first ply and a second ply. The graphical user interface comprises an
information
area displaying an identification of a first set of regions from the first
ply, selected
for inspection of the first ply; and an actionable object responsive to user
input for
receiving confirmation that the first set of regions have been inspected;
wherein
upon receipt of the confirmation, the information area is updated to display
an
- 8 -
CA 02959599 2017-02-28
WO 2016/034993 PCT/IB2015/056511
identification of a second set of regions from the second ply different from
the first
set of regions, selected for inspection of the second ply.
[0044] In some embodiments of the graphical user interface, the identification
of
the first set of regions comprises an identification of a first subset of
regions
associated with a first level of performance and a second subset of regions
associated with a second level of performance.
[0045] In some embodiments of the graphical user interface, the information
area
displaying the identification of the first set of regions comprises a
schematic
representation of a surface of the at least one ply segmented into a plurality
of
regions.
[0046] In some embodiments of the graphical user interface, the schematic
representation comprises a labelling in each one of the plurality of regions
corresponding to a performance indicator for the region.
BRIEF DESCRIPTION OF THE DRAWINGS
[0047] Further features and advantages of the present invention will become
apparent from the following detailed description, taken in combination with
the
appended drawings, in which:
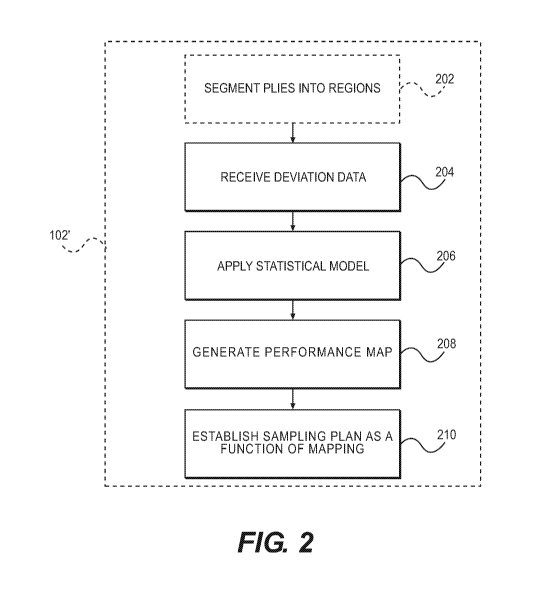
[0048] Fig. 1 is a flowchart of an exemplary inspection method;
[0049] Fig. 2 is a flowchart of an exemplary method for determining a sampling
plan;
[0050] Fig. 3a is a schematic of an exemplary performance map comprising two
performance levels;
[0051] Fig. 3b is a schematic of an exemplary performance map comprising three
performance levels;
- 9 -
CA 02959599 2017-02-28
WO 2016/034993 PCT/1B2015/056511
[0052] Fig. 4 is a flowchart of another exemplary method for determining a
sampling plan, including a feedback mechanism to update the sampling plan;
[0053] Fig. 5 is a flowchart of another exemplary method for determining a
sampling plan, including a degradation analysis;
[0054] Fig. 6 is a flowchart of another exemplary method for determining a
sampling plan, including a statistical validation;
[0055] Fig. 7 is a flowchart of an exemplary method for guiding inspection of
a
composite component;
[0056] Fig. 8a is an exemplary graphical user interface for guiding inspection
of a
composite component;
[0057] Fig. 8b is another exemplary graphical user interface with a schematic
representation of a ply of a composite component;
[0058] Fig. 9 is a diagram of an exemplary system for determining a sampling
plan
in a network,
[0059] Fig. 10 is a block diagram of a set of exemplary applications running
on the
processor of the system of figure 9;
[0060] Fig. 11 is a block diagram of an exemplary sampling plan module:
[0061] Fig. 12 is a block diagram of an exemplary degradation analysis module;
and
[0062] Fig. 13 is a block diagram of an exemplary statistical validation
module.
[0063] It will be noted that throughout the appended drawings, like features
are
identified by like reference numerals.
-10-
CA 02959599 2017-02-28
WO 2016/034993 PCT/IB2015/056511
DETAILED DESCRIPTION
[0064] Composite components (or materials) are made from two or more
constituent materials with significantly different physical or chemical
properties.
When combined, they produce a component with characteristics different from
the
individual materials, with the aim of using the benefit of both. Automated
Fiber
Placement (AFP) machines are used for the manufacture of such composite
components, by laying fiber strips (tows) along a mold in multiple layers in
order to
create a composite component having the shape of the mold. The fiber strips
are
placed along the mold in accordance with fiber laying trajectories that are
input into
the AFP machine to create a given component in accordance with a set of design
parameters.
[0065] Referring to figure 1, an exemplary method for inspecting a composite
component manufactured using an automated manufacturing process will be
described. For illustrative purposes, the process described is an Automated
Fiber
Placement (AFP) process. The composite component may comprise various
materials, such as but not limited to cements, concrete, reinforced plastics,
metal
composites and ceramic composites. For example, the composite component may
be composed of composite fiber-reinforced plastics. The composite component
may be used for various applications, including but not limited to buildings,
bridges,
spacecrafts, aircrafts, watercrafts, land vehicles including railway vehicles,
and
structures such as wind turbine blades, swimming pool panels, bathtubs,
storage
tanks, and counter tops.
[0066] Figure 1 illustrates a dynamic method for performing sampling
inspection.
The component comprises multiple plies and each ply may be inspected
separately. Each ply comprises multiple fibers (or tows). In a first step, a
sampling
plan is determined 102 using a statistical analysis of at least one component.
Inspection of subsequent components is then guided 104 using the sampling
plan.
Results from the inspection may be used to update and/or modify the sampling
plan 102 in a feedback loop.
-11 -
CA 02959599 2017-02-28
WO 2016/034993 PCT/IB2015/056511
[0067] Turning to figure 2, there is illustrated a first embodiment 102' for
determining a sampling plan. The sampling plan may be established for the
examination of a single ply one or more components or a plurality of plies of
one or
more components. The example herein illustrates applying the method to each
ply
of a composite component. Each ply of the composite component is segmented
into a plurality of regions 202, each region comprising a subset of the
fibers. The
regions may be of a uniform shape, such as squares, rectangles, or circles,
and
may be of a same size. Alternatively, the regions may be of varying shapes
and/or
varying sizes. The shapes may be symmetrical, non-symmetrical, uniform, or non-
uniform. Segmentation may be performed as a function of one or more
characteristics of the composite component, using one or more considerations,
such as the shape and/or design of the component. Alternatively, the size of
the
composite component is considered and segmentation is performed as a function
of a desired number of regions of a desired size. In some embodiments, regions
are bands that stretch across the component and each region is set to comprise
a
given number of fibers. For example, a component having 42 plies may have 100
bands per ply, and 16 fibers per band. As the layout of fibers may change from
ply
to ply, so may the segmenting of regions thereon. Other segmenting strategies
will
be readily understood by those skilled in the art.
[0068] In some embodiments, the plies have already been segmented and the
method begins when deviation data is received 204 for all regions of a ply of
at
least one composite component. Alternatively, the deviation data may be
received
for all regions of all plies of at least one composite component. Deviation
data
corresponds to the deviation of a measured value from a nominal value for a
given
fiber. For each region, at least one fiber is measured and the difference
between
the measured value and the nominal value corresponds to a deviation value. The
deviation data is thus the set of deviation values for all regions of the ply.
In some
embodiments, receiving deviation data 204 comprises receiving measurement data
of the measured fibers and determining the deviation data from the measurement
data. In some embodiments, only a subset of the fibers of each region are
- 12-
CA 02959599 2017-02-28
WO 2016/034993 PCT/IB2015/056511
measured in order to obtain the deviation data. For example, one in four
fibers or
one in three fibers of a region are measured. In other embodiments, all of the
fibers
of each region are measured. A greater number of fibers measured per region
will
provide a higher reliability for the sampling plan. Higher reliability may
also be
obtained by using more than one component to establish the sampling plan, such
as two or three components, with the results being averaged together.
[0069] Once the deviation data is received 204, a statistical model is applied
206 to
the data. In some embodiments, applying a statistical model comprises
generating
a histogram from the deviation data and applying a Gaussian function to obtain
a
normal distribution. The normal distribution may be used to determine
statistically
the probability that the dimensional measurements of an unacceptable number of
fibers within a given region will fall outside of a desired tolerance. This
probability
may then be used as a performance indicator. For example, the performance
indicator may be whether the probability falls above or below a given
threshold. In
this example, two performance levels are provided, namely regions having a
probability below the threshold are said to be compliant and regions having a
probability above the threshold are said to be non-compliant. The threshold
may be
set to any desired level, such as 5%, 1%, 0.25%, etc. In some embodiments, the
threshold is set to 0.27%. In another example, a process performance index
such
as Po< from Six Sigma quality methodology is used as a performance indicator.
The
process performance index may be compared to a threshold, such as 1.00 or 0.8,
and values falling below the threshold are said to be non-compliant while
values
equal to or above the threshold are said to be compliant. Other known
performance
indicators may be used to represent the statistical probabilities generated by
the
normal distribution.
[0070] A performance map may be generated 208 using the performance
indicators. The performance map correlates each region of a ply with its
associated
performance level. In some embodiments, the performance map may replicate the
surface topography of a ply with each region identified according to its
performance
-13-
CA 02959599 2017-02-28
WO 2016/034993 PCT/IB2015/056511
level. Figures 3a and 3b are examples of performance maps 302', 302" using two
and three performance levels, respectively. In this example, the regions are
color-
coded according to their performance levels. In figure 3a, the performance map
302' comprises light gray regions 304a that are compliant and black regions
304c
that are non-compliant. White regions 304b are areas of the ply without any
fibers.
In figure 3b, the performance map 302" also comprises dark gray regions 304d
that are passable or intermediate. Passable regions 304d are regions that fall
within a narrow quality level that is close to being compliant but not quite.
For
example, using a percentage criteria as a performance indicator, the
performance
map 302" may correspond to the following:
Performance
Region
indicator (PI)
Light gray PI <0.27%
Dark gray 0.27% < PI < 1.6%
Black PI > 1.6%
TABLE 1
[0071] Referring back to figure 2, once the performance map has been generated
208, the sampling plan is established 210 as a function of the mapping of
performance indicators. In some embodiments, establishing the sampling plan
210
comprises assigning a sampling criteria to each of the performance indicators.
The
sampling criteria is indicative of how many regions of one or more plies from
one or
more subsequent components having a given performance indicator are to be
inspected. In some embodiments, the sampling criteria corresponds to a given
percentage of regions having a given performance indicator. For example, using
the example from table 1, the sampling criteria may be set to 100% of the
black
- 14-
CA 02959599 2017-02-28
WO 2016/034993 PCT/IB2015/056511
regions, 50% of the dark gray regions, and 0% of the light gray regions for a
ply of
a subsequent component. In some embodiments, a small sampling of the light
gray
regions may be selected for inspection, such as 7%. Other sampling criteria
may
also be used. In addition, the sampling criteria may comprise a combination of
a
plurality of criterion, such as 50% of the dark regions of a ply of a
subsequent
component, at least 10% of the 50% not having been inspected in a
corresponding
ply of a previous component. In another example, the sampling criteria may
refer to
50% of the dark gray regions of a ply, at least 5% of the 50% being adjacent
to a
black region. Various factors may be used as sampling criteria, such as
proximity
to an edge, known problematic areas on a component, etc.
[0072] The sampling criteria may refer to a number of regions to be inspected
from
a single ply, a plurality of plies, an entire component, or a plurality of
components.
For example, the sampling criteria may be set to 50% of the dark gray regions
of
every set of two plies. This means that if there are 10 dark gray regions on a
first
ply and 8 dark grey regions on a second ply, then 50% of the 18 dark gray
regions,
i.e. 9 dark gray regions, are to be inspected. The 50% may be broken down in
various ways, such as 4 on the first ply and 5 on the second ply, or 6 and 3,
etc.
Similarly, if the sampling criteria is applicable to an entire component, then
50% of
the dark grey regions from all of the plies of the component are to be
inspected,
whereby the sum of the number of inspected regions from each ply corresponds
to
50% of the total number of dark grey regions for the component. The sampling
criteria may be constant for all plies of a component or it may vary from ply
to ply.
The sampling criteria may be constant for a plurality of components or it may
vary
from component to component. Therefore, establishing a sampling plan may
comprise establishing different sampling plans for different plies.
[0073] In some embodiments, establishing the sampling plan 210 also comprises
selecting regions for inspection as a function of the performance indicators
and the
sampling criteria. This selection may be performed randomly within the
parameters
of the sampling criteria, or it may be performed non-randomly. An example of
-15-
CA 02959599 2017-02-28
WO 2016/034993 PCT/IB2015/056511
random selection comprises choosing any one of the 18 dark gray regions of a
ply
in order to meet the sampling criteria of 50% of dark regions of the ply. An
example
of non-random selection comprises a targeted selection from among the 18 dark
gray regions, whether the targeted selection is performed automatically or
manually. The random selection may also be performed automatically or
manually.
Various selection algorithms may be devised to select the regions as a
function of
the performance indicators and the sampling criteria. It may be desired to
maintain
a constant sampling criteria, such as 50% of the dark gray regions, while
ensuring
that different ones of the dark grey regions are inspected on consecutive
plies or
consecutive components. The selection algorithm may be applied to different
quantities of regions, such as 7%, 59%, 81%, etc., and to any one of plies,
components, and batches of components.
[0074] Once established, the sampling plan for a given ply or plurality of
plies may
be used to inspect corresponding plies of one or more subsequent components.
Only selected regions of subsequent components are inspected, as per the
sampling plan. Regions that are inspected and do not meet the required
tolerances
may be repaired. Repaired regions may be measured again and used to update
the sampling plan. This embodiment 102" is illustrated in figure 4, whereby
updated deviation data 212 is received and a new statistical model is applied
206
to the updated deviation data to obtain updated performance indicators for the
repaired regions. An updated performance map may be generated 208 with the
updated performance indicators.
[0075] In some embodiments, the feedback loop may be used early on in the
inspection process to validate the performance map. For example, if one or
more
regions from the map are labeled as compliant but once measured they are found
to be non-compliant, this may be an indication that not enough components were
used to generate the initial performance map and the performance map may need
to be updated or regenerated using more components. Similarly, if one or more
regions from the map are labeled as non-compliant but once measured they are
- 16-
CA 02959599 2017-02-28
WO 2016/034993 PCT/IB2015/056511
found to be compliant, the performance map may be updated accordingly in order
to properly reflect the set of components.
[0076] In some embodiments, the feedback loop may be used to ensure that the
fabrication process is not degrading. Process degradation sometimes occurs
when
equipment used in automated fabrication processes become decalibrated over
time or due to a repair or modification made to the robot. Figure 5
illustrates an
exemplary embodiment 102" of determining a sampling plan which includes
performing a degradation analysis 300. tAihen a new statistical model is
applied to
updated deviation data, the updated performance indicators may be compared to
the original performance indicators 302. An analysis of variance (ANOVA) may
be
used to perform the comparison using multiple statistical models. If the
comparison
shows that a performance level of a given region has decreased, this may be an
indication of process degradation. Regions adjacent to the region having a
decreased performance level may be selected for inspection 304. Deviation data
for the adjacent regions are received 306 and used to quantify the degradation
of
the manufacturing process 308. In some embodiments, an alarm may be triggered
when the process degradation reaches a predetermined threshold.
[0077] If the fabrication process is interrupted for any reason, such as for
maintenance or repair of the equipment, it may be useful to perform a
statistical
validation to ensure that the previously applied statistical model is still
valid. Figure
6 illustrates an exemplary embodiment 102'"' of determining a sampling plan
which
includes performing a statistical validation 400. A process modification
signal is
received to indicate that an event has occurred, causing a possible change in
the
process. A determination is made as to whether the statistical model is
affected by
the event 404. This determination may be done, for example, by comparing a
statistical model for a new set of deviation data to the statistical model of
a
previous set of deviation data. If an equivalence analysis shows that the
statistical
models are not sufficiently similar, the previous performance map may be
replaced
with a new performance map using an updated statistical model 406. In some
- 17-
CA 02959599 2017-02-28
WO 2016/034993 PCT/IB2015/056511
embodiments, the statistical model is automatically updated using a new set of
deviation data as soon as the process modification signal is received 402,
without
performing a comparison.
[0078] Although illustrated separately, in some embodiments the method of
determining a sampling plan 102 comprises both the degradation analysis 300
and
the statistical validation 400.
[0079] Figure 7 is a flowchart of an exemplary method for guiding inspection
of at
least one ply of a composite component 104. In a first step 502, a mapping of
performance indicators and corresponding sampling criteria are received for
the at
least one ply. From the received data, regions for inspection may be selected
504.
More specifically, an algorithm may be applied to the mapping and the sampling
criteria in order to generate an identification of selected regions. The
selected
regions for inspection of the at least one ply are then displayed on a
graphical user
interface (GUI). In some embodiments, displaying selected regions for
inspection
comprises displaying a graphical identification of the selected regions.
Alternatively, the selected regions may be identified using a coordinate
system that
is mapped onto the surface of a ply. The method may also comprise receiving,
via
a user actionable object on the GUI, an indication that the selected regions
for
inspection have been inspected. In some embodiments, this may cause the GUI to
update the display to provide further information, either for continued
inspection of
a same ply or for inspection of a subsequent ply or a subsequent component.
[0080] Referring to figure 8a, there is illustrated an exemplary embodiment of
a
GUI 602 for guiding inspection of the composite component. The GUI 602
comprises an information area 604 for displaying an identification of one or
more
selected regions for inspection. In this example, a text box 608 is provided
for
displaying one or more selected region(s) for inspection, using some form of
region
identifier. An actionable object 606 is also provided. The actionable object
606 is
any graphical control element that invokes an action when activated by a user.
It is
selectable by a user for providing confirmation that the selected region(s) of
a
-18-
CA 02959599 2017-02-28
WO 2016/034993 PCT/IB2015/056511
given ply identified in information area 604 have been inspected. The
actionable
object 606 may take various forms, such as a button, a slider, an icon, a list
box, a
spinner, a drop-down list, a link, a tab, a scroll bar, and/or any combination
thereof.
In this example, the actionable object 606 comprises two elements, a "next"
button
610 to confirm that the region(s) displayed in the text box 608 has/have been
inspected and a "done" button 612 to confirm that inspection is complete or
that all
regions of a ply/component/batch have been inspected. Actuation of the "next"
button 610, may be operative for causing the text box 608 to display a
subsequent
region or, in the case where all the selected regions of a given ply are
displayed
simultaneously, to display the selected regions of a subsequent ply. More or
less
elements may be used for the actionable object 606.
[0081] Another embodiment for the GUI 602 is illustrated in figure 8b. In this
example, the information area 604 is provided with a schematic representation
600
of a surface of a ply segmented into a plurality of regions. Each region is
identified
with a performance level, which in this case is a shading in a square
representing a
region, but could be another visual cue. In addition to, or instead of, the
text box
608 with the selected region(s) for inspection identified, a graphical element
618 is
used to represent the selected region(s) of a ply that is/are to be currently
inspected. Alternatively, all regions from the ply that are to be inspected
may be
concurrently identified with a graphical element 618 and the text box 608 is
used to
simultaneously or sequentially display the regions that are to be inspected. A
"next
region" button 613 may be used to cause the textbox 608 to display a next
region
to inspect, in the case where the regions are identified sequentially. A "next
ply"
614 button may be used to update the information area with selected regions
for a
next ply. A "next component" 616 button may be used to update the information
area with the selected regions for inspection of a subsequent component.
[0082] Additional information may be provided in the information area 604 of
the
GUI 602. For example, the performance indicators themselves may be provided in
a legend format next to the schematic representation of the ply. The sampling
-19-
CA 02959599 2017-02-28
WO 2016/034993 PCT/IB2015/056511
criteria associated with each level of performance indicator may also be
provided.
Identification data for the ply and/or component and/or batch under inspection
may
be provided.
[0083] In some embodiments, the method of determining a sampling plan 102 is
used in combination with the method for guiding inspection of a composite
component. For example, deviation data is received for all of the regions of
at least
one ply 204, a statistical model is applied to the deviation data 206 and a
performance map is generated 208. A sampling plan is established as a function
of
the mapping 210. The method may further comprise assigning sampling criteria
to
each of the performance indicators. The sampling plan, which comprises the
mapping of performance indicators and the sampling criteria, is received 502
and
regions for inspection are selected 504. The selected regions are displayed on
the
GUI 506. The two methods may be performed by a same entity or by separate
entities, as will be explained in more detail below.
[0084] Figure 9 illustrates an exemplary system 701 for determining a sampling
plan for composite component inspection. In the embodiment illustrated, the
system 701 is adapted to be accessed by a plurality of devices 710 via a
wireless
network 708, such as the Internet, a cellular network, Wi-Fi, or others known
to
those skilled in the art. The devices 710 may comprise any device, such as a
laptop computer, a personal digital assistant (PDA), a smartphone, or the
like,
adapted to communicate over the wireless network 708. Alternatively, the
system
701 may be provided in part or in its entirety directly on devices 710, as a
native
application or a web application. It should be understood that cloud computing
may
also be used such that the system 701 is provided partially or entirely in the
cloud.
In some embodiments, the application 706a may be downloaded directly onto
devices 710 and application 706n communicates with application 706a via the
network 708.
[0085] The system 701 may reside on one or more server(s) 700. For example, a
series of servers corresponding to a web server, an application server, and a
- 20 -
CA 02959599 2017-02-28
WO 2016/034993 PCT/IB2015/056511
database server may be used. These servers are all represented by server 700
in
Figure 9. The system 701 may comprise, amongst other things, a processor 704
in
data communication with a memory 702 and having a plurality of applications
706a, ..., 706n running thereon. The processor 704 may access the memory 702
to retrieve data. The processor 704 may be any device that can perform
operations
on data. Examples are a central processing unit (CPU), a microprocessor, and a
front-end processor. The applications 706a, ..., 706n are coupled to the
processor
704 and configured to perform various tasks as explained below in more detail.
It
should be understood that while the applications 706a, 706n
presented herein
are illustrated and described as separate entities, they may be combined or
separated in a variety of ways. It should be understood that an operating
system
(not shown) may be used as an intermediary between the processor 704 and the
applications 706a,..., 706n.
[0086] The memory 702 accessible by the processor 704 may receive and store
data, such as deviation data, deviation values, measurement values,
statistical
models, performance indicators, performance maps, etc. The memory 702 may be
a main memory, such as a high speed Random Access Memory (RAM), or an
auxiliary storage unit, such as a hard disk or flash memory. The memory 702
may
be any other type of memory, such as a Read-Only Memory (ROM), Erasable
Programmable Read-Only Memory (EPROM), or optical storage media such as a
videodisc and a compact disc.
[0087] One or more databases 712 may be integrated directly into the memory
702
or may be provided separately therefrom and remotely from the server 700 (as
illustrated). In the case of a remote access to the databases 712, access may
occur via any type of network 708, as indicated above. The databases 712 may
also be accessed through an alternative wireless network or through a wired
connection. The databases 712 described herein may be provided as collections
of
data or information organized for rapid search and retrieval by a computer.
The
databases 712 may be structured to facilitate storage, retrieval,
modification, and
-21 -
CA 02959599 2017-02-28
WO 2016/034993 PCT/IB2015/056511
deletion of data in conjunction with various data-processing operations. The
databases 712 may consist of a file or sets of files that can be broken down
into
records, each of which consists of one or more fields. Database information
may
be retrieved through queries using keywords and sorting commands, in order to
rapidly search, rearrange, group, and select the field. The databases 712 may
be
any organization of data on a data storage medium, such as one or more
servers.
[0088] In one embodiment, the databases 712 are secure web servers and
Hypertext Transport Protocol Secure (HTTPS) capable of supporting Transport
Layer Security (TLS), which is a protocol used for access to the data.
Communications to and from the secure web servers may be secured using
Secure Sockets Layer (SSL). Alternatively, any known communication protocols
that enable devices within a computer network to exchange information may be
used. Examples of protocols are as follows: IP (Internet Protocol), UDP (User
Datagram Protocol), TOP (Transmission Control Protocol), DHCP (Dynamic Host
Configuration Protocol), HTTP (Hypertext Transfer Protocol), FTP (File
Transfer
Protocol), Telnet (Telnet Remote Protocol), SSH (Secure Shell Remote
Protocol).
[0089] Referring now to figure 10, there is illustrated an exemplary block
diagram of
application 706a, for determining a sampling plan for composite component
inspection. A sampling plan module 804 receives deviation data and outputs
selected regions for inspection. The sampling plan module 804 may also
exchange
data with a statistical validation module 802 and/or a degradation analysis
module
806, which may form part of the system 701 but be separate from application
706a,
as illustrated. Alternatively, the statistical validation module 802 and/or a
degradation analysis module 806 may form part of application 706a. Also
alternatively, the statistical validation module 802 and/or a degradation
analysis
module 806 may be remote from system 701, and data may be exchanged via
network 708.
[0090] Figure 11 illustrates an exemplary embodiment of the sampling plan
module
804. A segmenting module 902 is configured to segment each one of the plies
into
- 22 -
CA 02959599 2017-02-28
WO 2016/034993 PCT/IB2015/056511
a plurality of regions, each region comprising a subset of the fibers of a
ply. A
statistical modelling module 904 is configured to receive deviation data and
apply a
statistical model thereto to obtain a performance indicator for each region of
a ply.
A performance mapping module 906 generates a mapping of performance
indicators for all regions of a ply. A region selection module 908 selects
regions of
each ply for inspection as a function of the performance indicators in
accordance
with a sampling criteria. The selected regions may be output by the sampling
plan
module 804. Alternatively, the selected regions may be provided to a GUI
module
910 configured to display on a graphical user interface the selected regions
for
inspection. The GUI module 910 may also be provided separately from the
sampling plan module 804, as a separate application 706b running on processor
704 or remotely therefrom.
[0091] In some embodiments, the statistical modelling module 904 receives
measurement data and is configured to determine deviation data from the
measurement data by comparing the measurement data to nominal data. The
nominal data may be stored in the memory 702 or in the remote databases 712.
[0092] In some embodiments, the sampling plan module 804 is configured to
receive deviation data from a plurality of components and generate a
performance
map resulting from averaged performance indicators.
[0093] In some embodiments, the statistical modelling module 904 receives
updated deviation data from the inspection of the selected regions and applies
the
statistical model to the updated deviation data to obtain updated performance
indicators for the selected regions. The performance mapping module 906 is
configured to generate an updated mapping of performance indicators with the
updated performance indicators.
[0094] Figure 12 is an exemplary embodiment of the degradation analysis module
806, for monitoring and quantifying a degradation of the manufacturing
process. A
comparison module 1002 is configured to receive updated performance indicators
- 23 -
CA 02959599 2017-02-28
WO 2016/034993 PCT/IB2015/056511
for selected regions and compare them with the previous performance
indicators. If
the comparison shows a decrease in performance for a given region, the region
selection module 908 is instructed to select for inspection regions adjacent
to the
region having a decreased performance. The deviation data for the adjacent
regions is received by a degradation quantification module 1006 and used to
quantify the degradation, which is output by the degradation analysis module
806.
In some embodiments, the degradation quantification module 1006 may be
configured to trigger an alarm if the process degrades beyond a predetermined
threshold.
[0095] Figure 13 is an exemplary embodiment of the statistical validation
module
802, for validating the statistical model applied to the deviation data in
case of an
event occurring within the fabrication process. The statistical validation
module 802
may comprise a modification analysis module 1102 configured to receive a
signal
indicative of the occurrence of an event, such as a repair or maintenance of
equipment used in the manufacturing process. In some embodiments, the
modification analysis module 1102 performs a comparison between a new
statistical model based on updated deviation data and a previous statistical
model.
A signal is sent to the statistical modelling module 904 in case of a
discrepancy
between the two models in order to reset the sampling plan module 804. The
modification analysis module 1102 may also be configured to automatically send
a
signal to the statistical modelling module 904 when a signal indicative of the
occurrence of an event is received.
[0096] While illustrated in the block diagrams as groups of discrete
components
communicating with each other via distinct data signal connections, it will be
understood by those skilled in the art that the present embodiments are
provided
by a combination of hardware and software components, with some components
being implemented by a given function or operation of a hardware or software
system, and many of the data paths illustrated being implemented by data
communication within a computer application or operating system. The
statistical
- 24 -
CA 02959599 2017-02-28
WO 2016/034993 PCT/IB2015/056511
validation module 802, the sampling plan module 804, and the degradation
analysis module 806 may share hardware and/or software resources. The
structure
illustrated is thus provided for efficiency of teaching the present
embodiment.
[0097] It should be noted that the present invention can be carried out as a
method,
can be embodied in a system, or can be provided on a computer readable medium
having stored thereon program code executable by a processor. The embodiments
of the invention described above are intended to be exemplary only. The scope
of
the invention is therefore intended to be limited solely by the scope of the
appended claims.
- 25 -