Note: Descriptions are shown in the official language in which they were submitted.
CA 02961194 2017-03-13
WO 2016/040883 PCT/US2015/049814
SELF-CALI1RAT1NG CONTACTLESS POWER CONSUMPTION SENSING
CROSS-REFERENCE TO RELATED APPLICATIONS
[00011 This application claims priority to U.S Patent Application No,
14/485424,.
filed Septenter :12, 201 4õ.. and which. iS (1) a: :coutinuation-in-part of
(..j.& Patent
Application N. 12/567,56.41iled Stptember.:25, 2009, and (2):A continuation4ri-
part
of Patent Application No_ 14/45. 7$1.32,, fie d Angust 1.:1õ 2014,
ivhich is a
:application of U.S. .Potont Application. No 31115,77.0; filed Slily 1.õ. 20 1
1,
4'.1.1i:C1ì is a continuation-in,part of 11/JS. Patent ApplicatiOn No.
12/567:i561, filed
September 25õ 2009, and claims the benefit of
:Provisional Application NO..
0.1.118.0,,L74, filed September 3_ 2014.), a rid. U.S. :ProviSional
Application No,.
61/30i,290, fiSIe.tI July.2., 2010, LLS. Patent Application
ISlos.12/56750.:1õ113.175,170,
144457,032, and 14/485,424 .and U.S. Provisional .Application Not'.
6.1/380,174 and
01130 ,29. . are incorporated. herein by reference in their entirety-.
TECHNICAL FIELD
[0002] This disc lostire relate's generally to .sensing electric powt.
COnsuitiption, .and
relates Imre particularly to self-calibrating,,,00ntactless power consumption
sensing,
BACK:GROUND
[0003] Energy conservation and eco'kedback research cOntinues .to be. a
focus in the
Ubiquitom Computing (1.1bicomp) and Human-Computer Interaction .(HCI)
toinmunitieS. G.-in.fiw.:28% 0 f
enagY eonstunption is directly. contributed by
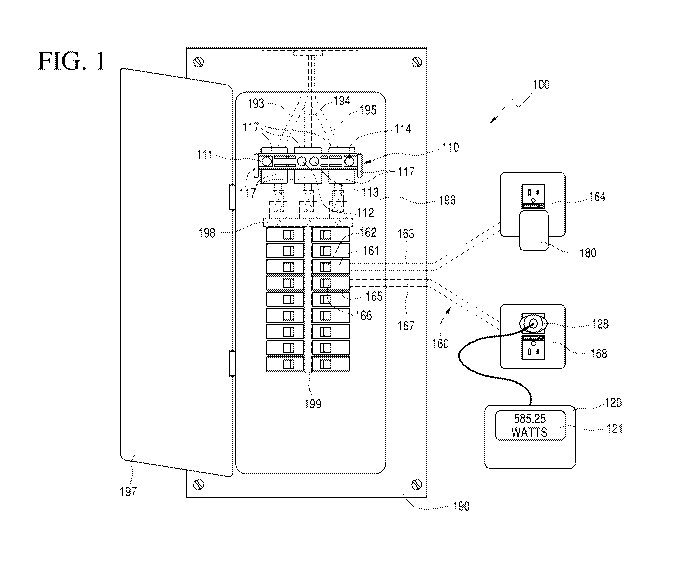
household activitieS, the home'iS'a natural place to study: Yet obtaining
whole-home
power consumption information in real-tin-le by homeowners or
==even.te40archers.::can
be a: a.allonging task. For itistatee,:tertaiwsmart metemprovide data. at 15
minutes:
intervals, yet gaining access (o that information can be difficult due to
closed-source
and often .private protocols and application interfaces_ One common approach
is to
install commercially :available current tramformers: (eTs) inside the 'breaker
panel.
Safely installing CTS., however, requires hiring a trained .ellectrician
iromiyes
4.....sens.or..around the main .eloctrical feed in.. the bro.Ur panel. .Most
rese.archers and homeowners do not have the training or confidence=:to do such
an.
installation. In fact, the .National. Electric Code (NEC) has strict tules= On
the
CA 02961194 2017-03-13
WO 2016/040883 PCT/US2015/049814
requirement of professional installation of CT& En addition, certain :states
in the
United States altogether prohibit CTs from being installed inSide the breaker
panel, in
which case an alternative is to use an expenStO pass-through Meter, The pass-
through meter requires involvement of the utility company, as an end-user
cannot
tamper with or alter the installation of an electricity meter,
BRIEF DESCRIPTION OF THE DRAWINGS:
[0004] To facilitate further description of the embodiments, the following
drawlogs
are provided in which:
[0005] FIG. 1 illustrates a view of an exemplary system attached to a
circuit breaker
and electrical power infrastructure ofa structure, *cording to a
firstembodiment;
[0006] FIG, ustrates a block diagram of the system of FIG. ;
[0007] FlI.G. 3 illustrates a block diagram an exemplary system, according
to a second
enibodiment
[0008] FIG. 4 illustrateS an exemplary graph of a function, which can be
derived by
placing a predicted function a region orate funetion, according: to.:an
embodiment;
[0009] FIG. 5 illustrates an exemplary :graph of a function, ac cOrding to
an
embodiment;
[0010] FIG. 6 illustrates :an exemplary graph of a ftinction, wording to
an
embodiment;
[001 ] FIG. 7 alustrateS an exemplary graph of a function, according to an
embod i m erg;
[00.12] FIG, :8 (top) illustrates an exemplary graph of magnetic flux tbr
output signals
generated by magnetic field SenSOrS and FIG. $: (bottom) illustrateS an
exemplary
graph of a corresponding predicted current wavetbtni through one leg;
[0013] FIG. 9 (top) illustrates an exemplary graph of a predicted current
waveform
and a -measured voltage waveform, and FIG, 9 (boa(*) illustrates an exemplary
graph
CA 02961194 2017-03-13
WO 2016/040883 PCT/US2015/049814
of magnetic flux for output signals venerated by magnetic field sensors that
were used
to predict the current \vavetbrm;
[001.4] Fr(J.õ 1) (lop) illustrates au exeoplary graph p.f a predicted
current waveform
and a measured voltage waveform, and FIG, 10 (bottom) illustrates an
:exemplary
graph of ma:pc-tie flux tbr output signals generated by :magnetic -field
sensorS that
were. used to predict the current waveform.;.
[0015] FIG, L 1 illustrates =exemplary graphs sliowing: a transfer
function and its:
decomposed elements;
[0016] FIG, 12 illustrates a view of the system of FIG, 1 attached to
circuit breaker
and electrical power infrastructure, showing various sensor placement 1,-
)psitiOns;
[0017] P1 G. illustrates:a flow-chart for a method of:sensing
electrical power being
provided to a structure using....a sensing 40.000,. a. calibration
deViCe.,:and one or more
processing "nodules, according to another embodiment;
[0018] FIG: 14 illustrates a flow chart for a method of training- the
neural network
model upon Sensing the triggering event, according to the embodiMent of Fla
L3c.
[0019] FIG, 1:5 illustrates a flow chart for.aSensiag electrical poWer
being provided. to.
a strUCtine using a Sensitig:.de-vice., a calibration &Viet, and one or
iTiOn." processing
modules,. according to another embodiment;
[0020] FIG, 16 illustrat a front: elevational view of a computer. system
that is
suitable for implementing an ernboditnent of the SySterit. of :FIGs. I-3;Hand
[0021] FIG. 17 illustrates a represemative Wel( diagram of an .example Of
the
elments included in the circuit boards inside a chassis of the computer
:system of
'FIG, 16,
[0922] For. simplicity and clarity of illustration. the drawing figures
illustrate the.
general manner of construction, and descriptions and details of well-known
features:
and techniques may be omitted to; :avoid unnecessarily obscuring the present
disclosure.. Additionally, elements in. the drawing figures are TIOt
necessarily drawn .1;6
scale. _ For eXample, the dimensiOns of some, of the elements in the figures
may. be:
3
CA 02961194 2017-03-13
WO 2016/040883 PCT/US2015/049814
exaggerated relative to other e.Ieinents to help improve understanding of
embodiments
of the present disclosure. The same reference numerals in different figures
denote the
same elements.
[002.3] The
terms ilirst," "second," "third," "fourth," and the like in the description
and in the claims, if ay_ are'used for distinguishing betWeen similar elements
and not
necCSSOily for describing :Patticulat Sequential or ChrOnological order it is
to be
understood that the tetms :so used are interchangeable under appropriate
circumstances such that the embodiments described herein are, for example,
capable
of operation in sequences other than those ilhistrated or otherwiSe described
herein:.
Furthermore, the terms "include," and "have,;" and any variations thereof, are
intended
to cover a non-exclusive inclusion, =such that a process, =method., system,
article,.
devite. or apparatus that comprises a list of elementS
necessarily limited to:
those elements, but 030y include other elements not dXpt.0$1y listed or
inherent to
such process, method, :systein, article, device, or apparatus,
[0024] The
ternis "la," "right," ''front," "back," "tOp,"'bottom" +.sOVer.;" under:'
and the like. ill the description and. in the claim* if any, are use for
descripxive
purposes and not necessarily tr describing permanent relative positions It. is
::t.0 be
understood that the terms so: used are interchaOseable under. appropriate
Circumstances:snch. that the embodimems of the apOaratus, method's, andlor
artielcS of
manufacture &scribed herein are. r
.example,: capable of operation in other
orientations than those illustrated or otherwise described herein,
[00251 The
terms "couple," "Coupled," "Couples," "Couplin&" and the like should be
broadly -understOod and refer to. f,(73111.1eCtiOg two or more elements
mechanically and ot
otherwise, Two:or :more electrical elements 914: be electrically toup led
together, but
not be mechanically or otherwise= coupled together. Coupling may be for any
length
of time, e.g., permanent or serni-permanent or otily for an instant.
"Electrical
coupling" atIci the like should be broadly understood and include electrical
coupling of
all types. The absente::of the wotd -removably,' "temovable:;"E:and the tike
near the
word "coupled:' and the like= does not mean that the coupling, etc. in
question is or is=
not removable,: c.Mechanical. coupling." and the like should be broadly
understood and
include :Mechanical coupling Of all typOs.
4
'oorAop f4usuos
uJoij pamaiw. suraiFqs mdmo aloto JO Otte i)111 1333dUl IIpasug
'put
JOAD troptnOt poldno3 s! aolAop 3.u!suos NI Intim .0";1!sn nmod pappl:nto
awurniop parnfippo itï.N Imo sampow z31ïrsfpoold aJoeu auo puud
ail p3tpEUE
51 aorAop tit11ti.U3S 0E41 [1.014M Oirt13n11sttjulAmod .11-131.11001.0 3t11.
O8outi
iroplopto trwuJ afoul .10 ado m41 ol paldp00: ict1C0f$i0 ;10.: 41.1C0p13[0
iltrrogi Ulla: iip UISt5
111 111 0.9 SIVAS.
MCIP10 ".10011 10 O. D)
14.11.12100...Wpipow di*Ooold 'wow JO otto opnys-mt
utO latrod tualsAS:t1L l!trn peoi apnimq UL TAp uouvJgrrpn -
,matonlis
Jo 0111131111Saljti! .1.0M0d inpy.)013 XV 01 pOl1rI00 at 01
paltdigtf011
301Aop porwiwitIzt opplow OSil?
UTMS.SS Otti -wstrs pprj orlowAlar '.1.or4 Jo puo
*3!Aziplu!stra. au ,Ciddns
.14AVOCI [V,Via010 liTrakitrotur Jo ouo NI Jo
Ind 14001:
2 Tvji0 *Pq JqtaJg 1!11.?41 P. gip iond pzigaulw
q ol poitlfITUO3
Ok..!40p: 0.t.11StIOS apnpu1 kon u1Äa:t$4. a,-
Irtlatuis jo ampruisuljul lomod
wapp4to .1(11
:souo, rthitIS 10mOd Inp04.to Tutu aJout _to ;Ivo pm, N-(7.$q 13)Tezu4
t.3J1: t pipw- t1133 0.111131:1:11S Ota '0.1111:111,45 Vij.0 0g11211.Pse.vri..
1.0A4Qd lu3k,rpo
LT:4usn µ3wsaa$.10 tuolsKs..:u swawpoquto snotxuA
[6Z001
SINAINSKIOUVIA AO STIAIIVXA AO NOLIAMSJU
IIAmuls atil3O 11.103.104 ado stuqut
Jo mid 141.11!Ak twatu u0...,A.1.0:1RUT OACõ wmqpoiltu lotpo =wA Et" -oirtpA
porng
olp Jo :40064od'ozitij niitt.0 JO sill-el -or[14*A..E.matia U1ktpleuqx:wdd,
:40.rotialpoqui6.
lotpAT. UI=-otqUA. pin -ay Jo luz3nd saurtu JQ
snid urgpm mow two
õARrettrIxolddllõ `swatur!poqun low tri .ortfo pawls ottijo -wow 1101 sm-qw Jo
suld
u[vmm iTuotti 'MtauToquto auos,:t4 'titb:.õAtioltunp.zoiddv,i 4.upiN poullop y
[8Z00]
lupollnu jo luoiopp 1
jo pp.spdtrOp*Ipt:o .1! õlosolu!
%Int LPI :alour oAki 'up.J;m1 powjap sy -[upalaujA 4vId PUM.S 'MP j0
ptISIAV:10a A111 qi j! de.tOlu!õ
SitiOuJV ;MUT :0M4 'upiog poupp sv [LtOlO]
'0FIRACK110.1 1011
$.!- JO 51 1109SM1b 1111 '010 ¶Al1id1100 atri lop MOW 1011 soop otp
NI mat olq ptru õ1,141rAottniõ PAW 3tp 0oprnsge
[WOO]
17186170/SIOZS9lIDd 880170/910Z OM
ET-0-LTOZ V6TT96Z0 VD
CA 02961194 2017-03-13
WO 2016/040883 PCT/US2015/049814
[0030] Several embodiments include a. method of sensing .electrical power
being.
prOvided to a structure using a sensing deVi0e, a calibration device, and :one
or more
processing moduleS. The sensing device can include one or more magnetic field
sensors::: i71-ie s.ensing device can be .attached to a panel of a:citcuit
breaker box. 'Ile.
panel of the. circuit bm.iker 'box can. overlie at. least a: part of one or
more main
electrical power stipply lines for anelectrical power infrastructure of a
structure. The
.ealibration device: can include a load unit. The calibration device.:cap be
electrically
coupled to the electrical power infrastructure :of the structure. The method
cail
include automatically calibrating the sensing device by determining a first
trans*.
function in a piece:wise manner based on a. plurality of ordinary power
consumption
changes in the. structure. :over a first time period..: The method atm ...can
include
determining a power :consumption measurement using the one Or More proceSdrig
modules based on one Or mote Output signals of the Sensing device and the
first
transfer :function.
[003 ] Several einbodimentS. Can include a method of sensing electrical
power being
provided to a .Structur0 Oirig a .8010.1g device, a :calibration device,..and
one or more
processing modules. The .sensing device can be attached to a panel of a
eiretth
breaker box. The panel of the .eircuit breaker box:can overlie at least a part
of one or
more main electrical poet supply lines for an electrical paWet
infra.structureofa
structure. The calibration device can include .a load unit. The method can
include
determining a current flowing in the one or mote main electrical power supply
lines
based at least in part on one or more output signals of the sensing device.
The method
also can include determining a phase.: difference between the current flowing
in the
one or more main electrical power supply lines and a voltage measured by the
calibration deVite. The calibration devices can be electrically coupled to the
electrical
poWer infrastructure of the structure The sensing device can include one or
more
magnetic field sensors configured to measure a magnetic flux. produced. by at
least a
part of the one or more main electrical power supply line S and generate the
one or
more .:output signals of the.sensing deVidebased on the magnetic: flux
Meastned tty the
sensing device. The SerlSing.deviee:.can be.. devoid of bei0welectrically or
physically
coupled. to the one or -more main electtical pov,ter supply lines.
6
CA 02961194 2017-03-13
WO 2016/040883 PCT/US2015/049814
[0032] Contactless power consumption sensors have been used to reduce such
deployment burdens by offering "stick on" sensors that go on the outside of
the
breaker panel. That technique has utilized magnetic sensors to sense the
magnetic
field induced by the 60 Hertz (Hz) current flowing through the main lines
inside the
breaker panel. That existing approach was a step towards.simple and easy to
deploy
non-intrusive power monitoring, but there can be Some limitations to consider.
First,
the existing approach can require the user to precisely position the sensor on
the
panel, which is a difficult task for an end-user to perform. Second., the
existing
approach can assume a linear transfer function between the .magnetic sensors
and the
current, which limits its accuracy to a small current range. Third, --the
existing
approach does not necessarily take into account the small fields generated by
the
various branch circuits that may reside in -the area directly behind. the -
magnetic!
sensors. Fourth, the existing approach can inter apparent power, but not
necessarily
true (real) power, because it does not take into account the Phase information
between
the voltage and current waveforms. Fly not being able to determine true power,
the
existing approaches might not able to accurately infer power tite of highly
inductive
loads,.. such as compact -fluorescent lamps (CFL), light emitting diodes
(LEDs),
heating, ventilation, and air conditioning (HVAC) systemsõ computers,
televisions
(TVs), etc., which now tend to constitnte Much of the 'power consamption in a
modern
home. In addition, researchers in the energy disaggregation community have
limited
utility with just the apparent power data.
[00331 Prior technologies have utilized. a plug-in calibrator, but with-
the assumption
that- the plug-in calibrator wcaild draw -known power loads to -fit a transfer
-function.
One 'possible drawback of such an approach, however, is that it can assutne
the
cahbrator is able to draw a large range of loads, such as between 0 and 20
kilowatts
(kW), depending on the. size of the home and types of appliances present. It.
can be
impractical for a plug-in calibrator to draw such large loads because .of
safe. heat-
dissipation limitations, as well as the difficulty of constructing such a
device in -a
sinall forth -dor.
[003-4] There are many commercially available sensors for measuring and
showing
appliance level energy use at each outlet, such as the conserve Insig,htrm,
GreenSwitch, and Kìi1AWàttTM products. In the case of whole-house power
7
CA 02961194 2017-03-13
WO 2016/040883 PCT/US2015/049814
CO0SUMptiOn measurement, some of the popular commercially available solutions
are
The Energy Detective t,TEDS):and the PowerCost Monnor products: Installing TED
products involves placing a CT around the main electrical. feeds (Mains)
fitaitk: the
breaker panel, which requires a professional installation due to high-voltage
..Shock
hazard, Ort the other hand, PowerCost products can be easily installed by
ihOTIVOWTiet WithOlit hiring an electrician, but can require either
electromechanical
meters or eleetronic meters with an exposed and compatible optical port,
Hence, it
can be constrained to specific typeS of meters with its update rate. .as. well
as
performance dependent on the meter and 0:exposed data ports.
[0035]
Because of such limitations, contactless solutions are emerging that try to
infer
power without having direct. access -to the .p-tains. One such approach
meastires the
current at individual circuit breaketS.tisinga Magnetic sensor placed on the
face Of the
breaker Switch :itself; But most electric codes do not allow. anything to be
placed on
the circuit break.ers fOrextended use because of the potential interference
with its life-
saving cutoff operation. In additior4 such an approach µvould require a sensor
to be
placed on.each circuit breaker to gather whole home power on
the inain.eircuit
breake4 if present. In a similar magnetic field base approach, a
magnetic.sensor is
required:to be placed on every 'breaker-switch on the. panel. In addition to
requiring
several .sensOrs, ..Sitch an approach 410 needs to be calibrated numitally by
the
homeowner, -which can be etre.mely difficult andlor impractical for a
homeowner to
perform.
[QQ3(.;]
Another approach uses a pair of magnetic... sensors placed on the face Of the
breaker panel (*Stead ofthe breakers )..to sense the current flowing through
the main
bus bars. That approaekutilized a set of LEDs to help Runde the user in. the
placement
of the SOSO& That approach also 'wed a load calibrator to create a
transferfunetiork
bat assumed a linear transfer funetion and that the calibrator .eould ennilate
the entire.
power range of the house. Despite the use of LEDs to help with place.mentõ
other
branch citCnits and stray wires .can iMpact the magnetic field under the
Setisota.
Moreover, the State of the magnetic flux changes throughout the day as
y.460118:
apptianCeS are used which means that the LEDsAre most helpilil -when the
breaker
panel state terriaiiiS the.:sarne.after :the initial installation and are
least helpful when the
breaker panel state changes .significaritly after the initial installation.
Further, that
CA 02961194 2017-03-13
WO 2016/040883 PCT/US2015/049814
approach inferred apparent power, but did not take into 4C.C.0 Wit the phase
angle
between current and reference voltage.
[0037]
Ttirning to the drawingsj1(1. I illustrates ayiew of an exemplarysystem 100
attached to:a circuit breaker I 90 and electrical power infrastructure 1.60
:ofa structure,
according to a firSt embodimentõ FIG. 2 illustrates a block diagram of Systein
100õ
Ocording tt) the firSt. embodiment, SYStem .100 is merely exemplary and is not
limited_ to the embodiments presented herf..iit System 100 can :be employed in
many
different embodiments or examples not specifically depicted or described
herein.
SY.Stem 100 õcan be considered a SyStem for sensing electrical power usage in
electrical power infrastructure 160 of the structure. For example, the
structure can be
any building that is.. proyided with a distinct. electrical service andfor SS
:a
designated purpose. .Ekanipies of structures include .single family
residenceSõ
apartments condoininitirrisõ. townhotises, duplexes,, triplexes,
twadtapiexes:i and so
fOrthõ as well as commercial structures such as businesses,. warehouses, aird
factories¨to list but a few by way of e)ompleõ but without any intended or
implied
[0038] In
some embodiments,.system100 can include: asensirta device 110, a display
(IMO 120õ and/Or a. calibration deieti 180, In :many eltamplOsõ 8ystem 100
':(:)an be
used on .a.eonventional bre0er box Or...circuit Orf..!aker panel...such as
circuit breaker
panel 190. Circuit breakers panels in the United States generally comply With
the
General Electric "style" based 011 the guidelines frdpi National Electrical
ManufacturerS .ASsociation (NEMA:), 5pecifically, Circuit breaker panels
generally
have a :front solace .. ìt1 an access <door.. The front surface .generally
tovers the
interior %A.,here main electricai feeds or lines are connected to a bus bar.
As shown in
11.(1 1,, circuit breaker panel 190 can include individual circuit breakers,
such as
individual circuit breaker 65. and individual .circait breaker 10.1, In
various:
embodiments,: .circuit breaker panel 19Q: can include. panel 196 With an
exterior
surfate,. hì everal embodimentS:tircuit breaker panel 190 can include a door
197
that provides: aceesS to panel the individual .cireu.it breakersjosõ TOL 1051
andior
panel 196. In a number of embodiments,..circuit breAex:pansel_190.tan include
one:or:
.more inaìiicicuìt. bre akiyr (IKS $110:w6):
ritaity .eiìiboclir.uents. ìitiìit bt eako p atte
9
CA 02961194 2017-03-13
WO 2016/040883 PCT/US2015/049814
190 can include at least a portion of main electricai power conduct:gra 191,
1.94, and
.195õ.
[0039] In
various ealbodiments, the individual circuit breaker (04., .161, 10) .,can:
inelud0:citcuit breaker breaker levers 162 and I.
respectively),
and..can provid0::decttical.powtr through branch circuits:, :such as branch
cirtuits 163.
and IV, respeetiveiy. f'or vxamp 1 e, branch c irc u it 163 .ctin provide
electrical power
to receptacle 164 of the structure,. andfor branch circuit. 167 cati. provide
electrical
power to receptacle 168 bf the structure. In several embodiments, .electritai
power
infr'astructure 160 atilt. structur0..can include at leaSt. eirenit
breakor..panel 190, Main
electrical power conductors 193., 194, and 195. ("feeds'
g0,. and the branch
circuits in the structureõ.suchasybrancb circuits 10.3.0nd 167, Irr many
examples, main
electrical OW& conductors 193..4. 194, and 195 tan he ellectrically 'coupled
to:
attachment bar 1.9S, andiarconnetted to one or more bus bars, :sneh bo: bar
=199,.
Avhich tan supply electrical power to. the: :individual circuit breakers
161.., .165)
and to the branch circuits (e.g.õ 10, ..167) iri electrical power
infrastructure 160. In
many embodiments, panel 1.96: can overlie at least part of nraín eleetriCal
power
conductors 193, 194, and: I 95:. and .associated circuitry to protect people
from
inadvertentlytontacting these energized electrical power conductors. Panel
196: can
be :cOrnpoSed of Opel or another metal. In many ekamples, door. 197 the
individual circuit breakers..
16.1.õ, 1651 and is typically Closed fibr aesthetic
reasons but can be opened to allow access to the levers (e.g:, 162, 160. of
the
individualiCiktiit breakers (e.g.,,161, Off within Circuit breaker panel 190,
[0040] In
many embodiments, system .100 can be used to compute the (Anent
consumption in the structure by inferring the current being drawn through the
main
electrical power conductors 193, 194, and 195 In general, residential and
small
cOmmercial elecitical service: is typiCally 2: vO1t(111) split phase senlee.
This reArs
to the utility .provieling::twb 120 V alternating. current (A( ) :SOW-C.0
Conductors
power conductors..193 and 195) that are 1801.1egwes Out. Of phase, along with
a neutral
conductor (e,g,, pbwer conduct:Or 194) that CO.
retutti current from either
power conductor 193:or 194, Power conductors 193, .194,.and 195 canbe the
"feeder"
Or 'Amin" electriol pow 'et onductot.tha. Catty the interning: 1).01,y6t
fipnn. the utility
before being split up into branch circuits 163, 167). that sp
K.fOrent loads
o
CA 02961194 2017-03-13
WO 2016/040883 PCT/US2015/049814
within the structure. The 120 V loads can primarily include lower-wattage
loads, i.e.,
loads plugged into standard 3-prong. 120: V 15. ampere (A) or 120 V 20 A
outlets, and.
small applianceS with less than approximately 2 kilowatt (kW) power draw.
These
loads can be wired in individual circuits and attached to receptacles, such as
receptacles 164 and 168, and can flow between main electrical power conductors
193
and 194 pair (the "first phase branch" or "first leg"), or between main
electrical power
conductors 195 and 194 pair (the "second phase 'branch" or "second leg.") The
249 V
loads are typically large appliances (e.g., electric dryer, stove, air
conditioner
compressor, electric baseboard heaters) that consume More than two kW
(kilowatts).
In this case, the load cumin flows between power conductors 193 and 195 and no
load current flows in power conductor 194. Because of the 180 degree phase
relationship between the voltages on power .conductors 193 and .195, the.
total voltage.
is 240 V.
[0041] Industrial buildings typically have -three-phase. service where
the three phases
are 1-20 degrees offset from each other. Although a single phase power service
haS-
been described above, vstetul 00 can also be used with a three phase power
service
as well. In either caseõ system .100 can predict the-current flowing tluough
all the legs.
main electrical power conductors .193, .194, 195), .By sensing the magnetic
fields generated by .main electrical power. conductors 1.93, 194, and 195,
system -100
can sense the total current drawn by all loads from the utility because all
loads in the
structure are coupled in parallel to power conductors 1.93, 194, and/or 195.
The field
ge.nerated from the main legs (e.g,, 193, 194, 195) can be used to estirnate
the current
flowing through each leg (e.g., 193, 1.94, 195) separately, which 'radiates a
few
centimeters from. the wire (e.g., -193, 194, 1.95) and -even through the layer
of sheet.
metal of panel 196. In the ideal situation, magnetic field would scale
linearly with the
ctirrent. The relationship between magnetic field and current, however, ís
.not as
simple in -practice 'because of fields from all neighboring wires, reflected
.magnetic
fields, and magnetic nonlinearities of the sheet metal.
[0042] Still referring to FIG. 1-1, in many embodiments sensing device
11Q can.
include .one or more magnetic field sensors, such as magnetic field sensors
111, 112,
113, and 1.14, Magnetic field sensors 111-114 can include an inductive pickup,
a Hall
effect sensor, a magnetoresistive sensor, or any other type of sensor
configured to
CA 02961194 2017-03-13
WO 2016/040883 PCT/US2015/049814
respond to he time varying magnetic: field produced by the conductors inside
circuit
breaker panel 190. For example. magnetic field -sensOrS. 1.11-114 can be a
.Ra.dioShack
removable telephone pickup sensors, .model number 07C-12,õ Magnetic field
sensors
1.11-114 can be plape1. on the exterior surface of panel 196 to detect the-
magnetic.
'field radiated. from the 60 .Hz current flowing in main electriCal power
conductOrs
93 19,,t and 195 behind panel 196, as aÞ some -of the branch circuits
.163õ
167), 'FM. 1 shows a sample pincemem of sensing device 110 on panel 196. In
some
embodiments, the magnetic field sensots can
be printed as an array of
inductors using tibiquitous:OitQuit printing techniques. Which can allow
sensing device
1-0 to be attached to circuit breaker panel 190 as a. sticker.
[0043] Iln
several embodiments; sensing detyice. 110 can include one or more .maguets.
117. in a number -of embodiments, magnets 1.17. can :be- permanent magnets, -
such that.
:magnets 117 4:s.att create a persiStetit magnetic. field, In various
ethbodithents, the one
or more magnetic field sensors (e44..,11.1.--1.14) can be surrounded by
rnapets 117. In.
various embodiments, the magnets 1.17 can be placed to redact the died
Otmagnetit
nonlinearity of the Sheet metal of panel 196 104W in between. inain electrical
power
.conductors 1:93., 194, and .195õ atxt magnetic 'field sensors 1.114.14. The
time
difference between the actua.l current. waveform flowing :in main electrical
power
conductors 1.93<, .194, a.4r 195, and the inagnetiO WaVeform sensed by
inagnetie
field sensors 1111 -114 can be dependent .upon the ,magnetic saturation and
.permeability .Of the material of panel. 1:96 SatUrating the magnetic field
with. -magnets
1.17 can reduce. the nonlinearity ..induced by the sheet Metal if panel 19, Jn
other
ors,.the: nonlinearity of the phase difference betwee.0 the actual. and.
.sensed
.waveform. -Can be reduced by-. surrounding: magnetic :field sensors .111.-
11.4 with.
magnets -1 .17.,:Which beneficially 'result i.ri more- accurate predictions of
the phase angle
çalculation, ag.discu$sed be1OW ri further detaiL
[00111
11.n a number of .e.mbodimentsõ: sensing device .110 can include an attachment
mechanism 219. .Attachment mechanist 21,9..cart be configured to attach
.setising.
deviee 110 to a surflice Of circuit breaker panel 190, such as: panel 1.96, hi
some
examples, attachment mechanism 219: .can include .art adheSiVe,i a book-and-
loop
material, a magnet, or another attachment mechanism_
12
CA 02961194 2017-03-13
WO 2016/040883 PCT/US2015/049814
[0045] In
various embodiments,: sensiim device 110 can include a transmitter 415.
andlor p0Wer source 2.1:k Which can be used to transmit one or more signals
fer the
Magnetic fields sensed by tpagnetic field sensors 111-114. For example,
transmitter
2.1.5 am be a wired or witTele.s$ liannet F.or example, transmitter 215' can.
communicate using a:.cOmmunicatiOn protoccit. such as. Wì-Fi (wireless
fidelit7,,,, the.
:IEEE (Institute of Electrical and Electronic's Engineers). $02. -1.1
gandard), Zigbee
(IEEE 802,15.4), BInetooth (IEEE .8(ll2J $j),, or another suitable protnepl,
such .a.s
proprietary data communication protocol.: In some embodiments,. power source
21.6
can be a battery or other suitable power .sOurce, and can prOvide electrical
power ?Or
transmission through transmitter 215.
[0040] Still referring to ITIC.h. 1;=2,
ntany ernbodirtien0; calibration device I.8.0 can
include an electrical ping. 28; A,vhicii can be plugged into aleceptacle in
the structure.,
Such .as receptacle 164 or 168, and 0;'hiCh.: :(.41h allow calibration device:
to be
electrically coupled to a branch circuit, such. as. branch circuit 161. and/or
branch
circuit 1.67 In some einbodiments, system 100 can include a single calibration
device
180, in Other embodiments, syqem 100 can include more than one.:.tatibration
devite,
such. as: :cal ibration device 1:80. For 'example, aftist;:calibration dvìce.
ISO) can
be electrically :eon:pled on the first phase branch (first leg).
eleettkal powet
infrastructure 160 and a second calibration do'iee. (04..,. 180) can be
eleetrkally
coupled on the second phase. branch (second leg) or electrical. power
infrastructure
.160. In many embodiments,. talibratiOn deviet.:284 can include: a transceiver
284,õ
which
can be. used to receive comin un i c at i ons to:Conti-OF:calibration deviee
18(), For
example, transceiver 284 can be a wired or wireless channel, andiar can
communicate
tising a communication protocol such: as
ZigBee, Bluetooth, or another
suitable protocol
[0047] In
many ernbodiment$ calibration device 18Ø can include a load control unit
2.$5. and a load unit 281_ 'Load unit 2$1 can include one or mom. calibration
loads:
andier:one or more sWitelieS. The switches can he mechanical relay SWitcheS,
solid
state relay.S, triacs, transistors (04õ field effect: transistors. (TT's),
sitiCon-coutrolled
u.,µcti tiers . (SC Rs), bipolar junction transistors (Brfs..), insulated-gate
bipolar transistors:
(1GBTS),....04,),..tjt another .sttitable cintiIlab1 witching device.
'flirough the use Of
the switches, the one or more calibration loads can be temporarily
electrically coupled
1 3
CA 02961194 2017-03-13
WO 2016/040883 PCT/US2015/049814
to a branch circuit (e.g., 163 or 167) of electrical power infrastructure 160
of the
structure to facilitate calibration of sensor i 10 arid/or syStem 100.
[0048] The
calibration loads in load unit 281 can be one or more resistors andlor one
or more reactive loads:, such: as an inductor or eapacitor with or without: a
resistive
Component. Additionally, the calibration load can be: aload with a
µ'ariable.teSistance,
As tn..eN:ample, the Calibration loads Can be tint high 1Nattage resistOts,..
Such aS
Ohmite.: chassis mount resistom part number TGIFILVRIOOJE, -which can be
connected in series andfor paralleteotabinationsVia.the switches.
[0049] ln
a number of embodiments, load control =unit ?RS can include a:
inigrOcOntroller to reOeive communic.ationS. .ftom ti ariSceiver 284
andi.or...can send
signals-to the switches of load unit 281 .to drive the relays. The switching
signal can
be used to temporariiy. tbrni*te a branch circuit (e.g., '163õ. .167) and
s'vPitch One or
more calibration loads on to COMP lete a: circuit and draw power through main
electrical power conductOrs
and/or 195.. :For example, the load control unit
can drive the sWitches to -provide 25. vatt (W), 100 W, 200 W, andlOt 300 W
loads.
The one or more calibration devices '(e:g., 180) can draw one 0.a. series. of
known
IoadS: to automatically calibrate the. sensing device 110 andlor system 100,
tO
nuMber ofembodimertts, the maximum load that Can be drawn by Calibration
device
180 is 1000 W, lin another embodiment, the maximum load that can be.drawn by
calibration device 180..is :NO NV. In yet other embodiments. the maximum load
that
can be drawn b calibration device 180.is 50 W. Tbe relatively sinall
maxitintm loads
drawn by calibration device .180 can beneficially a. llow. calibration device
to ,safely
disipkne heat, reduce power COnsumptionõ andlor be provided in =a sinz.di form
factor,
in many embodiments,. systeM 1 00 can :advantageous ly leverage the actual
normal
electrical activities occurrin4 in the .kructure to pulls up to only MO W
through
calibration device 180, but nonetheleSS.,...can calibrate sensor 110 and/or
system 1.00
over the. entire range .ofpossible power usage in the struct ure,. such as
between D and
20 kW, and/or in small increments ituthas 10 W increments.
[0050] hi
some :embodiments, calibration jeViee 180 can include a voltage sengor.
2$5, Voitage..sensor.285-can be con-floured to-gense the ,,,oltage-of
eicatical power
infrastructure 160 and/Or senSt the phase of the VOltve of electrical power
infrastructure 100:, which can be measured through the connection of
electrical plug
1.4
CA 02961194 2017-03-13
WO 2016/040883 PCT/US2015/049814
184 to electrical power infrastructure 160, such as receptacle 164. In
various:
embodiments, the voltage and/or phase of the .Vt3ltage sensed by'vOltage salsa
285
can. be transmitted through transceiver 2K In many embodim.ents, systetn 100
can
use the phase:of thv ltat faci lit ate calculating real power,
[0051] Still referring to FIG& in
matiy :embodiments, display. device 120 can
in
c1udè.. SQ.
tine 22:.4.. in softie embodimerttg,, ptAiet sonrce 221. cim be a
battety:or.an electrical plug, such as .electrical plug 128, whicit.ran
provide pnwer.40
dispITy.. &vitt .120. Electrical pima can be pliti-ged into electrical power
infrastructure
160, such tistecePtacle & In a number of 'embodiments, display device 120.00
be
configured to receive the output signal from sensing device '10 andlor the
voltage
intbrmation from calibration device 180 via transceiyer224, In various
cmbodinaq.t,..
display device 120 can send ContrOtsiltals
calibration device 1.80viì transceiver.
224 such as liknats to .attiVate load unit 28 l inVaii0OS mboclimentgõ
transte.h-w.
224 can be a wired or wireless channel:, andfor can communicate using a
communication protocol, such as -Wi-Fi, ZigBee, Bluetooth, or another suitable
protocol_
[0052] In
some crobodiments display unit 120 can include uprocessitig module 22.5,
.meinory 226., andlor a display 121, In several enibodiments:õtothputational
unit 120
can be a onall form. Pacor..(14:tay *.vief,?.. In other e.mboditnents,.
ppinputatIonal. unit
.120: can be a personal computer MO. :In various mbod.iments display I'D can
be
configured to diSplay inforthatioti, sLich as poWer.: uSage, and can be a
Monitor, a
toucbscreen, an liquid etyStal display 0,,CD),H0 another suitable display. in
various
eniìbodi [neut.'s, display II2 I can shoW the result of the techniques
described herein to an
end-user in a structure, such as a home.
[00531 in
a: nurnber of etribodintents, processing module 225 tan be one or rhote
processing maim. such as the MSP430 microcontroller manufactured by Texas.
Instruments, Inc. In another embodiment, processing module 225 can be a
digital
signal procesSor Such as the 17MS320VC5505 digital siginìl pr.O.c.essOr
rnanulkt.tired
by Toms Instruments, Inc.. .or: a Blackfin digital signai processor
manufactured. by
Analog Devices, Inc,
1 5
CA 02961194 2017-03-13
WO 2016/040883 PCT/US2015/049814
[0054] In
some embodiments.õ. processing module 225. :can be configured :to use
current measurements from sensing deO.Ce 110 to. detennine a -calibration. Of
.senSing
deVite: 110 and determine electrical:power usage in clear:kW:power
infrastructure 160
of the structure-, suck as the electrical current and/or .ekctrical power of
main.
electrical power conductOrs 193., .04,..and195. In some eiamples, processing
module
225 can execiate One or more module:S.:Of:computer instructions .stored
inmeinOry:226,
such as neural network. module 222, transfer function module 229, phase angle
iïioduie & and/or - power consumption module 227, described below ln greater
detail. Memory 226-can be one or more -non,transitOry:data'StOrage elementS,õ
[0055]
Turning ahead in the drawings. Fla.,. 3 illustrates a block -diagram an
exemplary :system 300, according to a..:second embodiment, .Systerrt. 300 is:
merely
exemplary and is not limited to the -embodimentpreSented herein.. System. 300 -
Can
be employed in many different embodiments -or examples not specifically
depicted or
described .herein. System 300 can be sinii.lar or identical :to :system. 100
(FIGs.
and vatiouS..components:
ygtem 300 Can be 'similar or identiCal to l'arikittS
components of ..S.r.A01.11 1. 00 (Ft:QS:. various
..SyStein 390 :can
include ..sensing dey.ice. 110 and a. calibration device .3101 In many
embodimentsõ
calibration &vice 3S0 can include variOns elements. and/of pc-11,3rm various
funetionalities Of:calibration device 1$0 FlGs. 1.L.* arid display
iieNil04::120 (1-1(315., 17
..For example, calibration device.380 can include load unit.2.8.1:, load
control until
283., vOltagesensot 285,..and electrical plug2:82 .from calibration device 180
(FIGS, ..1-21. and can include proceSsing module 225, Memory:22k display 12i,
neural network
module 22.2,. transfer -function module .229.:, .phase angle: module: and
power
c.onswuption module 12.7 of display device 120 (I' In
various enibodiments,
two or more elements ..of calibration device .180 (TIC1s. t-2): and display
device :120:
(904. 1-2) can be combined as single element in .calibration device. 380. For
example, transceiver:284 (FIG. 2). can be :combined in .transeeiver :224 in.
calibration
devit*-3:80. Äsanother-dxample, poWer. :source...223 in display device. 120
(FIG, 2):
can be Ornbined in electrical plug 2$2.0fcalibration dei,400.00,
[0056]
Referring to FïGs I3.. magnetic field semis 1 II-114 can. each sem!. a
.magneticIiold generated from ..rnain eleettiCal pOwer cOnductor4 193, 19.4,
andlin 195
underlyinn:cireuit breaker panel 190, and can generate an output signal
representing
1 6
CA 02961194 2017-03-13
WO 2016/040883 PCT/US2015/049814
the magnetic field. The output signal generated by- magnetic field sensor 111
is
denoted herein as Si. The output signal .generated by magnetic field sensor
1:12 is.
denoted herein as S,. The output signal generated by magnetic field. sensor
113 is
denoted herein as The
output signal generated by magnetic field sensor 114 is
denoted herein as 54. To convert the .sensed magnetic field 'to current,
system 100
and/or syStem 300 can use a transfer fiffiction, which can, given the sensed
magnetic
flux, determine what the underlying current flow in the main leg is that
induces the
flux. System 100 and/or system -300 can infer the transfer function using
calibration
device 1.80 (FlOs. 1-2) and/or -calibration device 380 (FIG. 3), which can
(haw a
known amount of current by powering a resistive load in load. unit. 281 at a
given time
while the magnetic field sensors (e.g., 1.11-114) sense the change occuning in
the
magnetic field due to that current draw
[0057) In
many embodiments, system 100 and/or system 300 can generate a transfer
function, which. can be used to convert -these magnetic fields .signals into
current
waveforms flowing through each of main electrical power torxhictors. 193, 194,
and/or 195. In order to predict real power, system. 100 .and/or system 300 can
determine both the root-mearpsquared (.MS) value of the current waveform and
phase angle between the current and. voltage waveform, rather than merely the
RS
value of the- current..
[0058] -
Creating- a transfer fiinction. to -compute the turre.nt waveform given the
magnetic flux can benonftrivial because of various challenges posed by
fundantental
characteristics of circuit breaker panel 190 and the sensed Inagnetic fíeld.
.A first
challenge mate stray magnetic flux. In addition to main electrical power
conductors
193, 194, and/or 195, circuit breaker panel 190 also consists of other
electrical wires.
going through the individual circuit breakers (e.g., 1(1, 165). There are also
wires
passim; around the main lines and each of those can radiate fair amount of
magnetic
field depending-on the current flowing through them. Itflagnetic .field sensor
l 11-114
can sense the magnetic field radiated from all these sources. In -order to use
determine
only the magnetic field radiated by the main lines, the magnetic fields
radiated "by the
surrounding wires should be eliminated during the prediction by the transfer
fitnction
identifying only the rnagnetic flux radiated from main electrical power
conductors
193, 1.94, and/or 1.95.
1 7
CA 02961194 2017-03-13
WO 2016/040883 PCT/US2015/049814
[0059]
.A.:second challenge can be the position of sensing device 110. The amount:of
magnetic .fiel.d sensed by Magnetic field sensors 1 1 :I 4 14 can depend on
the distance
between magnetic field sensors 111-114 and main electrical power = conductors
193,.
..1.94, and/or 1:95, In order for .system. 100 andior .system 300 to be a
placement
invariant Systern that allowg 'wming device:: 110 to. 'be placed on any
po8ition of the
breaker panel, the transfer function Should be able to accommodate any
distance.
between magnetic field sensors Ill-114 and main electrical power conductors
193,
194, andfor=19&
[0060] A
third challenge can be iSolating the magnetic flux .ofeaCh of mai:n
eleettiCall
power conductors 193,... 194, andfor 195. =Current flowing through each of
main
electrical power conductors 194, 1.94, and/or I95 can contribute. .:to the
.sensed
magnetic field of each of magnetic field sensors 11-1 14. Yet sensor 110 does
not
know a .priori how. Much of the magnetic field generated by each of main
electrical
power conductors 193, l.94, andfor 195 c.ontributes to each of the magnetic:
fields
sensed.by magnetic. field sensors 111-114: .As shown in FIG. 1, magnetic.
:field sensor.
111
(the le.ftmost.SensOr) and magnetic field sensor 114 (the rightmost .sensor y
arc..
likely influenced mostly. by the leftmosf leg (main electrical power -
conductor 193)'.
and the rightmost leg (main electrical power ..conductor 19*, respectively.
But the
rat:0 Of influence unknown a priori. For magnetic. fieldienSorS 1.12-113 .(the
tWo:
middle sensors),. the scenario can be even more unpredictable. The transfer
function
should be able to figure ont the ratio. by which each of triaiil electrical
power
conductors 193, 1.94, andlor 195 influences each Of magnetic field
serisorS=111-114:
[0061] A
fourth challenge can be -uncertainty in the wiring of the circuit breaker
panel
circuit breaker panel. 194 :Despite :guidelines promulgated by .NEMA and
NEC, the internal wiring- of breaker panels varies.. significantly depending
on Various
factors, = Such as the skill andlor experience Of the e lectt eìa ho
installed it. Tile
tramfer functio should be able to work with any breaker panel with a.ny type
of
[0062]
Because these =challenges can vary moss: different: breaker:panels, the
.s.a.ow
amount of electrical load earl induce different. amounts ofmagnetie field in
different
panels. MoreoVet,eVen in the Same panel with the Same positioning fsensing
device
110, the relationship between the amount of electrical. load and the magnetic
field can
18
CA 02961194 2017-03-13
WO 2016/040883 PCT/US2015/049814
depend on the CAStif114. magnetic field inside circuit breaker pzrtnel 190 as
awhole. For
example, the base-line current throug1h one of ..main electrical power
conductOrs. 1.9.3õ
194, or 1_95. can be: 41 and a. positive change of
.amount can result in a poSitive
thange of.S,hiirì Si. lf the baseline C tir rent changes:to..r, the same
poshiYe.kh change
can:causea different amount of change
Depending on how the magnetic: fields
radiated from. different wires and their constructive or destructive
interference, the
value of&h.2.. can even be negative:despite:a poshivehh
[00631
Accordingly,: the relationship between the electrical current in main
electrical
power conductors .191,.. 1.94, andfor 195, and the intagriefiC.field. Sensed
by Magnetic:
field sensors 111-114 can be nonlinear and andlorcan depend on the existing
baseline
magnetic fi.eld andlor the presence of other magnetic fields. 'TO accommodate
this
variability and nonlinearity, System 100 andlor syStern 100 can create
multiple
polynomial equatiens:lot each ".state". of the breaker panel. By defining the
statein
terms of uagnetic fiix. syston 100 andlor system 300 can build a function for
each
state; ..Such a problem can be well suited for machine-learning techniques
that learn a
function. Wit h given statesas inputs. For. kmmple,;.. system 10Q =WM:
Sy$14111 30Q :can
use a neural nehvork model, which can essentially learn a polynomial function
to
predict output from
[00641 In
a number :of einhodiments, neural network module 222 can construct 6:
neural lie t work model ming load unit 28.1.õAs described above,.calibration
deviet ean
apply Yartis loadS, such as cycling through a series of25 W, IGO W, 200 W, and
300
W loads. lust betbre the calibrator turns on a load,. neural network
module222:. can
start tracking the values measured by sensing &Vice 110. Turning the load on
cattses
a change in the total current and, thus,...the magnetic film This change in
magnetic
flu* can be recorded by'System 100 and/or syStem 300. For each calibrator
action
tUrnirtil On or turning off a load through load unit 28A,..neural. nerOrk
module
222.can construct a traininit instance ibuthe neural network.... The structure
of such an
instance: is shown in Table L. The first eight columns of Ovdy row can be
input
features of the learning algorithm. The ninth column can be the output value
that the
algorithm will try to learn_ The neural_ network can consist of one input
Iaye.t one.
output layo:and two hidden layers having five notons in .each. Of the layer*
rn
many embodiments, neural network module 222: can use a. conventional neural-
9
CA 02961194 2017-03-13
WO 2016/040883 PCT/US2015/049814
network machine-learning algorithm with the inputs and outputs described
herein to
learn the ftinction.
TABLE 1
1I I
Sp 'tcS. SAZ S3p S4p S.ç !eh
[00651 In Table 1., :Sip, 8,/p,..4
arid 4,..can be the S. values of the four output
signals generated by Magnetic field sensors 111-114.,. respectively,: before
the
calibrator turns:on the load, S and
:S4: can be the RMS 'values of the thin
output .signalS generated by magnetic .field sensors .111-114k.tespectively,
after the
calibrator turns on the load. ../A.can be the amount of current the talibratOr
added tO..a.
tog ( one:ortnain electrical power conductors 193, 194, of 1951-When it is
plugged in.
Because die relationship between -magnetic flux change: and electrical current
change.
can depend on the existing magnetic flux present in circuit -breaker
panel...190, in many
embodiments 'neural network modtile 222 t att rise both the previOus and the
current
magnetic flux as input features instead of merely using the change of flux.
[00661 in
a nuniber of embodiment* calibration device 180 can turn on each load of
load unit 2.81 for fire:.s.dd.004 After five s.&onds. Calibrati:On deviee
18(kan turn off
the toad of toad unit.U.1.,.. and neural. network module 222 can. captures a
similar es,,ent
and calculate a...Similar training inkantefor the turn-off event. In Many
embodiments,.
.systOni 100 andlor. systeM :300 does not have accesS to the absolute value Of
the
current going through each of main electrical power conductors 193,..1.94,
andlor 193,
In Several embodimonts, = the only a: priorì intbrimnion can be the amount of
current.
=change calibration unit 180 ..causes irl main electrical power conductors
193, 194,
and/419.5. ConsequentIY, ìri. Many .embodiments the neural network model caii-
be
trained to predictonly the change in CUrrelit value, not the absolute Ctirrent
value.
[0067] To mallet the..ab$Olute current vii-petbrrn in each-Of.:main
power
conductors 193, 194., andlor.19.3, transfer function module. 229 .can use.. a
gococtrie
translation technique that can leverage the. prediction model and natural
electrical
activities in a home to create a transfer function that converts kitsok
valitesIo current
Avaveolip. fin- the 'Sake of sin-milt:iv, the description of the te.Clinique
below uSeS
onlyme, instead of fo..ur; magnetic. field sensor 111-
114), and only single leg
(bit' of main electrical power conductors 193,194, andlor 195),
CA 02961194 2017-03-13
WO 2016/040883 PCT/US2015/049814
[0068]
At first. system 100 (FIGsõ 1-2) and/or system 300 (FIG. 3') :can create an
initial transfer function using the collected .calibrati.on data generated by
neural
network module 222 (FIGs. 2-31 The transfer function can 'WOrk- for .only- a
Small
range of magnetic field. values, -which. can he limited :to. the range of
loads the.
cniìbratío: (.
1:80.016s. 1-21, .3so (FIG. 3)) :an provide. This ran ...can be.
Stored as a: calibrated region,. .while k.eeping track Of the present magnetic
sensOr
values, As the .magnetic sensor values change oyer.tfine as .tlppliances.are
used in the
structure,. system .100 (FIGs..1.:-2) and/or System.300 (fI(. 3) can use the
calibration
device (e..g. lag
3g). (FIG. .m to calibrate un7talibrated regions, by the
.catibration device pulling.a.small load. The difference in the observed
.mtignedc field
signal at that levejtan be used to update the transfer fiinction.
[00691 In
many embodim.ents.õ. when syStem 10.0 and/ot. s3..stetn .300 begins tO
calibrate.
sensor HO, the only information known is the current :RIOS magnet:it :field
(4)
measured by..eacIh magnetic field sensor. Calibration device: 180 can
initially- draw ft
series 100
Wõ. 200 W, and SOO. W loath (3 times each) on top of this: eurrent
:magnetic fleld. Hence the field -value can change and the system can keep
:tratkof the
maximum val01thesensor.M-4). Bas,N1 on Iltese three loads being: repeated
three
times,. neural network module :222 can save nine. 'calibration events from;
Sk.t.O
FOr....each event, there c4n..be two training :iristaneeS:.(4., One. for
turning the load on
Orf event") and one -for turning the load off' ('' off-event")),: as described
above; As
stkhõ..rieural netwOtk.module 222. .can gather eighteen training instances
from sens.or.
value orS.k. to S.k.41. and use these inStanCeS to train the neural network
model .described
earlier.
[0070]
Turning ahead in. the drawings, FIG. 4 illustrates an exeinplary graph of a
function (0.400, µvhich can be derived by placing a predicted function...0i)
.40.1
region :403. Of finiction .:(F)..-400. In manyembodiments, the = predicted
function (/.4)
.401 that .caii convert magnetic &Id change: value -from SA, .to.$4..,,rto
current value
By training. the neural network model. neural network module 222: (FIGs, 2-3)
can
determine predicted function 401. VII, Nvhic1).. cab convert the magnetic
field change
value front:Skto:Sk+1 to the current c.:hattgevaluel,k.
order to find function...(19 400,
which Can 'cOnvort aby titagotio field va:113 S to .abstiltito riaten1 Value
I, predicted
function 401 (h):cen be placed into ati appropriate position ..ØF. Because
system
2f
CA 02961194 2017-03-13
WO 2016/040883 PCT/US2015/049814
100 (Flasõ 1-2) andlot .system 300 (FIG. 3) does not knos,v the absolute value
of J.
trogfet function module 229. (FIGS. 2-3) cap aSSume a random y,axis. Value R
and
place predicted 'function 401 on Innction (t) 400 at region 403 01(Ski R). In
many
embodiments.,..system 100 (Wis... 1.-2).andfOrsystem 300 (FIG. 3) do.es not
know how:
the fianction (:t.) 400 looks like at a.res-2;ion 402 from 0 to. 5 Theretbre
function (PI
400 can be extrapolated at regiou 402 from (0, 0)40
R'). Because: region 402 Of
function .09. 400 iS..extr.apolated,.: it can do a. poor Job in translating
S'to
[007
Turning ahead in the drawing, :FIG. .5 illustrates an. exemplary !,?,-raph of
a
function :0300, MG. ( illustrates an eutriplary graph of a futletio.n.0) 600.
Hal
illustrates an exemplarygraph of a function (11.700. In Mally embodiments,
function
(F) :500, -finiction (f.1 .600 and/or timetion.:(F.) 100. can he:: 'a. further
refinement of
function (/') 4o0 (FIG 4), based 'On additional calibration sequences in many.
embodiments,. in order tp further determine .extrapolated region 402 (FIG,
4)4.transer
function module 229 (EEGs. :2-3,) can wait until the value of S.,. as measured
by the
'magnetic field sensor (e.4, 11 1-1 14 (FIGs: .1.31 falls belowSk into
position 402 MG,
41, at which point the alibtaitm ptOes$ :Oan he, reinitiated. Aa dCsoibed
abotice,.
neural network .modltio 211::(FIGs.õ .2:4) can determine a new fj_inction (Fi)
hasedon
the values measured in the calibration sequence, .which can.. converts
rnagrietit. field
vaii,teS froin..õVt9 $1,-.4. where Sj...S.;;,,
easeS:in which Sk ,<Atiq, transfer function.
1110(161e 229 (FIGs. 2-3) can combine ...t,7; with fi and create a new Tegion
.502 of
functionfil :50:0 that tOvets from $J tO.Si.41..õ as shown in. FIG. :5..
OtherWise, in cases
whielt
transfer'fontion Module :229 (Ms. :2-3)::cnn place in a region
602 -(which covers the range from ;S:; to 40) which cari. be separate from
PiAii region
. .
604 (which covers the range:Sic:4.o Sk+./.).
[0072] .AS
shown in IFignre 5, transfer function triOdule 229 (FIGk 2,i3) can create an
extrapolated: 00On 501 from 0 to .Si. If the ineastited :magnetie field evet
falls betqw
.such .as during the night when most of the appliances: are off, neural
network
module.222 (FiCis.:23) can initiate a neW-ealibration :Cycle for the new
region and
transfer l'unction module 229
2,71).. cap further regine andlor *re:ate. function
(1) 500 from the new position to Si..
[0073] As
shown in FIG, ;6., transfer ftmction module 229 (HQ&:2:.;.:3) .00 create
extrapolated region 501 from 0 to.:k and an extrapolated region 603
froinAiii:tp
22
CA 02961194 2017-03-13
WO 2016/040883
PCT/US2015/049814
In case the measured value is Si,o where Sp./ SI,
system 100 can 'nigger
calibratiOn device 180 (Ms.
andlor :syStem $00 can trigger calibration device
380 (FI(iì. 3) again so that neural network inoduie 222 (FIGs, and
transfer
function module 229 (FIGS, 243) can update fin:10km (k) 600 from& to Skti,
After
updating function: (r) .600,, transfer function module 229 (MG& 2,3) can
extrapolate
from to
Sm, as the transfer function module .229 (FIGs. 2-3) akeady has a function
ficoin S.'fto Sith :as shown in region 602,
[00741 As
shot. in FIG: 7, if tilore appliances Within the structure are turned on and
the .S0,11s.or value (Sõ) exceedS
syStem 100 can trigger calibration device 180
(FIGS 1-2) andlor system 30(3 can trigger calibration device 30 (FIG. 3) again
so that
neural network module 2.2,2 (FIGs.. 273) and transfer hinctiOn module
229:(FIGS.,23)
can update function(f) 500 (FIG. 6) to cteate function (F) 700 ..as updated in
a region
704 from S, to Sol, After updating function (F) 700, transfer function module
229
(FIGs: 2-3) can extrapolate in a region 703 ft-oni to to,
as transfer function
niodule 229' t FIGs. 23) already has a predietitm function ìri region 502
front St 1.6
rinie goes: by and more appliances within the structure are turned on and/or
oft
which can result in additional calibration sequences, the extrapolated
:regions.
Sal,: 703): earl shrink mOtettrid momand transfer function module 229 (FIGs:.
2,=
-
3) can refine a better translation function
J11110'6011 40Q, g!Q, 600; or 7QQ) frotn.,Y
to I:, As system 10Q (FIG, 1) and/or system 300 (FIG, 3) :runs in a house, it
can
advantageously captate tbe uSuAi electrical activities in the house, which can
increasiney provide it with a N4.ik range Of sensor µ,alues.to learn from
using neural
network. module 122: FICis. 2.-31 As more appliances are turned on and of
system
100 (FICis. 172) and/orsystem 300 (FIG. 3) can talibrate for more and more
ranges
and the predicted transfer finiction (e.g., function 400 (FIG. 4).. function
500 ( FIG. .5:)
function 600 (HQ,. 6)::ot function '700 (FIG. 7)) can become increaSinly
aCcnrate.
[0075]
Turning ahead in the drawings, FIG. (top) illustrates an exemplary grapb.
magnetic flux for output signal :S1, S. :S3., and 54:tenerated by n'iagnetic
field seMi'ors
1-114 (FIG.% 1-3) and FIG. 8 (bottoin) illustrates an exemplarystaph ola
prediCted
current 'Waveform through one leg :(e.g:, one of main electrical poWer
C.OndUCtaa
193,194, z,indkit 194, Once System 100
andlof system 300 (F.KL =3E)
starts:, it can create a ft:m.00u
function400 (FIG, =4), Aniction 500 (FIG: 5),
23
CA 02961194 2017-03-13
WO 2016/040883 PCT/US2015/049814
fiinction 600 (FIG. 6), or functio.n 700 (FIG. 7)), = which can takes the four
magnetic
field values (Si, S2; S3, S4) -measured by magnetic. field sensors 11.1-114
(EEGs. 1-3)
and can tranSlate them into current waveform L FIG. 8 (top) shows a sample
input
and FIG. -8 (bottoni) shows a corresponding sample output of the prediction
function
F.
[0076] As
shown in FIG. 8, system 100 (FIGs. 1-2) and/or system 300 (FIG. 3) can
predict the raw current waveform flowing through each. leg (e.g., one of main
electrical power conductors 193, -194, and/or 195). In other words, it can
predict: both
the WS current (I) and the phase of the current -
which can be used to calculate
-the phase angle (0) between the line voltage arid the current O. :Predicting
this ()can
be relevant from an energy monitoring perspective, as it.can allow system 100
(FIGs.
1-2) and/or system 300 (FIG. 3) to determine-the-real power-, as opposed to
apparent
power, consumed by the household,
[0077] -Turning ahead in the drawings, 9
(top) illustrates an exemplary graph of
a predicted current wavelbmi .1 and a measured voltage waveform, and FIG. 9
(bottom) illustrates an exemplary graph of magnetic flux for output signals
Si, S2, S3
and. S4 generated by magnetic field sensors 111-114 (FIGs. 1-3) that were
used. to
predict the-current waVeforni
many embodiments, the voltage waveform can be
measured by voltage s.ensor 285 (FIGs. .2-3). To predict phase angle 0, system
.101;)
-1:2) and/or system-300 (FIG. 3) can- rely on the hypothesis that "any change
intO the phase Of the current Waveform will also be reflected into the sensor
waveform." FIG. 9 shows an example .of the -validity of the. hypotheSis. As
shown in.
FIG.. 9 (top), the measured voltage and predicted current waveforms are
closely in
phase with each other (0 is small). Careful inspection of FIG. 9 (bottom)
shows that
two of the inagnefic waveforms (Si and S4) have the same :phase
characteristics (zero
crossing- rise and fall at almost the same timestamps) as the current
waveform. In.
other words, the transfer function (e.g., -function 400 (FIG. 4), function 500
(FIG. 5),.
.fiinction 600 (FIG. 6), -or firriction 700 (FIG. 7)) can be influenced. more
by Magnetic
-field sensors 111 and =114 (FIGs. 1-3) when predicting current waveform.
[0078]
Turning ahead in the.drawings, FIG, 10 (top) illustrates an exemplary :graph
of
a predicted current -waveform / and a measured voltage waveform, and FIG. 10
(bottom) illustrates an exemplary graph of magnetic flux for output signals
51, 52, S3,
24
CA 02961194 2017-03-13
WO 2016/040883 PCT/US2015/049814
and.$4. generated by magnetic field sensors 111-114 (FIGs.
that were used to
predict the. L
FIG. :10 (140 shows a different scenario in -which the
current Wtrveforin iSlagging the voltage: WaVeform by an angle As
shown in FIG,
(bottom) From the. bottom graph, two of the magnetic waveforms (.S. .and 5.4).
are.
also Mowing the current 'Waveform, in other wordS,...when the current
waVeforixt
phase :shifted by angle 0, four :senSorwaveforms will also .get phase shifted
by some
angle$04, f.b., .04:and 04; These ang:10 can be different from the original
phaseshiftfl.
Yet the sensors that are influenced primarily by the current µvaveform can
have a
cloSer shift to the angle J Ak.sttett.., a difference (0,4) between the
original shift and
the sensed shift can be small.
[0079] In
many embodimenM the presence of the sheet metal of panel 190 (FIG. 1)
between of main electrical power conductors I0, :194, andlor 195,:and magnetic
field
scnsciiI: 111-114 (FIP.4,. .1.;3).: can ttgUlt in the phase differenee :(0,464
between the
actual current waveform going through main electrical power conductors. 10,
194,
andlot 195, and the magneticaveforin sensed by. 'magnetic field sensors 1I1-
114
(IFIGs, 1-3) becOrning :nonlinear function baSed on the magnetic saturation
and
permeability of the material, in a number of embodiments. magnets 1.17
(FIGs....
surrounding magnetic field sensors 111-114
:1,3) can advantageously saturate
the magnetic field and: reduce the nonlineafity effect. As4 result, Oditrean
become
near constantand the transfer function tel., function 400 (Fla 41, function
500 (FIG.
functiOn 600 (FIG. .:4. Or funetiOn 700 (FIG. 7.))..can predict the phase
angle With
.gOod.00,00.
[0080] In
several embodiments, phase angle module 22.$ (110s, Z-3) can determine
the phase difference and/or phase angle .between the predicted current using
the
transfer function (e4,.., :function 400 (F1G:õ
.ftinction 500 (FIG. fimction 600
(FIG. 6), :or function 700 (FIG. 7)) Vilerated y Willeer. function module 229
(FIGs.
and using the voltage measured by voltage SenSOr 285.. (FI(is,õ.2-3), The
phase
angle can be equal to the phase angle of the predictedturrent minus the phase
angle
of the vOltage ineaSnred using voltage..sensOr 285 (FiGs,..2-3);:which can be
used to
determine the phase angle of the voltage acrOsS electrical power.
infraStructure 160
(FIG. it. lit several emboditnt10, the pl*,*.:aiigle of the predicted current
ttgit be
calculated in reference to the zero point crossing of the. measured voltage.
In a
CA 02961194 2017-03-13
WO 2016/040883 PCT/US2015/049814
number of embodiments, power computation module 227 (FICs 2-3) can determine
the real power based on the phase difference andlor phase angle. For example.
the
real power can be equal to the product of RM.S' values of the current and
voltage and
the cosine of the phase angle,
[(081]
Turning ahead in the drawings, FIG, 1 I illustrates exemplary graphs showing
a transfer functiOu and its decomposed. elements. Mathematically, the.
ttanSfer
function (e.g.:, function 40.0 (Frci. 4), function 500 (FICi. 5), function 600
(FIG, (),
function 700 (FIG, 7)) can be expreSSed as tbllows;
F(S1,52,,S3,54)., As the
function
is five-dimensional (four inputs. and on.e outptit), it .an be challengingto
-
visualize the effect of each of the magnetic field sensors (e.gõ 1 I-114
(FIGs. 1-3) on
the predicted current output. The top four plots. Of Fla 11 show the predicted
current
05 based on each of a sìi SenS07kinitie
.$2, SI, or $4),. :For each of the first four
plots, one sensor value ..:($1:õ.S S,. or $.4) is varied from. 0 microtesla.
(uT) to 100
linearly; keeping all the the sensor .values at 0 n.T. The bottom plot of FIG.
I
shows the predicted current (/) based on all four sensor values. The bottom
plot
assumes all fOut. SenSorS .values increase from 0 tiT to 0.05 uT. The current
is:
measured in amperes.(amp).
[00821 The
plotting in. FIG. 11 can be. lesS than ideal, asin actual operation of syStem
100 (FIG& 1.-2):andlor system 300 (FIG.: 3),. the current can be predicted
based on
different combinations a all sensor values, Yet FI(ji. can
provide interesting
insight. As
example, after a certain field value, the predicted cal-rent 'values go:
down for all the sensor valties except SI: This phenomenon i$ observed because-
of the
presence of multiple magnetie Waveforms inside panel 19.6 (FIG, 1). As the
phases Of
these vavefortns are different and they are always changing based on load
condition,
there can be constructive: and destructive interferences in different
locations inside
panel 196 (FIG. .I), Depending on the location in which sensing cje vice 110
(FM", i-
ll): is placed on circuit breaker panel -190 (FIG. the
magnetic field sensors .(e.g.,
111-114 (F1G.& 1-3) can sense destrtictive interferences when there= is, a
pOsitive
change in the current waveform and can exhibit an inverse relationship between
cntrent and magnetic field.
[00831 In the bottom plot of FIG. I I, in which all the .501$0 are
increirtg,
there is similarity with the topmost plot of FIG. II in which only S is
increasing
26
CA 02961194 2017-03-13
WO 2016/040883 PCT/US2015/049814
Although the predicted current ti) for the three other sensor values (S2.4.,%,
and Si) =iS
decreasing alter a while, the predicted current (1) i
lways increasing, in the
bottommost plot of FIG-. I. Essentially, this behavidr means that the transfer
function (HQ, 4)fttnction 500 (FIG, 5), function (00 (F.Kii, Os Or 11111(1k/A
700
7)) is influeated. primarily by Si, In other 'Nada, magnetic field sensor ill
(FIG& U-
3): ccnitespondim. to fterisor value: SI cart reflect the ctirrent waveform
more precisely
than the other magnetic :field sensors 112-114 (Ms. 1-3), which correspond to
sensor.
values S2, $3; and >S4,, respectiVeiy. Fot ftample, the neural network model
learned by
neural netWork module 222 (FIQS:2-3) can increase the coefficient OS i More
than S.
and S. In such a case, the amplitude and phase of the. predicted current can
be
determined priminilyy St, which illustrateS hv a machine learning-based
approach
can he more appropriate for this kind of problem, as it can be difficult to In
a:single
polynomial for these observations.
[00841 To
validate the techniques described herein, an evaluation wfIS conducted in
six different homes And one industrial building, The homes bad two-phase
wiring-
systernS and the industrial building had a three-phase System__ Data :47aS
:collected
froth one house for a longer .period, spanning seven days, and from the other
places
for a shorter period, :spanning: twO days, The
CT*altlation show the :general
applicability :of :system 100 (FIGs, and/ot sYStem 300
:and the
techniques described herein, to a diverse set of breaker :panels
:circuit: breaker
panel 190 (FIG. 1), aswell as the longer-term temporal stability Of these
techniqueS:
Table 2 Otcog the ktiTup:oty :of the bottles used in the evaluation, based on
panel tYPe,
style, and size,. HI-116 are the six homes. HI had the system deployed for 7
days, 11
is the industrial building.
27
CA 02961194 2017-03-13
WO 2016/040883 PCT/US2015/049814
TABLE 2
11) Panel type Style / Built I Remodeled Size Floors
H1 Apartment / 1.9).3/ Not 550 square
feet (sq. ft.)/ 1
applicable (NA) floor
H2 Two-phase House / 1972 / 2002 1250 sq. ft./ I
floor
H3 Two-phase z,:kpartment / 1931/ 1994 800 sq. ft./ 1
floor
H4 Two-phase House / 1960 / NA 22:20 sq.ft./ 1
floor
H5 Two-phase House 1987 NA 1340 sq. ft./1
floor
146 Two-phase HouseI NA!1452
sq. ft.,11 floor
11 Three-phase llndustrial / 2003 NA NA
[0085] All
of the data collection sessions Were perfotmed under a naturalistic setting
with the usual home appliances comprising of inductive, resistiv% and other
complex
harmonics applianetg. The residents and/Or Oteupants of the structures were
not
given .i.try instruction On the use of their electrical applKinoes or requeswd
!flake
any changes in their daily :routines or household tasks. Once installed (e,
once
sensing device; 110 (FIGS, 1-3): *A. attached to entuit breaker panel 190
(FIG; I),
calibration deviet
..(171Gs. 1..;2) was plugged into receptacle 164 (FIG. I), and
display device 120 (F1G., 1..Z) was plugged into receptagle 10.8 (FIG, 0), the
system
ran a:nom-CR:ally in the background thr the entire: data colleetiOA $ftSiOn
with no
human interaction at an.
[0086] The
wstem was packaged such that it could be rapidly setup in a home. The
sensing device (e.gõ sensing device 110 (FIGS, 1-3)) \vas placed on a breaker
panel
citcuit .breaket panel 190 (Fn 1)) using double-sided tape: To collect the
ground truth,: we installed commercially available NO end transformer-based
split-
core CTS (0% accurate) inside the breaker panel prior to installing otu sensor
lin it on
the outside. of the breaker panel. Both the output of the sensing device and
the output
of the C.Tf were. collected using the. same data acquisition device (DAD.),
specifically
CA 02961194 2017-03-13
WO 2016/040883 PCT/US2015/049814
National Instruments 1 S:a-6259 attached to a laptop computer (e.g., display
device
.120 (FIG. I)).
[00871
Long eversion cables were used to bring the receptacles: of different phasea
branches =closer to the laptop. Two calibration do-lees le.gõ I81) (FIGs.
1.,,2)) were
pluged into the teeeptaeleS (e,&:, 164, 160. The callibldtion deviceS:and the
data:
acquisition deVice were connected tO a laptop, The laptop COntrolled
thrcalibration
device, recorded all the data from the data :acquisition device, and pertbrmed
all the
algorithmic processing in real-time. The original and predicted watTforms were
also
recorded for post-experiment analysis. The software portion in the laptop was.
Written
INflat lab.
[0088] For
each of the deployments, the RMS CUITent. value (iois) was: calculated in
ampere, the R NIS line voltage Ofilms)was: Calculated in volts and phase angle
(0) of
the Qurrent waveform with respeet to voltage was calculated in degree$ every
second,
These quantities were recorded both for :ittound truth current waveform
(measured
from the ( Ts) and predicted current yrkiaVetbrin as predicted by the software
modules), Filially, theireat power consumption (P) was calculated for each of
two
main leg S
seuond afbilows.; P = V Rio X 'Rills X cos O. During atottraoy
calculation, only the accuracy of the calibrated regions were. considered. Yo:
aftr ai
certain tirne, most regions became calibrated and all Of the data were taken
into
consideration,
[0089] The
system was: :installed using two calibration device in each of the two
different phases of the houSe. Based on the calibration data; two different
flinctions:
Fi and for two: branch phases Pi and
respectively; wete created. During the
evaluation, the cosc of using just one calibrator in one of the phases. was
also
considered: Thus, for each home, the accuracy:was calculated for all three
possible
caseS: :using jtist one calibrator in Pi, using just
.:calibrator in A, and using both
calibrators in both phases. During all of the deployments, both calibrators
Were:
installed in both of the phases all the time, and both of the. functions Fi
and F. for Pi
and
',,tespectiVely: .s;,v ere recorded., but the laptop only used =Ft :to predict
current in
both P and P and to predict current in both Pi and
Table 3 shows the
summary of all the deployment results.
CA 02961194 2017-03-13
WO 2016/040883 PCT/US2015/049814
TABLE 3
M Deploy- Power Accuracy Using Both Accuracy Using Phase Accuracy Using
molt Range Phase Calibration i Calibration (%) Phase 2
Calibration
time (W
(hours) W) _________________________________________________________________
IRms cos Power IRms COSO Power Lois COSO Power
(A) (W) (A) (W) (A)
(W)
Hl 168 252 - 98;1 96.8 96.2
90.3 88.4 89.1 86.7 86.4 86.1
4952
112 48 396 - 95.6 97.7 96.7 89.2 84.7 86.6 91.3
85.9 87.7
6840
H3 48 598 - 96.9 94,3 95,8 92.9 89,3
90,3 91.7 88.8 89,3
6673
H4 48 707 - 97.2 95.3 96.0 90.4 85.5
87.4 85.3 81.0 84.9
12373
II5 48 441 - 94.2 93.9 94_0 86.6 84,0
85,7 87.2 82.5 84.7
5567
R6 48 311 - 93.3 90.8 91.2 87.4 82.1 83.1
88.1 86.4 86.7
4110
48 1920 96,8 91.6 95.2 811 78.3 80.1 84,3 81.1 82.9
5982
Aggreg 456 252 - 96.0 94.3 95.0 88.5 84.6
86.0 87.8 84.5 86.0
ate 12373
[0090] Table 3 shows that, through deployments in six homes and ()lip
industrial
building, the predicted RMS: Current and phase angles have art a(curacy of 96
Anii and
94..3%, respectively. 0 verall, the average accuracy across all the
deployments while
using tWo: calibrators is 951)% in real-world naturalistic energy use. This
shows the
robustnes pf our *'ystern hi predicting real power acro$ differew breaker
panels and
placement in real 'environment with natural electrical: activities: The
ovaluation also
c(mfirmed that the sygern doe$ not rely On the preOiSion of placement of the
sensing
deVic0 In all of the Cleployments in the 6Taluation, *ending on the structure
of the
breaker, the accuracy remained unaffected by the placement of the sensing
device.
[009.1] Turning ahead in the drawings. FIG, 12 illustrates a view of oswn
100
attached to circuit breaker 190 and electrical power infrastructure 1K Showing
various sensor placement positions. An experiment was conducted in a
controlled
CA 02961194 2017-03-13
WO 2016/040883 PCT/US2015/049814
environment to fluffier analyze the positioning effect on accuracy The
controlled
environment 1,vaS, Used in order to prevent the accuracy from being affected
by
different eleetriOal conditions. For the experiment a sensing deviee
sensing
device 110) was :placed at 6 different locations on breaker :panel
circuit brealw
panel 190), including position 1271,, position 1272, position 1271, position
1274,
position 1275, and position 127(, For each of the positions (O,gõ 1.271-12.74
E:a
controlled environment was maintained, as dMilled below
[00921
First, the environment Was made to be electriea4 quiet, with no appliances
being turned on or off, after which the baseline power' consumption (c) of the
environment was measured. Next, a 300 W load from the calibration device (e,g,
180) was, turned on 3 times on top of the baseline to create a prediction
function that
WOrkS from C Wto C+300 W. Next, a 100 NV fan Was turned On, Which brought the
baseline to c+100 W. Tiased On the prediction function that worked from C :to
(74300 W, the prediction function was expected to perform well for the 100 W
fan
load condition.
[0093]
After 10 Seconds, the 100 W fan loaci Was turned off. Next, a, 1300 W heater
was turned on, and the: same procedure as desefibed above using the 300 W load
from
the:calibration device oed
to calibrate t10 System from CH-1300 W tO CH-1600 W..
Finally, kee.ping the 000 W load on, a 5Q0 W rice, cooker. was turned on, and
the
same calibration procedure was used to calibrate from C+1800 W to Ct21.00 W.
TABLE 4
Position Accuracy CVO
171 97.7
171 98.2
173 97.6
174 97.1
175 97A
76 96.3
[00941
Table 4 shOws the accuracy in each of the 6 positions, For all positiOns on
the
breaker panel, the minimum accuracy was:90.3%, with an average accuracy of
97,4%,,
31
CA 02961194 2017-03-13
WO 2016/040883 PCT/US2015/049814
despite the non-ideal position of the sensing device. This experiment
confirmed that
the approach described herein works independent Of sensor position on the
breaker
panel with high accuracy:
[0095] The
longer that aõsystem (e..gõ: system 1(0 (Ms: 1-2õ 12) and/or:system 300
(FIG, 3)) runs in a õstructure, the-Wider and Mort.õtcettrate: the..
calibrated. :regions:
become, As the. transfer fiinotion. covers inoreofthe power 0Onsumption
rango:of the
structure:, the. calibration frequency further decreaws as-well.: .As suck.as
bag the
power consumption in the structure resides ithin the calibrated regiork the
Calibration 80.) can be
turned off with little effect on the-oVerall
accuracy:. .An additional experiment was perfOrm to verify this 11othesis,
[0096]
First., the system was run for 24 hottrs in a home with all the existing
appliances and the System calibrated :for the region between .247 W - 5344 W.
yielding an overall :accuracy 0957N, Next., the calibration deviCe .was turned
oft
and four new appliances vac turned on. The four new appliances were mo bulbs
of
125 W and 250 W. 01.1t fan of 1.0t) W, and a heater of 700 W. each having
different
load profiles than were used during :calibration, The appliances were. turned
on both
individually :and in combination while keeping the 104 .power consumption
within
the Calibrated range, This experiment resulted in a sinall drop in accuracy to
94,2.
This experithent confirmed that. even. with the calibration deviee turned off
and new
appliances being introduced, the overali accuracy does uotsignificantly
deteriorate as
long as the consumption reside s .With in the previOnsly Calibrated region,
Moreover,
this experiment alSo showg that the generated function dos not overfit based
on
existing appliances. Rather, it can be :fiexible mug:4 to Work with any new
appliance
as long .as the total consumption doesii0i exceed the calibrated region.
[0097]
power factor loads such as Switch Mode Power Supply. (SMPS)
appliances can consulate power in higher order harmonics: of 60 Nz power: The.
sampling rate 'used in the experiments as 9.6 kHz,. itt which the sensing
device can
capture harmonic contents up to.4.8 Icliz (79 harnioniCs).. AS: such, the
sensing deyiee
cart be similarto R. CT, in that both can need to b. e sampled at a high
enough !mil-1011g
rate to: capture ()Hz harmonksõ The differetioe is that the svtiSiTig device
serising device. 110 (FI(IIìsõ 1.-34. 12) described herein does not need to be
around a liVe.
wire., and hence can be much easier to install. Because the sensing device Is
not.
32
CA 02961194 2017-03-13
WO 2016/040883 PCT/US2015/049814
attached to a live: wire, it:can need to learn the transfer function to
convert the sensed
magnetic field to the actual current flo.NV
[009$1 An
experiment was performed to understand how mttch power in a home can
be attributed to the harmonics in order to design a sensing device that could
considerably reduce the engineering :costs by reducing the sampling rate and
data
bandwidth requirements. For a toieal home =over =a period of a month,. it was
determined that -the 60 'Hz harmonies contribute lo only 9.:15% of Otal.
power; which
suggests= that a simpler sensinia system could be designed .when only total
power.
measurentent is of concern to the end user, albeit with an approximately V15%:
loss in
accuracy;
[0099] To
further investigate the accurapy of the system described herein with low
power lattbr appliances, 4 Seven-day:deployment was performed in one of the
homes
witlh a. bias towards SMPS appliances ttWo televisions, tVo = laptops:, an
array of CFL
bulbs, a.n active air conditioner, and frequent use of a microwave)... This
resulted in a
small drop of lams and cos (1.4.cettracyõ :yielding 95.9% and 90.0%,
tespectively. The
total power .accuracy was: 92,", This experiment further Confirms that the
system
also works with low power factor loads:
[0100]
Proceeding to the next' drawing. FIG, i3 illustrates a flow chart for an
embodiment of a method 1300 of sensing elleetrical power being. prOVided to 4
Structure using a sensing: device, a.: calibration device,. and one or more
.processins
modules. Nlethod 1300 is merely exemplary and is not limited to the
embodiments:
presented herein,. :Method 1300 can be employed in many different embodiments
or
examples liot :speciaeally depicted or &Scribed herein in some embodiments,
the
procedures, the processes, andlor the activities of method 1300 can be
performed in
the order presented. In other embodiments, the procedureS, the processes,
and/or the
activities of the method 1300 can be perlbrmed in any other suitable order Tti
still
other embodiments, one or more ofthe procedures, the processes, andlor the
activities
in method 1300 can be combined .er skipped..
[0101] In
some embodiments, the sensing deVice can be similar or identical to sensing
device 110 (FIGs.
't2) In a number of embodiments, the calibration device can
be similar or identical to calibratiOn deviCe 180 (Ms. 1-2, 12) or calibration
(10,40:
33
CA 02961194 2017-03-13
WO 2016/040883 PCT/US2015/049814
380 (FIG. 3). In many embodiments, the one or more processing modules can be
similar or :identical to processing module -225 (FIGs. 2-3). In various
embodiments,
the sensing device can include one or .more Magnetic field sensors. The -
magnetic
field sensors can be similar or identical to magnetic field sensors, 111-114
(FIGs. 1-3).
In a number of embodiments, the sensing device can be attached to a panel of a-
circuit
breaker box. For example, the panel can be Similar or identical to panel. 196
(FiGs. 1,
.12), and the circuit breaker box.c,an.be similar or identical to circuit
breaker panel 190
(FIGs. I, 12). In various embodiments, the panel of the circuit break.er box
can
overlie at- least a part. of one or more Main electrical power supply lines
for an.
electrical power infrastructure of a structure. For exaniple, the one or more
main
electrical power supply lines can be similar or identical to main electrical
power
conductors 193, 94õ and/or 195 (FIG. 1). The electrical power infrastructure
can be.
similar or identical to electrical power infrastructure 160 (FIGs. 1, 12). In
some
embodiments, the calibration device- can include load unit. The load u.nit can
be
similar or identical to load unit 281 (FIGs. 2-3): In various -embodiments,
the
calibration device can be electrically coupled to the electrical power
infrastructure of
the structure. For example, the calibration device can be. electrical coupled
such as
via electrical plug 282 (FIGs. 2.3),
[0102] Referring to FIG 13; .method 1300 can include a block 1.301 of
autoinatically
calibrating the sensing device by determining a first -transfer .function. in
a piecewise
manner based on a .plurality ofordinary povver consumption 'changes in the.
structure
over a first time Period. in sortie embodimentsõ. the first transfer function
can. be
similar. or identical to function 400 (FIG. 4), function 500 (FIG. 5),
function 600 (FIG.
(i), and/or function 700 (FIG. 7)). In a number of embodiments, the ordinary
power
consumption changes can be the turning on or turning off of appliances in the
home
that is not dependent on or affected by calibration of the sensing device. In
various
embodiments, block 1301 can include iteratively predicting the first transfer
function
by the one or more processing modules based at least in part .on (a) measured
regions
of magnetic flux measured b the sensing,deviee before and after the load unit
of the
calibration device applies a load and (b) extrapolated regions outside the
measured
regions. The measured regions can be similar or identical to regions 403 (FIG.
4),
502 (FIG. 5, 7), 602 (Fla 6), 604 (FIG. 6), andlor 704 (FIG. 7). The
extrapolated
regions can be similar or identical to regions 403 (FIG. 4), 501 (FIGs. 5-7),
603 (FIG.
34
CA 02961194 2017-03-13
WO 2016/040883 PCT/US2015/049814
6), andlor 703 (FIG. 7). In various einbodiments bloc'k. 1301 can be perform
at least
in part by. neural netwOrk :module 222 FIGs. 2-3) andlor transfer fnnction
module 229
(FIGs. in
some: embodiments, the first time period can be at least 48 hours. In
other embodiments., the first time period can besreater than or less than 48
houts,. Tot
example, the first time period can be the amount of time required to talibrate
at leasta
predetermined percentage 'of the first tranSfer 'Unction over the range :Of
poSSible
usage in the structure.
[(103] in
certain embodiments, the load unit of the calibration device can be
conAgured to provide a Inf.ixinium load of 1.1O. tnette than 1000 W. In other
embodiments, the load unit of the calibration device can be: configured to -
provide a
inaNimum load of no more than 300 W. Iln yet other embodiments, the load unit
of
the calibration device can betOnfigured to provide a Maximum load oft inore
than
anothersuitable wattage. in -various embodiments, the load unit of the
calibration unit
can be configured to thaw no :more than four discrete loads. For example, the
load
unit can be cOnfigured to draw, 25 W. 100 W, 200 W, and 300 W loads. In other
embodimentS, the load imit attic...Calibration -unit can. het Onfiguted:t0
draW-no mote.:
than one, two, three, five, sîx, seven, eight, or another suitable number :of
disemte
loads.
[0104] ln
various einlx)diments, the load unit of the calibration device can be
configured to draw a range of loads. For example, the load unit can be
configured in
some eases; to drawg-tange011oads Of300 W, Sneh aÞ ftoin 0 W t3OO W. In some
embodiments,: :after the sensing device
calibrated, the one or more processing
modgJe* can be configured to use the sensing device to determine a range of
power
consumption measurements: For example,. the sensing device can be calibrated
in
some-cases to. Sense a range of power consumption measurements-Of .10
such as
WO 10 kW. In a number:ofembodimentS, the range of loads can be less than
the range of power consumption. -measurements. In :some embodiments, the
range: of.
loads can be less than 20% Of the range: Of power consumption Measurements. In
other embodiments, ..the range of loads: can be less:. than 11M of the range
of 'power
consumption :measurements, in yet other embodiments, .the range of loads can
be less.
than .3% or' .another suitable potetitzip pf the range of poWer...Consumption
measurements..
CA 02961194 2017-03-13
WO 2016/040883 PCT/US2015/049814
[01051 hi
some embodimentsõ block 130.1. of automatically calibrating the sensing
device by determining a :first transfer function in a: pietewiSe manner based
on a
plurality- Of ordinary power cOnsumption changes in the structure: over a
first tim.e
period can include a block. 1302 ofrraining a neural network model upot.
sensing .:a
triggering. event correspOading to: the plurality of ordinary power
c.onstimption
changes to determine: Ea secOnd transfer fimction.eonverting a magnetic field
change
measurement to a. current change value. In :many entodiments, the = neural
network
model can be trained by neural netWork module 222 (FIEls, 2,3)õ, as :described
above.
111 several embodimentsõ the triggering events can based on the ordinaq power
consumption changes Which result in a. sensed magnetic field within one or the
eAtlapoiated rtotls ln arious. embodiments, the second transfer kinction can
be
:similar or identical 'to predicted function 401 (FIG. .z9:.
many embodiments,. the
second transfer 'function can be learned by netual network module 222.(FIGs.
::0).õ in
a number of embodimem,..the block 0:02 can be implemented as shown in FIG. 14
and described below.
[0 l06] In
soine embodiments, Work 1301 of automatica4 :calibrating the sensing
device by. dOtermining......:a .first tram:kr function in a piece-wise manner
based on a
plurality of ordinary power. Constunption changes in the structure Over a
first time
:period can include a WO*. I.393 of updating the first transfer function with
the one. or
More processing modules 'based at least. Jn part on the sec:ond function. In
many
embodiments, the first transfer function Can be Configured tO.tOnYert a
Magnetic field
ineasUrement to. an absolute current value, In several embodimeatg, transfer
function
module 229. (EEGs., can
update the first transfer function based at least in part on
the second function, such as shown in Ficis. 4-7 and described above.
[01071 ln
soine embodiments, method 1300 can further include a block: 1304 of
determining. a :power consumption measurement using the one or more processing
modules based on one or more output signals: of the sensing device and the
fest
transfer function, The one or more output ..Signals Of the sensing device can
be similar
01 identioai to output sigivis :S.1õ
Sa,atidot..$4, .4s titeas:ilred by magnetic field
Sensors. 111-114 WIG& 1,3), respectively,. In some..embodirnents block 1304
can
include determining phase õ:difference betWcen an electrical current ::flowing
in the
one or more main electrical power supply hues and a. voltage .of the one or
more main
36
CA 02961194 2017-03-13
WO 2016/040883 PCT/US2015/049814
electrical power supply lines. In some embodiments, the phase difference can
be
calculated by phase angle .modttle -228 (FIGs. 2-3), as described above. In
some
embodiments, block 1304 can include determining a real power usage based at
least in
part on the phase difference. In many entbodiments, the power consumption
measurement and/or real power usage can be computed by power computation
module 22'7 (FIGs. 2-3), as described above.
[0108]
Turning to the next drawing, FIG. '14 illustrates a flow chart thr an
embodiment of a block 1302 of training the neural network model upon sensing
the
triggering event. Block -1302 is Merely exemplary and is not litnited to the
embodiments presented herein. Block 1302 can be employed in many different
embodiments or -examples not. specifically depicted or -described herein, In
some
embodiments, the procedures,. theprocesses, and/or the-activities-of block
13.02 can be.
performed in the order presented. In other embodiments, the procedures, the
processes, and/or the activities of the block .1302 can be performed in any
other
suitable order. In still other embodiments., one or more of the procedures,
the
processes, andlor the activities in block '1302 can be combined or skipped.
[01.09]
Refining to FIG. 14, block 1362 can include a block 1401 of upon sensing a
first change in magnetic flux corresponding to the triggering event, Measuring
one or
more first magnetic field values from the sensing OfNiCe;
tnany embodiments, the
first Change in magnetic flux corresponding: to the triggering event can be
sensed by.
the magnetic field. sensors. In a number of embodiments, the Magnetic field
sensors
can measure the first magnetic field values, which can be sitnilar -or
identical to 4,
$:2põS'3p, and/or sv, as described above: In various embodiments, the
triggering events
can include ordinary .power consumption changes in which the one or more first
magnetic field values Measured from the setting device correspond to an
extrapolated
region of the -first transfer function. Frit example, the extrapolated regions
can be
similar or identical to regions 403 (FIG. 4), .501 (FIGs. 5-7), 603 (FIG. 6),
and/or 703
(FIG. 7).
[0110] In
some embodiments, block 1302 additionally can include a block 1402 of
applying a predetermined load of the load unit of the calibration device to
the
electrical power infrastructure, .the predetermined load drawing a first.
current anxmnt.
The first current amount can be similar or identical to tch, as described
above.
37
CA 02961194 2017-03-13
WO 2016/040883 PCT/US2015/049814
[0111] In
various.- embodiments, block 1302: fitrther can include, a block. 1403. of
sensing one or more second tnagnetic fi.eld values ..of the sensing device
while the
predetermined load is applied to the electrical power infrastructure. In a.
number of
embodiments,. the magnetic field setisors :can measure the .second magnetic
field
values, which can be similar:or identical to.:&:õ.õ .S36. alidiorS4c.
[0 12] In
some embodiments, Mod': 1302.: additionally can include a block 14,04 of
USing the one or more processing modu1es4o vain the neural network model using
the
one or more -first inagnetic field values and the one or more second magnetic.
field
vhres as an input layer of the neural novork model., and the first current
amount as:
an output layer of the neural network model, for exampleõ the neural network
model
can be trained using neural network .module.:222::,.:as described above,
[0113]
Turning tij the nekt drawing,. FIG. :15 illustrates it flutV: chart for an
embodiment of a method 1500 of sensing electrical pOW:er being providecl. to-
a:
-structure using a sensing. device, &calibration device, and one or more
processing:
nodule. Method 1500 is merely exemplary and is not limited to the embodiments
presented herein. Nlethod 1500: can be employed in many different embodiments
or
examples nOt.:vecific.ally depicted or described herein. In some embodiments,
the
proCedures, the prOcesSesõariditit: the. activities of method 1500 can be
perfOrined in
the order presented. In other embodiments, the. procedures .:the processes;
and for the
activities of the method 1500 caii be perfOrmed in any other suitable orrler.
In still
other embodiments one or More Of the procedures, the: processes, 'arid*
theactiVities
in method 1.500 can be couibined or skipped.
[011,4] In
some embodiments, the::.aensing device .an be sitnilar or identiczil to sning
device 110 (FIGs:
.12).. In a number of enibodimentsõ the calibration device can
be similar or identical to calibration devied.:1:80.(FIGs.
.1):r calibration devide
3.80 (Fla .3). In many embodiments, the one or -more processing modules can
be.
similar or identical to processing II-iodide 225: (FIGS,. In
a number Of
enilx)dimentSõ, the sensing device can be attached to a panel Of it encint
breaker bOX,
For -example, the panel can Iv:similar or identical to panel 196 (FfOsi, 1õ.
12), and the
circuit breaker boxs.ean be similar or identical to circuit breaker .pane1.190
F1IGs 1,.
12), In various embodiments, the. panel of the circuit breaker box can
:Overlie at least
a part 0.f one or more main electrical pow.er supply lines for an electrical
power
38
CA 02961194 2017-03-13
WO 2016/040883 PCT/US2015/049814
infrastructure of a structure. For exampleõ LhC one or more .main electrical
power
supply lines .can be similar or identical to main electrical .pOwer -
conductors
and/or 95(FIG. .1.1. The electrical power infrastructure can be similar or
identicai to
electrical power infrastructure 160 (FlGs.
12), lin some embodiments, the
calibration:devieetan include a load. unit. The load unit can be similar or
identical .to
load unit 281 (Ms: 2-3.),
[0.115]
Referring to FIG. 15, method 1500 can include a block 1501 or determinini ,. a
current flowing in the one or more main electrical power supply lines based at
least:in.
part ori one or More outp4signals of the Sensing device,. in.:varions
embodiments, the
output signals can be similar or identical to output signals Sr, SI,S, andlor
S4. as
meustwi. 1.)), magnotio. fieid.:seusp.,(s: .111-11
FlGs. 1-3), respectively, Sla. various
embodiments the sensing devite .can include one or more magnetic field sensors
The magnetic field sensors can be similar or identical to .magnetic field
sensors 11'-
1.14. OFIcis.
several entodiments, the magnetic .field .sensors can be
configured to Measure a Magnetic flux produced by at least a part of the one
or more
main eleCtrical. power supply lineSand generate the One or mote output signalS
of the
sensing 404m based. on the. magnetic flux measured by the sensing device. In
number. (.5f. embodiments, the sensing device tan be devoid of being
electrically or.
physiCally .coupled to the one or nxor Main eleCtrical. power. .supply Iiiies,
fOr
example, the sensing device can be uncoupled, whether directly or indirectly,
to any.
of the .main electrical. power supply lines.
[01.1.6i In.
SOIlle embodiments, ..method 15Q0 .:additionaIly can include a block 1502 of
determining a phase difference between .tile ogrent flowing. in. the QM or
more main
electrical powet.:supply lines and a voltage of the one or .more main
electrical power
supply lines measured by the calibration unit In various embodimentsõ the
calibration
device: can be eleerrically coupled :to the electrical power infrastructure
::Of the
structure:. For example, the calibration device .can be electrical coupled
such. as: via:
electrical plug: 282 FG.2-3.); In some embodiments,. block 1502 can include
determininga ph.,*:of the current baSedona phase of the .magnetic flux
measured by
the sensing:device. FOrexample,..the. phae. can be tIc u fated by
pha8e:::angle modulo
228: (FICK .2,3),.:as':desCribed above.
39
CA 02961194 2017-03-13
WO 2016/040883 PCT/US2015/049814
[0117] In
some embodiments, ITICtbod 1500 can. optionally include a block 1503 of
determinin,g a. determining .a real. power usage based at least in part on
.the
differente,. In man:,./ _embodiments, the real power usage cart be computed by
power
computation module 2Z7 2-1), as described above,.
[0118]
Turning ahead in the drawings.. FIG. 16 illustrates an ekeinplary emboditnent
of computer sy$tem .1600, all of which or a portion of ANThiCh. rai b:e
Stiitable for
implementing the techniquesAessribed above. .As an example;,..a-different,
or:separate.
one of chassis 1602 (and its internal .components) can: be suitable for
implementing
the tectunoties described above. Furthermore; one or 1TiOke elements of
Cornputer
3,=ste-in. 1.60-0 teõgõ-, refreshing monitor 1606, keyboard 1 604õ and/or
.mouse 1610õ etc.)
can .allo be -appropriate fp.r implementing the techniques described: above.
Computer
system. .1600 comprises thasSis 1.602 containing one OT mote circuit boards
(not
shon) EJurversa SeriL .Bus (USB.) port 1:612, :Cortpqct 'Disc- Read-(nly
Memory
(CD-ROM) and/or Digital Video Disc: (1WD)
141:6, and bard -drive 1614. A
representative block .diagram of the elementS included on the Circuit hoards
inside
chassis .1602 is shown in HO.
.Central pro.cossing unit (M) 171Q in FIG. 1.7 is:
.coupled to .system hus-.1714- in 7.
ln .variou$ embodiments, Ihe architecture of
CPU 17:10 can be. compliant with any if a -variety .of. = commercially
distributed
architecture families,
[0119]
:Continuing-wit h FIG. 17,...system. bus 17.14 also is coupled to .memory
storage
unit 17.M3,:. .Where Memory .40..raae unit '1708 cornpriseS both read oily:
inernory
(ROM). and. random .acp0s: me.mory (RANO, ..Non-volatile. portions Of memory
storage unit 1.7.0$ or the. ROM can be ..encoded with a hoot .code
sognencesoitaWe &it
restoring computer system. 1600 .(FICE. 16) to a functional state after a
s.=,,,stent reset. In
addition, memory storage .unit 1.7.8 can comprise microcode such: aS. a Basic
Input-
Output $yStern (BIO$), hì. some examples, .tbe one or. :more
mernorystprage.units of.
the various embodiments disclosed herein can comprise memory storage .unit.
.17K a.
US.B-equipped electronic device. Such 0; an :external memory storage. unit
(not
.Sbown)...coupled to uniyersa1 seìtal hiis 1.1S.13) port :1.6:12 (FIGs.,
1647), hard driye
1.614 (FIG& 16-17), andfor CD-ROM or DVD drive. 1616 (F1Gt 1647).. In the same
or- different .exarriples-, .0te oxìe or MOIV: niethoty storage units. Of the
liittiOttS
.embodiments disclosed. herein. can .comprise an operating lystetn, .which can
be a
CA 02961194 2017-03-13
WO 2016/040883 PCT/US2015/049814
software program that manages the hardware and so.ftware resources of a
computer
and/or a computer .network.- The operating system can 'perform basic tasks
such as,
for example, controlling and allocating memory, prioritizing the procesSiniz
of
instructions, controlling input and output devices, facilitating networking,
and
managing files. Some examples -of conimon -operating systems can -comprise
Microsoft Windows operating system (OS), Mac OS, UNIX OS, and Linux
OS.
[01201 As used herein, "processor" and/or "processing module" means any
type of
computational circuit, Such as but not lithited to -a microprocessor, -a
thicrocontroller, a
controller, a complex instruction set computing (CISC) microprocessor, a
reduced
instruction set computing (RISC) microprocessor, a: very long. instruction
word
(VIAW) microprocessor, a -graphics processor, a digital signal processor, .or
any -other
type of processor or processing circuit capable of performing the desired.
fanctions. in
some examples, the one Of -more processors of -the various embodiments
disclosed
herein can comprise CPU 1710.
[0121] In the depicted embodiment of FIci 17, various 11/0 devices such as
disk
controller 1704, graphics adapter 1.724, video controller 1702, keyboard
adapter 1726,
:mouse adapter 1706,, network adapter 1720, and other II0 device's 1722 Can be-
coupled to system bus 1714. Keyboard. adapter 1.726 and -mouse adapter 1706
are
coupled to keyboard 1604 (FI(is. 16-17) and mouse 1610 (FIGs. 1647),
re.spectively,
of computer system 1600 (FIG.. 16). While graphics adapter 1724 and 'Acleo
controller 1702 are indicated as distinct units. .in FIG. 17, video controller
1702 can be
integrated. into graphics adapter 172-4, or vice- versa in other embodiments.
Video
controller 1702 is. suitable fOr refreshing monitor 1606 (FIGs. 16-17) to
display
images on a screen 1608 (FIG. 16) of computer system 1600 (FIG. 1(i). Disk
controller -1704 can. control hard drive 16.14 (FIGS. 16-)7), LISB port 1612
(FIGs. 16-
11), and CD-ROM drive .1616 (F1Gs. 16-17). In other enibodiments, distinct
units.
can be used to control each ofthese devices separately.
[0122] In some embodiments, network adapter 1720 can comprise and/or be
implemented as a WNW (wireless network interface controller) card. (not shown)
plugged or coupled to an expansion port (not shown) in cotnputer system 1600
(FIG.
16). In other embodiments, the WNIC card can be a wireless network card built
into
41
CA 02961194 2017-03-13
WO 2016/040883 PCT/US2015/049814
computer :system 1.600 (FIG. ,A
'wireless network. adapter can be built into
computer system 1600 by having Wire legs cOmmunication capabilities integrated
intO
the motherboard chipset not shown), or implemented via one or more dedicated
wireless communication chips (not shown), conne,cted through a PO (peripheral
component interconnector) or a PCI 0.(press 'bus of computer system 1600 (FIG.
16)
or USB port 161.2 (FIG. 16), In other embodiments., network- adapter 172o can
comprise and/or be implemented as a wired network interface controller card
(not
shown):
[0 1 2I1
Although many other:Components atOiriiiputer ;system 1600 (FIG. 1:6) are not
shown, such components and their interconnection are %Nell known to those (xf
ordinaryskill in the art: Accordingly, further details concerning the
con8truction and
composition of computer :system 1600 and the circuit boards inside chagsig
1602:
(M. 16) are not discussed herein.
[01241
When computer system 1600 in FiG. 16: is running:, program instructions.
'stored on a US[-equipped electronic device connected to USB port 1612, on. a
CD-
ROM or DVD in CD-ROM andfor DVD drive. 1616,: On bard drive 1614, or in
memory storage unit 1708 (FI(.. 17) are :executed by CK 1710 (FI(.. 1.7) A
portion
of the program instructions., Stored on these =devitesõtan be suitable for
carrying out at
leagt part of the techniques described a.bove::
[0125]
Although computer :system: 1600 is illustrated as a desktop computer in FIG.
16, there can be examples where computer System 1600 may take a different form
factor while still having functional elements similar to those described for
computer
system 1600. In some embodiments; Computer .*!-stem 1600 may comprise asingle
computer, a:single ki'Ver :or a cluster or collectiOn OlcOmputersOr servers,
Or a cloud
of computer Or **Mfg. Typically; a Cluster or collection a servers ean be.
used
when the demand on computer :system 1600 exceeds the reasonable capability of
a
single server or computer. in certain embodimentg, computer :system 1600 may
comprise a portable computer, such :as a. laptop= :computer. In certain other
embodiment8, computer:system 1600 may comprise a mobile cievim $11.C11 rti a
smart
phone. In eert2tin additional embodiments, computer system 1600 mlw comprise
an
embedded system,
42
CA 02961194 2017-03-13
WO 2016/040883 PCT/US2015/049814
[0i26,1 In many embodiments, the systems and methods described herein
present a
significant :improvement over past -work o.n wn-contact end-user deployable
sensor
for real time whole home power consumption. The techniques described can allow
users to place a single device consisting of magnetic pickups on the outside
0.f a
power or breaker panel -to. .infer whole home power consumption without the
need. for
professional installation of current transformers. This approach
advantageously does
not require precise placement on the breaker panel, which was a. key
requirement .in
previous approaches. By being independent of sensor placement, the techniques
described here can greatly reduces the installation effort required by end
users.
[0127] This approach can beneficially be enabled through a self-
calibration technique
using -a neural network that dynamically learns the transfer I-Unction -
despite the
placement of the sensor and the construction -()f. the- breaker panel. itself
This
approach advantageously can have the ability to infer real-time absolute real
power
consumption in a structure, based on the capability of predicting the absolute
c.urre.nt
waveform, unlike past solutions that have only been able to capture apparent
poWer.
[9128] In many embodiments, the self-calibrating techniques described
herein can
dynamically generates a multi-order transfer function between the magnetic
sensors
and the actual current across the entire range of power use in the home.
Instead of
mathernatiCally modeling. the transfer functio:n a priori,. the s.ystems and.
methods
described herein caii =USe a learning- approach. to generate this transfer
flinction. for
each home, which can be less stisceptible to differenceS in breaker panel
design .and
construction, Further, this approach.Catl remove the need for precise
placement &the
.sensor *cause it can takes. into -account "interference" from any branch
circuits,
Because .of -the in situ dynamic model, the systems described herein can be
not limited
to peifect placement of sensors.
[0129] In .many embodiments, the techniques described here can
beneficially use a
calibration device with a much smaller range. (0-300 W) than past approaches
by
leveraging the use ofthe natural electrical activity of a home throughout the -
day as a
part of the self-calibration sequence. The natural household electrical
activities can
advantageously be leveraged throughout-the day to generate a transfer function
-for the
entire range of power use in the home.
43
CA 02961194 2017-03-13
WO 2016/040883 PCT/US2015/049814
[0130] th
several embodiments, this approach can advantageously have the ability to
predict the phase angle between the current and yohage infer true power, which
is.
equivalent to predicting the waveform. itself and not just the magnitude. In
many
embodiments., the phase angle an advantageously be acidated using a single set
of
magnetic senSorS: In a number of embodiments, the self-calibrating approach
beneficially dnes:riot require precis e placement of the 30or on the breaker
panel and
uses the actual power use throughout a day ti:Yr calibration. In some
embodimentsõ.a.
neural network.-based learning approach can beneficially dynamically generate
a
multi-order magnetic sensor transfer function.
[0131] In
many embodiments, the high accuracy of the systems, method, techniques,
and approaches: described herein can be ideal for many applications,::such
erif,,,,rgy
disaggregation activity inference, and eco-.feedback while reducing the
barrier to
entry
.greatly simplifying the installation process.. Further, the approximately
54',14
maxitnum error in these approaches is much better than the commonly used IEEE
C57:13 C-clags: CTs (rated for <*10% error), Moreover:, their rated error for
such
CTs isgeneratlyat a low current level. Athigher current >2
NVhieb is Usually
expeeted in &whole-home scenario); the error ratnS are much higher, 'Very
'expensiVe
CTs with IL:',2% error are: used in specialized applications such as pretision
current
meaSnrements. But, as :described above.
ropire installation with acOesS to the
current-curOng eonductors. The systems :and method described herein can
advantageously allOw researchers in the energy: disaggregation COMmunity tO
easily
access power data ilia home without the need *professional installation.
[0132] In
several embodiments, the approach described herein can beneficially be
used to automatically calibrate a stiCk-on real-power meter,: which can be
installed by
the homeowner =tiithatit manual calibration. To assess the energy viability bf
using
the self-cal ibratiou approach, the energy dissipated by the calibrator gross
all of our
deployments was, calculated to be 0.181 kWh on average per home for the
calibration
to COthitigt tan the full transfer function, In some embodiments, the. W4tem
can be
calibrated each time the eonsumption falls into an un-calibrated region:. In
other
embodiments, the system can be calibrated only when the consumption falls
outside a
threshold region.
CA 02961194 2017-03-13
WO 2016/040883 PCT/US2015/049814
[0133]
Although the invention has been described with reference ,10: specific
embodiments, it will be understood by those skilled iri the art that Various
changeS
Way be made Without depaning from the spirit or scope of the invention.
Accordingly, the diSelosote of einhodiments of the iTIVetaion: is intended :to
be
illustrative of the scope of the invention and is not Uteed to be limiting, it
is
intended that the sope of the invention shall be limited only to the Otent
required by
the appended claims. For example, to one of ordinary=Skill in the art, it will
be readily
apparent that various elements of FIG& 1-17 may =be modified, tonlbined,
andkir:
interchanged, and that the foregoing discitssitin. Of Oertain Of these
embodiments doesi
not necessarily represent a complete description of all possible embodiments.
As-
anothet :example, ope or mote of the procedures, p-ote.$ses.,or acLivities of
FICis,13
13 may include different procedures, processes, andior activities and be
performed in
many different orders.
[Q134] All
elements claimed in any particular claim are essential to the einbodim.ent
claimed in that particular claim. Consequently, replacement of one or more
claimed
ellen-101AS NEIStittiteS teconstruction and not. tepait, Additionally,
benefits, Other
advantages, and solutions to problems have.: been described with regard to
.specifiQ
embodiments, The benefits,. advantages, solutions:to problerns:and any element
ot
elements that may cause oly benefit, ovantagg, 0 solution tO peeig or become
more
pronounced, however; are not to be :construed as critical, required, or
essential
features Or elementS . Of aity br all of the :claims, unless such benefits,
advantages,
solutions, Of elements are evresSlystated in such claim.
[Cl 35]
Moreover, embodiments and limitations disclosed herein are not dedicated to
the public under the doctrine of dedication if the embodiments dfor (1)
are not eXpteSSly claimed in the claims; and (2) are tir are potentially
equivalents e
express elements andior limitations in the claims under the doctrine
fequivalents.