Note: Descriptions are shown in the official language in which they were submitted.
CA 02977617 2017-08-23
WO 2016/135458 PCT/GB2016/050422
1
Al lulose Syrups
Field of the Invention
The present invention relates to allulose syrups, use of allulose syrups in
the manufacture
of food or beverage products, and food and beverage products made using the
allulose
syrups.
Background of the Invention
Many food and beverage products contain nutritive sweeteners such as sucrose
(generally
referred to as 'sugar' or 'table sugar), glucose, fructose, corn syrup, high
fructose corn
syrup and the like. Although desirable in terms of taste and functional
properties, excess
intake of nutritive sweeteners, such as sucrose, has long been associated with
an increase
in diet-related health issues, such as obesity, heart disease, metabolic
disorders and
dental problems. This worrying trend has caused consumers to become
increasingly
aware of the importance of adopting a healthier lifestyle and reducing the
level of nutritive
sweeteners in their diet.
In recent years, there has been a movement towards the development of
replacements for
nutritive sweeteners, with a particular focus on the development of low or
zero-calorie
sweeteners. One proposed alternative to nutritive sweeteners is allulose (also
known as D-
psicose). Allulose is known as a "rare sugar", since it occurs in nature in
only very small
amounts. It provides around 70% of the sweetness of sucrose, but only around
5% of the
calories (approximately 0.2 kcal/g). It may therefore essentially be
considered to be a
'zero calorie' sweetener.
In view of its scarcity in nature, production of allulose relies on the
epimerization of readily
available fructose. Ketose-3-epimerases can interconvert fructose and
allulose, and
various ketose-3-epimerases are known for carrying out this conversion.
CA 02977617 2017-08-23
WO 2016/135458 PCT/GB2016/050422
2
US patent no. 8,030,035 and PCT publication no. W02011/040708 disclose that D-
psicose can be produced by reacting D-fructose with a protein derived from
Agrobacterium
tumefaciens, and having psicose 3-epimerase activity.
US patent publication no. 2011/0275138 discloses a ketose 3-epimerase derived
from a
microorganism of the Rhizobium genus. This protein shows a high specificity to
D- or L-
ketopentose and D- or L-ketohexose, and especially to D-fructose and D-
psicose. This
document also discloses a process for producing ketoses by using the protein.
Korean patent no. 100832339 discloses a Sinorhizobium YB-58 strain which is
capable of
converting fructose into psicose (i.e. allulose), and a method of producing
psicose using a
fungus body of the Sinorhizobium YB-58 strain.
Korean patent application no. 1020090098938 discloses a method of producing
psicose
using E. coli wherein the E. coli expresses a polynucleotide encoding a
psicose 3-
epimerase.
Allulose is present in processed cane and beet molasses, steam treated coffee,
wheat
plant products and high fructose corn syrup. D-allulose is the C-3 epimer of D-
fructose
and the structural differences between allulose and fructose result in
allulose not being
metabolized by the human body to any significant extent, and thus having
"zero" calories.
Thus, allulose is thought to be a promising candidate as a replacement for
nutritive
sweeteners and as a sweet bulking agent, as it has essentially no calories and
is reported
to be sweet while maintaining similar properties to sucrose.
A convenient product form for allulose is an allulose syrup, i.e. a syrup
comprising allulose
and water. It has been found that allulose syrups may be susceptible to
degradation over
time (i.e. gradual reduction in allulose content), to color formation, to the
formation of
impurities (such as hydroxymethylfurfural ¨ HMF), to crystallization, and to
inadequate
microbial stability.
CA 02977617 2017-08-23
WO 2016/135458 PCT/GB2016/050422
3
An object of the present invention is to provide an allulose syrup that
addresses the above
problems.
Summary of the Invention
According to a first aspect, the present invention provides an allulose syrup
having a total
dry solids content of from 50% to 80% by weight, and comprising allulose in an
amount of
at least 80% by weight on a dry solids basis, wherein the pH of the syrup is
from 2.5 to 6Ø
In an embodiment, the allulose syrup has a total dry solids content of from
50% to 70% by
weight, and comprises allulose in an amount of at least 80% by weight on a dry
solids
basis, wherein the pH of the syrup is from 2.5 to 6Ø
In an embodiment, the allulose syrup has a total dry solids content of from
70% to 80% by
weight, and comprises allulose in an amount of at least 90% by weight on a dry
solids
basis, wherein the pH of the syrup is from 3.0 to 5Ø
In an embodiment, the total dry solids content of the allulose syrup is from
71% to 78% by
weight. In another embodiment, the total dry solids content of the allulose
syrup is from
71% to 73% by weight. In another embodiment, the total dry solids content of
the allulose
syrup is from 76% to 78% by weight. In another embodiment, the total dry
solids content of
the allulose syrup is from 50% to 71% by weight.
In an embodiment, the pH of the allulose syrup is from 3.5 to 4.5. In an
embodiment, the
pH of the allulose syrup is from 3.8 to 4.2.
In an embodiment, the allulose syrup comprises allulose in an amount of at
least 95% by
weight on a dry solids basis.
In an embodiment, the allulose syrup comprises less than 1000 ppm of HMF.
CA 02977617 2017-08-23
WO 2016/135458 PCT/GB2016/050422
4
In an embodiment, the allulose syrup comprises sulfur dioxide in an amount of
from 0.1 to
20 ppm.
In an embodiment, the allulose syrup comprises sulfur dioxide in an amount of
from 1 to 20
ppm.
In an embodiment, the allulose syrup comprises less than 10 parts per billion
of
isovaleraldehyde.
In an embodiment, the allulose syrup comprises less than 2 parts per billion
of 2-
aminoacetophenone.
In an embodiment, the allulose syrup further comprises one or more additives.
In an
embodiment, the one or more additives may include a stability-enhancing
additive. In an
embodiment, the one or more additives may include an anti-oxidant. In an
embodiment,
the one or more additives may include a buffer. In an embodiment, the one or
more
additive may be selected from the group consisting of ascorbic acid or salts
thereof;
isoascorbic acid (erythorbate) or salts thereof; citric acid or salts thereof;
acetic acid or
salts thereof; salts of bisulfite or metabisulfite; and tocopherol acetate.
In an embodiment, the shelf-life of the allulose syrup as defined by
maintaining an allulose
content of greater than 80% by weight on a dry solids basis is at least 3, 6,
9, 12 months,
or more than 12 months. In other words, an allulose content of greater than
80% by weight
on a dry solids basis is maintained when the allulose syrup is stored for at
least 3, 6, 9, 12
months, or more than 12 months.
In an embodiment, the shelf-life of the allulose syrup as defined by
maintaining an allulose
content of greater than 90% by weight on a dry solids basis is at least 3, 6,
9, 12 months,
or more than 12 months.
CA 02977617 2017-08-23
WO 2016/135458 PCT/GB2016/050422
In an embodiment, the shelf-life of the allulose syrup as defined by
maintaining an allulose
content of greater than 95% by weight on a dry solids basis is at least 3, 6,
9, 12 months,
or more than 12 months.
5 According to a further aspect, the present invention provides a process
for preparing an
allulose syrup according to the first aspect. The process for preparing the
allulose syrup
includes:
- providing an allulose syrup;
- adjusting the dry solids content of the allulose syrup such that it is
from 50% to
80% by weight;
- adjusting the allulose content of the allulose syrup such that allulose
is present in
an amount of at least 80% by weight on a dry solids basis; and
- controlling the pH of the allulose syrup so that it is from 2.5 to 6Ø
In an embodiment, the process includes:
- providing an allulose syrup;
- adjusting the dry solids content of the allulose syrup such that it is
from 60% to
80% by weight;
- adjusting the allulose content of the allulose syrup such that allulose
is present in
an amount of at least 80% by weight on a dry solids basis; and
- controlling the pH of the allulose syrup so that it is from 2.5 to 6Ø
In an embodiment, the process includes:
- providing an allulose syrup;
- adjusting the dry solids content of the allulose syrup such that it is
from 70% to
80% by weight;
- adjusting the allulose content of the allulose syrup such that allulose is
present in
an amount of at least 90% by weight on a dry solids basis; and
- controlling the pH of the allulose syrup so that it is from 3.0 to 5Ø
In an embodiment of the process, the dry solids content is from 70 to 78% by
weight, the
allulose content of the syrup is at least 90% by weight on a dry solids basis,
and the pH is
controlled to between 3.5 to 4.5.
CA 02977617 2017-08-23
WO 2016/135458 PCT/GB2016/050422
6
According to a further aspect, the present invention provides the use of the
allulose syrup
according to the first aspect in the preparation of a food or beverage
product.
According to a further aspect, the present invention provides a food or
beverage product
comprising an allulose syrup according to the first aspect and at least one
additional food
or beverage ingredient.
In an embodiment, the at least one additional food or beverage ingredient
includes at least
one ingredient selected from the group consisting of flavorants, colorants,
sweeteners
other than allulose, dietary fibers, acidulants, water, and combinations
thereof.
In an embodiment, the allulose syrup comprises 50 to 80% dry solids by weight,
and
greater than 80% allulose on a dry solids basis, a measured pH between 2.5 and
6.0 and
a shelf life of at least 3 months.
In an embodiment, the allulose syrup comprises 60 to 80% dry solids by weight,
and
greater than 90% allulose on a dry solids basis, a measured pH between 3.0 and
5.0 and
a shelf life of at least 3 months.
In an embodiment, the allulose syrup comprises 70 to 80% dry solids by weight,
and
greater than 90% allulose on a dry solids basis, a measured pH between 3.0 and
5.0 and
a shelf life of at least 3 months.
Brief Description of the Drawings
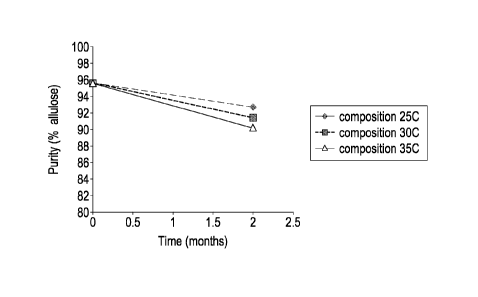
Figure 1 shows how the purity of an allulose syrup composition (initial pH
3.4) changes
over time at 25 C, 30 C and 35 C.
Figure 2 shows how the color of an allulose syrup composition (initial pH 3.4)
changes
over time at 25 C, 30 C and 35 C.
CA 02977617 2017-08-23
WO 2016/135458 PCT/GB2016/050422
7
Figure 3 shows how the amount of HMF in an allulose syrup composition (initial
pH 3.4)
changes over time at 25 C, 30 C and 35 C.
Figure 4 shows how the pH of an allulose syrup composition (initial pH 3.4)
changes over
time at 25 C, 30 C and 35 C. It should be noted that the data points for
storage at 25 C
are the same as for storage at 30 C.
Figure 5 shows how the pH of an allulose syrup composition (initial pH 4.0)
changes over
time at 4 C, 25 C, 35 C and 50 C.
Figure 6 shows how the color of an allulose syrup composition (initial pH 4.0)
changes
over time at 4 C, 25 C, 35 C and 50 C.
Figure 7 shows how the amount of HMF in an allulose syrup composition (initial
pH 4.0)
changes over time at 4 C, 25 C, 35 C and 50 C.
Figure 8 shows how the purity of an allulose syrup composition (initial pH
4.0) changes
over time at 4 C, 25 C and 35 C.
Figure 9 shows how the pH of the allulose syrup product samples of Example 2
changes
over time at 40 C.
Figure 10 shows how the pH of the allulose syrup product samples of Example 2
changes
over time at 50 C.
Figure 11 compares change in the pH of the allulose syrup product samples of
Example 2
(starting pH 4.0) at 50 C with an allulose syrup composition with an initial
pH of 3.9.
Figure 12 shows how the allulose purity of the allulose syrup product samples
of Example
2 changes over time at 40 C.
CA 02977617 2017-08-23
WO 2016/135458 PCT/GB2016/050422
8
Figure 13 shows how the allulose purity of the allulose syrup product samples
of Example
2 changes over time at 50 C.
Figure 14 shows how the color of the allulose syrup product samples of Example
2
changes over time at 40 C.
Figure 15 shows how the color of the allulose syrup product samples of Example
2
changes over time at 50 C.
Figure 16 shows how the HMF content of the allulose syrup product samples of
Example 2
changes over time at 40 C.
Figure 17 shows how the HMF content of the allulose syrup product samples of
Example 2
changes over time at 50 C.
Figure 18 shows how the allulose content of the allulose syrup product samples
of
Example 5 changes over time at different temperature, pH and DS content.
Figure 19 shows how the allulose content of the allulose syrup product samples
of
Example 5 changes over time at 25 C.
Figure 20 shows how the allulose content of the allulose syrup product samples
of
Example 5 changes over time at 35 C.
Figure 21 shows how the HMF content of the allulose syrup product samples of
Example 5
changes over time at 25 C.
Figure 22 shows how the HMF content of the allulose syrup product samples of
Example 5
changes over time at 35 C.
Figure 23 shows how the color of the allulose syrup product samples of Example
5
changes over time at 25 C.
CA 02977617 2017-08-23
WO 2016/135458 PCT/GB2016/050422
9
Figure 24 shows how the color of the allulose syrup product samples of Example
5
changes over time at 35 C.
Figure 25 shows how the pH of the allulose syrup product samples of Example 6
over time
is affected by additives.
Figure 26 shows how the allulose purity of the allulose syrup product samples
of Example
6 over time is affected by additives.
Figure 27 shows how the allulose purity of the allulose syrup product samples
of Example
6 over time is affected by the addition of ascorbate and isoascorbate.
Figure 28 shows how the allulose purity of the allulose syrup product samples
of Example
6 over time is affected by the addition of citrate and acetate.
Figure 29 shows how the HMF content of the allulose syrup product samples of
Example 6
over time is affected by the addition of ascorbate and isoascorbate.
Figure 30 shows the change in allulose content at 6 months at 77% DS as
modelled using
DOE software according to Example 7 (each contour line represents a 2%
decrease in
change in allulose content from time 0).
Figure 31 shows the change in allulose content at 6 months at 25 C as
modelled using
DOE software according to Example 7.
Figure 32 shows color change at 6 months at 77% DS as modelled using DOE
software
according to Example 7.
Figure 33 shows color change at 6 months at 25 C as modelled using DOE
software
according to Example 7.
CA 02977617 2017-08-23
WO 2016/135458 PCT/GB2016/050422
Figure 34 shows HMF formation at 6 months and 77% DS as modelled using DOE
software according to Example 7.
Detailed Description
5
The present invention is based on the finding that allulose syrups with
improved storage
stability can be prepared by careful control of certain parameters.
The term "allulose" as used herein refers to a monosaccharide sugar of the
structure
10 shown as a Fischer projection in below Formula I. It is also known as "D-
psicose":
CH2OH
C=0
H¨C¨OH
H¨C¨OH
H¨C¨OH
Formula (I) CH2OH
According to a first aspect, the present invention provides an allulose syrup
having a total
dry solids content of from 50% to 80% by weight, and comprising allulose in an
amount of
at least 80% by weight on a dry solids basis, wherein the pH of the syrup is
from 2.5 to 6Ø
According to an embodiment, the allulose syrup has a total dry solids content
of from 70%
to 80% by weight, and comprises allulose in an amount of at least 90% by
weight on a dry
solids basis, wherein the pH of the syrup is from 3.0 to 5Ø
The total dry solids content of the allulose syrup is from 50% to 80% by
weight. For
example, the total dry solids content may be 50%, 51%, 52%, 53%, 54%, 55%,
56%, 57%,
CA 02977617 2017-08-23
WO 2016/135458 PCT/GB2016/050422
11
58%, 59%, 60%, 61%, 62%, 63%, 64%, 65%, 66%, 67%, 68%, 69%, 70%, 71%, 72%,
73%, 74%, 75%, 76%, 77%, 78%, 79% or 80% by weight, as well as all
intermediate
values.
In an embodiment, the total dry solids content of the allulose syrup is from
70% to 80% by
weight. For example, the total dry solids content may be 70%, 71%, 72%, 73%,
74%,
75%, 76%, 77%, 78%, 79% or 80% by weight, as well as all intermediate values.
In an
embodiment, the total dry solids content of the allulose syrup is from 71% to
78% by
weight. In another embodiment, the total dry solids content of the allulose
syrup is from
71% to 73% by weight. In another embodiment, the total dry solids content of
the allulose
syrup is from 76% to 78% by weight.
In another embodiment, the total dry solids content of the allulose syrup is
from 50% to
70% by weight.
It has been found that, although the compositional stability of the allulose
syrup is
generally highest towards the lower end of the total dry solids content range
of the
invention, microbial stability is generally highest towards the higher end of
the total dry
solids content range of the invention. Accordingly, the selection of a
suitable total dry
solids content within the range of the invention can be made depending on the
key
attribute for the particular application.
The pH of the allulose syrup is from 2.5 to 6Ø For example, the pH of the
syrup may be
2.5, 2.6, 2.7, 2.8, 2.9, 3.0, 3.1, 3.2, 3.3, 3.4, 3.5, 3.6, 3.7, 3.8, 3.9,
4.0, 4.1, 4.2, 4.3, 4.4,
4.5, 4.6, 4.7, 4.8, 4.9, 5.0, 5.1, 5.2, 5.3, 5.4, 5.5, 5.6, 5.7, 5.8, 5.9 or
6.0, as well as all
intermediate values.
In an embodiment, the pH of the allulose syrup is from 3.0 to 5Ø For
example, the pH of
the syrup may be 3.0, 3.1, 3.2, 3.3, 3.4, 3.5, 3.6, 3.7, 3.8, 3.9, 4.0, 4.1,
4.2, 4.3, 4.4, 4.5,
4.6, 4.7, 4.8, 4.9 or 5.0 as well as all intermediate values.
CA 02977617 2017-08-23
WO 2016/135458 PCT/GB2016/050422
12
In an embodiment, the pH of the allulose syrup is from 3.5 to 4.5. For
example, the pH of
the syrup may be 3.5, 3.6, 3.7, 3.8, 3.9, 4.0, 4.1, 4.2, 4.3, 4.4 or 4.5 as
well as all
intermediate values. In an embodiment, the pH of the allulose syrup is from
3.8 to 4.2. In
an embodiment, the pH of the allulose syrup is about 4Ø
It has been found that allulose degradation and HMF formation can be minimized
by
increasing the pH, but that undesirable color formation is also promoted by
increasing the
pH. It has been found that the pH according to the present invention is
optimal both in
terms of minimizing allulose degradation and HMF formation, and minimizing
undesirable
color formation.
It is surprising that allulose syrups have been found to be most stable in the
above range
of pH, since monosaccharide syrups have previously been found to be most
stable at
lower pH, e.g. between 2.2 and 3.0 (Smirnov V, Geispits K; Stability of
Monosaccharides
in Solutions of Different pH; BioChem. Moscow, 1957, 22:849-854).
The allulose syrup comprises allulose in an amount of at least 80% by weight
on a dry
solids basis (i.e., of the total dry solids present in the allulose syrup, at
least 80% by weight
is allulose). For example, the allulose syrup may comprise allulose in an
amount of 80%,
81%, 82%, 83%, 84%, 85%, 86%, 87%, 88%, 89%, 90%, 91%, 92%, 93%, 94%, 95%,
96%, 97%, 98%, 99% or 100% by weight on a dry solids basis, as well as all
intermediate
values.
In an embodiment, the allulose syrup comprises allulose in an amount of at
least 90% by
weight on a dry solids basis (i.e., of the total dry solids present in the
allulose syrup, at
least 90% by weight is allulose). For example, the allulose syrup may comprise
allulose in
an amount of 90%, 91%, 92%, 93%, 94%, 95%, 96%, 97%, 98%, 99
A or 100% by weight
on a dry solids basis, as well as all intermediate values. In an embodiment,
the allulose
syrup comprises allulose in an amount of at least 95% by weight on a dry
solids basis.
In an embodiment, the allulose syrup comprises less than 1000 ppm of HMF
(hydroxymethylfurfural). For example, the allulose syrup may comprise less
than 900
CA 02977617 2017-08-23
WO 2016/135458 PCT/GB2016/050422
13
ppm, less than 800 ppm, less than 700 ppm, less than 600 ppm, less than 500
ppm, less
than 400 ppm, less than 300 ppm, less than 200 ppm or less than 100 ppm of
HMF. In
certain embodiments, the allulose syrup comprises more than 0.1 ppm and less
than 1000
ppm of HMF (hydroxymethylfurfural), for example more than 0.1 ppm and less
than 900
ppm, more than 0.1 ppm and less than 800 ppm, more than 0.1 ppm and less than
700
ppm, more than 0.1 ppm and less than 600 ppm, more than 0.1 ppm and less than
500
ppm, more than 0.1 ppm and less than 400 ppm, more than 0.1 ppm and less than
300
ppm, more than 0.1 ppm and less than 200 ppm, or more than 0.1 ppm and less
than 100
ppm.
In an embodiment, the allulose syrup comprises sulfur dioxide in an amount of
from 0.1 to
ppm.
In an embodiment, the allulose syrup comprises sulfur dioxide in an amount of
from 1 to 20
15 ppm.
In an embodiment, the allulose syrup comprises less than 10 parts per billion
of
isovaleraldehyde.
20 In an embodiment, the allulose syrup comprises less than 2 parts per
billion of 2-
aminoacetophenone.
In an embodiment, the allulose syrup further comprises one or more additives.
In an
embodiment, the one or more additives may include a stability-enhancing
additive. In an
embodiment, the one or more additives may include an anti-oxidant. In an
embodiment,
the one or more additives may include a buffer. The incorporation of a buffer
in the
allulose syrup maintains the pH of the allulose within the desired range for a
longer period
of time, such that storage stability is further enhanced. In an embodiment,
the stability
enhancing additives are included at around 0.01-2.0% by weight based on the
total weight
of the allulose syrup.
CA 02977617 2017-08-23
WO 2016/135458 PCT/GB2016/050422
14
In an embodiment, the stability-enhancing additive may be selected from the
group
consisting of ascorbic acid and salts thereof; isoascorbic acid (erythorbate)
and salts
thereof; citric acid and salts thereof; acetic acid and salts thereof; and
salts of bisulfite and
metabisulfite; and tocopherol acetate. In the case of salts, suitable salts
include alkali
metal salts, particularly sodium and potassium salts, and especially sodium
salts. Specific
examples of stability-enhancing additives useful in the present invention
include ascorbate,
isoascorbate, sodium citrate, sodium acetate, tocopherol acetate and
metabisulfite. In an
embodiment, the stability enhancing additives are included at around 0.2% by
weight
based on the total weight of the allulose syrup in the case of ascorbic acid
or salts thereof;
isoascorbic acid (erythorbate) or salts thereof; citric acid or salts thereof;
acetic acid or
salts thereof; and tocopherol acetate. In an embodiment, the stability
enhancing additives
are included at around 0.02% by weight based on the total weight of the
allulose syrup in
the case of salts of bisulfite or metabisulfite.
The concentration of buffer included in the allulose syrup may be around 0.01-
2.0% by
weight based on the total weight of the allulose syrup. The concentration of
buffer
included in the allulose syrup may be around 0.2% by weight based on the total
weight of
the allulose syrup in the case of ascorbic acid or salts thereof; isoascorbic
acid
(erythorbate) or salts thereof; citric acid or salts thereof; acetic acid or
salts thereof; and
tocopherol acetate. The concentration of buffer included in the allulose syrup
may be
around 0.02% by weight based on the total weight of the allulose syrup in the
case of salts
of bisulfite or metabisulfite.
The allulose syrup of the present invention has a shelf-life of at least 3
months. In
particular, the allulose syrup of the present invention maintains an allulose
content of at
least 80% on a dry solids basis for at least 3 months, preferably at least 6
months, at least
9 months, at least 12 months or more than 12 months.
The allulose syrup of the present invention has a shelf-life of at least 3
months. In
particular, the allulose syrup of the present invention maintains an allulose
content of at
least 90% on a dry solids basis for at least 3 months, preferably at least 6
months, at least
9 months, at least 12 months or more than 12 months.
CA 02977617 2017-08-23
WO 2016/135458 PCT/GB2016/050422
The allulose syrup of the present invention preferably has a shelf-life of at
least 6 months.
In particular, the allulose syrup of the present invention preferably
maintains an allulose
content of at least 95% on a dry solids basis for at least 6 months,
preferably at least 9
5 months, at least 12 months or more than 12 months. Allulose content is
measured by
standard HPLC methods such as the Sacch.03 method set forth by the corn
refiners
association (http://com org/wp-content/uploads/2009/12/SACCH .03. pdf).
Preferred ranges for the dry solids include 60-80%, 70-80%, 71-78%, 71-73% or
76-78%.
10 Preferred pH ranges are between 3.5 and 4.5 or between 3.8 and 4.2.
Preferred allulose
content is greater than 95% allulose on a dry solids basis. Preferably, the
syrup has a
limited amount of the following compounds: less than 1000 ppm
hydroxymethylfurfural
(HMF); sulphur dioxide at a concentration of less than 20 parts per million;
isovaleraldehyde at a measured concentration of less than 10 parts per
billion; and 2-
15 aminoacetophenone at a concentration of less than 2 parts per billion.
Optionally, the
syrup can have any of the following compounds alone or in combination thereof:
a stability
enhancing ingredient including one or more of: 1) ascorbic acid or salts
thereof, 2)
isoascorbic acid (erythorbate) or salts thereof, 3) citric acid or salts
thereof, 4) acetic acid
or salts thereof, 5) salts of bisulfite or metabisulfite, and/or 6) tocopherol
acetate. The
allulose syrup may have a concentration of greater than 90% (e.g. greater than
95%) with
a shelf-life of at least 3, 6, 9, 12 months, or more than 12 months.
According to a further aspect, the present invention provides a process for
preparing an
allulose syrup. The process comprises: providing an allulose syrup; adjusting
the dry
solids content of the allulose syrup such that it is from 50% to 80% by
weight; adjusting the
allulose content of the allulose syrup such that allulose is present in an
amount of at least
80% by weight on a dry solids basis; and controlling the pH of the allulose
syrup so that it
is from 2.5 to 6Ø
According to an embodiment, the process for preparing an allulose syrup
comprises:
providing an allulose syrup; adjusting the dry solids content of the allulose
syrup such that
it is from 60% to 80% by weight; adjusting the allulose content of the
allulose syrup such
CA 02977617 2017-08-23
WO 2016/135458 PCT/GB2016/050422
16
that allulose is present in an amount of at least 80% by weight on a dry
solids basis; and
controlling the pH of the allulose syrup so that it is from 2.5 to 6Ø
According to an embodiment, the process for preparing an allulose syrup
comprises:
providing an allulose syrup; adjusting the dry solids content of the allulose
syrup such that
it is from 70% to 80% by weight; adjusting the allulose content of the
allulose syrup such
that allulose is present in an amount of at least 90% by weight on a dry
solids basis; and
controlling the pH of the allulose syrup so that it is from 3.0 to 5Ø
According to an embodiment, the process for preparing an allulose syrup
comprises:
providing an allulose syrup; adjusting the dry solids content of the allulose
syrup such that
it is from 70% to 78% by weight; adjusting the allulose content of the
allulose syrup such
that allulose is present in an amount of at least 90% by weight on a dry
solids basis; and
controlling the pH of the allulose syrup so that it is from 3.5 to 4.5.
The process optionally comprises removing or avoiding the production of HMF to
limit the
content to less than 1000 ppm, or more preferably less than 100 ppm. The
process
optionally comprises removing or avoiding the production of isovaleraldehyde
to limit the
content to less than 10 parts per billion. The process optionally comprises
removing or
avoiding the production of aminoacetophenone to limit the content to less than
2 parts per
billion. The process optionally comprises adding one or more additives to the
syrup.
These procedures need not be carried out in the same order recited above (for
example,
the pH adjustment may be performed before adjustment of the dry solids
content).
The description of the embodiments of the allulose syrup herein applies
mutatis mutandis
to the process for preparing an allulose syrup.
According to a further aspect, the present invention provides the use of the
allulose syrup
according to the first aspect in the preparation of a food or beverage
product, as well as
food or beverage products made using the sweetener syrup.
CA 02977617 2017-08-23
WO 2016/135458 PCT/GB2016/050422
17
Food or beverage products which may be contemplated in the context of the
present
invention include baked goods; sweet bakery products (including, but not
limited to, rolls,
cakes, pies, pastries, and cookies); pre-made sweet bakery mixes for preparing
sweet
bakery products; pie fillings and other sweet fillings (including, but not
limited to, fruit pie
fillings and nut pie fillings such as pecan pie filling, as well as fillings
for cookies, cakes,
pastries, confectionary products and the like, such as fat-based cream
fillings); desserts,
gelatins and puddings; frozen desserts (including, but not limited to, frozen
dairy desserts
such as ice cream - including regular ice cream, soft serve ice cream and all
other types of
ice cream - and frozen non-dairy desserts such as non-dairy ice cream, sorbet
and the
like); carbonated beverages (including, but not limited to, soft carbonated
beverages); non-
carbonated beverages (including, but not limited to, soft non-carbonated
beverages such
as flavored waters and sweet tea or coffee based beverages); beverage
concentrates
(including, but not limited to, liquid concentrates and syrups as well as non-
liquid
'concentrates', such as freeze-dried and/or powder preparations); yogurts
(including, but
not limited to, full fat, reduced fat and fat-free dairy yogurts, as well non-
dairy and lactose-
free yogurts and frozen equivalents of all of these); snack bars (including,
but not limited
to, cereal, nut, seed and/or fruit bars); bread products (including, but not
limited to,
leavened and unleavened breads, yeasted and unyeasted breads such as soda
breads,
breads comprising any type of wheat flour, breads comprising any type of non-
wheat flour
(such as potato, rice and rye flours), gluten-free breads); pre-made bread
mixes for
preparing bread products; sauces, syrups and dressings; sweet spreads
(including, but not
limited to, jellies, jams, butters, nut spreads and other spreadable
preserves, conserves
and the like); confectionary products (including, but not limited to, jelly
candies, soft
candies, hard candies, chocolates and gums); sweetened breakfast cereals
(including, but
not limited to, extruded (kix type) breakfast cereals, flaked breakfast
cereals and puffed
breakfast cereals); and cereal coating compositions for use in preparing
sweetened
breakfast cereals. Other types of food and beverage product not mentioned here
but
which conventionally include one or more nutritive sweetener may also be
contemplated in
the context of the present invention.
An allulose syrup in accordance with the present invention may be used in
combination
with one or more other food or beverage ingredients, including any of the food
and
CA 02977617 2017-08-23
WO 2016/135458 PCT/GB2016/050422
18
beverage ingredients known in the art. Such additional food and beverage
ingredients
include, but are not limited to, flavorants, colorants, sweeteners other than
allulose
(including other sugars such as sucrose, fructose, allose, tagatose and other
rare sugars,
synthetic high intensity sweeteners such as sucralose, acesulfame K,
saccharin,
aspartame and the like, natural high intensity sweeteners such as Stevie and
Monk Fruit
Extract sweeteners and the terpene glycosides present therein, and the like),
dietary fibers
(including soluble dietary fibers such as soluble corn fiber and
polydextrose), acidulants,
water, and the like.
Specific illustrative examples of food and beverage products which may be
prepared using
an allulose syrup in accordance with the invention include, but are not
limited to:
a beverage, such as a carbonated or non-carbonated beverage or a juice drink
comprising allulose syrup and one or more synthetic high intensity sweeteners
such as
sucralose;
a beverage, including a beverage concentrate, comprising an allulose syrup, a
natural high intensity sweetener (such as a Stevie sweetener), and a dietary
fiber (e.g., a
soluble dietary fiber, such as a soluble corn fiber), and an acidulent (e.g.,
citric acid);
a yogurt, such as a Greek yogurt, comprising allulose syrup (which may be free
of
any artificial sweeteners);
a frozen dessert, comprising allulose syrup, a dietary fiber (e.g., a soluble
dietary
fiber, such as a soluble corn fiber), a natural high intensity sweetener (such
as a Stevie
sweetener and/or a Monk Fruit Extract sweetener), and a food system
stabilizer;
a cookie, such as a chocolate chip cookie, comprising an allulose syrup and a
corn
starch;
a confectionary, such as a gummy candy, comprising an allulose syrup and a
natural high intensity sweetener (e.g., a Stevie sweetener); and
a flavored syrup, such as a maple-flavored syrup, comprising an allulose
syrup,
fructose, and an acidulent (e.g., citric acid).
CA 02977617 2017-08-23
WO 2016/135458 PCT/GB2016/050422
19
Examples:
The invention will now be further described and illustrated by means of the
following
examples, it being understood that these are intended to explain the
invention, and in no
way to limit its scope.
Summary
It was determined from stability experiments that allulose syrup produced at
one set of
conditions has a more rapid purity degradation than allulose syrup produced at
another set
of conditions (Example 1). The main difference between these syrups was
initial pH. An
accelerated stability study (Example 2) was carried out with pH values around
the narrow
range of predicted stability and also with additives and at different % dry
solids. It was
determined that 71-77% dry solids and a pH of around 3.8 to 4.2 provided
optimum
storage stability. Microbial stability was also investigated (Example 2). The
allulose syrup
was very stable at 77% and less stable at 72%. The results could be used to
predict a low
limit on microstability of 60% DS. Another stability study was carried out at
ambient
storage temperatures with pH values and dry solids content around the ranges
of
predicted stability (Example 3). Finally, a more detailed study of additives
with respect to
stability at two different dry solids levels and optimal pH was carried out
(Example 4).
Some of the additives reduced the change in color, composition and HMF.
Example 1.
Each sample consisted of 3500 mL of allulose syrup in a 4 quart (4.54 liter)
square plastic
container. The sampling was carried out at 0 and 2 months.
Analytical
Samples were analyzed using methods known to those skilled in the art. The
allulose
composition was determined by standard HPLC methods, such as the Sacch.03
method
set forth by the corn refiners association
(http://corn.org/wp-
CA 02977617 2017-08-23
WO 2016/135458 PCT/GB2016/050422
content/uploads/2009/12/SACCH.03.pdf). DS was measured by refractive index, pH
was
measured at a dilution resulting in less than 40% solids, color was analyzed
by measuring
the absorbance of the syrup at 450nm and subtracting the background at 600nm
and
dividing the result by the path length of the cuvette.
HMF, isovaleraldehyde,
5 aminoacetophenone, were analyzed using reverse phase HPLC with UV
detection.
The purity of the allulose composition dropped significantly in the course of
2 months, as
shown in Figure 1. There was a clear trend that higher temperature resulted in
a greater
change in composition.
Changes in color were minor (Figure 2). At 35 C the syrup did increase in
color more
rapidly. However, at 25 and 30 C, the color change was minimal and did not
exceed 2.
The HMF content increased in each sample over 2 months (Figure 3). The content
of
HMF in the sample at 35 C increased to 180 ppm HMF after 2 months. The
content of
HMF in the 25 C and 30 C samples was lower.
The pH value decreased similarly over 2 months for each sample. It is
noteworthy that the
pH started lower in this prepared material than previously studied material
which started at
a pH of 4.0 and which had improved stability, as discussed below.
The main difference in composition between the two products is an initial pH
difference of
approximately 0.6 pH units. Additionally, pH in the first study remained above
pH 3.5 for
the first 5 months at 4 C, 25 C and 35 C (Figure 5), whereas, in the second
study, pH
was always below 3.5 (Figure 4). Color development (Figure 2) was lower in the
second
study at 25 C for two months (0.67) compared to the first study (Figure 6) at
the same
time and temp (1.32).
CA 02977617 2017-08-23
WO 2016/135458 PCT/GB2016/050422
21
Table 1: Carbohydrate profiles for allulose syrup stored in Railcars at an
initial pH of
3.4
Date Allulose
Content
Original load out 10/26/14 95.42
After railcar storage 1/21/15 93.42
Difference -2.00
The allulose content change seen during the lower pH stability storage study
was
additionally confirmed in the bulk product in railcars (Table 1). The
compositional changes
were slightly less at 3 months in railcars, than two months at 25 C in the
storage study
(i.e. 2% in 3 months vs. 3% in 2 months). The effect of container volume was
demonstrated in another example as well, when 300 gallon totes were less
susceptible to
allulose content changes than 1 quart containers. A likely explanation may be
that pH is
more stable in larger containers as the surface area to volume ratio is
smaller. An
alternative explanation could be that the average temperature was lower in the
larger
containers, but this was not directly observed.
In summary, the allulose content of the syrup prepared having an initial pH of
3.4 changed
within 2 months. The allulose content of the syrup prepared having an initial
pH of 4.0 also
changed over time, but at a slower rate (Figures 5-8). The primary physical
difference in
those two syrups appears to be pH. Additional examples below demonstrate that
pH has a
large effect on compositional stability.
Example 2 ¨ Storage stability
Final allulose syrup product samples were subjected to a range of pH and
different DS and
temperatures. Another series of samples had sodium metabisulfite and sodium
citrate
added. Separate sub samples were taken at pre-determined intervals and their
carbohydrate composition, color, HMF, DS and pH analyzed.
CA 02977617 2017-08-23
WO 2016/135458
PCT/GB2016/050422
22
Table 2: Sample carbohydrate profile
Dextrose Fructose Allulose Others Nominal
pH
% % % % DS %
Campaign 1
0.5 2.2 93.0 4.3 3.4 77.0
Product
Table 3: Nominal screening experiments to be run.
pH Temp C DS % Additive
3.4 40 77 -
3.4 50 77 -
3.4 40 71 -
3.4 50 71 -
3.5 40 77 -
3.5 50 77 -
4.0 40 77 -
4.0 50 77 -
4.0 40 77 Sodium citrate
4.0 50 77 Sodium citrate
Sodium
4.0 40 77
metabisulfite
Sodium
4.0 50 77
metabisulfite
4.5 40 77 -
4.5 50 77 -
CA 02977617 2017-08-23
WO 2016/135458 PCT/GB2016/050422
23
Methods
Samples of starting material were taken. The pH and DS were measured and
recorded.
One sub sample of each was taken as is, the next adjusted to pH 3.6, another
to pH 4.0
and the final one to pH 4.7 using dilute HCI or sodium carbonate. One subset
of starting
material was diluted to 71% DS. Another subset of the pH 4.0 batch had sodium
citrate or
sodium metabisulfite added. Sealed sample containers were placed into
different
temperature ovens at 40 C and 50 C. Extracts from each of the samples were
removed
from each oven periodically. Samples were chilled quickly in an ice bath and
analyzed for
carbohydrate composition, HMF, color and pH.
Analytical
Samples were analyzed to determine their DS, pH, carbohydrate composition, HMF
content and color. For pH and color the samples were analyzed at a standard
DS.
In general, pH dropped over the course of the experiments, see Figure 9 and
Figure 10.
The decrease in pH is more pronounced in samples starting at higher pH, and
the pH
drops faster at higher temperature. It appears that the pH of each sample
becomes more
stable around a value near 3.0 to 3.3.
Two of the samples that were adjusted to start at pH 4.0 had additives added.
The first
was with 75 ppm sodium metabisulfite (MBS) and the second was 60 ppm sodium
citrate
(NaCit).
The pH drift data (Figures 9 and 10) at pH 4.0 matches the stability study of
an allulose
syrup product which the product pH started at 3.9 and samples were stored at
50 C
(comparison in Figure 11).
Allulose content dropped in all samples following the trend of higher
temperature, lower pH
and longer time resulting in faster allulose losses (Figures 12 and 13). The
pH 4.0
samples with additives show a similar rate of allulose loss as the pH 4.0
sample with no
CA 02977617 2017-08-23
WO 2016/135458 PCT/GB2016/050422
24
additive. This may be explained by the similar pH changes observed above and
due to
very low levels of the additives.
Surprisingly, the sample with only a slightly lower DS, (71% vs. 77%) starting
at pH 3.37
showed much less allulose loss than its equivalent pH sample at 77% DS. The
rate of
allulose loss at 71% DS was approximately half that at 77% DS, demonstrating
that a
narrow range of DS has a dramatic and unexpected effect on allulose syrup
stability.
Similar effects are not observed for similar monosaccharide syrups such as
glucose or
high fructose corn syrups within such a narrow range of DS.
Color was measured and plotted against time (Figures 14 and 15). High pH,
longer time
and high temperature increased the color formation. By increasing the pH it is
possible to
mitigate the allulose content loss, however there is an upper limit bound by
increasing
color in the final product. This results in a surprisingly narrow pH range
being acceptable
for long term storage of allulose syrup. This range appears to be between pH
3.5 and 4.5
when both color and composition stability are considered. Similar effects are
not observed
for similar monosaccharide syrups such as glucose or high fructose corn syrups
within
such a narrow range of pH.
The change in HMF over time for these samples is shown in Figures 16 and 17.
Low pH,
high temperature and longer time contributed to increased HMF formation.
Example 3 - Crystallization stability
Allulose syrups were prepared at 50, 60, 71, 77, and 85% DS and were
equilibrated at
25 C, 15 C and 4 C. These samples were seeded with -0.1% crystalline allulose
and
crystallization was monitored visually and by change in dry solids of the
syrup fraction after
1 month of storage.
Results:
Change in DS is shown in Table 4. A change in DS greater than 0 indicates
crystallization,
and a larger number indicates a larger amount of crystallization. At 25 C,
77% DS and
CA 02977617 2017-08-23
WO 2016/135458 PCT/GB2016/050422
below did not crystalize substantially, although seed crystals also did not
dissolve at 77%
DS, suggesting 77% is near the limit of solubility at 25 C. The 85% DS sample
did
crystallize. At 15 C, 71% DS and below samples did not crystalize, while 77%
and 85%
did have crystal formation. At 4 C, 60% DS and below samples did not
crystalize, while
5 the 71% DS sample had very minor crystallization that did not appreciably
affect the bulk
syrup DS. Therefore, for storage of a crystallization stable syrup at ambient
and reduced
temperatures, 77% solids or less is desirable. For cool (<25 C) temperatures,
71% solids
or less is more desirable.
10 Table 4: Crystallization Stability:
Change in DS
4 C 2 weeks 4 weeks
50%ds 0 0
60%ds 0 0
71%ds 0 0
77%ds 5 5
85%ds 9 9
15 C
50%ds 0 0
60%ds 0 0
71%ds 0 0
77%ds 2 2
85%ds 7 8
25 C
50%ds 0 0
60%ds 0 0
71%ds 0 0
77%ds 0 0
85%ds 5 6
CA 02977617 2017-08-23
WO 2016/135458 PCT/GB2016/050422
26
Example 4 - Microbial stability
Microbial stability was assessed at 72% and 77% dry solids content by a
challenge study
with osmophilic yeasts and molds.
An aliquot of 250 grams of each DS level control sample was placed into two
sterile glass
jars (250 grams x 2 for each moisture level, total 4 containers). An aliquot
of 1,000 grams
of each DS level sample was placed into two sterile Nalgene containers (1,000
grams x 2
for each DS level, total 4 containers). Each 1,000 gram sample (8 containers
total) was
inoculated with osmophilic mold and yeast separately (less than 1% of total
volume). The
containers were mixed and incubated at room temperature for 2-3 hours to
equilibrate the
inoculum. Then, 250 grams of the mixture was placed into a 250 mL sterile
glass jar to
make triplicates for each testing condition (24 x 250 mL glass jars). An
initial sample for
plating (T=0) was taken and incubation started at 25 and 35 C. Samples were
then taken
at intervals as planned for plating.
At 77% DS osmophilic yeasts and molds were rapidly made non-viable. However at
72%
DS, allulose syrup took 4 weeks to completely kill all viable yeasts and molds
at 25 C.
Microbial stability was also assessed at 50% and 60% dry solids content by a
challenge
study with osmophilic yeasts and molds using the same method. At 60%DS, it
took
allulose syrup 2 months to completely remove viability of osmophilic yeasts
and molds,
and at 50% DS, viability of yeasts and molds was not removed completely even
after 4
months. This suggests that 60% solids is the minimum solids concentration for
allulose
syrup that can reasonably be considered resistant to spoilage by microbial
contamination
and more ideally the concentration is 70-77% solids.
Based on the findings in Tables 5a-e below and those in the crystallization
and reactivity
examples above, final product stability has an optimum DS that is fairly
narrow for allulose
syrup. Lower DS reduces the rate of degradation in all parameters, however a
final product
DS that is below 60% DS does not maintain good microbial stability. Higher DS
results in
CA 02977617 2017-08-23
WO 2016/135458 PCT/GB2016/050422
27
more rapid degradation and also crystallization. Therefore an optimal DS of 60-
80% is
required and more preferably a DS of 71-78% is required for long term
stability of allulose
syrup and more preferably a DS of 71-73% should have the highest combined
allulose
content stability, microbial stability and crystalline stability. In cases
where microbial
stability is the key attribute necessary, 76-78% DS would have the best
microbial stability.
Additionally, final product stability is optimized in a narrow range of pH,
from 3.5 to 4.5 and
more preferably in a pH range from 3.8 to 4.2 in order to optimize the trade-
off between
carbohydrate stability and color/HMF formation. Lower pH was shown to increase
the rate
of allulose content loss and HMF formation, while higher pH was shown to
result in more
rapid formation of color.
0
n.)
o
1¨,
c:
1¨,
vi
.6.
vi
oe
T=0 T=1w
T=2w T=4w
Control samples: One large container (250 mL sterile glass jar) 05/08/2014
05/15/2014 05/21/2014 06/06/2014
DS level (%) Temp ( C) LIMS Osmo M Osmo Y Osmo M Osmo Y Osmo M Osmo Y Osmo M
Osmo Y
72 25 372602 <10 <10 <10
<10 <10 <10 <10 <10 P
.
N)
72 35 372603 <10 <10 <10
<10 <10 <10 <10 <10 ,
,
k...)
,
oe
,
77 25 372604 <10 <10 <10
<10 <10 <10 <10 <10
,
,
'
77 35 372605 <10 <10 <10
<10 <10 <10 <10 <10 .
.3
,
N)
Table 5a
1-d
n
,-i
to
t..)
=
c7,
'a
u,
=
.6.
t..)
t..)
0
n.)
o
1¨,
c:
T=0 T=1w
T=2w T=4w
vi
Experimental Samples: 05/08/2014 05/15/2014
05/21/2014 06/06/2014 .6.
vi
oe
DS level (%) Temp ( C) LIMS Osmo M Osmo Y Osmo M Osmo Y Osmo M Osmo Y Osmo M
Osmo Y
lnoculum: Z.rouxii
72 25 372606 - 335,000 - 425
- 55 - <10
Replicates:3
72 25 372607 - 312,000 - 265
- 40 - <10
Plating: 12/point
72 25 372608 - 309,000 - 440
- 55 - <10
Container: 12
72 35 372609 - 311,000 - <10
- <10 - <10
P
Min total vol:
72 35 372610 - 260,500 - <10
- <10 - <10 .
r.,
,
1,800 grams
,
72 35 372611 - 290,000 - <10
- <10 - <10
N)
.
77 25 372612 - 317,500 - <10
- <10 - <10 ,
..]
I
0
00
77 25 372613 - 301,500 - <10
- <10 - <10 r,
77 25 372614 - 299,000 - <10
- <10 - <10
77 35 372615 - 277,000 - <10
- <10 - <10
77 35 372616 - 279,000 - <10
- <10 - <10
77 35 372617 - 287,000 - <10
- <10 - <10
Iv
n
,-i
Table 5b
4")
to
t.)
o
,-,
o
O-
u,
o
.6.
t.)
t.)
0
n.)
o
1¨,
c:
T=0 T=1w
T=2w T=4w
vi
Experimental Samples: 05/08/2014
05/15/2014 05/21/2014 06/06/2014 .6.
vi
oe
DS level (%) Temp ( C) LIMS Osmo M Osmo Y Osmo M Osmo Y Osmo M Osmo Y Osmo M
Osmo Y
lnoculum: Osmo molds
_______________________________________________________________________________
________
72 25 372618 2,700 - 585 -
10 - <10 -
Replicates:3
72 25 372619 2,400 - 485 -
<10 - <10 -
Plating: 12/point
72 25 372620 3,050 - 590 -
<10 - <10 -
Container: 12
72 35 372621 2,250 - <10 -
<10 - <10 -
P
Min total vol:
72 35 372622 2,300 - <10 -
<10 - <10 - .
r.,
,
1,800 grams
,
72 35 372623 2,700 - <10 -
<10 - <10 -
o ,
N)
.
77 25 372624 3,250 - 155 -
<10 - <10 - ,
..]
I
0
00
77 25 372625 2,800 - 150 -
<10 - <10 - r,
77 25 372626 2,850 - 175 -
<10 - <10 -
77 35 372627 2,500 - <10 -
<10 - <10 -
77 35 372628 3,150 - <10 -
<10 - <10 -
77 35 372629 2,800 - <10 -
<10 - <10 -
Iv
n
,-i
Table 5c
4")
to
t.)
o
,-,
o
O-
u,
o
.6.
t.)
t.)
0
t..)
o
,-,
o
,-,
(...)
u,
T=0 T=1w T=2w T=4w T=2m T=3m T=4m T=6m
.6.
u,
cio
T (week) 0 1 2 4 8 13
17 26
DS level Temperature Osmo Osmo Osmo Osmo Osmo Osmo Osmo Osmo
(%) ( F) M M M M M M
M M
50 77 6,517 1,690 417 45 30 40
195
50 95 6,817 4,233 3,167 377 <10 <10
<10
60 77 6,683 5,033 1,117 23 <10 <10
<10 P
60 95 6,450 990 <10 <10 <10 <10
<10 ,
,
,-,
,
,,
.
,
,
,
.
.3
,
Table 5d
1-d
n
1-i
w
t..)
o
,-,
o
O-
u,
o
.6.
t..)
t..)
0
t..)
o
,-,
o
T=0 T=1w T=2w T=4w T=2m T=3m T=4m T=6m
(...)
u,
T (week) 0 1 2 4 8 13
17 26 .6.
u,
cio
DS level Temperature
Osmo Y Osmo Y Osmo Y Osmo Y Osmo Y Osmo Y Osmo Y Osmo Y
(%) ( F)
50 77
319,333 11,243 125 <10 <10 <10 <10
50 95 335,000 65 <10 <10 <10 <10
<10
60 77 312,500 393 23 <10 <10 <10
<10
60 95 331,167 <10 <10 <10 <10 <10
<10 P
,
,
Table 5e
0
,
,
,
0
.3
,
1-d
n
1-i
w
t..)
o
,-,
o
O-
u,
o
.6.
t..)
t..)
CA 02977617 2017-08-23
WO 2016/135458 PCT/GB2016/050422
33
Example 5 - Allulose syrup stability within a narrow pH range and ambient
storage
temperatures
This series of experiments was set up to determine allulose syrup stability
within a narrow
range of pH and DS at ambient temperature range of 25-35 C.
Samples of allulose syrup of 93.8% allulose content were pH adjusted to 3.8,
4.0 and 4.2
pH units and DS adjusted to 77% and 71% and incubated at 25 C and 35 C.
Samples
were analyzed periodically.
Results
There is some divergence of composition in the ranges of 71-77%, 25-35 C,
starting pH
3.8-4.2 (Figure 18). Lower pH, higher DS and higher temperature all contribute
to small
changes in allulose content.
All 25 C (77 F) data show essentially no change in composition, over the
course of two
months (Figure 19). However, the 35 C data show a moderate decrease in
allulose
content over the course of two months (0.5 to 1.5% decrease dependent on pH
and %DS)
(Figure 20). Higher pH and lower DS appear to be more stable. Even within a
narrow pH
range of 3.8 to 4.2, higher pH was more stable compositionally at 35 C. At 25
C there is
no difference identified. These results highlight the surprisingly narrow,
temperature, pH,
and DS conditions required for allulose syrup stability.
HMF is an undesirable dehydration product from monosaccharide syrups. Here we
can
see that higher temperatures result in greater HMF formation (Figures 21 and
22). The
results suggest that higher pH results in less HMF formation in the range of
3.8 to 4.2.
Temperature effect on color was dramatic (Figures 23 and 24). pH effect on
color was
also apparent with higher pH resulting in more color. DS % had a minor effect
on color,
with lower DS having lower color development; this was more pronounced at
higher
CA 02977617 2017-08-23
WO 2016/135458 PCT/GB2016/050422
34
temperatures. This again demonstrates that there is a suprisingly narrow range
for color
and allulose content stability, which pH, DS, and temperature all have
substantial effects.
The results demonstrate stability under the conditions tested for 25 C. At
higher
temperature, DS, and pH even within the narrow range have noticeable effects,
with color
developing fastest at higher DS and higher pH and allulose content changing
most quickly
with higher DS and lower pH. If higher temperatures higher than 25 C
will be
encountered, a pH of 4.0 and 71% DS will help control color changes and
allulose content
changes.
Example 6 ¨ Stability improvement with syrup additives
Additives have an effect on stability. These additives may stabilize the syrup
by buffering
the pH to help control at pH 4.0 and also to minimize oxidation.
One temperature 30 C (86 F) has been used to assess the effect of additives on
stability.
Approximate composition of campaign 1 material:
Allulose % pH DS
Starting Material 94 3.3 77.5
Method
Each sample consisted of 1000 mL of syrup in a plastic container. Two gallons
of this
material were pH adjusted to 4.0 using 1M sodium carbonate (NaCO3), by slow
and careful
addition and regular pH measurement at 1:1 dilution. This material was then
split into two
separate containers and one was diluted to 71% DS (11.5 lbs 77% DS syrup, plus
0.97 lbs
water).
After dilution, the samples were subsampled into 500 mL plastic containers.
Fresh 10%
solutions (25 mL) of ascorbate, isoascorbate, sodium citrate, sodium acetate,
and 1%
CA 02977617 2017-08-23
WO 2016/135458 PCT/GB2016/050422
tocopherol acetate, and metabisulfite were prepared and pH adjusted with
sodium
carbonate to -4.0 pH. 10mL of these solutions were added and mixed in with the
corresponding samples as in Table 6.
5 The following samples will be prepared as above and then placed in the
30 C oven and
sampled as Table 7 below.
Table 6: Samples
Sodium Sodium Tocopherol
DS pH Ascorbate Isoascorbate
Citrate Acetate Acetate Metabisulfite
71 4.0 0.2%
71 4.0 0.2%
71 4.0 0.2%
71 4.0 0.2%
71 4.0 0.2%
71 4.0 0.02%
77 4.0 0.2%
77 4.0 0.2%
77 4.0 0.2%
77 4.0 0.2%
77 4.0 0.2%
77 4.0 0.02%
The sampling and testing schedule is detailed in Table 7.
CA 02977617 2017-08-23
WO 2016/135458
PCT/GB2016/050422
36
Table 7: Stability Robustness Samples
a)
TO'
0
a)
co .c
'e, -2 .0
AI
2
Sample a.
0 Months
1 Months x x x X
2 Months x X
4 Months x X
6 Months
Results
No dramatic changes in pH were observed at 2 months, although both controls
appear to
be trending downwards in pH (Figure 25). As expected, the pH does not drop for
the
samples containing added buffering compounds: ascorbate, isoascorbate, citrate
and
acetate.
No dramatic changes have been observed at 3 months at 30 C in terms of
composition
(Figure 26), but there are minor changes. It appears that added MBS may result
in more
rapid allulose content loss. Tocopherol acetate performs somewhat better than
the control
at 71% DS and about the same as the control at 77% DS.
Addition of both ascorbate and isoascorbate (Figure 27) and of both sodium
citrate and
sodium acetate (Figure 28) controlled allulose content changes after 3 months
storage at
30 C.
HMF increased in all samples. However, one subset of additive samples
displayed a
substantially smaller amount of HMF increase. The samples with reduced HMF
increase
were those containing either ascorbate or isoascorbate, displaying less than
half the HMF
increase of the control samples (Figure 29).
CA 02977617 2017-08-23
WO 2016/135458 PCT/GB2016/050422
37
Ascorbate and isoascorbate have the ability to control HMF formation, whereas,
sodium
citrate and sodium acetate showed promise at controlling pH and allulose
content
changes. Neither MBS nor tocopherol acetate addition resulted in a significant
benefit.
Example 7 ¨ Surface response study of temperature, pH and DS:
The purpose of this study was to determine the effects and interplay of pH,
DS, and
temperature on product stability over a narrow range of product conditions.
Allulose Syrup was used for this study. Each sample consisted of 1 quart (1.14
liter) of
Allulose Syrup in a 1 quart (1.14 liter) round plastic HDPE container. This
container was
chosen because it is made of the same material as ISBT totes used for customer
storage.
For each time/temperature combination, a single quart container was packed.
Table 8 - Stability Sample Factors and Response
Name Units Type Std. Dev. Low High
Initial pH pH Factor 0 3.5 4.5
DS Factor 0 50 80
Temperature C Factor 0 25 35
HMF ppm Response
Allulose Response
Color CU Response
Three factors and three responses were modeled using DOE software with the
ranges for
the variables of interest in Table 8. Additionally, resulting pH at the sample
time points
was measured.
The Box-Behnken design produced the following experiments in Table 9.
CA 02977617 2017-08-23
WO 2016/135458 PCT/GB2016/050422
38
Table 9:
Factor 1 Factor 2 Factor 3
Run A:pH B:DS C:Temp
pH % C
1 4.5 50 30
2 3.5 65 25
3 4 65 30
4 3.5 80 30
3.5 65 35
6 4 50 25
7 4 65 30
8 4 80 25
9 4 65 30
4.5 65 25
11 4 65 30
12 3.5 50 30
13 4 65 30
14 4.5 80 30
4 80 35
16 4 50 35
17 4.5 65 35
18 4.0 71 25
Zero time samples were taken from each container and submitted for color, HMF,
DPI-4,
and pH analysis. Original containers were then placed in the appropriate
stability chamber
5 at 25 C, 30 C, or 35 C as indicated in column factor 3 in Table 9.
After incubation for 3 weeks, 6 weeks, 3 months and 6 months, samples of each
container
were submitted for Color, HMF, DPI-4, and pH analysis. The results were
analyzed using
DOE software, and predictions for optimized conditions were generated. Contour
plots
10 were generated for allulose content, HMF, and color.
CA 02977617 2017-08-23
WO 2016/135458 PCT/GB2016/050422
39
There were notable changes in allulose content over the six months of this
response
surface study.
When looking at the response surface of change in allulose in relation to
temperature and
pH at 77% DS at 6 months as shown in Figure 30, there is substantial failure
space where
allulose content changes by more than 2%. It is surprising that there is only
a narrow
window in the far right hand corner at pH greater than 4.0 and temperature
less than 27 C
where the allulose content of the syrup does not change substantially.
When looking at the change in allulose response surface for DS and pH at 25 C
(Figure
31) it is clear that the desirable zone of low allulose content change gets
smaller and
smaller as DS increases. Keeping in mind that DS is bound on the low end by
microstability at approximately 60% DS and at the high end by reactivity and
crystallization
at 78% DS, we can see that there is a narrow acceptable space where change in
allulose
content is acceptable. At 65% DS and above, 25 C and a pH about 4.25 are
essential for
stability at 6 months.
The acceptable stable storage conditions are further bounded in terms of
solids, pH, and
storage temperature when color is considered. For use in food, colorless food
ingredients
are desired. In this experiment, color of the syrup was analyzed as absorbance
at 450nm
with background subtracted at 600nm. A change in color of more than 4 is
generally
considered unacceptable. When changes in color for 77% DS allulose syrup were
modeled as a response surface after 6 months storage for temperature and pH
(Figure 32)
we can see that both temperature and pH are critical factors. Temperature must
be
maintained near or below 25 C and ideally at a pH between 3.7 and 4.2. Keeping
in mind
that crystallization at a DS of 77% begins to occur at temperatures below 25 C
and
allulose content stability requires a pH greater than 4.0, this means that the
ideal storage
space at this DS is very narrow at a temperature of 25 C, pH 4.0-4.2. Further
bounding
DS between 60-78 for reactivity and microstability, it is clear from the pH
and DS modeled
response surface (Figure 33) that lower DS is more stable for color
generation, but the
ideal pH is still near 4Ø Further consideration of the economical importance
of a syrup
containing the minimum amount of water possible to reduce shipping costs and
allow the
CA 02977617 2017-08-23
WO 2016/135458 PCT/GB2016/050422
broadest use in food applications, this means that, practically, the stable
space for
economic use of allulose syrup that is shelf stable is very narrow. This is
substantially
different from other known saccharide syrups; for example, dextrose syrup is
known to be
reasonably stable to a variety of conditions and temperatures without
developing
5 substantial color, or reduction in dextrose content.
Hydroxymethylfurfural (HMF) is an undesirable dehydration product from
monosaccharide
syrups. Figure 34 demonstrates the modeled temperature pH response surface for
change in HMF at 77%DS. HMF production is highest at low pH and high
temperature
10 and is lowest at high pH and low temperature. Less than 100ppm HMF is
generally
preferred for food ingredients. Thus, another pH boundary can be placed on
allulose
syrup: when stored at 25 C, it should be above pH 3.70.
Optimization: The modeled surface response data were used to minimize changes
in
15 allulose, HMF, and color. In the first case, no constraints were placed
on pH, DS and
temperature. Allulose content was given an importance of 3, and color and HMF
an
importance of 2. There were many solutions all with similar desirability
scores and all of
them had a recommended temperature of 25 C and recommended DS of 50% with a
pH
range of 3.8-3.9. However, when DS is constrained to a microbially safe range
and
20 economically viable range of 71-78% DS, the desirable solutions all
recommended a
temperature of 25 C and a pH range of 4.2-4.4.
Summary
25 The results of the response surface study combined with crystallization
and microbial
stability and reactivity studies demonstrate that stability of allulose syrup
over a period of 6
months is dependent on a very narrow temperature, pH and DS range, which is
unconventionally and surprisingly narrow for a saccharide solution.
CA 02977617 2017-08-23
WO 2016/135458 PCT/GB2016/050422
41
Advantages of the Invention:
A syrup form that is more stable has benefits in that it can be stored for
longer time periods
and still be saleable, it has broader customer appeal, it can be shipped to
geographic
locations that require lengthy shipping and holding times. Additionally,
improved product
stability means that the product as used will retain a higher quality of
composition and
taste. This is beneficial from a calorie labelling position and final consumer
product quality
position.