Note: Descriptions are shown in the official language in which they were submitted.
WO 2016/164750
PCT/US2016/026684
1
SYSTEMS AND METHODS FOR DETECTION OF SIGNAL QUALITY IN
DIGITAL RADIO BROADCAST SIGNALS
100011 (left intentionally blank)
BACKGROUND
[0002] Field of the Disclosure
[0003] The present disclosure relates to systems and methods for detection
of signal
quality problems in digital radio broadcast signals.
100041 Background Information
[0005] Digital radio broadcasting technology delivers digital audio and
data services to
mobile portable, and fixed receivers. One type of digital radio broadcasting,
refeffed to as
in-band on-channel (IBOC) digital audio broadcasting (DAB), uses terrestrial
transmitters in
the existing Medium Frequency (111F) and Very High Frequency (VHF) radio
bands. HD
RadioTM technology, developed by iBiquity Digital Corporation, is one example
of an IBOC
implementation for digital radio broadcasting and reception.
[0006] IBOC digital radio broadcasting signals can be transmitted in a
hybrid format
including an analog modulated carrier in combination with a plurality of
digitally modulated
carriers or in an all-digital format wherein the analog modulated carrier is
not used. Using
the hybrid mode, broadcasters may continue to transmit analog AM and FM
simultaneously
with higher-quality and more robust digital signals, allowing themselves and
their listeners to
convert from analog-to-digital radio while maintaining their current frequency
allocations.
SUBSTITUTE SHEET (RULE 26)
Date Recue/Date Received 2022-08-05
CA 02982341 2017-10-10
WO 2016/164750
PCT/US2016/026684
2
[0007] One
feature of digital transmission systems is the inherent ability to
simultaneously transmit both digitized audio and data. Thus the technology
also allows for
wireless data services from AM and FM radio stations. The broadcast signals
can include
metadata, such as the artist, song title, or station call letters. Special
messages about events,
traffic, and weather can also be included. For example, traffic information,
weather forecasts,
news, and sports scores can all be scrolled across a radio receiver's display
while the user
listens to a radio station.
[0008] IBOC
digital radio broadcasting technology can provide digital quality audio,
superior to existing analog broadcasting formats. Because each IBOC digital
radio
broadcasting signal is transmitted within the spectral mask of an existing AM
or FM channel
allocation, it requires no new spectral allocations. IBOC digital radio
broadcasting promotes
economy of spectrum while enabling broadcasters to supply digital quality
audio to the
present base of listeners.
[0009]
Multicasting, the ability to deliver several audio programs or services over
one
channel in the AM or FM spectrum, enables stations to broadcast multiple
services and
supplemental programs on any of the sub-channels of the main frequency. For
example,
multiple data services can include alternative music formats, local traffic,
weather, news, and
sports. The supplemental services and programs can be accessed in the same
manner as the
traditional station frequency using tuning or seeking functions. For example,
if the analog
modulated signal is centered at 94.1 MHz, the same broadcast in IBOC can
include
supplemental services 94.1-2, and 94.1-3. Highly specialized supplemental
programming can
be delivered to tightly targeted audiences, creating more opportunities for
advertisers to
integrate their brand with program content. As used herein, multicasting
includes the
transmission of one or more programs in a single digital radio broadcasting
channel or on a
single digital radio broadcasting signal. Multicast content can include a main
program
WO 2016/164750
PCT/US2016/026684
3
service (MPS), supplemental program services (SPS), program service data
(PSD), and/or
other broadcast data.
100101 The
National Radio Systems Committee, a standard-setting organization
sponsored by the National Association of Broadcasters and the Consumer
Electronics
Association, adopted an IBOC standard, designated NRSC-5, in September 2005.
NRSC-5
and its updates (e.g., the NRSC-5C standard, adopted in September 2011)
set forth the requirements for broadcasting digital
audio and ancillary data over AM and FM broadcast channels. The standard and
its reference
documents contain detailed explanations of the RF/transmission subsystem and
the transport
and service multiplex subsystems. Copies of the standard can be obtained from
the NRSC at
http://www.nrscstandards.org/SG.asp. iBiquity's
HD Radio n4 technology is an
implementation of the NRSC-5 IBOC standard. Further information regarding HD
Radio
technology can be found at www.hdradio.com and www.ibiquity.com.
100111 Other types
of digital radio broadcasting systems include satellite systems such as
Satellite Digital Audio Radio Service (SDARS, e.g., XM Radio, Sirius), Digital
Audio Radio
Service (DARS, e.g., WorldSpace), and terrestrial systems such as Digital
Radio Mondiale
(DRM), Eureka 147 (branded as DAB Digital Audio Broadcasting), DAB Version 2,
and
FMeXtra. As used herein, the phrase "digital radio broadcasting" encompasses
digital audio
broadcasting including in-band on-channel broadcasting, as well as other
digital terrestrial
broadcasting and satellite broadcasting.
SUMMARY
100121 The present
inventors have observed a need for improved approaches for detecting
signal quality problems and errors (e.g., errors in content, non-adherence to
broadcasting
standards, etc.) in digital radio broadcast signals. The present inventors
have further
Date Recue/Date Received 2022-08-05
CA 02982341 2017-10-10
WO 2016/164750
PCT/US2016/026684
4
observed a need for improved approaches to detecting problems in digital radio
broadcast
transmitter and receiver systems. In particular, the present inventors have
observed that, with
the increasing use of HD RadioTm broadcasting, some radio stations may not be
optimally
configured for broadcasting a highest quality digital radio broadcasting
signal. Further, some
radio stations may broadcast signals that are not compliant with applicable
digital radio
broadcast standards and/or that do not include the correct content, among
other issues. These
issues may negatively affect the experience of end-users (e.g., consumers),
who may
experience less than desired audio quality (e.g., echo, distortion, feedback,
inadequate
volume, etc.), among other possible problems (e.g., artist, song, or album
information that
does not match a song currently playing, incorrect or missing station logo,
etc.). The present
inventors have observed a need to detect such issues with digital radio
broadcast signals.
Problems related to a digital radio broadcast receiver system's hardware,
software, or
firmware may also cause end-users to have less than optimal experiences. Such
problems
may cause the receiver system to experience a fault (e.g., fail to render
audio or visual data
properly, fail to receive broadcasted data, etc.) despite the fact that
broadcasted signals are
error-free and include the correct content. The present inventors have
observed a need to
detect such problems related to digital radio broadcast receiver systems.
[0013] To
investigate such problems related to digital radio broadcast signals,
transmitter
systems, and/or receiver systems, a radio engineer could travel to the
location of the radio
station (e.g., traveling to a geographical area in which the radio station's
digital radio
broadcast signals can be received) with various expensive equipment and use
the equipment
to monitor and record the radio station's broadcasts in the field. The radio
engineer could
then bring the recorded data to another location for analysis. The recorded
data could be
analyzed in various ways and/or tested on different receiver systems, for
example. The
present inventors have observed that such an approach may have deficiencies
insofar as such
CA 02982341 2017-10-10
WO 2016/164750
PCT/US2016/026684
an assessment could require a considerable amount of time (e.g., hours or
days, etc.), permit
an engineer to assess only one station at a time, and require travel to
various geographic
locations, all of which can be expensive.
[0014]
Embodiments of the present disclosure are directed to systems and methods that
may satisfy these needs.
[0015]
According to exemplary embodiments, a computer-implemented system for
automated detection of signal quality problems and errors in digital radio
broadcast signals is
disclosed. The system may include first monitoring equipment located in an
over-the-air
coverage area of a first radio station. The first monitoring equipment is
configured to receive
a digital radio broadcast signal via digital radio broadcast transmission from
the first radio
station. The system may also include second monitoring equipment located in an
over-the-air
coverage area of a second radio station. The second monitoring equipment is
configured to
receive a digital radio broadcast signal via digital radio broadcast
transmission from the
second radio station, where the over-the-air coverage areas of the first and
second radio
stations are different. A computing system is configured to receive data from
the first
monitoring equipment and the second monitoring equipment, the data being
indicative of one
or more attlibutes of a digital radio broadcast signal received at respective
monitoring
equipment. The computing system analyzes in real-time or near real-time the
received data
from the first and second monitoring equipment. The data is analyzed in an
automated
manner to detect a signal quality problem or error in the digital radio
broadcast signals
received at the first and second monitoring equipment.
[0016]
Additionally, a method for detection of signal quality problems and errors in
digital radio broadcast signals is disclosed. Using first monitoring equipment
located in an
over-the-air coverage area of a first radio station, a digital radio broadcast
signal is received
via digital radio broadcast transmission from the first radio station. Using
second monitoring
CA 02982341 2017-10-10
WO 2016/164750
PCT/US2016/026684
6
equipment located in an over-the-air coverage area of a second radio station,
a digital radio
broadcast signal is received via digital radio broadcast transmission from the
second radio
station. The over-the-air coverage areas of the first and second radio
stations are different.
Data from the first monitoring equipment and the second monitoring equipment
are received,
the data being indicative of one or more attributes of a digital radio
broadcast signal received
at respective monitoring equipment. The received data is analyzed in real-time
or near real-
time to detect a signal quality problem or error in the digital radio
broadcast signals received
at the first and second monitoring equipment.
100171
Further, according to exemplary embodiments, a system for automated detection
of signal quality problems and errors in digital radio broadcast signals is
disclosed. The
system includes first means for receiving a digital radio broadcast signal via
digital radio
broadcast transmission from a first radio station in an over-the-air coverage
area of the first
radio station. The system includes second means for receiving a digital radio
broadcast
signal via digital radio broadcast transmission from a second radio station in
an over-the-air
coverage area of the second radio station. The over-the-air coverage areas of
the first and
second radio stations are different. The system further includes third means
for receiving
data from the first means for receiving and the second means for receiving,
the data being
indicative of one or more attributes of a digital radio broadcast signal
received at respective
means for receiving. The system further includes means for analyzing in real-
time or near
real-time the received data from the first means for receiving and the second
means for
receiving. The data being analyzed by the means for analyzing in an automated
manner to
detect a signal quality problem or error in the digital radio broadcast
signals received at the
first means for receiving and the second means for receiving.
100181
Further, according to exemplary embodiments, a computer-implemented system
for automated detection of signal quality problems and errors in digital radio
broadcast
CA 02982341 2017-10-10
WO 2016/164750
PCT/US2016/026684
7
signals is disclosed. The system includes first monitoring equipment located
in an over-the-
air coverage area of a first radio station. The first monitoring equipment is
configured to
receive a digital radio broadcast signal via digital radio broadcast
transmission from the first
radio station. The system also includes second monitoring equipment located in
an over-the-
air coverage area of a second radio station. The second monitoring equipment
is configured
to receive a digital radio broadcast signal via digital radio broadcast
transmission from the
second radio station, where the over-the-air coverage areas of the first and
second radio
stations are different. A computing system is configured to receive data from
the first
monitoring equipment and the second monitoring equipment, the data being
indicative of one
or more attributes of a digital radio broadcast signal received at respective
monitoring
equipment. The received data is stored in a database. Each piece of data
stored in the
database has an associated (i) date and time, (ii) broadcast frequency, and
(iii) location
information. The computing system analyzes the data stored in the database in
an automated
manner.
BRIEF DESCRIPTION OF THE DRAWINGS
[0019] These and other features, aspects, and advantages of the present
disclosure will
become better understood with regard to the following description, appended
claims, and
accompanying drawings wherein:
[0020] FIG. 1 illustrates a block diagram that provides an overview of a
system in
accordance with certain embodiments;
[0021] FIG. 2 is a schematic representation of a hybrid FM IBOC waveform;
[0022] FIG. 3 is a schematic representation of an extended hybrid FM IBOC
waveform;
[0023] FIG. 4 is a schematic representation of an all-digital FM IBOC
waveform;
[0024] FIG. 5 is a schematic representation of a hybrid AM IBOC waveform;
[0025] FIG. 6 is a schematic representation of an all-digital AM IBOC
waveform;
CA 02982341 2017-10-10
WO 2016/164750
PCT/US2016/026684
8
[0026] FIG. 7 is a functional block diagram of an AM IBOC digital radio
broadcasting
receiver in accordance with certain embodiments;
[0027] FIG. 8 is a functional block diagram of an FM IBOC digital radio
broadcasting
receiver in accordance with certain embodiments;
[0028] FIGs. 9a and 9b are diagrams of an IBOC digital radio broadcasting
logical
protocol stack from the broadcast perspective;
[0029] FIG. 10 is a diagram of an IBOC digital radio broadcasting logical
protocol stack
from the receiver perspective;
[0030] FIG. 11 depicts an example system including (i) first monitoring
equipment
located in an over-the-air coverage area of a first radio station, and (ii)
second monitoring
equipment located in an over-the-air coverage area of a second radio station;
[0031] FIG. 12A is a block diagram depicting an example system for
automated detection
of signal quality problems and errors in digital radio broadcast signals;
[0032] FIGs. 12B and 12C are flowcharts depicting example processes
performed by the
system of FIG. 12A for detecting and correcting signal quality problems and
errors in digital
radio broadcast signals;
[0033] FIG. 13 is a block diagram depicting additional details of the
system of FIG. 12A;
[0034] FIGs. 14-16 are exemplary screenshots of a GUI that may be used to
present data
received at an HD Radio Data Request and Filing Server and results of an
analysis of that
data; and
[0035] FIG. 17 is a flowchart depicting operations of an example method for
automated
detection of signal quality problems and errors in digital radio broadcast
signals.
DESCRIPTION
[0036] In digital radio broadcasting systems, issues at the broadcasting
side or the
receiving side may cause problems that can negatively affect an end-user's
experience. The
CA 02982341 2017-10-10
WO 2016/164750
PCT/US2016/026684
9
present inventors have developed novel systems and methods that automate the
detection of
such issues, thus overcoming the inefficiencies of conventional systems and
methods directed
to this purpose.
EXEMPLARY DIGITAL RADIO BROADCASTING SYSTEM
100371 FIGs.
1-10 and the accompanying description herein provide a general description
of an exemplary IBOC system, exemplary broadcasting equipment structure and
operation,
and exemplary receiver structure and operation. FIGs. 11-16 and the
accompanying
description herein provide a detailed description of exemplary approaches for
systems and
methods for automated detection of signal quality problems and errors (e.g.,
errors in content,
non-compliance with broadcasting standards, etc.) in digital radio broadcast
signals in
accordance with exemplary embodiments of the present disclosure. These
approaches may
further be used to detect problems in digital radio broadcast transmitter and
receiver systems
(e.g., software, hardware, and/or firmware issues, etc.). Whereas aspects of
the disclosure are
presented in the context of an exemplary IBOC system, it should be understood
that the
present disclosure is not limited to IBOC systems and that the teachings
herein are applicable
to other forms of digital radio broadcasting as well.
[0038] As
referred to herein, a service is any analog or digital medium for
communicating content via radio frequency broadcast. For example, in an IBOC
radio signal,
the analog modulated signal, the digital main program service, and the digital
supplemental
program services could all be considered services. Other examples of services
can include
conditionally accessed programs (CAs), which are programs that require a
specific access
code and can be both audio and/or data such as, for example, a broadcast of a
game, concert,
or traffic update service, and data services, such as traffic data, multimedia
and other files,
and service information guides (SIGs).
CA 02982341 2017-10-10
WO 2016/164750
PCT/US2016/026684
[0039]
Additionally, as referred to herein, media content is any substantive
information
or creative material, including, for example, audio, video, text, image, or
metadata, that is
suitable for processing by a processing system to be rendered, displayed,
played back, and/or
used by a human.
[0040]
Furthermore, one of ordinary skill in the art would appreciate that what
amounts
to synchronization can depend on the particular implementation. As a general
matter, two
pieces of content are synchronized if they make sense in temporal relation to
one another
when rendered to a listener. For example, album art may be considered
synchronized with
associated audio if the onset of the images either leads or follows the onset
of the audio by 3
seconds or less. For a karaoke implementation, for example, a word of karaoke
text should
not follow its associated time for singing that word but can be synchronized
if it precedes the
time for singing the word by as much as a few seconds (e.g., 1 to 3 seconds).
In other
embodiments, content may be deemed synchronized if it is rendered, for
example, within
about +/- 3 seconds of associated audio, or within about +/- one-tenth of a
second of
associated audio.
[0041]
Referring to the drawings, FIG. 1 is a functional block diagram of exemplary
relevant components of a studio site 10, an FM transmitter site 12, and a
studio transmitter
link (STL) 14 that can be used to broadcast an FM IBOC digital radio
broadcasting signal.
The studio site includes, among other things, studio automation equipment 34,
an Ensemble
Operations Center (EOC) 16 that includes an importer 18, an exporter 20, and
an exciter
auxiliary service unit (EASU) 22. An STL transmitter 48 links the EOC with the
transmitter
site. The transmitter site includes an STL receiver 54, an exciter 56 that
includes an exciter
engine (exgine) subsystem 58, and an analog exciter 60. While in FIG. 1 the
exporter is
resident at a radio station's studio site and the exciter is located at the
transmission site, these
elements may be co-located at the transmission site.
CA 02982341 2017-10-10
WO 2016/164750
PCT/US2016/026684
11
[0042] At the
studio site, the studio automation equipment supplies main program service
(MPS) audio 42 to the EASU, MPS data 40 to the exporter, supplemental program
service
(SPS) audio 38 to the importer, and SPS data 36 to the importer 18. MPS audio
serves as the
main audio programming source. In hybrid modes, it preserves the existing
analog radio
programming formats in both the analog and digital transmissions. MPS data or
SPS data,
also known as program service data (PSD), includes information such as music
title, artist,
album name, etc. Supplemental program service can include supplementary audio
content as
well as program service data.
[0043] The
importer 18 contains hardware and software for supplying advanced
application services (AAS). AAS can include any type of data that is not
classified as MPS,
SPS, or Station Information Service (SIS). SIS provides station information,
such as call
sign, absolute time, position correlated to GPS, etc. Examples of AAS include
data services
for electronic program guides, navigation maps, real-time traffic and weather
information,
multimedia applications, other audio services, and other data content. The
content for AAS
can be supplied by service providers 44, which provide service data 46 to the
importer via an
application program interface (API). The service providers may be a
broadcaster located at
the studio site or externally sourced third-party providers of services and
content. The
importer can establish session connections between multiple service providers.
The importer
encodes and multiplexes service data 46, SPS audio 38, and SPS data 36 to
produce exporter
link data 24, which is output to the exporter via a data link. The importer 18
also encodes a
SIG, in which it typically identifies and describes available services. For
example, the SIG
may include data identifying the genre of the services available on the
current frequency
(e.g., the genre of MPS audio and any SPS audio).
[0044] The
importer 18 can use a data transport mechanism, which may be referred to
herein as a radio link subsystem (RLS), to provide packet encapsulation,
varying levels of
WO 2016/164750
PCT/US2016/026684
12
quality of service (e.g., varying degrees of forward error correction and
interleaving), and
bandwidth management functions. The RLS uses High-Level Data Link Control
(HDLC)
type framing for encapsulating the packets. HDLC is known to one of skill in
the art and is
described in ISO/IEC 13239:2002 Information technology ¨ Telecommunications
and
information exchange between systems _____________________________ High-level
data link control (HDLC) procedures.
HDLC framing includes a beginning frame delimiter (e.g., `0x7E') and an ending
frame
delimiter (e.g., `0x7E'). The RLS header includes a logical address (e.g, port
number), a
control field for sequence numbers and other information (e.g., packet 1 of 2,
2 of 2 etc.), the
payload (e.g., the index file), and a checksum (e.g., a CRC). For bandwidth
management, the
importer 18 typically assigns logical addresses (e.g. ports) to AAS data based
on, for
example, the number and type of services being configured at any given studio
site 10. RLS
is described in more detail in U.S. Patent No. 7,305,043..
[0045] Due to
receiver implementation choices, RLS packets can be limited in size to
about 8192 bytes, but other sizes could be used. Therefore data may be
prepared for
transmission according to two primary data segmentation modes ¨ packet mode
and byte-
streaming mode ¨ for transmitting objects larger than the maximum packet size.
In packet
mode the importer 18 may include a large object transfer (LOT) client (e.g. a
software client
that executes on the same computer processing system as the importer 18 or on
a different
processing system such as a remote processing system) to segment a "large"
object (for
example, a sizeable image file) into fragments no larger than the chosen RLS
packet size. In
typical embodiments objects may range in size up to 4,294,967,295 bytes. At
the transmitter,
the LOT client writes packets to an RLS port for broadcast to the receiver. At
the receiver,
the LOT client reads packets from the RLS port of the same number. The LOT
client may
Date Recue/Date Received 2022-08-05
CA 02982341 2017-10-10
WO 2016/164750
PCT/US2016/026684
13
process data associated with many RLS ports (e.g., typically up to 32 ports)
simultaneously,
both at the receiver and the transmitter.
[0046] The
LOT client operates by sending a large object in several messages, each of
which is no longer than the maximum packet size. To accomplish this, the
transmitter
assigns an integer called a LotID to each object broadcast via the LOT
protocol. All
messages for the same object will use the same LotID. The choice of LotID is
arbitrary
except that no two objects being broadcast concurrently on the same RLS port
may have the
same LotID. In some implementations, it may be advantageous to exhaust all
possible LotID
values before a value is reused.
[0047] When
transmitting data over-the-air, there may be some packet loss due to the
probabilistic nature of the radio propagation environment. The LOT client
addresses this
issue by allowing the transmitter to repeat the transmission of an entire
object. Once an
object has been received correctly, the receiver can ignore any remaining
repetitions. All
repetitions will use the same LotID. Additionally, the transmitter may
interleave messages
for different objects on the same RLS port so long as each object on the port
has been
assigned a unique LotID.
[0048] The
LOT client divides a large object into messages, which are further subdivided
into fragments. Preferably all the fragments in a message, excepting the last
fragment, are a
fixed length such as 256 bytes. The last fragment may be any length that is
less than the
fixed length (e.g., less than 256 bytes). Fragments are numbered consecutively
starting from
zero. However, in some embodiments an object may have a zero-length object ¨
the
messages would contain only descriptive information about the object.
[0049] The
LOT client typically uses two types of messages ¨ a full header message, and
a fragment header message. Each message includes a header followed by
fragments of the
object. The full header message contains the information to reassemble the
object from the
CA 02982341 2017-10-10
WO 2016/164750
PCT/US2016/026684
14
fragments plus descriptive information about the object. By comparison, the
fragment header
message contains only the reassembly information. The LOT client of the
receiver (e.g. a
software and/or hardware application that typically executes within the data
processors 232
and 288 of FIGs. 7 and 8 respectively or any other suitable processing system)
distinguishes
between the two types of messages by a header-length field (e.g. field name
"hdrLen"). Each
message can contain any suitable number of fragments of the object identified
by the LotID
in the header as long as the maximum RLS packet length is not exceeded. There
is no
requirement that all messages for an object contain the same number of
fragments. Table 1
below illustrates exemplary field names and their corresponding descriptions
for a full header
message. Fragment header messages typically include only the hdrLen, repeat,
LotID, and
position fields.
CA 02982341 2017-10-10
WO 2016/164750
PCT/US2016/026684
muumAmiumiumq on[ELD;DEscRtrnoNmmmmmm;:momgmoqmmmpiu
Size of the header in bytes, including the hdrLen field.
hdrLen
Typically ranges from 24¨ 255 bytes.
Number of object repetitions remaining.
Typically ranges from 0 to 255.
All messages for the same repetition of the object use the same
Repeat repeat value. When repeating an objectõ the transmitter
broadcasts
all messages having repeat = R before broadcasting any messages
having repeat = R-1.
A value of 0 typically means the object will not be repeated again.
Arbitrary identifier assigned by the transmitter to the object.
LotID Typically range from 0 to 65,535. All messages for the
same object
use the same LotID value.
The byte offset in the reassembled object of the first fragment in the
Position message equals 256*position. Equivalent to "fragment
number".
Version Version of the LOT protocol
Year, month, day, hour, and minute after which the object may be
discardTime discarded at the receiver. Expressed in Coordinated
Universal Time
(UTC).
fileSize Total size of the object in bytes.
mime Hash MIME hash describing the type of object
Filename File name associated with the object
TABLE 1
100501 Full
header and fragment header messages may be sent in any ratio provided that
at least one full header message is broadcast for each object. Bandwidth
efficiency will
typically be increased by minimizing the number of full header messages;
however, this may
increase the time necessary for the receiver to determine whether an object is
of interest
based on the descriptive information that is only present in the full header.
Therefore there is
typically a trade between efficient use of broadcast bandwidth and efficient
receiver
processing and reception of desired LOT files.
[00511 In
byte-streaming mode, as in packet mode, each data service is allocated a
specific bandwidth by the radio station operators based on the limits of the
digital radio
broadcast modem frames. The importer 18 then receives data messages of
arbitrary size from
CA 02982341 2017-10-10
WO 2016/164750
PCT/US2016/026684
16
the data services. The data bytes received from each service are then placed
in a byte bucket
(e.g. a queue) and HDLC frames are constructed based on the bandwidth
allocated to each
service. For example, each service may have its own HDLC frame that will be
just the right
size to fit into a modem frame. For example, assume that there are two data
services, service
# 1 and service # 2. Service # 1 has been allocated 1024 bytes, and service #
2 512 bytes.
Now assume that service # 1 sends message A having 2048 bytes, and service # 2
sends
message B also having 2048 bytes. Thus the first modem frame will contain two
HDLC
frames; a 1024 byte frame containing N bytes of message A and a 512 byte HDLC
frame
containing M bytes of message B. N & M are determined by how many HDLC escape
characters are needed and the size of the RLS header information. If no escape
characters are
needed then N = 1015 and M = 503 assuming a 9 byte RLS header. If the messages
contain
nothing but HDLC framing bytes (i.e. 0x7E) then N = 503 and M = 247, again
assuming a 9
byte RLS header containing no escape characters. Also, if data service #1 does
not send a
new message (call it message AA) then its unused bandwidth may be given to
service #2 so
its HDLC frame will be larger than its allocated bandwidth of 512 bytes.
100521 The
exporter 20 contains the hardware and software necessary to supply the main
program service and SIS for broadcasting. The exporter accepts digital MPS
audio 26 over
an audio interface and compresses the audio. The exporter also multiplexes MPS
data 40,
exporter link data 24, and the compressed digital MPS audio to produce exciter
link data 52.
In addition, the exporter accepts analog MPS audio 28 over its audio interface
and applies a
pre-programmed delay to it to produce a delayed analog MPS audio signal 30.
This analog
audio can be broadcast as a backup channel for hybrid IBOC digital radio
broadcasts. The
delay compensates for the system delay of the digital MPS audio, allowing
receivers to blend
between the digital and analog program without a shift in time. In an AM
transmission
CA 02982341 2017-10-10
WO 2016/164750
PCT/US2016/026684
17
system, the delayed MPS audio signal 30 is converted by the exporter to a mono
signal and
sent directly to the STL as part of the exciter link data 52.
[0053] The
EASU 22 accepts MPS audio 42 from the studio automation equipment, rate
converts it to the proper system clock, and outputs two copies of the signal,
one digital (26)
and one analog (28). The EASU includes a GPS receiver that is connected to an
antenna 25.
The GPS receiver allows the EASU to derive a master clock signal, which is
synchronized to
the exciter's clock by use of GPS units. The EASU provides the master system
clock used by
the exporter. The EASU is also used to bypass (or redirect) the analog MPS
audio from
being passed through the exporter in the event the exporter has a catastrophic
fault and is no
longer operational. The bypassed audio 32 can be fed directly into the STL
transmitter,
eliminating a dead-air event.
[0054] STL
transmitter 48 receives delayed analog MPS audio 50 and exciter link data
52. It outputs exciter link data and delayed analog MPS audio over STL link
14, which may
be either unidirectional or bidirectional. The STL link may be a digital
microwave or
Ethernet link, for example, and may use the standard User Datagrarn Protocol
or the standard
TCP/IP.
[0055] The
transmitter site includes an STL receiver 54, an exciter engine (exgine) 56
and an analog exciter 60. The STL receiver 54 receives exciter link data,
including audio and
data signals as well as command and control messages, over the STL link 14.
The exciter
link data is passed to the exciter 56, which produces the IBOC digital radio
broadcasting
waveform. The exciter includes a host processor, digital up-converter, RF up-
converter, and
exgine subsystem 58. The exgine accepts exciter link data and modulates the
digital portion
of the IBOC digital radio broadcasting waveform. The digital up-converter of
exciter 56
converts from digital-to-analog the baseband portion of the exgine output. The
digital-to-
analog conversion is based on a GPS clock, common to that of the exporter's
GPS-based
WO 2016/164750
PCT/US2016/026684
18
clock derived from the EASU. Thus, the exciter 56 includes a UPS unit and
antenna 57. An
alternative method for synchronizing the exporter and exciter clocks can be
found in United
States Patent No. 7,512,175.
The RF up-converter of the exciter up-converts the analog signal to the proper
in-band
channel frequency. The up-converted signal is then passed to the high power
amplifier 62
and antenna 64 for broadcast. In an AM transmission system, the exgine
subsystem
coherently adds the backup analog MPS audio to the digital waveform in the
hybrid mode;
thus, the AM transmission system does not include the analog exciter 60. In
addition, in an
AM transmission system, the exciter 56 produces phase and magnitude
information and the
analog signal is output directly to the high power amplifier.
[0056] IBOC
digital radio broadcasting signals can be transmitted in both AM and FM
radio bands, using a variety of waveforms. The waveforms include an FM hybrid
IBOC
digital radio broadcasting waveform, an FM all-digital IBOC digital radio
broadcasting
waveform, an AM hybrid IBOC digital radio broadcasting waveform, and an AM all-
digital
IBOC digital radio broadcasting waveform.
[0057] FIG. 2 is a
schematic representation of a hybrid FM IBOC waveform 70. The
waveform includes an analog modulated signal 72 located in the center of a
broadcast
channel 74, a first plurality of evenly spaced orthogonally frequency division
multiplexed
subcarriers 76 in an upper sideband 78, and a second plurality of evenly
spaced orthogonally
frequency division multiplexed subcarriers 80 in a lower sideband 82. The
digitally
modulated subcarriers are divided into pdititions and various subcarriers are
designated as
reference subcarriers. A frequency partition is a group of 19 OFDM subcarriers
containing
18 data subcarriers and one reference subcarrier.
100581 The hybrid
waveform includes an analog FM-modulated signal, plus digitally
modulated primary main subcarriers. The subcarriers are located at evenly
spaced frequency
Date Recue/Date Received 2022-08-05
CA 02982341 2017-10-10
WO 2016/164750
PCT/US2016/026684
19
locations. The subcarrier locations are numbered from ¨546 to +546. In the
waveform of
FIG. 2, the subcarriers are at locations +356 to +546 and -356 to -546. Each
primary main
sideband is comprised of ten frequency partitions. Subcarriers 546 and -546,
also included in
the primary main sidebands, are additional reference subcarriers. The
amplitude of each
subcarrier can be scaled by an amplitude scale factor.
100591 FIG. 3
is a schematic representation of an extended hybrid FM IBOC waveform
90. The extended hybrid waveform is created by adding primary extended
sidebands 92, 94
to the primary main sidebands present in the hybrid waveform. One, two, or
four frequency
partitions can be added to the inner edge of each primary main sideband. The
extended
hybrid waveform includes the analog FM signal plus digitally modulated primary
main
subcarriers (subcarriers +356 to +546 and -356 to -546) and some or all
primary extended
subcarriers (subcarriers +280 to +355 and -280 to -355).
100601 The
upper primary extended sidebands include subcarriers 337 through 355 (one
frequency partition), 318 through 355 (two frequency partitions), or 280
through 355 (four
frequency partitions). The lower primary extended sidebands include
subcarriers -337
through -355 (one frequency partition), -318 through -355 (two frequency
partitions), or -280
through -355 (four frequency partitions). The amplitude of each subcarrier can
be scaled by
an amplitude scale factor.
100611 FIG. 4
is a schematic representation of an all-digital FM IBOC waveform 100.
The all-digital waveform is constructed by disabling the analog signal, fully
extending the
bandwidth of the primary digital sidebands 102, 104, and adding lower-power
secondary
sidebands 106, 108 in the spectrum vacated by the analog signal. The all-
digital waveform in
the illustrated embodiment includes digitally modulated subcarriers at
subcarrier locations -
546 to +546, without an analog FM signal.
CA 02982341 2017-10-10
WO 2016/164750
PCT/US2016/026684
[0062] In
addition to the ten main frequency partitions, all four extended frequency
partitions are present in each primary sideband of the all-digital waveform.
Each secondary
sideband also has ten secondary main (SM) and four secondary extended (SX)
frequency
partitions. Unlike the primary sidebands, however, the secondary main
frequency partitions
are mapped nearer to the channel center with the extended frequency partitions
farther from
the center.
[0063] Each
secondary sideband also supports a small secondary protected (SP) region
110, 112 including 12 OFDM subcarriers and reference subcarriers 279 and -279.
The
sidebands are referred to as "protected" because they are located in the area
of spectrum least
likely to be affected by analog or digital interference. An additional
reference subcarrier is
placed at the center of the channel (0). Frequency partition ordering of the
SP region does
not apply since the SP region does not contain frequency partitions.
[0064] Each
secondary main sideband spans subcarriers 1 through 190 or -1
through -190. The upper secondary extended sideband includes subcarriers 191
through 266,
and the upper secondary protected sideband includes subcarriers 267 through
278, plus
additional reference subcarrier 279. The lower secondary extended sideband
includes
subcarriers -191 through -266, and the lower secondary protected sideband
includes
subcarriers -267 through -278, plus additional reference subcarrier -279. The
total frequency
span of the entire all-digital spectrum is 396,803 Hz. The amplitude of each
subcarrier can be
scaled by an amplitude scale factor. The secondary sideband amplitude scale
factors can be
user selectable. Any one of the four may be selected for application to the
secondary
sidebands.
[0065] In
each of the waveforms, the digital signal is modulated using orthogonal
frequency division multiplexing (OFDM). OFDM is a parallel modulation scheme
in which
the data stream modulates a large number of orthogonal subcarriers, which are
transmitted
CA 02982341 2017-10-10
WO 2016/164750
PCT/US2016/026684
21
simultaneously. OFDM is inherently flexible, readily allowing the mapping of
logical
channels to different groups of subcarriers.
[0066] In the
hybrid waveform, the digital signal is transmitted in primary main (PM)
sidebands on either side of the analog FM signal in the hybrid waveform. The
power level of
each sideband is appreciably below the total power in the analog FM signal.
The analog
signal may be monophonic or stereophonic, and may include subsidiary
communications
authorization (SCA) channels.
[0067] In the
extended hybrid waveform, the bandwidth of the hybrid sidebands can be
extended toward the analog FM signal to increase digital capacity. This
additional spectrum,
allocated to the inner edge of each primary main sideband, is termed the
primary extended
(PX) sideband.
[0068] In the
all-digital waveform, the analog signal is removed and the bandwidth of the
primary digital sidebands is fully extended as in the extended hybrid
waveform. In addition,
this waveform allows lower-power digital secondary sidebands to be transmitted
in the
spectrum vacated by the analog FM signal.
100691 FIG. 5
is a schematic representation of an AM hybrid IBOC digital radio
broadcasting waveform 120. The hybrid format includes the conventional AM
analog signal
122 (bandlimited to about 5 kHz) along with a nearly 30 kHz wide digital
radio
broadcasting signal 124. The spectrum is contained within a channel 126 having
a bandwidth
of about 30 kHz. The channel is divided into upper 130 and lower 132 frequency
bands. The
upper band extends from the center frequency of the channel to about +15 kHz
from the
center frequency. The lower band extends from the center frequency to about -
15 kHz from
the center frequency.
100701 The AM
hybrid IBOC digital radio broadcasting signal format in one example
comprises the analog modulated carrier signal 134 plus OFDM subcarrier
locations spanning
CA 02982341 2017-10-10
WO 2016/164750
PCT/US2016/026684
22
the upper and lower bands. Coded digital information representative of the
audio or data
signals to be transmitted (program material), is transmitted on the
subcarriers. The symbol
rate is less than the subcarrier spacing due to a guard time between symbols.
100711 As
shown in FIG. 5, the upper band is divided into a primary section 136, a
secondary section 138, and a tertiary section 144. The lower band is divided
into a primary
section 140, a secondary section 142, and a tertiary section 143. For the
purpose of this
explanation, the tertiary sections 143 and 144 can be considered to include a
plurality of
groups of subcarriers labeled 146 and 152 in FIG. 5. Subcarriers within the
tertiary sections
that are positioned near the center of the channel are referred to as inner
subcarriers, and
subcarriers within the tertiary sections that are positioned farther from the
center of the
channel are referred to as outer subcarriers. The groups of subcarriers 146
and 152 in the
tertiary sections have substantially constant power levels. FIG. 5 also shows
two reference
subcarriers 154 and 156 for system control, whose levels are fixed at a value
that is different
from the other sidebands.
100721 The
power of subcarriers in the digital sidebands is significantly below the total
power in the analog AM signal. The level of each OFDM subcarrier within a
given primary
or secondary section is fixed at a constant value. Primary or secondary
sections may be
scaled relative to each other. In addition, status and control information is
transmitted on
reference subcarriers located on either side of the main carrier. A separate
logical channel,
such as an IBOC Data Service (IDS) channel can be transmitted in individual
subcarriers just
above and below the frequency edges of the upper and lower secondary
sidebands. The
power level of each primary OFDM subcarrier is fixed relative to the
unmodulated main
analog carrier. However, the power level of the secondary subcarriers, logical
channel
subcarriers, and tertiary subcarriers is adjustable.
CA 02982341 2017-10-10
WO 2016/164750
PCT/US2016/026684
23
[0073] Using
the modulation format of FIG. 5, the analog modulated carrier and the
digitally modulated subcarriers are transmitted within the channel mask
specified for standard
AM broadcasting in the United States. The hybrid system uses the analog AM
signal for
tuning and backup.
[0074] FIG. 6
is a schematic representation of the subcarrier assignments for an all-digital
AM IBOC digital radio broadcasting waveform The all-digital AM IBOC digital
radio
broadcasting signal 160 includes first and second groups 162 and 164 of evenly
spaced
subcarriers, referred to as the primary subcarriers, that are positioned in
upper and lower
bands 166 and 168. Third and fourth groups 170 and 172 of subcarriers,
referred to as
secondary and tertiary subcarriers respectively, are also positioned in upper
and lower bands
166 and 168. Two reference subcarriers 174 and 176 of the third group lie
closest to the
center of the channel. Subcarriers 178 and 180 can be used to transmit program
information
data.
[0075] FIG. 7
is a simplified functional block diagram of the relevant components of an
exemplary AM IBOC digital radio broadcasting receiver 200. While only certain
components of the receiver 200 are shown for exemplary purposes, it should be
apparent that
the receiver may comprise a number of additional components and may be
distributed among
a number of separate enclosures having tuners and front-ends, speakers, remote
controls,
various input/output devices, etc. The receiver 200 has a tuner 206 that
includes an input 202
connected to an antenna 204. The receiver also includes a baseband processor
201 that
includes a digital down converter 208 for producing a baseband signal on line
210. An
analog demodulator 212 demodulates the analog modulated portion of the
baseband signal to
produce an analog audio signal on line 214. A digital demodulator 216
demodulates the
digitally modulated portion of the baseband signal. Then the digital signal is
deinterleaved
by a deinterleaver 218, and decoded by a Viterbi decoder 220. A service
demultiplexer 222
CA 02982341 2017-10-10
WO 2016/164750
PCT/US2016/026684
24
separates main and supplemental program signals from data signals. A processor
224
processes the program signals to produce a digital audio signal on line 226.
The analog and
main digital audio signals are blended as shown in block 228, or a
supplemental digital audio
signal is passed through, to produce an audio output on line 230. A data
processor 232
processes the data signals and produces data output signals on lines 234, 236
and 238. The
data lines 234, 236, and 238 may be multiplexed together onto a suitable bus
such as an inter-
integrated circuit (I2C), serial peripheral interface (SPI), universal
asynchronous
receiver/transmitter (UART), or universal serial bus (USB). The data signals
can include, for
example, SIS, MPS data, SPS data, and one or more AAS.
100761 The
host controller 240 receives and processes the data signals (e.g., the SIS,
MPSD, SPSD, and AAS signals). The host controller 240 comprises a
microcontroller that is
coupled to the display control unit (DCU) 242 and memory module 244. Any
suitable
microcontroller could be used such as an AtmelO AVR 8-bit reduced instruction
set
computer (RISC) microcontroller, an advanced RISC machine (ARMS) 32-bit
microcontroller or any other suitable microcontroller. Additionally, a portion
or all of the
functions of the host controller 240 could be performed in a baseband
processor (e.g., the
processor 224 and/or data processor 232). The DCU 242 comprises any suitable
I/0
processor that controls the display, which may be any suitable visual display
such as an LCD
or LED display. In certain embodiments, the DCU 242 may also control user
input
components via touch-screen display. In certain embodiments the host
controller 240 may
also control user input from a keyboard, dials, knobs or other suitable
inputs. The memory
module 244 may include any suitable data storage medium such as RAM, Flash ROM
(e.g.,
an SD memory card), and/or a hard disk drive. In certain embodiments, the
memory module
244 may be included in an external component that communicates with the host
controller
240 such as a remote control.
CA 02982341 2017-10-10
WO 2016/164750
PCT/US2016/026684
[0077] FIG. 8
is a simplified functional block diagram of the relevant components of an
exemplary FM IBOC digital radio broadcasting receiver 250. While only certain
components
of the receiver 250 are shown for exemplary purposes, it should be apparent
that the receiver
may comprise a number of additional components and may be distributed among a
number of
separate enclosures having tuners and front-ends, speakers, remote controls,
various
input/output devices, etc. The exemplary receiver includes a tuner 256 that
has an input 252
connected to an antenna 254. The receiver also includes a baseband processor
251. The IF
signal from the tuner 256 is provided to an analog-to-digital converter and
digital down
converter 258 to produce a baseband signal at output 260 comprising a series
of complex
signal samples. The signal samples are complex in that each sample comprises a
"real"
component and an "imaginary" component. An analog demodulator 262 demodulates
the
analog modulated portion of the baseband signal to produce an analog audio
signal on line
264. The digitally modulated portion of the sampled baseband signal is next
filtered by
isolation filter 266, which has a pass-band frequency response comprising the
collective set
of subcarriers frfi, present in the received OFDM signal. First adjacent
canceller (FAC) 268
suppresses the effects of a first-adjacent interferer. Complex signal 269 is
routed to the input
of acquisition module 296, which acquires or recovers OFDM symbol timing
offset or error
and carrier frequency offset or error from the received OFDM symbols as
represented in
received complex signal 298. Acquisition module 296 develops a symbol timing
offset At
and carrier frequency offset Af, as well as status and control information.
The signal is then
demodulated (block 272) to demodulate the digitally modulated portion of the
baseband
signal. Then the digital signal is deinterleaved by a deinterleaver 274, and
decoded by a
Viterbi decoder 276. A service demultiplexer 278 separates main and
supplemental program
signals from data signals. A processor 280 processes the main and supplemental
program
signals to produce a digital audio signal on line 282 and MPSD/SPSD 281. The
analog and
CA 02982341 2017-10-10
WO 2016/164750
PCT/US2016/026684
26
main digital audio signals are blended as shown in block 284, or the
supplemental program
signal is passed through, to produce an audio output on line 286. A data
processor 288
processes the data signals and produces data output signals on lines 290, 292
and 294. The
data lines 290, 292 and 294 may be multiplexed together onto a suitable bus
such as an I2C,
SPI, UART, or USB. The data signals can include, for example, SIS. MPS data,
SPS data,
and one or more AAS.
[0078] The
host controller 296 receives and processes the data signals (e.g., SIS, MPS
data, SPS data, and AAS). The host controller 296 comprises a microcontroller
that is
coupled to the DCU 298 and memory module 300. Any suitable microcontroller
could be
used such as an Atmelo AVR 8-bit RISC microcontroller, an advanced RISC
machine
(ARM I1) 32-bit microcontroller or any other suitable microcontroller.
Additionally, a portion
or all of the functions of the host controller 296 could be performed in a
baseband processor
(e.g., the processor 280 and/or data processor 288). The DCU 298 comprises any
suitable I/O
processor that controls the display, which may be any suitable visual display
such as an LCD
or LED display. In certain embodiments, the DCU 298 may also control user
input
components via a touch-screen display. In certain embodiments the host
controller 296 may
also control user input from a keyboard, dials, knobs or other suitable
inputs. The memory
module 300 may include any suitable data storage medium such as RAM, Flash ROM
(e.g.,
an SD memory card), and/or a hard disk drive. In certain embodiments, the
memory module
300 may be included in an external component that communicates with the host
controller
296 such as a remote control.
[0079] In
practice, many of the signal processing functions shown in the receivers of
FIGs. 7 and 8 can be implemented using one or more integrated circuits. For
example, while
in FIGs. 7 and 8 the signal processing block, host controller, DCU, and memory
module are
CA 02982341 2017-10-10
WO 2016/164750
PCT/US2016/026684
27
shown as separate components, the functions of two or more of these components
could be
combined in a single processor (e.g., a System on a Chip (SoC)).
[0080] FIGs.
9a and 9b are diagrams of an IBOC digital radio broadcasting logical
protocol stack from the transmitter perspective. From the receiver
perspective, the logical
stack will be traversed in the opposite direction. Most of the data being
passed between the
various entities within the protocol stack are in the form of protocol data
units (PDUs). A
PDU is a structured data block that is produced by a specific layer (or
process within a layer)
of the protocol stack. The PDUs of a given layer may encapsulate PDUs from the
next higher
layer of the stack and/or include content data and protocol control
information originating in
the layer (or process) itself. The PDUs generated by each layer (or process)
in the transmitter
protocol stack are inputs to a corresponding layer (or process) in the
receiver protocol stack.
[0081] As
shown in FIGs. 9a and 9b, there is a configuration administrator 330, which is
a system function that supplies configuration and control information to the
various entities
within the protocol stack. The configuration/control information can include
user defined
settings, as well as information generated from within the system such as GPS
time and
position. The service interfaces 331 represent the interfaces for all
services. The service
interface may be different for each of the various types of services. For
example, for MPS
audio and SPS audio, the service interface may be an audio card. For MPS data
and SPS data
the interfaces may be in the form of different APIs. For all other data
services the interface is
in the form of a single API. An audio encoder 332 encodes both MPS audio and
SPS audio
to produce core (Stream 0) and optional enhancement (Stream 1) streams of MPS
and SPS
audio encoded packets, which are passed to audio transport 333. Audio encoder
332 also
relays unused capacity status to other parts of the system, thus allowing the
inclusion of
opportunistic data. MPS and SPS data is processed by PSD transport 334 to
produce MPS
and SPS data PDUs, which are passed to audio transport 333. Audio transport
333 receives
CA 02982341 2017-10-10
WO 2016/164750
PCT/US2016/026684
28
encoded audio packets and PSD PDUs and outputs bit streams containing both
compressed
audio and program service data. The SIS transport 335 receives SIS data from
the
configuration administrator and generates SIS PDUs. A SIS PDU can contain
station
identification and location information, indications regarding provided audio
and data
services, as well as absolute time and position correlated to GPS, as well as
other information
conveyed by the station. The AAS data transport 336 receives AAS data from the
service
interface, as well as opportunistic bandwidth data from the audio transport,
and generates
AAS data PDUs, which can be based on quality of service parameters. The
transport and
encoding functions are collectively referred to as Layer 4 of the protocol
stack and the
corresponding transport PDUs are referred to as Layer 4 PDUs or L4 PDUs. Layer
2, which
is the channel multiplex layer, (337) receives transport PDUs from the SIS
transport, AAS
data transport, and audio transport, and formats them into Layer 2 PDUs. A
Layer 2 PDU
includes protocol control information and a payload, which can be audio, data,
or a
combination of audio and data. Layer 2 PDUs are routed through the correct
logical channels
to Layer 1 (338), wherein a logical channel is a signal path that conducts Li
PDUs through
Layer 1 with a specified grade of service, and possibly mapped into a
predefined collection of
sub carriers.
[0082] Layer
1 data in an IBOC system can be considered to be temporally divided into
frames (e.g., modem frames). In typical embodiments, each modem frame has a
frame
duration (Tf) of approximately 1.486 seconds. Each modem frame includes an
absolute layer
1 frame number (ALFN) in the SIS, which is a sequential number assigned to
every Layer 1
frame. This ALFN corresponds to the broadcast starting time of a modem frame.
The start
time of ALFN 0 was 00:00:00 Universal Coordinated Time (UTC) on Jan. 6, 1980
and each
subsequent ALFN is incremented by one from the previous ALFN. Thus the present
time can
CA 02982341 2017-10-10
WO 2016/164750
PCT/US2016/026684
29
be calculated by multiplying the next frame's ALFN with Tf and adding the
total to the start
time of ALFN 0.
[0083] There
are multiple Layer 1 logical channels based on service mode, wherein a
service mode is a specific configuration of operating parameters specifying
throughput,
performance level, and selected logical channels. The number of active Layer 1
logical
channels and the characteristics defining them vary for each service mode.
Status
information is also passed between Layer 2 and Layer 1. Layer 1 converts the
PDUs from
Layer 2 and system control information into an AM or FM IBOC digital radio
broadcasting
waveform for transmission. Layer 1 processing can include scrambling, channel
encoding,
interleaving, OFDM subcarrier mapping, and OFDM signal generation. The output
of
OFDM signal generation is a complex, baseband, time domain pulse representing
the digital
portion of an IBOC signal for a particular symbol. Discrete symbols are
concatenated to
form a continuous time domain waveform, which is modulated to create an IBOC
waveform
for transmission.
[0084] FIG.
10 shows a logical protocol stack from the receiver perspective. An IBOC
wavefoint is received by the physical layer, Layer 1 (560), which demodulates
the signal and
processes it to separate the signal into logical channels. The number and kind
of logical
channels will depend on the service mode, and may include logical channels P1-
P4, Primary
IBOC Data Service Logical Channel (PIDS), S1-S5, and SIDS. Layer 1 produces Li
PDUs
corresponding to the logical channels and sends the PDUs to Layer 2 (565),
which
demultiplexes the Li PDUs to produce SIS PDUs, AAS PDUs, and Stream 0 (core)
audio
PDUs and Stream 1 (optional enhanced) audio PDUs. The SIS PDUs are then
processed by
the SIS transport 570 to produce SIS data, the AAS PDUs are processed by the
AAS
transport 575 to produce AAS data, and the PSD PDUs are processed by the PSD
transport
580 to produce MPS data (MPSD) and any SPS data (SPSD). Encapsulated PSD data
may
CA 02982341 2017-10-10
WO 2016/164750
PCT/US2016/026684
also be included in AAS PDUs, thus processed by the AAS transport processor
575 and
delivered on line 577 to PSD transport processor 580 for further processing
and producing
MPSD or SPSD. The SIS data, AAS data, MPSD and SPSD are then sent to a user
interface
585. The SIS data, if requested by a user, can then be displayed. Likewise,
MPSD, SPSD,
and any text based or graphical AAS data can be displayed. The Stream 0 and
Stream 1
PDUs are processed by Layer 4, comprised of audio transport 590 and audio
decoder 595.
There may be up to N audio transports corresponding to the number of programs
received on
the IBOC waveform. Each audio transport produces encoded MPS packets or SPS
packets,
corresponding to each of the received programs. Layer 4 receives control
information from
the user interface, including commands such as to store or play programs, and
information
related to seek or scan for radio stations broadcasting an all-digital or
hybrid IBOC signal.
Layer 4 also provides status information to the user interface.
100851 FIGs.
11-16 and the accompanying description herein provide a detailed
description of exemplary approaches for systems and methods for automated
detection of
signal quality problems and errors (e.g., errors in content, non-adherence to
broadcasting
standards, etc.) in digital radio broadcast signals. These approaches may
further be used to
detect problems in digital radio broadcast transmitter and receiver systems
(e.g., software,
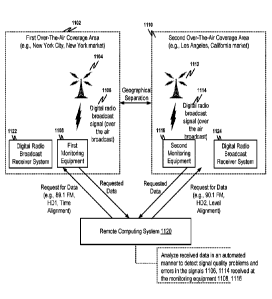
hardware, and/or firmware issues, etc.). FIG. 11 depicts an example system
including first
monitoring equipment 1108 located in an over-the-air coverage area 1102 of a
first radio
station. The first monitoring equipment 1108 may be configured to receive
digital radio
broadcast signals 1106 via digital radio broadcast transmission. The digital
radio broadcast
signals 1106 may also be received at a digital radio broadcast receiver system
1122 located in
the over-the-air coverage area 1102. The digital radio broadcast receiver
system 1122 may
be a consumer product that is included as part of an automobile's
entertainment system, for
CA 02982341 2017-10-10
WO 2016/164750
PCT/US2016/026684
31
instance. The
digital radio broadcast signals 1106 may be transmitted from a
transmitter 1104 of the first radio station.
[0086] The
system of FIG. 11 further includes second monitoring equipment 1116
located in an over-the-air coverage area 1110 of a second radio station. The
second
monitoring equipment 1116 may be configured to receive digital radio broadcast
signals 1114
via digital radio broadcast transmission. The digital radio broadcast signals
1114 may also be
received at a digital radio broadcast receiver system 1124 located in the over-
the-air coverage
area 1110. Like the digital radio broadcast receiver system 1122, the digital
radio broadcast
receiver system 1124 may be a consumer product, for example. Thus, in
examples, the first
and second monitoring equipment 1108, 1116 receive digital radio broadcast
signals that are
available to any digital radio broadcast receiver system operating within the
respective
coverage areas 1102, 1110. The digital radio broadcast signals 1114 may be
transmitted from
a transmitter 1112 of the second radio station.
[0087] In an
example, the over-the-air coverage areas 1102, 1110 of the first and second
radio stations, respectively, are different (e.g., separated geographically
and not overlapping).
Thus, as illustrated in the example of FIG. 11, the first over-the-air
coverage area 1102 may
be located in a "New York City, New York" market, and the second over-the-air
coverage
area 1110 may be located in a "Los Angeles, California" market. It should be
understood that
these markets are examples only. It should also be understood that the system
described
herein may include tens, hundreds, or thousands of monitors in various
different geographical
locations. Thus, although the example of FIG. 11 depicts only first and second
monitoring
equipment 1108, 1116, it is noted that the approaches described herein are not
limited to such
two-monitor scenarios. In some examples, multiple monitors may be located in a
single over-
the-air coverage area.
CA 02982341 2017-10-10
WO 2016/164750
PCT/US2016/026684
32
[0088] The
system of FIG. 11 further includes a remote computing system 1120. The
computing system 1120 is referred to as being "remote" because in the example
of FIG. 11,
the computing system 1120 is located in neither of the first or second over-
the-air coverage
areas 1102, 1110. In other examples, the computing system 1120 may be located
in one of
the first or second over-the-air coverage areas 1102, 1110. The remote
computing
system 1120 may be used in detecting signal quality problems and errors in
digital radio
broadcast signals. The remote computing system 1120 may further be used in
detecting
problems in digital radio broadcast transmitter and receiver systems. All of
these problems
may negatively affect an end-user's experience (e.g., listening experience,
experience
viewing information on a display of a receiver system, etc.). For example, the
remote
computing system 1120 may be used in detecting signal quality problems in the
digital radio
broadcast signals 1106, 1114. Such signal quality problems may include low
signal strength,
poor time alignment, poor level alignment, and poor phase alignment, among
others.
[0089] In
embodiments, the monitoring equipment 1108, 1116 are configured to compare
analog audio and digital audio received from the respective first and second
radio stations and
determine whether the two audio sources are properly aligned in time. As
explained below,
the remote computing system 1120 may transmit requests for data to the first
monitoring
equipment 1108 and the second monitoring equipment 1116. When the remote
computing
system 1120 requests "time alignment" data from the monitoring equipment 1108,
1116, the
respective monitoring equipment may respond with data indicative of whether
the two audio
sources are properly aligned in time, as determined using the above-described
comparison of
the analog audio and digital audio performed by the monitoring equipment.
Further, in
embodiments, the monitoring equipment 1108, 1116 are configured to measure the
relative
level and phase between the digital and analog audio sources and determine
whether the
sources are properly aligned in level and phase. Thus, when the remote
computing system
WO 2016/164750
PCT/US2016/026684
33
1120 requests "level alignment" data from the monitoring equipment 1108, 1116,
the
respective monitoring equipment may respond with data indicative of whether
the two audio
sources are properly aligned in level. The remote monitoring equipment 1108,
1116 may
generate this data by comparing the analog audio and digital audio received
from the
respective first and second radio stations to determine whether the two audio
sources are
properly aligned in level.
100901 Likewise,
when the remote computing system requests "phase alignment" data
from the monitoring equipment 1108, 1116, the respective monitoring equipment
may
respond with data indicative of whether the two audio sources are properly
aligned in phase.
The remote monitoring equipment 1108, 1116 may generate this data by comparing
the
analog audio and digital audio received from the respective first and second
radio stations to
determine whether the two audio sources are properly aligned in phase.
Misalignments in
time, level, and/or phase may cause audio distortion when a digital radio
broadcast receiver
blends between analog and digital audio. The monitoring equipment may
determine
measurements of time and phase alignment by computing the cross correlation
between the
analog and digital audio samples. The time offset corresponds to the offset
that provides the
maximum magnitude of cross-correlation peak. If the sign of the cross-
correlation peak is
negative, this means that the phase alignment is inverted (180 degrees). If
the sign is
positive, then the phase alignment is zero degrees. The computing of such
alignment values
is described in further detail in U.S. Patent No. 8,027,419.
The monitoring equipment may determine a measurement of level
alignment by computing the loudness of the analog and digital audio samples.
One algorithm
that may be implemented by the monitoring equipment to accomplish this is
outlined in ITU-
R Standard BS.1770-2 "Algorithms to Measure Audio Programme Loudness and True-
Peak
Audio Level."
Date Recue/Date Received 2022-08-05
CA 02982341 2017-10-10
WO 2016/164750
PCT/US2016/026684
34
[0091] The
remote computing system 1120 may also be used in detecting errors in the
digital radio broadcast signals 1106, 1114. These errors may relate to, for
example, (i) the
signals' non-compliance with digital radio broadcasting standard, and (ii)
errors in the
content of the signals 1106, 1114. Thus, in embodiments, the remote computer
system 1120
may be used in determining whether the signals 1106, 1114 are compliant with
digital radio
broadcasting standards. Such standards include, for example, the NRSC-5C
Standard known
to those of ordinary skill in the art. If the signals 1106, 1114 do not comply
with applicable
digital radio broadcasting standards, the end-user's experience could be
negatively affected.
Non-compliant signals can cause numerous issues to an NRSC-5C-compliant
receiver,
depending on the nature of the non-compliance. For example, a truly non-
compliant signal or
one that is broadcast in an unsupported NRSC-5C mode may not be received at
all. The
signal may be correct at the physical layer (i.e., correct modulation and
coding) but contain
errors in one or more of the application layers. For example, the signal may
have errors in
the audio transport, causing the receiver to fail to acquire digital audio. In
some examples,
errors may be sporadic, so that occasional digital audio packets are in error.
A receiver may
then output distorted digital audio. Another example is an error in the AAS
data transport
layer, so that the receiver is unable to properly receive traffic data
services.
[0092]
Further, in some examples, non-compliant signals can cause severe faults in
receivers (e.g., receiver hardware crashes). A
crash may result in a short interruption
(several seconds) of reception or in the worst case, the crash may render the
receiver totally
inoperative, where it no longer responds to user control until the power is
removed from the
device and subsequently restored. An example of this would be the length field
in an audio
or data packet being out of bounds or missing delimiters in a data sequence so
that the
receiver software cannot parse the data into its individual components.
Further, incorrect
values of parameters sent to control the analog/digital audio blending process
may cause
CA 02982341 2017-10-10
WO 2016/164750
PCT/US2016/026684
issues in receivers. Such incorrect values may result in the receiver having a
misalignment
between analog and digital audio, too high a digital audio level to the point
of clipping /
distortion, failure to play digital audio and only playing analog audio, or
muting of the
receiver audio altogether.
[0093] The
remote computing system 1120 may also be used in detecting errors in the
content of the signals 1106, 1114, as noted above. For instance, the remote
computing
system 1120 may analyze data received from the monitoring equipment 1108, 1116
to
determine if the first and second radio stations are broadcasting all required
text fields. If the
stations are broadcasting music, for example, the data may be analyzed to
ensure that the
"artist" text field is populated in the stations' broadcasts. As another
example, if the first
radio station intends to broadcast traffic information, the remote computing
system 1120 may
analyze data received from the monitoring equipment 1108 to ensure that the
broadcast signal
1106 actually includes such traffic information. In other examples, the
intended content may
include, for instance, images (e.g., album covers, artist pictures, etc.),
artist name, song title,
and album title, among other content. The remote computing system 1120 may be
used in
detecting if such content is missing or incorrect in digital radio broadcast
signals. When
signal quality problems and/or errors in the content of signals are detected
by the remote
computing system 1120, such issues may be indicative of problems in the
transmitter systems
(e.g, hardware, software, firmware, etc.) used by radio stations. It is thus
noted that the
systems and methods described herein may be used in detecting problems in
digital radio
broadcasting transmitter systems.
[0094] The
remote computing system 1120 may also be used in detecting problems that
are related to end-users' digital ratio broadcast receiver systems 1122, 1124.
In some
instances, the consumer's digital radio broadcast receiver system may
experience a fault (e.g.,
fail to render audio or visual data properly, etc.) despite the fact that
broadcasted signals have
CA 02982341 2017-10-10
WO 2016/164750
PCT/US2016/026684
36
little or no signal quality problems and are error-free or relatively error-
free. In these
instances, there may be an issue with the digital radio broadcast receiver
system's hardware,
software, or firmware, for instance. The remote computing system 1120 may be
used in
detecting such problems that are associated with the digital radio broadcast
receiver systems
1122, 1124, as described in further detail below.
100951 To
detect the problems described above (e.g., signal quality problems, errors in
broadcasted signals, problems in transmitter and/or receiver systems, etc.),
the remote
computing system 1120 may transmit requests for data to the first monitoring
equipment 1108 and the second monitoring equipment 1116. The requested data
may include
digital audio data and data services (e.g., weather, news, traffic, sports
scores, metadata
related to a song, etc.) that are received at the monitoring equipment 1108,
1116 during a
given time period. In some embodiments, all fields of data (e.g., all digital
audio data and
data services) received by the equipment 1108, 1116 during a given time period
may be
requested by the remote computing system 1120. Such data can provide the
remote
computing system 1120 with an exact picture of the data that is received at
end-users'
receivers in the respective coverage areas 1102, 1110 during the given time
period. Such
data may further provide the remote computing system 1120 with an exact
picture of the
station configurations of the respective first and second radio stations. With
this data, the
remote computing system 1120 can detect, for example, whether the broadcasted
signals
1106, 1114 are compliant with applicable broadcast standards and/or whether
the signals
1106, 1114 include content errors (e.g., missing content, incorrect content,
etc.). The
requested data may also be indicative of a signal quality of digital radio
broadcast signals
received at the respective monitoring equipment 1108, 1124. For example, the
requested data
may be indicative of signal strength, time alignment, phase alignment, and/or
level alignment
of the respective signals 1106, 1114, for example.
CA 02982341 2017-10-10
WO 2016/164750
PCT/US2016/026684
37
[0096] As
illustrated in the example of FIG. 11, the remote computing system 1120 may
transmit a request for data to the first monitoring equipment 1108, where the
request specifies
"89.1 FM, HD1 Audio, Time Alignment." A format of the request may vary in
different
examples. Additional details about the format of the request are described
below with
reference to FIGs. 12A-13. In this example, "89.1 FM" is a frequency at which
a digital
radio broadcast signal is transmitted by a radio station in the first over-the-
air coverage area
1102, "HD1 Audio" specifies that data is requested for HD1 Audio (as opposed
to HD2,
HD3, and HD4 audio, etc.), and "Time Alignment" specifies that data is
requested for a "time
alignment" attribute of the digital radio broadcast signal. The monitoring
equipment 1108
may be configured to generate time alignment data by comparing digital audio
and analog
audio received at the monitoring equipment 1108 to determine if the two audio
sources are
aligned in time, as described above. As described in further detail below, if
a time alignment
attribute of the digital radio broadcast signal is low, then a user may
experience audio quality
problems (e.g., echo, feedback, etc.).
[0097] In an
example, the request serves as control data for controlling the first
monitoring equipment 1108. Thus, in this example, based on its receipt of the
request from
the remote computing system 1120, the first monitoring equipment 1108 may tune
to the 89.1
FM frequency and begin receiving HD1 audio via a digital radio broadcast
signal. Further,
based on its receipt of the request, the first monitoring equipment 1108 may
generate and
transmit data indicative of the "time alignment" attribute of the received
digital radio
broadcast signal to the remote computing system 1120. This is the data
requested by the
remote computing system 1120, and FIG. 11 illustrates the requested data being
transmitted
from the first monitoring equipment 1108 to the remote computing system 1120.
[0098]
Similarly, the remote computing system 1120 may transmit a request for data to
the second monitoring equipment 1116, where the request specifies "90.1 FM,
HD2 Audio,
CA 02982341 2017-10-10
WO 2016/164750
PCT/US2016/026684
38
Level Alignment." "90.1 FM" is a frequency at which a digital radio broadcast
signal is
transmitted by a radio station in the second over-the-air coverage area 1110,
"HD2 Audio"
specifies that data is requested for HD2 Audio (as opposed to HD1, HD3, and
HD4 audio,
etc.), and "Level Alignment" specifies that data is requested for a level
alignment" attribute
of the digital radio broadcast signal. The monitoring equipment 1116 may be
configured to
generate level alignment data by comparing digital audio and analog audio
received at the
monitoring equipment 1116 to determine if the two audio sources are aligned in
level, as
described above. As described in further detail below, if a level alignment
attribute of the
digital radio broadcast signal is low, then a user may experience audio
quality problems (e.g.,
inadequate volume, etc.).
[0099] In an
example, the request serves as control data for controlling the second
monitoring equipment 1116. Thus, in this example, based on its receipt of the
request from
the remote computing system 1120, the second monitoring equipment 1116 may
tune to the
90.1 FM frequency and begin receiving HD2 audio via a digital radio broadcast
signal.
Further, based on its receipt of the request, the second monitoring equipment
1116 may
generate and transmit data indicative of the "level alignment" attribute of
the received digital
radio broadcast signal to the remote computing system 1120. FIG. 11
illustrates the
requested data being transmitted from the second monitoring equipment 1116 to
the remote
computing system 1120.
[00100] The remote computing system 1120 may receive the requested data from
the first
and second monitoring equipment 1108, 1116. As described above, the requested
data may
include (i) digital audio data and data services that are received at the
monitoring equipment
1108, 1116, and/or (ii) data indicative of a signal quality of signals
received at the monitoring
equipment 1108, 1116, among other data. After receiving the requested data,
the remote
computing system 1120 may be configured to analyze the received data to detect
signal
CA 02982341 2017-10-10
WO 2016/164750
PCT/US2016/026684
39
quality problems and/or errors in the signals 1106, 1114. The remote computing
system 1120
may be configured to perform such analysis in an automated manner that
requires no human
intervention or minimal human intervention. In an example, the analysis
includes comparing
the data received from the first and second monitoring equipment 1108, 1116 to
one or more
predetermined threshold values. In other examples, the analysis includes
comparing the data
received from the first and second monitoring equipment 1108, 1116 to data
indicative of a
baseline standard for signals broadcasted according to a digital radio
broadcasting standard.
In other examples, the analysis includes analyzing the data received from the
first and second
monitoring equipment 1108, 1116 to determine if the content of received
signals matches an
expected content of the signals.
1001011 For example, as described above, the remote computing system 1120 may
request
from the first monitoring equipment 1108 data indicative of the "time
alignment" attribute of
an 89.1 FM, HD1 Audio digital radio broadcast signal in the first over-the-air
coverage area
1102. After receiving the requested data, the remote computing system 1120 may
compare
the data to a time alignment threshold value. If the data is less than the
threshold value, then
the remote computing system 1120 may determine that the digital radio
broadcast signal has a
signal quality problem relating to its time alignment. In other examples,
multiple threshold
values may be employed (e.g., threshold values that are used to classify the
time alignment
attribute as being excellent, good, fair, poor, etc.). The remote computing
system 1120 may
generate an alarm signal or an alert signal based upon the detection of a
problem. Such an
alarm signal or alert signal may be transmitted to a radio station, thus
informing the radio
station of the problem. Alerts may be transmitted to other persons or
organizations in other
examples.
1001021 In an embodiment, the remote computing system 1120 performs the
analysis in
real-time or near real-time, such that the analysis is near the time at which
the digital radio
CA 02982341 2017-10-10
WO 2016/164750
PCT/US2016/026684
broadcast signal is broadcasted, thus enabling problems to be detected and
corrected soon
after the problems develop. In this regard, analysis in real-time involves the
computing
system 1120 analyzing the data received from the monitoring equipment 1108,
1116 upon
receipt of the data by the computing system 1120, so that any delays in
analyzing the digital
radio broadcast signals are minimal and amount to merely transmission delays
incurred in
transmitting the data from the monitoring equipment 1108, 1116 to the
computing system
1120. Analysis in near real-time involves the computing system 1120 analyzing
the data
received from the monitoring equipment 1108, 1116 within some short time
period after
receipt of the data by the computing system 1120 (e.g., within 1 minute, 5
minutes, 10
minutes, 15 minutes, 20 minutes or up to 30 minutes after receipt of the data
from the
monitoring equipment 1108, 1116 by the computing system 1120, etc.).
[00103] In examples, the remote computing system 1120 is configured to analyze
the
requested data from the first and second monitoring equipment 1108, 1116
simultaneously or
substantially simultaneously. Although the example of FIG. 11 illustrates a
system including
only first and second monitoring equipment 1108, 1116, in other examples, the
remote
computing system 1120 may receive data from tens, hundreds, or thousands of
monitors
located anywhere in the world. In these other examples, the remote computing
system 1120
may be configured to analyze the received data from the tens, hundreds, or
thousands of
monitors simultaneously or substantially simultaneously. Such data may be
analyzed and
monitored at the remote computing system 1120 at all times (e.g., analysis and
monitoring 24
hours a day, 7 days a week), thus enabling problems to be detected at any time
of the day and
week. The remote computing system 1120 may further be configured to
continuously (or
nearly continuously) (i) send out requests for data to the tens, hundreds, or
thousands of
monitors, and (ii) receive data from these monitors.
CA 02982341 2017-10-10
WO 2016/164750
PCT/US2016/026684
41
[00104] The systems and methods described herein may have advantages over
manual
approaches to addressing problems in digital radio broadcast signals,
transmitter systems, and
receiver system. As described previously herein, in a manual approach an
engineer would,
for example, be notified of a potential issue regarding problems in a
particular geographic
area, travel to the area with expensive equipment, record signal data, and
return to a
laboratory to analyze the data, Such a process can be burdensome, time
consuming,
expensive, and slow. By contrast, in the approaches described herein, the
monitoring
equipment 1108, 1116 and remote computing system 1120 may monitor and detect
problems
in a proactive manner, i.e., the problems are detected near the time at which
the problems first
develop and are not known only based on reports from end-users, etc. Also, in
the
approaches described herein, once monitoring equipment has been placed in
desired areas
(e.g., in different radio markets, etc.), all monitoring and analysis may be
performed remotely
and without a need for human intervention (or requiring only minimal human
intervention).
Further, the remote computing system 1120 described herein may analyze data
received from
tens, hundreds, or thousands of monitors simultaneously or substantially
simultaneously,
where such monitors may be collecting data from multiple (e.g., tens,
hundreds, or thousands)
radio stations. The remote computing system 1120 may detect problems
associated with any
of these stations based on its analyses. Further, the remote computing system
1120 may send
out requests to all of the different monitors around the country (or the
world) and tune /
analyze them systematically and decide what to do with that data based on
predetermined
thresholds and/or other data (e.g., data indicative of baseline standards for
transmitted signals,
data indicative of expected content, etc.).
[00105] FIG. 12A is a block diagram depicting an example system for automated
detection
of signal quality problems and errors in digital radio broadcast signals. In
the example of
FIG. 12A, monitoring equipment 1230 is located in an over-the-air coverage
area 1227 of a
CA 02982341 2017-10-10
WO 2016/164750
PCT/US2016/026684
42
radio station. The monitoring equipment 1230 is configured to receive digital
radio broadcast
signals via digital radio broadcast transmission from the radio station. The
example of
FIG. 12A further includes HD Radio Data Request and Filing Server 1220. The HD
Radio
Data Request and Filing Server 1220 may perform one or more of the functions
described
above as being performed by the remote computing system 1120 of FIG. 11. Thus,
the HD
Radio Data Request and Filing Server 1220 may be configured to transmit
requests for data
to the monitoring equipment 1230. The HD Radio Data Request and Filing Server
1220 may
further be configured to receive the requested data from the monitoring
equipment 1230 and
to analyze, in real-time or near real-time, the received data to detect signal
quality problems
and errors in the digital radio broadcast signals received by the monitoring
equipment 1230.
The HD Radio Data Request and Filing Server 1220 may further analyze the
requested data
to detect problems in receiver systems and transmitter systems andJor to
assist in the
detection of such problems.
[00106] To transmit requests for data from the HD Radio Data Request and
Filing Server
1220 to the monitoring equipment 1230, the example system of FIG. 12A utilizes
a
Proxy/SNMP Request Server 1226. In an example, the Proxy/SNMP Request Server
1226 is
local or near-local to the monitoring equipment 1230. As described above,
monitors may be
placed at various locations throughout the world. In an example, each
designated region of
the world has a single Proxy/SNMP Request Server 1226. The single Proxy/SNMP
Request
Server 1226 communicates with all monitors located within its associated
region. For
example, a "northeast" region of the United States may include monitors in New
York City
and Boston, and a single Proxy/SNMP Request Server 1226 may be associated with
all of the
monitors in these two cities. For these reasons, the Proxy/SNMP Request Server
1226 is said
to be "local or near-local" to the monitoring equipment 1230. By contrast, the
HD Radio
Data Request and Filing Server 1220 may be located anywhere in the world, and
the server
CA 02982341 2017-10-10
WO 2016/164750
PCT/US2016/026684
43
1220 need not be located near the monitoring equipment 1230 or the Proxy/SNMP
Request
Server 1226.
[00107] To use the Proxy/SNMP Request Server 1226 to transmit requests to the
monitoring equipment 1230, the HD Radio Data Request and Filing Server 1220
may
communicate with the Proxy/SNMP Request Server 1226 via application program
interface
(API) calls 1228. Using the API calls 1228, the HD Radio Data Request and
Filing Server
1220 may request data from the monitoring equipment 1230 (e.g., 89.1 FM, HD1
Audio,
Time Alignment data, etc.). To relay this request to the monitoring equipment
1230, the
Proxy/SNMP Request Server 1226 may use the Simple Network Management Protocol
(SNMP) protocol. Thus, the Proxy/SNMP Request Server 1226 may transmit the
request of
the HD Radio Data Request and Filing Server 1220 to the monitoring equipment
via SNMP
calls 1232. Based on the received request, the monitoring equipment 1230 may
tune to the
specified frequency to acquire the requested data. The monitoring equipment
1230 may then
transmit the requested data to the Proxy/SNMP Request Server 1226 using the
SNMP
protocol. The Proxy/SNMP Request Server 1226 may in turn transmit the
requested data to
the HD Radio Data Request and Filing Server 1220.
[00108] The data received at the HD Radio Data Request and Filing Server 1220
may be
stored in an HD Radio Monitor Database 1222. In an example, the data in the HD
Radio
Monitor Database 1222 is monitored and analyzed in real-time or near real-
time. The data in
the HD Radio Monitor Database 1222 may be monitored and analyzed, for example,
by the
HD Radio Data Request and Filing Server 1220 or by another computer system
coupled to
the HD Radio Monitor Database 1222. The HD Radio Data Request and Filing
Server 1220
or the other computer system may query the database 1222 and monitor and
analyze the data
returned based on such queries. The monitoring and analysis of the data in
real-time or near
real-time may allow problems to be detected shortly after they first arise. In
an example,
CA 02982341 2017-10-10
WO 2016/164750
PCT/US2016/026684
44
when a problem is detected by the HD Radio Data Request and Filing Server 1220
or the
computer system coupled to the HD Radio Monitor Database 1222, the server 1220
or the
computer system may generate an alert signal and cause this alert signal to be
transmitted to
appropriate recipients (e.g., a radio station associated with the digital
radio broadcast signal
having the problem). In other examples where the HD Radio Data Request and
Filing Server
1220 monitors and analyzes the data from the monitoring equipment 1230, the
server 1220
does so prior to storing the received data in the HD Radio Monitor Database
1222. This may
allow for faster detection of problems (e.g., problems may be detected prior
to storing the
data in the database 1222 and without a need to query the database 1222). It
should be
appreciated that the automated, real-time (or near real-time) analysis of data
and detection of
problems may be performed in a variety of different manners and using a
variety of different
systems and methods. Thus, it is noted that the scope of this disclosure is
not limited to the
specific embodiments described herein.
[00109] The example system of FIG. 12A may further include the OPS Deep Dive
Front-
end Server 1224. The OPS Deep Dive Front-end Server 1224 may transmit database
queries
to the HD Radio Monitor Database 1222, thus enabling the OPS Deep Dive Front-
end Server
1224 to monitor data stored in the database 1222. Based on such monitoring of
data, the OPS
Deep Dive Front-end Server 1224 may communicate with the HD Radio Data Request
and
Filing Server 1220 and use such communications to take control of the
monitoring equipment
1230 in real-time.
[00110] To illustrate an example process performed by the system of FIG. 12A,
reference
is made to FIG. 12B. In an example, the HD Radio Data Request and Filing
Server 1220
may send requests for data to the monitoring equipment 1230 as part of a
"routine
monitoring" operation. The routine monitoring operation is depicted in FIG.
12B at step
1126. For example, the HD Radio Data Request and Filing Server 1220 may send
requests to
CA 02982341 2017-10-10
WO 2016/164750
PCT/US2016/026684
the monitoring equipment 1230 that iterate through various frequencies,
various HD Radio
audio (e.g., HD1, HD2, HD3 audio, etc.), and various variables (e.g.,
different fields of
digital audio data and data services transmitted by the transmitter, variables
relating to time
alignment, level alignment, phase alignment, and signal strength attributes of
received
signals, etc.) in a repetitive and predictable fashion. Such routine
monitoring 1126 may thus
be carried out in an automated manner (e.g., according to algorithms that
generate requests
that iterate through the various frequencies and variables). The data received
as part of the
routine monitoring 1126 may relate to multiple different radio stations, e.g.,
by iterating
through the various frequencies, etc. The data received as part of the routine
monitoring
1126 may be stored in the HD Radio Monitor Database 1222 and analyzed by the
HD Radio
Data Request and Filing Server 1220 and/or the OPS Deep Dive Front-end Server
1224, for
instance.
[00111] At step 1128, based on the routine monitoring analysis, a potential
problem may
be detected in the received data. As indicated in the figure, the problem may
relate to a signal
quality issue, signal non-compliance with applicable broadcasting standards,
signal content
issues (e.g., expected content missing, content incorrect, etc.), or another
issue. Signal
quality issues relating to low signal strength, poor time alignment, poor
level alignment,
and/or poor phase alignment may be determined by comparing data indicative of
these signal
attributes to predetermined threshold values, as described above with
reference to FIG. 11.
Further, for example, it may be determined that a radio station is
broadcasting a signal that is
not compliant with applicable digital radio broadcasting standards by
comparing the received
data to data indicative of a baseline standard for signals broadcasted
according to a digital
radio broadcasting standard. An example digital radio broadcasting standard is
the NRSC-5C
standard, known to those of ordinary skill in the art. In examples, a computer-
based system
(e.g., HD Radio Data Request and Filing Server 1220 and/or the OPS Deep Dive
Front-end
CA 02982341 2017-10-10
WO 2016/164750
PCT/US2016/026684
46
Server 1224) checks the physical layer signaling bits to verify that the
service mode is
supported and that the associated system control data bits do not define an
illegal
combination of bits. Similarly, the computer-based system checks the audio and
data
transport layers to confirm that their signaling bits (such as audio mode,
blend control bits)
define a supported mode of operation. Further, the computer-based system may
check the
audio and data packet integrity by computing packet CRC errors. The quality of
the digital
modulation can also be checked by computing the modulation error ratio, which
is a measure
of the digital data signal to noise ratio. In other examples, additional
analysis may be
performed.
1001121 Likewise, it may be determined that a radio station is not
broadcasting correct
content by comparing the data received as part of the routine monitoring
operations 1126 to
data indicative of the content that should be broadcasted by the station. For
instance, a
database may identify all stations that should be broadcasting traffic
information. Thus, for
stations that should be broadcasting traffic information, the received data
can be analyzed to
determine if such information is in fact being broadcasted. In examples, a
computer-based
system (e.g., HD Radio Data Request and Filing Server 1220 and/or the OPS Deep
Dive
Front-end Server 1224) verifies that the SIS channel contains the appropriate
"Scan code,"
indicating the presence of traffic data. In addition, the SIG channel is
checked for the
presence of the appropriate signaling information used to identify a data port
number devoted
to traffic. The computer-based system may further analyze the traffic data
port to confirm
that there is activity on the port. In other examples, additional analysis may
be performed.
1001131 As another example, when audio for a song is being broadcasted, a
picture and
song name should be broadcasted contemporaneously, in some embodiments (e.g.,
such that
the picture and song name can be displayed on a display of the receiver at the
same time that
the audio is being rendered). By analyzing data received as part of the
routine monitoring
CA 02982341 2017-10-10
WO 2016/164750
PCT/US2016/026684
47
operations 1126, it can be determined if stations are failing to broadcast the
picture and song
name data. More generally, this data analysis can be used to verify proper
time
synchronization between broadcast data (e.g., to verify proper time
synchronization between
audio, PSD, and album art images, etc.), and to detect other such issues
related to signal
content. In examples, a computer-based system (e.g., HD Radio Data Request and
Filing
Server 1220 and/or the OPS Deep Dive Front-end Server 1224) verifies that an
album art
image file is received in advance of the image display trigger for that file
sent in PSD.
Audio, PSD, and album art data can also be stored in a file for playback
later, when a listener
can determine if the audio is aligned with the data. In other examples,
additional analysis
may be performed.
1001141 In some examples, the analysis of the data performed by the HD Radio
Data
Request and Filing Server 1220 or Deep Dive Front-end Server 1234 may focus on
a
presence or absence of data that should be broadcasted (e.g., whether traffic
information is
being broadcasted or not), and in other examples, the analysis may focus on
whether the
broadcasted data is correct or incorrect. For example, data received from the
monitor 1230
can be analyzed to verify the integrity of each textual field. This analysis
can be performed
to ensure that radio stations are sending their intended call sign, and also
to ensure that all
associated formatting information, such as delimiters and text encoding method
indicators,
are correct. In examples, a computer-based system (e.g., HD Radio Data Request
and Filing
Server 1220 and/or the OPS Deep Dive Front-end Server 1224) checks call signs
to verify
that they contain the correct number of characters and in the case of signals
broadcast in the
United States, that they start with a "W" or "K" character. The computer-based
system can
also verify call signs against a pre-stored database of call signs versus
geographic location
and frequency.
CA 02982341 2017-10-10
WO 2016/164750
PCT/US2016/026684
48
[00115] Likewise, for example, data received from the monitor 1230 can be
analyzed to
determine whether "artist name" fields in the received data actually reflect
artist names, as
opposed to other, incorrect data. In examples, a computer-based system (e.g.,
HD Radio Data
Request and Filing Server 1220 and/or the OPS Deep Dive Front-end Server 1224)
verifies
that the artist name does not contain illegal characters (such as a tab
character), the text
encoding indicator byte shows a supported encoding method, the artist name
contains at least
one displayable character, and does not exceed the specified maximum number of
characters.
Further, in embodiments, the content analysis performed by the server 1220 or
server 1224
may be used to ensure the integrity of data service broadcasts, including
signaling
information in SIS and SIG. SIS and SIG information is required by receivers
to scan the
band to discover a desired data service and subsequently to open the correct
data port to read
the data service and to render information on the display screen. Thus, by
analyzing data
received from the monitor 1230 as part of the routine monitoring 1126, it can
be determined
if stations are failing to broadcast such SIS and SIG information. SIS and SIG
contain
similar information, and thus, a consistency check can be performed between
these two
signaling channels. The contents of the channels can also be inspected for
missing data
fields. Specific data services are indicated in SIS by "scan codes" and in SIG
by "mime hash
values." These fields can be checked against a known table of values to
confirm that they are
correct. SIG can also be checked to confirm that an undefined port number is
not being
indicated.
[00116] In other examples, the content analysis performed by the servers 1220,
1224 may
be used to verify the integrity of broadcasted audio programs, e.g., to ensure
that the audio
programs do not include long periods of silence, among other issues. In
examples, a
computer-based system (e.g., the server 1220, the server 1224, etc.)
determines silence by
analyzing the digital audio samples and comparing them to a threshold. If all
of the samples
CA 02982341 2017-10-10
WO 2016/164750
PCT/US2016/026684
49
fall below a pre-determined threshold over a certain time period, then the
computer-based
system can determine that the signals include silence. Silence may also occur
because of a
fault in the audio transport. The data provided by the monitoring equipment
includes a
measure of the digital audio quality, based on integrity of audio transport
packets. If the
quality is very low, or zero, then digital audio will not be output by the
receiver.
[00117] To perform the various types of content analysis described herein, the
requests
transmitted to the monitoring equipment 1230 from the server 1220 may request
all fields of
audio data and data services received at the monitoring equipment 1230 or a
specific subset
of these fields. The fields of data received from the monitoring equipment
1230 can then be
analyzed by the server 1220 or the server 1224 as described above.
[00118] In some instances, when a problem is detected at the step 1128, the
routine
monitoring may be interrupted. For example, when the server 1220 or server
1224 detects a
certain condition based on its analysis of the data received as a result of
the routine
monitoring, the OPS Deep Dive Front-end Server 1224 may interrupt the routine
monitoring.
Thus, instead of using the HD Radio Data Request and Filing Server 1220 to
receive the data
described above (e.g., iterating through various frequencies, HD Radio audio,
and variables),
the OPS Deep Dive Front-end Server 1224 may communicate with the HD Radio Data
Request and Filing Server 1220 and use these communications to (i) take
control of the
monitoring equipment 1230 in real-time, and (ii) request particular data
related to the
observed condition. Such actions implement a "deep dive" functionality, as
shown at step
1131 in FIG. 12B.
[00119] When using the deep dive functionality, for example, the OPS Deep Dive
Front-
end Server 1224 may communicate with the HD Radio Data Request and Filing
Server 1220
and use these communications to request from the monitoring equipment 1230 all
data
available for a particular radio station. The data available for the
particular radio station may
CA 02982341 2017-10-10
WO 2016/164750
PCT/US2016/026684
include all fields of digital audio data and data services transmitted by the
radio station and
all variables relating to signal quality attributes of received signals (e.g.,
variables relating to
time alignment, level alignment, phase alignment, and signal strength
attributes, etc.). This
data may be used by the OPS Deep Dive Front-end Server 1224 to diagnose a
problem
associated with the signals broadcasted by the particular radio station. The
request for all
data available for the particular radio station may differ from the routine
monitoring requests
that are transmitted from the HD Radio Data Request and Filing Server 1220 to
the
monitoring equipment 1230, which, as described above, may relate to multiple
different radio
stations.
1001201 The data received through the use of the deep dive functionality may
be analyzed
in various ways. For example, in the deep dive analysis, the monitoring
equipment 1230 may
return all fields of audio data and data services broadcasted by a particular
radio station, and
this data may be analyzed to determine if the station's broadcasts are
compliant with
applicable digital radio broadcasting standards. Such analysis may involve
comparing the
fields of audio data and data services to data indicative of a baseline
standard for signals
broadcasted according to a digital radio broadcasting standard, as described
above. Similarly,
the received data may be analyzed to determine if the station's broadcasts are
compliant with
other standards (e.g., application-level standards). For instance, stations
may broadcast
images in formats that cannot be rendered on digital radio broadcast receivers
(e.g., if a
station broadcasts images in an Adobe format, rather than the JPEG format,
such images may
not display correctly on receivers). In examples, the computer-based system
may perform an
analysis that includes checks for a proper file format indicator, a start of
image marker, an
end of image marker, checks that the pixel resolutions are within specified
bounds, the color
depth indicator adheres to the applicable standard, and the overall file size
is less than the
specified limit. In examples, the analysis includes checking that the image
file does not
CA 02982341 2017-10-10
WO 2016/164750
PCT/US2016/026684
51
include unsupported extensions to the image format such as progressive scan.
Further, in
examples, the computer-based system validates images based on a list of valid
file formats
for a digital radio broadcasting standard, where the list may be stored in a
database or other
non-transitory computer-readable storage medium, for example.
[00121] By analyzing the received data, images that are broadcasted in
incorrect formats
can be identified. As another example, the data received through the use of
the deep dive
functionality may be analyzed to ensure that no text field in the broadcasted
data exceeds a
maximum specified length. It is noted that in embodiments, the data analysis
performed as
part of the routine monitoring 1126 may be the same as or similar to the data
analysis
performed as part of the deep dive functionality. Thus, all of the signal
quality problems and
errors that may be detected through the routine monitoring analysis may also
be detectable
through the deep dive functionality, and vice versa. The deep dive
functionality may enable
more signal quality problems and errors to be detected for a particular radio
station, however,
because all data for the station may be received and analyzed during the deep
drive analysis.
This is in contrast to the routine monitoring operation, under which only a
certain limited
number of variables for the station may be received and analyzed, in
embodiments.
[00122] To use the HD Radio Data Request and Filing Server 1220 to take
control of the
monitoring equipment 1230, the OPS Deep Dive Front-end Server 1224 may
communicate
with the HD Radio Data Request and Filing Server 1220 via API calls 1234.
Using the API
calls 1234, the OPS Deep Dive Front-end Server 1224 may request data from the
monitoring
equipment 1230 (e.g., all data from a certain radio station, etc.). The
request or requests are
passed from the HD Radio Data Request and Filing Server 1220 to the monitoring
equipment
1230 via the Proxy/SNMP Request Server 1226, as described above. The data
requested
from the monitoring equipment 1230 is passed from the monitoring equipment
1230 to the
CA 02982341 2017-10-10
WO 2016/164750
PCT/US2016/026684
52
Proxy/SNMP Request Server 1226 to the HD Radio Data Request and Filing Server
1220 and
finally to the OPS Deep Dive Front-end Server 1224, in an embodiment.
1001231 In other examples, after the issue is detected at the step 1128, the
deep dive
functionality is not utilized. Instead, for example, a different corrective
action may be
performed, as shown at step 1130 of FIG. 12B. In one embodiment, when an issue
is
detected by the HD Radio Data Request and Filing Server 1220 or the computer
system
coupled to the HD Radio Monitor Database 1222, the server 1220 or the computer
system
may generate an alert signal and cause this alert signal to be transmitted to
appropriate
recipients (e.g., a radio station associated with the digital radio broadcast
signal having the
problem).
1001241 In other examples, after the issue is detected at the step 1128, the
system of FIG.
12A may perform actions to determine if similar issues exist elsewhere (e.g.,
in other parts of
the country, other parts of the world, etc.), as shown at step 1132 of FIG.
12B. To determine
this, the HD Radio Data Request and Filing Server 1220 may send requests for
data to
monitoring equipment located in various different over-the-air coverage areas.
The requests
for data may request data that can be used in determining whether the issue
could exist
elsewhere. For example, if the issue detected at the step 1128 relates to high-
bit-rate
parametric stereo broadcasts in the particular coverage area 1227, the HD
Radio Data
Request and Filing Server 1220 may send requests for data to monitoring
equipment in other
parts of the world to identify all radio stations broadcasting parametric
stereo audio and the
bit rates being used by the stations. Using the network of monitoring
equipment located in
different over-the-air coverage areas around the world and the data received
based on the
requests, it can be determined whether the issue with the high-bit-rate
parametric stereo
broadcasts could exist elsewhere, and how extensive the issue could be (e.g.,
how many radio
stations are broadcasting the potentially problematic data, etc.). In
embodiments, the HD
CA 02982341 2017-10-10
WO 2016/164750
PCT/US2016/026684
53
Radio Data Request and Filing Server 1220 can execute a script to send
requests for specific
data to the multiple different monitoring equipment located around the world.
It is noted that
the above description regarding the high-bit-rate parametric stereo broadcasts
is merely an
example, and in other examples, different data is requested from monitoring
equipment
located in different over-the-air coverage areas.
1001251 Although the example of FIG. 12A depicts the single monitoring
equipment 1230
and the single Proxy/SNMP Request Server 1226, it should be appreciated that
in other
examples, there may be multiple (e.g., tens, hundreds, thousands) monitors and
multiple
Proxy/SNMP Request Servers. As described above, monitors may be positioned
throughout
the world. Consequently, multiple Proxy/SNMP Request Servers may be positioned
throughout the world, thus enabling the Proxy/SNMP Request Servers to be local
or near-
local to one or more of the monitors. For example, a first Proxy/SNMP Request
Server may
be positioned in a "northeast" region of the country, and this first server
may serve as an
intermediary between the HD Radio Data Request and Filing Server 1220 and
tens, hundreds,
or thousands of monitors located in the northeast region. A second Proxy/SNMP
Request
Server may be positioned in a "California" region of the country, and this
second server may
serve as an intermediary between the HD Radio Data Request and Filing Server
1220 and the
tens, hundreds, or thousands of monitors located in the California region.
1001261 Embodiments described herein enable detection of signal quality
problems and
errors in digital radio broadcast signals in a proactive manner, i.e., the
problems are detected
near the time at which the problems first develop and are not known only based
on reports
from end-users, etc. In other embodiments, the systems and methods of the
instant disclosure
are used after a problem is reported by a third party (e.g., an end-user of a
digital radio
broadcast receiver system, manufacturer of digital radio broadcasting receiver
systems or
transmitter systems, car dealership, etc.). To illustrate these other
embodiments, reference is
CA 02982341 2017-10-10
WO 2016/164750
PCT/US2016/026684
54
made to FIG. 12C. This figure depicts a flowchart of an example process that
may be
performed by the system of FIG. 12A following the detection of a problem by a
third party.
Thus, as shown at the step 1140, the system of FIG. 12A or an operator of this
system may
receive a notification of the problem. As illustrated in FIG. 12C, the
notification of the
problem may be from an end-user, a radio broadcaster, or another entity.
[00127] After being informed of the problem at the step 1140, various
different actions
may be performed. In one embodiment, at step 1142, a historical analysis is
performed using
the database 1222. For instance, if it is reported that the problem occurred
at a specific time
for a particular radio station, it may be possible to analyze historical data
stored in the
database 1222 for the specific time and radio station. Such analysis may be
performed in an
automated manner (e.g., by the HD Radio Data Request and Filing Server 1220 or
another
computer-based system) or manually by humans and the analysis may provide
information on
the cause of the problem. For example, an error report may indicate that
stuttering audio was
encountered by an end-user on a specific date and time for a radio station. By
analyzing
historical data stored in the database 1222, it may be determined that the
cause of the
stuttering audio was a broadcasting problem and not a problem with the end-
user's digital
radio broadcast receiver. In embodiments, the database 1222 comprises a
historical database
of signal quality metrics that may be used to track trends on each radio
station, such as to
confirm that a particular issue has been fixed and does not occur again. In
some
embodiments, each piece of data stored in the database 1222 has an associated
(i) date and
time (e.g., indicative of when a signal was broadcasted, when the data was
requested, and/or
when the data was stored in the database 1222, etc.), (ii) broadcast frequency
(e.g., indicative
of a broadcast frequency associated with the piece of data), and (iii) local
information (e.g.,
indicative of a location of a radio station associated with the piece of
data). This assorted
data may be stored in the database 1222. Thus, for example, for particular
"signal strength"
CA 02982341 2017-10-10
WO 2016/164750
PCT/US2016/026684
data stored in the database 1222, the database 1222 may also store a date,
time, broadcast
frequency, and location associated with the signal strength data. Storing such
associated data
enables the historical analysis described above and/or another analyses to be
performed.
[00128] In other embodiments, after being informed of the problem at the step
1140, the
deep dive functionality described above is utilized. Using the deep dive
functionality, the
OPS Deep Dive Front-end Server 1224 or HD Radio Data Request and Filing Server
1220
may communicate with the monitoring equipment 1230 to request all data
available for the
radio station associated with the reported error. The data available for the
radio station may
include all fields of digital audio data and data services transmitted by the
station and all
variables relating to signal quality attributes of received signals (e.g.,
variables relating to
time alignment, level alignment, phase alignment, signal strength attributes,
etc.). This data
may be analyzed to diagnose a problem associated with the signals broadcasted
by the radio
station. Such analysis may be performed in an automated manner (e.g., by the
OPS Deep
Dive Front-end Server 1224 or another computer-based system) or manually by
humans.
[00129] The deep dive analysis may be used to identify the source of the
problem or it may
support additional analysis efforts, as shown at step 1150 of FIG. 12C. For
instance, if an
error report indicates "radio not receiving station call sign data from WCBB
100.5 FM in Los
Angeles, CA," the deep dive functionality can be used to instruct request all
data available for
this station from monitoring equipment located in this area. The requested
data may be
received at the HD Radio Request and Filing Server 1220 and/or OPS Deep Dive
Front-end
Server 1224 and may be stored in the database 1224. The received data can be
analyzed to
determine an exact configuration used by the radio station (e.g., identifying
a service mode,
power level, and other configuration parameters utilized by the station).
Based on the
determined configuration, a test signal can be generated. This test signal can
be used to test
different digital radio broadcast receivers (e.g., in a lab setting) to
determine whether the
CA 02982341 2017-10-10
WO 2016/164750
PCT/US2016/026684
56
receivers receive the station call sign data. From this analysis, it may be
determined that the
source of the problem is a particular type of digital radio broadcast receiver
(e.g., if some
receivers properly receive the call sign data from the test signal and others
do not), and that
the problem is not related to the radio station's transmitter system or
broadcasting
configuration.
[00130] The analysis performed at the step 1150 may include various types of
signal
analysis. For instance, if the same error report described above is received
(e.g., "radio not
receiving station call sign data from WCBB 100.5 FM in Los Angeles, CA"), the
data
received as a result of the deep dive functionality may be analyzed in various
ways. As noted
above, this data may include all fields of digital audio data and data
services transmitted by
the transmitter and all variables relating to signal quality attributes of
received signals. The
data analysis may reveal, for example, that the broadcaster is in fact
broadcasting the call sign
data, and that the problem is related to a low received signal strength. Thus,
by analyzing all
of the data received from the deep dive functionality, data relating to the
signal strength
attribute may reveal a potential cause of the problem.
[00131] In some embodiments, the analysis performed at the step 1150 may be
performed
in conjunction with work performed by an engineer in the field. For instance,
an error report
may indicate that a digital radio broadcast receiver is unexpectedly shutting
down when
receiving signals from a particular radio station. The deep dive functionality
can be used to
instruct monitoring equipment in this area to receive all data from the
particular station.
Simultaneously, an engineer in the field can monitor the digital radio
broadcast receiver and
identify an exact time or times that the receiver unexpectedly shut down. Data
corresponding
to the shutdown time or times can be analyzed. This analysis may identify a
radio station
configuration or field in the broadcasted data that is the cause of the
unexpected shutdowns.
Alternatively, for instance, a test signal can be created based on the
received data, and the test
CA 02982341 2017-10-10
WO 2016/164750
PCT/US2016/026684
57
signal can then be tested on a variety of different types of digital radio
broadcast receivers,
including the type of receiver that is experiencing the shutdowns. Using the
test data, the
error may be recreated in a lab setting. This analysis using the test signal
may reveal that the
cause of the problem is related to the particular digital radio broadcast
receiver and is not
related to the data being broadcasted.
[00132] In other embodiments, after being informed of the problem at the step
1140, the
system of FIG. 12A may perform actions to determine if similar issues exist
elsewhere (e.g.,
in other parts of the country, other parts of the world, etc.), as shown at
step 1146 of FIG.
12C. This analysis may be the same or similar to that described above with
reference to step
1132 of FIG. 12B.
[00133] FIG. 13 is a block diagram depicting an example system for automated
detection
of signal quality problems and errors in digital radio broadcast signals. The
system may
enable proactive detection of signal quality problems and errors by putting
monitors 1306 in
multiple radio markets around the world. The system may be an automated system
that scans
all frequencies in those markets at all times (e.g., 24 hours a day, 7 days a
week) and provides
alerts about various detected issues (e.g., signal quality problems, signals'
non-compliance
with standards, missing or incorrect content, etc.) that could affect a user's
experience. The
system may enable monitoring equipment to be controlled remotely to perform a
"deep dive"
in real-time to analyze a station and thereby help the station in solving
deeper issues that the
station may be experiencing. This system includes multiple elements to enable
both routine,
remote monitoring of radio stations in various markets and also the deep dive
monitoring and
diagnostics on individual stations in those markets.
[00134] Each market can have one or multiple radio monitors 1306. Each monitor
1306
may include hardware (e.g., an antenna, etc.) that is configured to receive a
digital radio
broadcast signal. Such hardware may include, for example, components
illustrated in FIGs.
CA 02982341 2017-10-10
WO 2016/164750
PCT/US2016/026684
58
7, 8, and 10 described above. The hardware may also be based on HD Radio
Reference
designs. Proxy/SNMP Request Servers 1304 may communicate with the monitors
1306
using SNMP queries 1308. SNMP is a protocol that may be used to manage devices
on IP
networks. SNMP is designed to use management information bases (MIBs), which
in this
case utilize custom structure designs to describe the structure of management
data of a device
subsystem. The MIB used herein enables the accessing of all the different
parameters and
fields needed to fully analyze the AM, FM, and HD Radio signals of a radio
station. Thus, a
monitor 1306 receives an MIB from a Proxy/SNMP Request Server 1304, and the
MIB
serves as a request that requests certain data from the monitor 1306 (e.g.,
89.1 FM, HD1
Audio, Time Alignment data, etc.).
1001351 The Proxy/SNMP Request Servers 1304 enable efficient communications
with the
monitors 1306 in the field. Since the monitors 1306 may be positioned all over
the world, the
Proxy/SNMP Request Servers 1304 may be located locally to the monitors 1306
(or near-
locally to the monitors 1306), thus enabling each of the servers 1304 to
communicate with
one or more monitors 1306 in an efficient manner. The Proxy/SNMP Request
Servers 1304
act as intermediaries between the HD Radio Data Request and Filing Server 1302
and the
monitors 1306. Thus, a request for data is transmitted from the HD Radio Data
Request and
Filing Server 1302 to a Proxy/SNMP Request Server 1304, and the Proxy/SNMP
Request
Server 1304 then transmits this request to a monitor 1306. The requested data
is transmitted
from the monitor 1306 to the Proxy/SNMP Request Server 1304, and the
Proxy/SNMP
Request Server 1304 then transmits this data to the HD Radio Data Request and
Filing Server
1302. SNMP requests 1308 travel back and forth between the Proxy/SNMP Request
Server
1304 and the monitors 1306 with which the Proxy/SNMP Request Server 1304 is
associated.
The Proxy/SNMP Request Servers 1304 may be used purely for communication with
the
monitors 1306, and the servers 1304 may get all their requests from the HD
Radio Data
CA 02982341 2017-10-10
WO 2016/164750
PCT/US2016/026684
59
Request and Filing Server 1302. In embodiments, the data gathered by the
monitors 1306
positioned across the world may be used for various purposes that do not
involve detection of
signal quality problems and errors in broadcast digital radio broadcast
signals (e.g.,
automatically updating information in a mobile application, such as a "station
guide" mobile
app, automatically updating a database of images used by receivers, etc.). In
embodiments,
as data is collected from the monitoring equipment, this data is compared to
existing data
stored in a station database. When the existing data does not match the new
data, data in the
database is updated based on the new data. In embodiments, the data of the
database may be
used by mobile applications and head units in receivers for station logs,
station information
such as call-signs, etc, and/or other data.
1001361 The HD Radio Data Request and Filing Server 1302 may be known as the
"brains" of the system. The server 1302 performs multiple functions, in an
embodiment. The
HD Radio Data Request and Filing Server 1302 may provide tuning directions
(e.g., requests
for data associated with a particular tuning frequency) to the monitors 1306
in all markets
using API calls 1310 via HTTP(S) to the Proxy/SNMP Request Servers 1304. The
HD Radio
Data Request and Filing Server 1302 may also perform load balancing operations
related to
the Proxy/SNMP Request Servers 1304. For example, a Proxy/SNMP Request Server
1304
may communicate with multiple monitors 1306 within a market or region. Rather
than
overwhelm one of the monitors 1306 with requests (while sending no requests or
few
requests to other monitors 1306), the HD Radio Data Request and Filing Server
1302 may
enable load balancing, such that the Proxy/SNMP Request Server 1304
distributes requests
among the multiple monitors in the market.
[00137] The HD Radio Data Request and Filing Server 1302 may further collect
all
requested data from the various markets via the Proxy/SNMP Request Servers
1304. Initial
analysis and tabulation of the requested data may be performed at the HD Radio
Data
CA 02982341 2017-10-10
WO 2016/164750
PCT/US2016/026684
Request and Filing Server 1302. For example, the HD Radio Data Request and
Filing Server
1302 may be configured to analyze the received data to detect signal quality
problems and
errors in digital radio broadcast signals received at the monitors 1306. The
HD Radio Data
Request and Filing Server 1302 may be configured to perform such analysis in
an automated
manner that requires no human intervention or minimal human intervention. In
an example,
the analysis includes comparing the data received from the monitors 1306 to
(i) one or more
predetermined threshold values, (ii) data indicative of a baseline standard
for signals
broadcasted according to a standard, and/or (iii) data indicative of expected
content of
broadcasted signals. In an example, the HD Radio Data Request and Filing
Server 1302
performs the analysis in real-time or near real-time, i.e., near the time at
which the digital
radio broadcast signal is broadcast, thus enabling signal quality problems and
errors to be
detected and corrected soon after the problems and errors develop.
1001381 The HD Radio Data Request and Filing Server 1302 may further be
configured to
send data 1320 to the HD Radio Monitor Database 1350. Such data 1320 may
include "raw"
data (e.g., data received from the monitors 1306 that has not been tabulated
or otherwise
processed) or processed data (e.g., data that has been tabulated and/or
processed by the HD
Radio Data Request and Filing Server 1302). The HD Radio Data Request and
Filing Server
1302 may further perform normalization of data received from monitors 1306
when the
monitors 1306 have different gain values (e.g., due to the different types of
antennas used by
the monitors 1306 in the various markets).
[00139] The HD Radio Data Request and Filing Server 1302 may also enable the
OPS
"Deep Dive" Front-End Server 1316 to take control of a monitor in an
individual market
(e.g., in order to receive particular data, in real-time or near real-time,
from the monitor, etc.).
The OPS "Deep Dive" Front-End Server 1316 may monitor and analyze data in the
HD
Radio Monitor Database 1350 via database queries 1318, and then take control
of a monitor
CA 02982341 2017-10-10
WO 2016/164750
PCT/US2016/026684
61
based on a condition detected in the monitored data. All data received at the
HD Radio Data
Request and Filing Server 1302 from the monitors 1306 in the field may be
stored in the HD
Radio Monitor Database 1350 (e.g., stored indefinitely). The HD Radio Data
Request and
Filing Server 1302 may also be controlled via a management front-end 1314. The
management front-end 1314 may be used, for example, to program the server 1302
to carry
out the monitoring and analysis described herein.
[00140] A reporting engine 1324 may be configured to perform analysis of
historical data.
For example, while the HD Radio Data Request and Filing Server 1302 may be
configured to
monitor and analyze data in real-time or near real-time, the reporting engine
1324 may
receive data from the HD Radio Monitor Database 1350 (e.g., using database
queries 1322),
where the data is analyzed to make determinations about digital radio
broadcast signal
transmission over time (e.g., analyzing data received over the course of a
day, a week, a
month, a year, etc.). As described herein, the HD Radio Data Request and
Filing Server 1302
may be configured detect a signal quality problem by comparing received data
from monitors
1306 to various data (e.g., threshold values, etc.). In an example, the system
may learn to
adjust the threshold values based on the analysis of historical data. The
historical data may
be used in various other ways. For example, the historical data for a station
may include a
station logo that is associated with the station. If the station broadcasts a
new logo, then the
previous station logo may be replaced with the new logo.
[00141] Since
stations in multiple markets may be monitored continuously (e.g., 24 hours
a day, 7 days a week), monitoring applications (i.e., "monitoring apps") 1326
may be used by
radio station owners or engineers to receive notifications about problems
(e.g., signal quality
problems) associated with radio stations. The notifications may come via the
app, SMS, or
email depending on the level and severity of the problem. Additionally, data
1330 may be
pushed from the HD Radio Monitor Database 1350 to a station database 1334
associated with
CA 02982341 2017-10-10
WO 2016/164750
PCT/US2016/026684
62
a radio station. Data 1352 may be exported from the station database 1350 to
one or more
downstream station databases 1336. A station database graphical user interface
(GUI) 1332
may receive data from the station database 1334 based on database queries 1354
and present
the received data in a way that can be easily perceived and understood by
humans. For
example, the GUI 1332 may use graphics or illustrations to indicate a presence
or absence of
signal quality problems and errors in a digital radio broadcast signal
transmitted by the radio
station.
[00142] FIGs. 14-16 are exemplary screenshots of a GUI that may be used to
present (i)
data received at the HD Radio Data Request and Filing Server, and (ii) results
of an analysis
of that data. As described herein, the HD Radio Data Request and Filing Server
is configured
to (i) transmit requests for data to monitoring equipment, the requested data
being indicative
of one or more attributes of a digital radio broadcast signal received at the
monitoring
equipment, (ii) receive the requested data from the monitoring equipment, and
(iii) analyze in
real-time or near real-time the received data, the data being analyzed to
detect signal quality
problems and errors in the digital radio broadcast signals received at the
monitoring
equipment. To make the received data and the results of the analysis of that
data more
understandable to humans, the GUI illustrated in FIGs. 14-16 may be used.
[00143] In FIG. 14, the GUI depicts a map of the top ten radio markets in the
United
States. The map includes "pins" that show the locations of the top ten
markets. Below the
map, the GUI displays (i) names of the top ten markets (e.g., New York, Los
Angeles, etc.),
(ii) identifying codes for each of the markets, (iii) a ranking for each of
the markets, (iv) a
number of digital radio stations in each of the markets, (v) a number of
analog stations in
each of the markets, and (vi) a time at which data was last received from
monitoring
equipment in each of the markets.
CA 02982341 2017-10-10
WO 2016/164750
PCT/US2016/026684
63
[00144] In FIG. 15, the GUI depicts information for a selected market. In this
figure, the
"New York" market illustrated in the example of FIG. 14 is selected. A
"Digital" tab is
selected, and thus, the GUI depicts information on digital radio stations
included in the
market. For each station, a digital and analog signal strength is shown, and
an indicator
shows whether the station has an "HD Radio" capability. For each station,
three "alignment"
images are depicted. A first image relates to "time alignment" of the
station's digital radio
broadcast signals, a second image relates to "level alignment" of the
station's signals, and a
third image relates to "phase alignment" of the station's signals. These
signal quality
attributes are described above.
[00145] For each of the three alignment images, a characteristic of the image
(e.g., a color,
etc.) indicates a quality of the alignment. Thus, for example, if a time
alignment image is red
in color, this may indicate that the station's digital radio broadcast signal
has a signal quality
problem related to time alignment. By contrast, if the time alignment image is
yellow in
color, this may indicate that the signal is acceptable with respect to time
alignment, and if the
time alignment image is green in color, this may indicate that the signal is
very good with
respect to time alignment. Alerts or alarms may be generated based on such
signal statuses.
In an example, there are several levels of alerts/alarms. When "highly
critical" thresholds are
surpassed (e.g., as indicated by images having the color red) certain parties
may be notified
via alerts or alarms, and when less critical thresholds are surpassed (e.g.,
as indicated by
images having the yellow color), other parties may be notified via alerts or
alarms.
[00146] In FIG. 15, for each of the stations, additional data may be
presented. Such data
may include indicators relating to each of HD1, HD2, HD3, and HD4 audio (e.g.,
signal
strength, etc.). For each of the stations, the GUI may further provide an
indication of when
data was last received for the station. In other embodiments, additional data
related to the
CA 02982341 2017-10-10
WO 2016/164750
PCT/US2016/026684
64
stations' signals may be presented. Such data may indicate whether the
station's signals are
compliant with applicable standards and/or include expected content.
[00147] In FIG. 16, the GUI depicts information for a selected radio station.
In this figure,
the "92.3 FM ¨ WBMP-FM" market illustrated in the example of FIG. 15 is
selected. The
GUI displays detailed information on the selected radio station, including
numerical values
for the time alignment, level alignment, phase alignment, analog signal
strength, and digital
signal strength. The detailed information further includes, for each of the HD
Radio audio
channels (e.g., HD1, HD2, HD3, HD4, etc.) a title of a song, an artist
associated with the
song, an album name associated with the song, and a program type (e.g., "Top
40,"
"Country," "Hip Hop," etc.), among other data. All data shown in FIGs. 15 and
16 may be
based on monitoring data received at a HD Radio Data Request and Filing Server
from
various monitoring equipment. The GUI of FIG. 16 further allows a user to
display historical
information and data associated with the selected station. Thus, while the
information and
data illustrated in the example of FIG. 16 may be for a "Latest Result," i.e.,
based on the most
recent data received for the station, the GUI also presents clickable links or
buttons for
displaying historical data For example, a user may be able to click a link
"About 1 hour
ago" to display information and data for the station that was received in this
previous
timeframe.
[00148] FIG. 17 is a flowchart depicting operations of an example method for
automated
detection of signal quality problems and errors in digital radio broadcast
signals. At 1702, a
digital radio broadcast signal is received via digital radio broadcast
transmission from a first
radio station. The signal is received using first monitoring equipment located
in an over-the-
air coverage area of the first radio station. At 1704, a digital radio
broadcast signal is
received via digital radio broadcast transmission from a second radio station,
where the signal
is received using second monitoring equipment located in an over-the-air
coverage area of the
CA 02982341 2017-10-10
WO 2016/164750
PCT/US2016/026684
second radio station. The over-the-air coverage areas of the first and second
radio stations
are geographically separated and do not overlap. At 1706, requests for data
are transmitted to
the first monitoring equipment and the second monitoring equipment. The
requested data is
indicative of one or more attributes of a digital radio broadcast signal
received at respective
monitoring equipment. At 1708, the requested data are received from the first
and second
monitoring equipment. At 1710, the received data from the first and second
monitoring
equipment are analyzed in real-time or near real-time. The data are analyzed
in an automated
manner to detect a signal quality problem or error in the digital radio
broadcast signals
received at the first and second monitoring equipment.
[00149] The exemplary approaches described may be carried out using any
suitable
combinations of software, firmware and hardware and are not limited to any
particular
combinations of such. Computer program instructions for implementing the
exemplary
approaches described herein may be embodied on a non-transitory computer-
readable storage
medium, such as a magnetic disk or other magnetic memory, an optical disk
(e.g., DVD) or
other optical memory, RAM, ROM, or any other suitable memory such as Flash
memory,
memory cards, etc.
[00150] Additionally, the disclosure has been described with reference to
particular
embodiments. However, it will be readily apparent to those skilled in the art
that it is
possible to embody the disclosure in specific forms other than those of the
embodiments
described above. The embodiments are merely illustrative and should not be
considered
restrictive. The scope of the disclosure is given by the appended claims,
rather than the
preceding description, and all variations and equivalents which fall within
the range of the
claims are intended to be embraced therein.