Note: Descriptions are shown in the official language in which they were submitted.
CA 02986226 2017-11-16
WO 2016/187218
PCT/US2016/032908
INTRAVASCULAR IMAGING SYSTEM INTERFACES AND SHADOW
DETECTION METHODS
RELATED APPLICATIONS
[0001] This application claims priority to and the benefit of U.S. Provisional
Patent
Application No. 62/162,795 filed on May 17, 2015, U.S. Provisional Patent
Application No.
62/196,997 filed on July 25, 2015, and U.S. Patent Application No. 14/975,516
filed on
December 18, 2015, the disclosures of which are herein incorporated by
reference in their
entirety.
FIELD OF THE INVENTION
[0002] The disclosure relates generally to intravascular measurements and
feature detection
and related diagnostic methods and devices.
BACKGROUND
[0003] Coronary artery disease is one of the leading causes of death
worldwide. The ability
to better diagnose, monitor, and treat coronary artery diseases can be of life
saving
importance. Intravascular optical coherence tomography (OCT) is a catheter-
based imaging
modality that uses light to peer into coronary artery walls and generate
images thereof for
study. Utilizing coherent light, interferometry, and micro-optics, OCT can
provide video-rate
in-vivo tomography within a diseased vessel with micrometer level resolution.
Viewing
subsurface structures with high resolution using fiber-optic probes makes OCT
especially
useful for minimally invasive imaging of internal tissues and organs. This
level of detail
made possible with OCT allows a clinician to diagnose as well as monitor the
progression of
coronary artery disease. OCT images provide high-resolution visualization of
coronary artery
morphology and can be used alone or in combination with other information such
as
angiography data and other sources of subject data to aid in diagnosis and
planning such as
stent delivery planning.
[0004] OCT imaging of portions of a patient's body provides a useful
diagnostic tool for
doctors and others. For example, imaging of coronary arteries by intravascular
OCT may
reveal the location of a narrowing or stenosis. This information helps
cardiologists to choose
between an invasive coronary bypass surgery and a less invasive catheter-based
procedure
- 1 -
CA 02986226 2017-11-16
WO 2016/187218
PCT/US2016/032908
such as angioplasty or stent delivery. Although a popular option, stent
delivery has its own
associated risks.
[0005] A stent is a tube-like structure that often is formed from a mesh. It
can be inserted
into a vessel and expanded to counteract a stenotic condition that constricts
blood flow.
Stents typically are made of a metal or a polymer scaffold. They can be
deployed to the site
of a stenosis via a catheter. During a cardiovascular procedure, a stent can
be delivered to the
stenotic site through a catheter via a guide wire, and expanded using a
balloon. Typically, the
stent is expanded using a preset pressure to enlarge the lumen of a stenosed
vessel.
Angiography systems, intravascular ultrasound systems, OCT systems, in
combinations or
alone can be used to facilitate stent delivery planning and stent deployment.
[0006] There are several factors that influence the patient outcome when
deploying stents.
In some procedures, the stent should be expanded to a diameter that
corresponds to the
diameter of adjacent healthy vessel segments. Stent overexpansion may cause
extensive
damage to the vessel, making it prone to dissection, disarticulation, and
intra-mural
hemorrhage. Stent under expansion may inadequately expand the vessel. If the
portions of
the stent fail to contact the vessel wall, the risk of thrombosis may
increase. An underinflated
or malapposed stent may fail to restore normal flow. Once a stent is
installed, stent
malapposition and under expansion of the stent can result in various problems.
[0007] There are other challenges associated with stent placements and related
procedures.
Visualizing a stent deployment relative to the wall of a blood vessel using an
angiography
system is challenging to undertake by inspection. Further, reviewing
angiography images
manually to determine stent position on a per image basis is also prone to
error.
[0008] The present disclosure addresses these challenges and others.
SUMMARY
[0009] In part, the disclosure relates to angiography and intravascular data
collection
systems such as OCT and/or IVUS that can be used to plan stent delivery or
otherwise
generate and display diagnostic information of interest. The disclosure also
relates to the
generation of various indicators and the integration of them relative to
displays of image data.
As an example, a longitudinal indicator such as an apposition bar can be used
alone or in
conjunction with a stent strut indicator and overlaid on angiography frames co-
registered with
- 2 -
CA 02986226 2017-11-16
WO 2016/187218
PCT/US2016/032908
an intravascular data set such as a set of OCT scan lines or images generated
with respect
thereto for diagnostic processes such as stent planning.
[0010] In part, the disclosure relates to systems and methods for displaying
the results of
data analysis applied to an intravascular data set to the user of an
intravascular data collection
system and on angiography system in one embodiment. In part, this disclosure
describes a
graphic user interface (GUI) that provides user interface and graphic data
representations that
can be applied to one or more generated images of a vessel or angiography
images such that
regions of interest such as areas of stent apposition and others are easy to
find and
understand on OCT and angiography images.
[0011] In part, the disclosure relates to a data collection system such as an
intravascular
data collection system suitable for use in cath lab such as an optical
coherence tomography
system. In part, the disclosure relates to a data collection system that
includes a processor
suitable for displaying intravascular image data. The image data displayed
includes data or
images generated based upon depth measurements. In one embodiment, the image
data is
generated using optical coherence tomography. The system can also display a
user interface
for display of intravascular information such as data relating to stent
malapposition in a
longitudinal mode on a per stent strut basis or as a bar having regions
corresponding to stent,
no stent, or stent apposition levels of potential interest for one or more
stents in a vessel.
[0012] One or more indicators such as longitudinal indicators, as a non-
limiting example,
can be generated in response to stent detection processing and lumen boundary
detection and
displayed relative to angiography, OCT, and IVUS images. These can be viewed
by a user to
plan stent delivery and to inflate or adjust a stent delivery by reviewing a
co-registered OCT
image and an angiography image with the relevant indicators of interest. In
part, the systems
and methods described herein relate to methods of avoiding or reducing
likelihood of data
misinterpretations by replacing regions of missing data with an indicator such
as hashing, a
colored region, or other visual indicator. In this way, an end user is
informed when data is
missing rather than misconstrue a black region as a shadow or side branch.
Thus, a missing
data region is coded with an indicator that prevents that region from being
misconstrued as a
sidebranch, stent or other feature of interest to a diagnostician. In one
embodiment, the
methods can include the step of displaying an indicia of a stent strut on a
graphical user
interface and displaying an indicia indicative of one or more regions in an
intravascular
image wherein data was unavailable for display. In one embodiment, an
apposition bar is
- 3 -
CA 02986226 2017-11-16
WO 2016/187218
PCT/US2016/032908
displayed such that it is intravascular view independent such that the
apposition bar is
displayed when no indicator or stent containing image is present. In one
embodiment, the
disclosure relates to an apposition bar aligned with a stent region, the
stented region includes
the located stent strut, wherein the apposition bar is rotationally agnostic
or persistent.
[0013] In part, the disclosure relates to stent detection and shadow detection
in the context
of intravascular data sets obtained using a probe such as, for example, and
optical coherence
tomography probe or an intravascular ultrasound probe.
[0014] In part, the disclosure relates to systems and methods for precise
identification of
metal stent strut offsets, or locations, within shadows cast in OCT image
data. Methods of
stent strut detection can include accessing a plurality of frames of
intravascular imaging data,
the plurality of frames comprising optical coherency tomography (OCT) scan
lines,
identifying a shadow region corresponding to a candidate stent strut,
identifying scan lines
that correspond to a candidate stent strut shadow region to generate candidate
strut shadow
scan lines, and analyzing the candidate strut shadow scan lines to identify
the location of a
stent strut.
[0015] Methods of stent strut detection also can include storing a plurality
of frames of
intravascular imaging data, detecting stent struts in a first group of frames
of the plurality of
frames, detecting one or more shadow regions in the first group of frames,
wherein one or
more of the shadow regions is adjacent to a detected stent strut, determining
on a per shadow
region basis if a given shadow region is a guidewire induced region or a side
branch induced
region to generate a set of candidate stent strut shadow regions, wherein each
candidate stent
strut shadow region comprises a shadow boundary, and identifying scan lines of
a candidate
stent strut shadow region within the shadow boundary.
[0016] Methods of the invention can include additional steps or features. For
example, the
methods can include identifying a shadow region corresponding to a candidate
stent strut by
eliminating shadow regions corresponding to non-stent features. The non-stent
features can
be selected, for example, from the group consisting of: a guidewire, a side
branch, and
combinations thereof.
[0017] The methods can include eliminating candidate strut shadow scan lines
that contain
spillage from lumen pixels. The methods can include determining a projection
across each of
the candidate strut shadow scan lines by summing a signal response across the
candidate strut
- 4 -
CA 02986226 2017-11-16
WO 2016/187218
PCT/US2016/032908
shadow scan lines, or a portion or sample of the scan lines. The methods can
include
identifying up to three local maxima in the projection.
[0018] The methods can include ranking local maxima based on peak signal
intensity to
generate a peak score. The ranking can be an ordinal ranking, with local
maxima having
higher peak signal intensity receiving a higher peak score.
[0019] The methods can include ranking the local maxima based on proximity to
the blood
vessel wall to generate a proximity score. The ranking can be an ordinal
ranking, with local
maxima closer to the blood vessel wall receiving a higher proximity score. The
methods can
include assigning a malapposition score to each local maxima. The
malapposition score can
be binary, with malapposed local maxima receiving a score of zero.
[0020] The methods can include summing the peak score, the proximity score,
and the
malappostion score, wherein the local maximum with the highest total score is
designated as
the location of the stent strut.
[0021] The methods can include identifying a plurality shadow region
corresponding to a
candidate stent strut, identifying scan lines that correspond to each
candidate stent strut
shadow region, and identifying, within each candidate stent strut shadow
region, the location
of a stent strut. The methods can include performing a cross-frame analysis to
validate
designated stent struts across multiple optical coherence tomography (OCT)
imaging frames.
[0022] The methods can include displaying on a graphical user interface the
validated stent
struts. The disclosure also includes a computer readable medium comprising non-
transitory
instructions that when executed cause a processor to perform any of the
foregoing steps.
[0023] Although, the invention relates to different aspects and embodiments,
it is understood
that the different aspects and embodiments disclosed herein can be integrated
together as a
whole or in part, as appropriate. Thus, each embodiment disclosed herein can
be
incorporated in each of the aspects to varying degrees as appropriate for a
given
implementation. Furthermore, although some aspects and embodiments are
described using
"means for" terminology, it is understood that all aspects, embodiments, and
other concepts
disclosed herein can serve as support for means plus function claims, even if
specific "means
for" language is not used in a specific portion of the written description.
BRIEF DESCRIPTION OF DRAWINGS
- 5 -
CA 02986226 2017-11-16
WO 2016/187218
PCT/US2016/032908
[0024] The figures are not necessarily to scale, emphasis instead generally
being placed
upon illustrative principles. The figures are to be considered illustrative in
all aspects and are
not intended to limit the disclosure, the scope of which is defined only by
the claims.
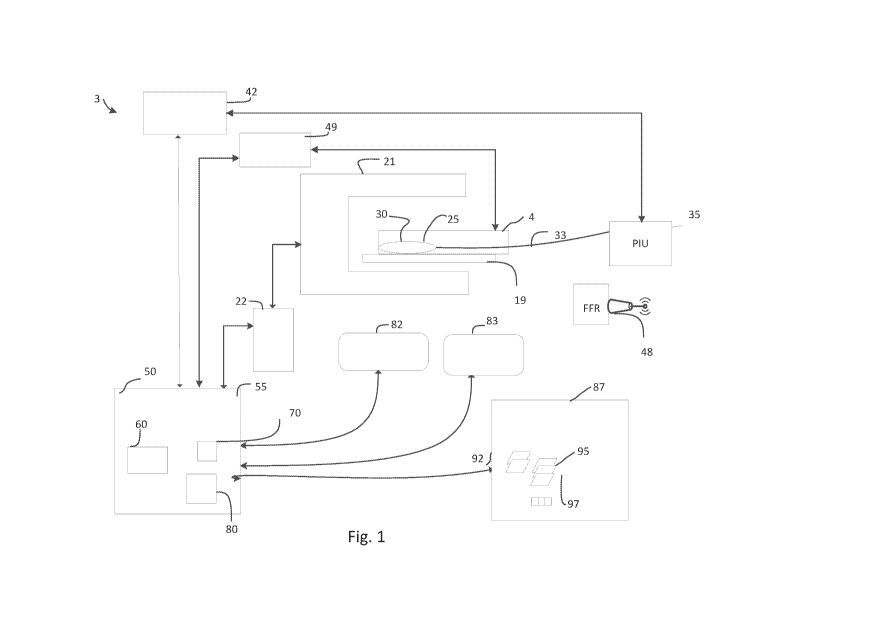
[0025] FIG. 1 shows a schematic diagram of an intravascular imaging and data
collection
system in accordance with an illustrative embodiment of the disclosure.
[0026] FIGS. 2A-2E show additional details relating to user interface displays
and
intravascular data collection systems and indicators suitable therewith and
angiography
systems for diagnostic processes including stent delivery planning in
accordance with an
illustrative embodiment of the disclosure.
[0027] FIGS. 3A ¨ 6 show various user interfaces and data representations
including
various indicia and co-registered features relative to one or more imaging
modalities in
accordance with an illustrative embodiment of the disclosure.
[0028] FIGS. 7A ¨ 7B show a three-dimensional representation of side branch
indicators
generated using intravascular imaging data such as OCT data in accordance with
an
illustrative embodiment of the disclosure.
[0029] FIGS. 8A-
9B show additional details relating to user interface displays and
intravascular data collection systems and indicators suitable therewith and
angiography
systems for diagnostic processes.
[0030] FIG. 10A is an exemplary intravascular data collection system and an
associated
intravascular data collection probe and related image processing, detection,
and other
software components according to an illustrative embodiment of the disclosure.
[0031] FIG. 10B is a cross-sectional OCT image of a stented blood vessel in
accordance
with an illustrative embodiment of the disclosure.
[0032] FIG. 11 is a process flow chart for detecting struts in OCT image data
in accordance
with an illustrative embodiment of the disclosure.
[0033] FIG. 12 is a scan line OCT image in polar co-ordinates, in log scale,
of a stented
vessel in accordance with an illustrative embodiment of the disclosure.
[0034] FIG. 13 is a graph illustrating detection of multiple potential struts
within a single
shadow in accordance with an illustrative embodiment of the disclosure.
DETAILED DESCRIPTION
- 6 -
CA 02986226 2017-11-16
WO 2016/187218
PCT/US2016/032908
[0035] In part, the disclosure relates to intravascular data collection
systems, such as OCT,
IVUS, and angiography systems and the exchange of data between two or more of
the
foregoing, as examples, and the generation and display of diagnostic
information such as
indicators. In one embodiment, intravascular data such as OCT is collected
while
angiography data is simultaneously collected. Indicators can include one or
more one or two
dimensional graphic elements and one or more associated indicia such as color,
gray scale or
other scale gradations, hashes, symbols or other visual elements.
[0036] One or more indicators can be generated and displayed such as by
overlaying or
otherwise combining such indicators with images generated using an
intravascular data
collection system. The indicators can include longitudinal, cross-sectional,
and other indictor
types such as one or more indicia or graphical elements suitable for
indicating diagnostic
information of interest such as tracking relative to user selected landmarks.
Stent strut
indicators can also be used. Methods of stent and shadow detection are
described herein that
can be used to display such intravascular features in a user interface and to
display overlays
relative thereto such as indicators or indicia. Angiography data can also be
integrated and
displayed with various common indicators as part of a co-registered display.
In one
embodiment, shadows and other elements which can be misconstrued as
dissections, side
branches or other vessel features can be shaded or otherwise changed to
distinguish them and
facilitate user review and analysis of images frames and data according to one
embodiment.
[0037] Suitable diagnostic information can include stent apposition
information such as the
malapposition of a stent relative to a vessel wall or lumen boundary, user
selected OCT
positions in a vessel and associated angiography frame locations, and other
intravascular
diagnostic information or other information generated to facilitate stent
delivery planning.
The system includes a processor in communication with the graphical user
interface and
configured to send commands to the graphical user interface. One or more
software
programs are used to perform one or more of the following: co-register data
such as frames of
image data, generate and display longitudinal indicators indicative of stent
position relative to
a determined lumen boundary, code or mark data missing regions for an end
user, translate
user selected OCT position information to an angiography display using one or
more
graphical elements to facilitate co-registration, and visually identifying
stents and simulated
stents for planning purposes and others as described herein.
- 7 -
CA 02986226 2017-11-16
WO 2016/187218
PCT/US2016/032908
[0038] In part, the disclosure relates to a graphical user interface (GUI)
element or
indicator that is represented on a display relative to subject data such as
image data or other
intravascular parameters measured relative to the subject. Any clinically
useful parameter as
it changes longitudinally or cross-sectionally during the course of an Optical
Coherence
Tomography pullback recording or IVUS or other intravascular or angiography
system can be
evaluated and displayed as an indicator or indicia. Each indicator / indicia
can be used by
interventional cardiologists to quickly see clinically useful information for
an entire pullback
recording in a single view without needing to manually manipulate the image.
The indicator
can guide a user to the particular points of interest in the vessel based on
the parameter
exceeding or falling below a clinically meaningful threshold value. By
encoding the
parameter value in a continuous color map, or other scale using suitable
indicia for example,
varying degrees of severity of the parameter can be easily summarized for the
entire vessel in
one easy to interpret view. These features are shown with the various
apposition bars, stent
indicators, and other indicators for angiography images and other
intravascular data
collection images.
[0039] FIG. 1 includes a system suitable for performing some of these
features. FIG. 2A
shows four panels with the top right panel including an angiography display
with various
indicators including a first user selected position US1, a second user
selected position US2,
and an active frame AF. These indicators are also shown in the bottom L-mode
or
longitudinal panel with US1 and US2 corresponding to the vertical lines shown
and the active
frame AF corresponding to the vertical line in between them. The active frame
is shown in
cross-sectional view at the top right panel. The middle panel shows the values
of the US1
and U52 positions in mm as vessel positions and a calculated MLA. FIG. 2B
shows a
zoomed view of the angiography image of FIG. 1 which is co-registered with the
OCT data
of FIG. 1. These user interfaces include moveable elements C1, C2 that can be
controlled by
a user with a mouse, joystick, or other control and can be operated using one
or more
processors and memory storage elements. The movable elements C1, C2 are
controls and can
be rotated or moved as part of the interface. They are also shown in FIGS. 2C
and 3B and
others. In FIG. 3B, the controls C1, C2 are also represented as half circles
relative to the
stent struts and as line segments in the right panel.
[0040] FIG. 2C shows an apposition bar / indicator bar 111 as an indicator
with regions R1
to R7 which are shown in the angiography view in the top right which is shown
in further
detail in FIG. 2D. The top right panel shows R3 shows an area of apposition
that is beyond a
- 8 -
CA 02986226 2017-11-16
WO 2016/187218
PCT/US2016/032908
threshold of interest. In the L-mode, the stent struts are coded with an
indicia such as
symbols or color. The regions of apposition of interest in the apposition bar
remain on
display even if the dataset is rotated in order to bring the important areas
to the attention of a
user for stent planning and patient diagnosis. In this sense, indicators can
be persistent to
direct a user's focus during a planning or other procedure. FIG. 2E shows
additional details
relating to an exemplary apposition bar or indicator bar 111. The indicator
bar 111 can be
used for stent planning and review and to indicate regions in an intravascular
image where
there is apposition or another metric relative to a stent strut. The indicator
bar 111 is
persistent in the user interface views in one embodiment to alert a user to a
stent region even
if it is not visible based on the view selected by the user - three-
dimensional, cross-sectional,
longitudinal, viewing angle, etc.
[0041] With regard to FIG. 2C, the two user selected points of interest are
shown as Ul and
U2. R3 corresponds to a region of malapposition of interest. R2 corresponds to
a first stent
and R6 corresponds to a second stent. R5 is the gap in between them. This data
is co-
registered with angiography data as shown in FIG. 2D to facilitate stent
planning. Data
collecting element of probe DC is shown in the image. R1 and R7 are distal and
proximal
areas in which no stent is present and correspond to vessel lumen. Ul and U2
serve as user
placed landmarks that can be used by a user looking at live angio to give them
a reference
frame for the vessel section they marked with Ul and U2. One or more displays
can be used
such as live angio and OCT pullback data with previously acquired pullback
frames.
[0042] With these and other indicators, the images and indicators can help as
a tool to
guide stent delivery based on the data shown in FIGS. 2C and 2D. The
indicators can also
show when a stent needs to be inflated in more detail given color coded or
otherwise coded
stent strut indicia in a cross-sectional or longitudinal view. In FIG. 2E,
regions of a first stent
222a and a second stent 222b are shown by the apposition bar 111. A region of
lumen or no
stent 224 and malapposition region 223 are also shown. This bar 111 can be
displayed on
any angiography or OCT or IVUS image of interest. In one embodiment, an
apposition bar is
displayed such that it is intravascular view independent or persistent such
that the apposition
bar is displayed when no indicator or stent containing image is present. The
various
indicators and indicia can be generated based upon stent detection, lumen
detection, stent
apposition measurements and various graphic overlays generated using the
system of FIG. 1
and 10A, for example.
- 9 -
CA 02986226 2017-11-16
WO 2016/187218
PCT/US2016/032908
[0043] FIG. 3A shows an interface with a longitudinal view or L-mode showing
an
apposition bar above stent strut indicators coded based on apposition
thresholds. The
indicator bar 111 is shown in the middle of the GUI with no stent 224 regions
and
malapposition regions 223 shown. Lumen boundary data from OCT or IVUS is used
to
determine apposition issues such as thresholds being exceeded given detected
strut data as
inputs to the apposition bar generation software module. In FIG. 3B, the
interface screen
depicts an example of the indicator measuring a high level of apposition for a
metallic stent
strut as shown above the L-Mode display in the GUI screen shot shown. The
apposition
indicator allows for the summary information about the clinical parameter to
be displayed
without the need to manually manipulate or inspect the image data. A stent
apposition bar
and other indicators shown herein and their co-registration with angiography
offer many
advantages to a user.
[0044] In FIGS. 3A, 3B, 4A, and 4B some embodiments of user interfaces
depicting
intravascular data and angiography data (where applicable) along with an
exemplary
indicator for stent strut apposition and other indicator-based data displays.
In one
embodiment, the apposition bar is shown on L-Mode and angiography images,
three-
dimensional flow through images and others. FIG. 4B shows an angiography image
with
stent data showing threshold information along the outer boundary of the
vessel as well as a
longitudinal view of the apposition bar 111. A region 161a in the angiography
portion of the
user interface is also aligned with a region 161b of the indicator bar 111. In
one embodiment,
the angiography images are aligned or registered with the apposition bar. One
feature of the
apposition bar 111 is that it is persistent in the user interfaces such that
if a stent is present in
a 2 or 3D image, but it does not appear based on the cut plane or viewing
angle, the
apposition bar would persist and show that a stent and any associated
malapposition is
present even though a 2D or 3D stent does not appear in the GUI. This is a
useful feature for
stent planning an diagnostics.
[0045] In FIG. 4A, an indicator bar 111 is shown that indicates stent struts
and apposition
areas of interest 157. These areas of interest 157 showing apposition can be
grouped with a
representation of the stent struts themselves and color coded or coded with
another indicia
that is viewable in a GUI. An example of a grouping of stent struts code with
an indicia and
the indicator bar is shown by region 188 in FIGS. 3A, 3B, 5 and 6. In these
regions 188, an
indicator bar 111 is shown aligned with a representation of a stent and a
series of struts with
various indicia corresponding to apposition relative to the vessel wall. A
detected lumen
- 10 -
CA 02986226 2017-11-16
WO 2016/187218
PCT/US2016/032908
boundary is used to compare stent position relative thereto. Additional
details relating to
stent detection are included herein.
[0046] FIG. 5 shows another GUI with an indicator or image data processing
feature by
which missing data such as data obscured or missing the shadow of a guidewire
is modified
by software to replace it with a gray mask or another indicator. To avoid user
confusion with
side branches, dissections, or missing data an indicator MD is used to
indicate regions where
data is missing. This has the benefit of preventing a user from mistaking it
for missing data, a
dissection area, or a side branch. In one embodiment, areas where data is
missing as a result
of a shadow or otherwise are displayed with an indicia or indicator such as a
gray region, a
colored region, hashing, or another visible indicia. The double headed arrow
icon in the
middle allows the view to be rotated. This user control along with the
apposition bar and
identification of a guidewire by color coding or other indicia all improve and
extend the
diagnostic range of the image data from an intravascular data collection probe
and/or
angiography data.
[0047] In another embodiment, as shown in FIG. 5, an indicator W is used to
point to a
guidewire image. In one embodiment, the indicator W can be used to identify a
guidewire in
the GUI or select it for removal from image. FIG. 6 shows a three-dimensional
fly though
with the apposition bar shown as a trajectory ahead of the viewing plane of
the user
corresponding to the cross-section on the right. Indicator bar 111 showing
stent struts and
apposition areas of interest- included in 3D fly thought view and any other
view of interest-
regions of interest remain viewable during rotation to alert user of important
vessel regions
during stent planning
[0048] FIGS. 7A and 7B show other indicators SB corresponding to side
branches. A
rendering of the vessel wall VW is also shown relative to the side branches.
These and other
indicators can be used to emphasize regions in 2D and 3D data. As shown in the
user
interfaces depicted, such as FIG. 9B, the various circles / line segments C1,
C2 in the top
right view can be rotated to navigate through various views of the image.
FIGS. 8A to 9B
show additional interfaces and control information for navigating image data
sets and
performing diagnostics such as stent planning. Various proximal and distal
views and other
perspective views can be navigated using the tools shown herein. In one or
more
embodiments, the indicators such as apposition bar 111 are persistent such
that they remain in
view even if navigated away from an area of malapposition.
- 11 -
CA 02986226 2017-11-16
WO 2016/187218
PCT/US2016/032908
[0049] Thus, some indicators are rotationally agnostic such that if the
indicator includes a
region or length that includes a parameter that exceeds a threshold then that
region remains
indicated as such even if the image data is changed such that the rotated view
obscures the
region such as a malapposed stent region. Thus, if one side of a vessel has an
apposition
issue, the user remains aware of it relative to their location in the vessel.
The apposition bar
can be displayed as an indicator in one or more views of an angiography or OCT
image or
user-interfaces.
[0050]As shown in the various figures, the apposition bar 111 can be
subdivided into various
regions or lengths indicative of the presence of or more stents in the vessel
or the malposition
or the gap in between stents for a multi-stented vessel. The angiography data
and associate
image frames can be co-registered with OCT data. Further, as shown in the
figure user
selected vertical lines corresponding certain longitudinal distances on the
artery can be set to
guide stent planning. The rotational agnostic or persistent nature of the bar
provides further
assistance and error reduction during stent planning.
[0051] During a stent delivery planning procedure, clinician specified
landmarks can be
used for stent planning by providing a reference for a user to select stent
sizes and relative to
the vessel with respect to which user can refer to while deploying a stent
using live angio.
Given the levels and location of malapposition the user can refer to OCT and
annotated
angiography to further expand or move a stent as part of delivery planning.
These system
features and methods can be implemented using system 3 shown in FIG. 1 and the
system of
FIG 10A, for example.
[0052] FIG. 1 shows a system 3 which includes various data collection
subsystems suitable
for collecting data or detecting a feature of or sensing a condition of or
otherwise diagnosing
a subject 4. In one embodiment, the subject is disposed upon a suitable
support 19 such as
table bed to chair or other suitable support. Typically, the subject 4 is the
human or another
animal having a particular region of interest 25.
[0053] The data collection system 3 includes a noninvasive imaging system such
as a
nuclear magnetic resonance, x-ray, computer aided tomography, or other
suitable noninvasive
imaging technology. As shown as a non-limiting example of such a noninvasive
imaging
system, an angiography system 21 such as suitable for generating cines is
shown. The
angiography system 21 can include a fluoroscopy system. Angiography system 21
is
- 12 -
CA 02986226 2017-11-16
WO 2016/187218
PCT/US2016/032908
configured to noninvasively image the subject 4 such that frames of
angiography data,
typically in the form of frames of image data, are generated while a pullback
procedure is
performed using a probe 30 such that a blood vessel in region 25 of subject 4
is imaged using
angiography in one or more imaging technologies such as OCT or IVUS, for
example.
[0054] The angiography system 21 is in communication with an angiography data
storage
and image management system 22, which can be implemented as a workstation or
server in
one embodiment. In one embodiment, the data processing relating to the
collected
angiography signal is performed directly on the detector of the angiography
system 21. The
images from system 21 are stored and managed by the angiography data storage
and image
management 22.
[0055] In one
embodiment system server 50 or workstation 87 handle the functions of
system 22. In one embodiment, the entire system 21 generates electromagnetic
radiation,
such as x-rays. The system 21 also receives such radiation after passing
through the subject 4.
In turn, the data processing system 22 uses the signals from the angiography
system 21 to
image one or more regions of the subject 4 including region 25. This system
allows the
angiography data to be shown on displays 82 and 82 along with intravascular
data and the
various indicators and detected stent struts and shadows as described herein.
[0056] As shown in this particular example, the region of interest 25 is a
subset of the
vascular or peripherally vascular system such as a particular blood vessel.
This can be
imaged using OCT. A catheter-based data collection probe 30 is introduced into
the subject 4
and is disposed in the lumen of the particular blood vessel, such as for
example, a coronary
artery. The probe 30 can be a variety of types of data collection probes such
as for example
an OCT probe, an FFR probe, an IVUS probe, a probe combining features of two
or more of
the foregoing, and other probes suitable for imaging within a blood vessel.
The probe 30
typically includes a probe tip, one or more radiopaque markers, an optical
fiber, and a torque
wire. Additionally, the probe tip includes one or more data collecting
subsystems such as an
optical beam director, an acoustic beam director, a pressure detector sensor,
other transducers
or detectors, and combinations of the foregoing.
[0057] For an intravascular probe that includes an optical beam director, the
optical fiber
33 is in optical communication with the probe with the beam director. The
torque wire
defines a bore in which an optical fiber is disposed. In FIG. 1, the optical
fiber 33 is shown
without a torque wire surrounding it. In addition, the probe 30 also includes
the sheath such
- 13 -
CA 02986226 2017-11-16
WO 2016/187218
PCT/US2016/032908
as a polymer sheath (not shown) which forms part of a catheter. The optical
fiber 33, which
in the context of an OCT system is a portion of the sample arm of an
interferometer, is
optically coupled to a patient interface unit (PIU) 35 as shown.
[0058] The patient interface unit 35 includes a probe connector suitable to
receive an end of
the probe 30 and be optically coupled thereto. Typically, the data collection
probes 30 are
disposable. The PIU 35 includes suitable joints and elements based on the type
of data
collection probe being used. For example a combination OCT and IVUS data
collection
probe requires an OCT and IVUS PIU. The PIU 35 typically also includes a motor
suitable
for pulling back the torque wire, sheath, and optical fiber 33 disposed
therein as part of the
pullback procedure. In addition to being pulled back, the probe tip is also
typically rotated by
the PIU 35. In this way, a blood vessel of the subject 4 can be imaged
longitudinally or via
cross-sections. The probe 30 can also be used to measure a particular
parameter such as an
FFR or other pressure measurement. The image data can be used to generate
various 2D and
3D views which can be navigated as shown in the user interface depictions.
[0059] In turn, the PIU 35 is connected to one or more intravascular data
collection systems
42. The intravascular data collection system 42 can be an OCT system, an IVUS
system,
another imaging system, and combinations of the foregoing. For example, the
system 42 in
the context of probe 30 being an OCT probe can include the sample arm of an
interferometer,
the reference arm of an interferometer, photodiodes, a control system, and
patient interface
unit. Similarly, as another example, in the context of an IVUS system, the
intravascular data
collection system 42 can include ultrasound signal generating and processing
circuitry, noise
filters, rotatable joint, motors, and interface units. In one embodiment, the
data collection
system 42 and the angiography system 21 have a shared clock or other timing
signals
configured to synchronize angiography video frame time stamps and OCT image
frame time
stamps.
[0060] In addition to the invasive and noninvasive image data collection
systems and
devices of FIG. 1, various other types of data can be collected with regard to
region 25 of the
subject and other parameters of interest of the subject. For example, the data
collection probe
30 can include one or more pressure sensors such as for example a pressure
wire. A pressure
wire can be used without the additions of OCT or ultrasound components.
Pressure readings
can be obtained along the segments of a blood vessel in region 25 of the
subject 4.
- 14 -
CA 02986226 2017-11-16
WO 2016/187218
PCT/US2016/032908
[0061] Such readings can be relayed either by a wired connection or via a
wireless
connection. As shown in a fractional flow reserve FFR data collection system,
a wireless
transceiver 48 is configured to receive pressure readings from the probe 30
and transmit them
to a system to generate FFR measurements or more locations along the measured
blood
vessel. One or more displays 82, 83 can also be used to show an angiography
frame of data,
an OCT frame, user interfaces for OCT and angiography data, shadows,
indicators, missing
data and other controls and features of interest.
[0062] The intravascular image data such as the frames of intravascular data
generated
using the data collection probe 30 can be routed to the data collection
processing system 42
coupled to the probe via PIU 35. The noninvasive image data generated using
angiography
system 22 can be transmitted to, stored in, and processed by one or more
servers or
workstations such as the co-registration server 50 workstation 87. A video
frame grabber
device 55 such as a computer board configured to capture the angiography image
data from
system 22 can be used in various embodiments.
[0063] In one embodiment, the server 50 includes one or more co-registration
software
modules 60 that are stored in memory 70 and are executed by processor 80. The
server 50 can
include other typical components for a processor-based computing server. Or
more databases
such as database 90 can be configured to receive image data generated,
parameters of the
subject, and other information generated, received by or transferred to the
database 90 by one
or more of the systems devices or components shown in FIG. 1. Although
database 90 is
shown connected to server 50 while being stored in memory at workstation 87,
this is but one
exemplary configuration. For example, the software modules 60 can be running
on a
processor at workstation 87 and the database 90 can be located in the memory
of server 50.
The device or system use to run various software modules are provided as
examples. In
various combinations the hardware and software described herein can be used to
obtain
frames of image data, process such image data, and register such image data.
[0064] As otherwise noted herein, the software modules 60 can include software
such as
preprocessing software, transforms, matrices, lumen detection, stent
detection, shadow
detection, indicator generator and display, and other software-based
components that are used
to process image data or respond to patient triggers to facilitate co-
registration of different
types of image data by other software-based components 60 or to otherwise
perform such co-
registration. The modules can include lumen detection using a scan line based
or image
- 15 -
CA 02986226 2017-11-16
WO 2016/187218
PCT/US2016/032908
based approach, stent detection using a scan line based or image based
approach, indicator
generation, apposition bar generation for stent planning, guidewire shadow
indicator to
prevent confusion with dissention, side branches and missing data, and others.
[0065] The database 90 can be configured to receive and store angiography
image data 92
such as image data generated by angiography system 21 and obtained by the
frame grabber
55 server 50. The database 90 can be configured to receive and store OCT image
data 95 such
as image data generated by OCT system 42 and obtained by the frame grabber 55
server 50.
[0066] In addition, the subject 4 can be electrically coupled via one or more
electrodes to
one more monitors such as, for example, monitor 49. Monitor 49 can include
without
limitation an electrocardiogram monitor configured to generate data relating
to cardiac
function and showing various states of the subject such as systole and
diastole. Knowing the
cardiac phase can be used to assist the tracking of vessel centerlines, as the
geometry of the
heart, including the coronary arteries, is approximately the same at a certain
cardiac phase,
even over different cardiac cycles.
[0067] Hence, if the angiography data spans a few cardiac cycles, a first-
order matching of
vessel centerline at the same cardiac phase may assist in tracking the
centerlines throughout
the pullback. In addition, as most of the motion of the heart occurs during
the systole, vessel
motion is expected to be higher around the systole, and damp towards the
diastole. This
provides data to one or more software modules as an indication of the amount
of motion
expected between consecutive angiography frames. Knowledge of the expected
motion can
be used by one or more software modules to improve the tracking quality and
vessel
centerline quality by allowing adaptive constraints based on the expected
motion.
Shadow Detection Related Embodiments
[0068] The disclosure provides, in part, methods and systems for identifying
within a
detected stent shadow the precise offset, or location, of the strut resulting
in the detected
shadow. Sometimes, within a shadow there is a single possible strut location
corresponding
to a bright strut bloom, or peak, against a dark shadow background in the scan
line.
However, multiple strut peaks often are detected inside a strut shadow, making
it difficult to
identify the exact location of a stent strut. Spurious peaks can be caused by,
for example,
blood pooling, poor blood clearing in the pullback zone, or ringing artifacts
due to the
imaging optics interacting with the metal strut. The present disclosure
provides methods and
systems for identifying the best candidate for a true stent within a stent
shadow.
- 16 -
CA 02986226 2017-11-16
WO 2016/187218
PCT/US2016/032908
[0069] FIG. 10A is a high level schematic diagram depicting a blood vessel 5,
such as an
artery, a data collection probe 7 and an intravascular data collection and
processing system
10. The methods described with regard to FIG. 10 can also be performed with
system 3 of
FIG. 1 and other systems. The system 10 can include for example, an OCT,
intravascular
ultrasound (IVUS), or other intravascular imaging system. A stent 12 is shown
in the blood
vessel 5. The stent includes a plurality of struts. Some of the struts can
generate shadows or
shadow regions SR as part of the process of imaging the vessel with an
intravascular probe.
The system 10 can include various software modules suitable for performing
side branch
detection, peak detection, shadow region detection and processing, error
correction, indicator
bar generation and display, model comparisons, lumen detection, and various
other processes
as described herein. The system 10 can include a suitable light source that
satisfies the
coherence and bandwidth requirements of the applications and data collection
described
herein. The system 10 can include an ultrasound imaging system. The probe 7
can include a
catheter 20 having a catheter portion having one or more optical fibers 15 and
a probe tip 17
disposed therein. The probe tip 17 includes a beam director in one embodiment.
[0070] As shown, the catheter 20 is introduced into the lumen 11 such as an
arterial lumen.
The probe 7 can include a rotating or slidable fiber 15 that directs light
forward into the
lumen L or at a direction perpendicular to the longitudinal axis of the fiber
15. As a result, in
the case of light that is directed from the side of the probe as the fiber 15
rotates, OCT data is
collected with respect to the walls of the blood vessel 5. The walls of the
blood vessel 5
define a lumen boundary. This lumen boundary can be detected using the
distance
measurements obtained from the optical signals collected at the probe tip 17
using lumen
detection software component. Side branches and stent struts and shadow
regions and other
features can be identified in the scan lines generated during a pullback
through the artery by
the probe.
[0071] In one embodiment, the probe 7 can include other imaging modalities in
addition to
OCT such as ultrasound in one embodiment. In one embodiment, the lumen / lumen
boundary refers to a portion of the vessel that is first impinged upon when
light or ultrasound
exists an intravascular imaging probe that generates a signal of interest for
imaging the
vessel. This excludes any blood flowing in the vessel which is typically
removed using
image processing in the form of masking. In one embodiment, the lumen or lumen
boundary
refers to a region of tissue that is disposed in front of the vessel wall and
facing the blood
containing region of the vessel.
- 17 -
CA 02986226 2017-11-16
WO 2016/187218
PCT/US2016/032908
[0072] As shown in FIG. 10A, the probe tip 17 is positioned in the lumen L
such that it is
distal to a stented region of the blood vessel 5. The probe tip 17 is
configured to transmit
light and receive backscattered light from objects, such as for example stent
12, and the wall
of the blood vessel 5. The probe tip 17 and the rest of the data collection
probe 7 are pulled
through the lumen L. As shown in FIG. 10B, a probe 17 is shown prior to or
after insertion
in a blood vessel. The probe 7 is in optical communication with an OCT system
10. The
OCT system or subsystem 10 that connects to probe 17 via an optical fiber 15
can include a
light source such as a laser, an interferometer having a sample arm and a
reference arm,
various optical paths, a clock generator, photodiodes, and other OCT system
components.
[0073] In one embodiment, an optical receiver 31 such as a balanced photodiode
based
system can receive light exiting the probe 7. A computing device 40 such as a
computer,
processor, ASIC or other device can be part of the OCT system 10 or can be
included as a
separate subsystem in electrical or optical communication with the OCT system
10. The
computing device 40 can include memory, storage, buses and other components
suitable for
processing data and software 44 such as image data processing stages
configured for side
branch detection, stent strut candidate selection or identification, candidate
stent strut shadow
region detection, correlations and comparisons of stent image data stent
visualization, and
pullback data collection as discussed below.
[0074] In one embodiment, the computing device 40 includes or accesses
software modules
or programs 44, such as a side branch detection module, a lumen detection
module, a stent
detection module, a stent strut validation module, a candidate stent strut
identification module
and other software modules. The software modules or programs 44 can include an
image
data processing pipeline or component modules thereof and one or more
graphical user
interfaces (GUI). The various software-based methods described herein can be
included as
part of the group of software / programs 44. The modules can be subsets of
each other and
arranged and connected through various inputs, outputs, and data classes.
[0075] An exemplary image processing pipeline and components thereof can
constitute one
or more software programs or modules 44. The software modules 44 may comprise
several
image processing algorithms tailored to detect the vessel lumen, side-
branches, guide-wires,
guide-catheters, stent struts and stent regions. This disclosure relates to
image processing to
determine the location of a metal strut within its shadow. The image data
processing
pipeline, its components software modules and related methods and any of the
methods
- 18 -
CA 02986226 2017-11-16
WO 2016/187218
PCT/US2016/032908
described herein are stored in memory and executed using one or more computing
devices
such as a processor, device, or other integrated circuit.
[0076] As shown, in FIG. 10A, a display 46 can also be part of the system 10
for showing
information 47 such as cross-sectional and longitudinal views of a blood
vessel generated
from OCT or IVUS imaging data and apposition bars and other indicators. The
image
processing software algorithms 44 provide data corresponding to detected image
features
such as stents, side-branches, guide-wire etc. and this data is input to the
GUI where these
features are displayed in a desired format on cross-sectional, longitudinal,
and/or 3D display
sections of the GUI. The image of FIG. 10B is an example of display
information 47 that can
be displayed and interacted with using a GUI and various input devices.
Specifically, it
shows a 2D cross-sectional view of a coronary artery containing a metal stent.
[0077] In addition, display information 47 can include, without limitation,
cross-sectional
scan data, longitudinal scans, diameter graphs, image masks, stents, areas of
malapposition,
lumen border, and other images or representations of a blood vessel or the
underlying
distance measurements obtained using an OCT system and data collection probe.
The
computing device 40 can also include software or programs 44, which can be
stored in one or
more memory devices 45, configured to identify stent struts and malapposition
levels (such as
based on a threshold and measured distance comparison), shadow regions, and
struts within
shadow regions and other blood vessel features such as with text, arrows,
color coding,
highlighting, contour lines, or other suitable human or machine readable
indicia.
[0078] FIG. 10B is a cross-sectional OCT image of a stented blood vessel, in
accordance
with the present disclosure. The lumen / lumen boundary of the blood vessel 10
is in the
center of the image. The guide wire shadow 12 is visible at the top of the
image, from 12 to 1
o'clock. Also visible in FIG. 10B are multiple metal stent struts 14, which
cast shadows 16
in the OCT image. Metal stent struts cast shadows against the blood vessel
wall because the
coherent light typically used for OCT imaging cannot penetrate stent struts
but is reflected.
The present disclosure provides enhanced methods for detecting the precise
offset of struts
within strut shadows. Once detected, the shadows and struts of FIG. 10B can be
used to
generate the user interfaces and indicators described herein.
[0079] FIG. 11 is a process flow chart for detecting struts in OCT image data.
The method
100 analyzes shadows corresponding to stent struts in a plurality of OCT
pullback frames.
The method 100 can include one or more of the steps described herein. Unless
otherwise
- 19 -
CA 02986226 2017-11-16
WO 2016/187218
PCT/US2016/032908
required, the steps can be performed in any order. The metal strut detection
method operates
upon various inputs from other image / intravascular data processing modules
such as
information about guide-wire (140), side-branch (130) and strut shadow
locations (110). The
process flow and associated method steps and stages can operate upon original
intravascular
data or raw data 120 obtained using a OCT, IVUS, or other intravascular data
collection
system. In one embodiment, data 120 has been processed by one or more image
processing
modules in a pipeline configuration.
[0080] In Step 110, each shadow in the OCT image data is compared or
correlated with
data inputs from a side branch detection module 130 and a guide-wire detection
module 140
to determine if the shadow is attributable to a side branch vessel or
guidewire. Methods,
systems, and devices for detecting strut shadows, side branches, and guidewire
shadows are
known. See, e.g., US 8,412,312; 8,478,387; 8,831,321; 9,138,147 and 9,173,591.
[0081] At Step 150, if a given shadow is determined to be attributable to the
guidewire or a
side branch, the shadow is discarded and the analysis ends with respect to
that shadow. At
Step 160, if a given shadow is determined to be attributable to a stent strut,
either by direct
detection or by process of elimination, the shadow is analyzed to compute, or
isolate, the
interior part of the shadow. The shadow boundaries are trimmed away or
otherwise reduced
or constrained such that only the scan lines, or A-Lines, corresponding to the
interior (and
hence the "darkest") portion of the shadow are retained. The reason for this
is that the
shadow region, specifically the start and stop scan lines of the shadow, can
sometimes
contain spillage from the neighboring lumen pixels. Isolating the interior of
the shadow and
ignoring transitionary scan lines at the shadow margins improves assessment of
strut offsets.
[0082] At step 170, the shadow interior is analyzed to compute the projection
(or sum) of
each sample across scan lines corresponding to the interior part of the
shadow. Each scan-
line is sampled into discrete pixels or "samples". In the input OCT image
data, each scan line
refers to data acquired along a particular angular direction with the imaging
catheter at the
center. Each scan line is in turn radially sampled into a discrete set of
pixels or "samples".
Each sample in the OCT data is typically a few microns wide and is typically
uniform in size.
A "projection" refers to the process of adding across each scan line. I n
other words, the 2-
dimensional shadow in the scan-line, sample} space is collapsed into a 1-
dimensional signal
where the i-th index corresponds to the sum of the i-th sample of each scan-
line involved in
- 20 -
CA 02986226 2017-11-16
WO 2016/187218
PCT/US2016/032908
the process. The projection contains samples, at radius R, which are the
average of samples
from the constituent scanlines at that same radius R.
[0083] At step 180, the projection is searched for up to three (e.g., 1, 2, or
3) of the largest
local maxima. The location, or offset, of each selected maximum may be noted
as potential
strut locations, and certain features of the selected maxima are then analyzed
to determine
which one is the best candidate for being a true strut. In various
embodiments, only the
largest maximum is selected. In other embodiments, two or three of the largest
maxima are
selected. The initial selection of multiple local maxima increases
sensitivity. Although more
than three local maxima can be selected, this typically is unnecessary because
one of the three
highest maxima usually indicates the true strut location. The maxima selection
process is
illustrated by FIGS. 12 and 13.
[0084] FIG. 12 is an A-Line or scan line OCT image, in log scale, of a stented
blood vessel.
The box 155 on the right of the image indicates a shadow under analysis, and
FIG. 13 shows
a projection graph for this shadow. The blood vessel lumen L is the dark
region at the top of
the image, and the blood vessel wall 18 is the bright region at the bottom of
the image. L is
generally used to indicate the lumen herein. Multiple stents 14 and stent
shadows 16 are
visible in the image. In one embodiment, the lumen is the boundary between the
tissue and
the cleared interior of the vessel.
[0085] FIG. 13 is a graph illustrating detection of multiple potential struts
within a single
shadow. FIG. 13 is a plot of the projection across the interior shadow scan
lines. There are
two local maxima 22a and 22b. These maxima correspond to two potential strut
locations
within the shadow. These locations can be used by an intravascular imaging
system such as
an OCT or IVUS system to display stent struts on a user interface as shown
herein.
[0086] Additional filters can be applied to the local maxima to remove false
positives. In
various embodiments, a local maximum is selected only if it has a signal
greater than 1/10th
(i.e., 10%) of the global peak (largest maximum along the projection). The
global peak is the
peak with the greatest amplitude. The 10% threshold reduces the chance of
selecting
spurious local maxima due to noise. The threshold can be set between 5% (i.e.,
1/20th) and
10% of the global peak, such as 5%, 6%, 7%, 8%, 9%, or 10%, with 10% being
preferred. In
various embodiments, if multiple peaks are detected in close proximity to each
other, only the
largest peak is selected for further analysis.
- 21 -
CA 02986226 2017-11-16
WO 2016/187218
PCT/US2016/032908
[0087] At Step 190, the selected local maxima are analyzed to determine which
maximum
has the highest probability of being the true strut based on the information
available from the
immediate neighborhood of the strut. A relative score is assigned to each
strut based on one
or more of the following criteria:
1. Proximity to lumen: The selected local maxima are scored based on proximity
to the
lumen boundary. The local maximum closest to the lumen around the strut shadow
receives the highest score, and the local maximum farthest from the lumen
around
the strut shadow receives the lowest score.
2. Peak strength: The selected local maxima are scored based on peak strength.
The
local maximum with the highest peak receives the highest score, and the local
maximum with the lowest peak receives the lowest score.
3. Degree of malapposition: The selected local maxima are scored based on
their
apposition, which refers to the state of being in juxtaposition to the lumen.
Local
maxima that are apposed within a predefined acceptable distance from the lumen
or
vessel wall receive a higher malapposition score. Struts that are too far away
from
the lumen or vessel wall (determined by a user specified threshold using one
or more
interface screens or based on accepted treatment thresholds) are penalized and
receive a lower malapposition score as potential false positives. In one
embodiment,
a strut can either have a malapposition score of 0 or 1 depending on whether
it is
malapposed or not, respectively.
[0088] These scoring criteria are exemplary, and additional scoring criteria
based on other
strut and shadow features may be used. In one embodiment, candidate stent
struts are
validated using a cross-frame analysis to indicate that a strut is valid if a
segment of strut is
next to or aligned with another segment in an adjacent or neighboring frame.
[0089] Each local maxima gets a combined score which is the linear sum of the
abovementioned criteria. At Step 200, the local maximum with the highest score
is selected
as the valid strut. At Step 210, the remaining local maxima are saved as
alternative or backup
struts pending further analysis. In the event of a tie, the local maximum
closest to the lumen
and/or the brightest local maximum are used as tiebreakers. Table 1 provides
an exemplary
ranking of local maxima for a stent shadow.
- 22 -
CA 02986226 2017-11-16
WO 2016/187218
PCT/US2016/032908
Table 1: Local maxima ranking for a stent shadow.
Local Maximum 1 Local Maximum 2 Local Maximum 3
Proximity to Lumen 3 2 1
Peak Strength 2 1 3
Malapposition 1 0 0
Total 6 3 4
[0090] As shown in Table 1, local maximum 1 has the highest total score and
therefore
would be selected as the candidate valid strut. Local maxima 2 and 3 would be
designated as
backup struts.
[0091] At Step 220, all local maxima (valid strut and any backup struts)
undergo multi-
frame validation. In this step, adjacent frames are compared to verify that a
valid strut in one
frame aligns with valid struts selected for adjacent frames. If a valid strut
does not align with
other cross-frame struts, then the valid strut may be replaced by a backup
strut if the backup
strut better fits the cross-frame model. One embodiment of the multi-frame
validation step
can use stent strut geometry and location information. Other embodiments with
a larger set of
strut and shadow features can also be used for this step. That is location and
geometry can be
used as features all with other features such as prior pullback data or other
user supplied
information.
[0092] Once detected, the valid or chosen struts can be displayed on a user
interface, which
conveys vital visual aid to the clinician about the precise location of stent
struts and whether
adjustments may be necessary to optimize and/or speed-up stent placement and
reduce the
risk of side effects. The user interface can include cross-sectional images, L-
Mode images,
scan line images, three dimensional renderings, or any other suitable display
format for
visualizing detected struts. The user
interface can also include the indicator bars,
angiography data, and other views and features described and depicted herein.
[0093] The detection algorithm accurately identified the location of struts,
with a sensitivity
of that ranges from greater than about 80% in one embodiment. The detection
algorithm
accurately identified the location of struts, with a sensitivity of that
ranges from greater than
about 00% in one embodiment. In one embodiment, sensitivity is the proportion
of struts
correctly located over the total number of struts (struts correctly located
plus struts missed).
The positive predictive value is the proportion of struts correctly detected
over all positive
- 23 -
CA 02986226 2017-11-16
WO 2016/187218
PCT/US2016/032908
calls (struts correctly detected plus false positive in one embodiment. The
various features
described herein are suitable for use with different cath lab systems such as
intravascular
imaging and pressure measurement systems. The indicators and detection steps
described
herein offer various advantages to diagnosticians and those planning stent
deployments or
evaluating deployed stents.
[0094] The use of arrow heads showing directionality in a given figure or the
lack thereof
are not intended to limit or require a direction in which information can
flow. For a given
connector, such as the arrows and lines shown connecting the elements shown in
FIGS. 1 and
10A, for example, information can flow in one or more directions or in only
one direction as
suitable for a given embodiment. The connections can include various suitable
data
transmitting connections such as optical, wire, power, wireless, or electrical
connections.
[0095] Some portions of the detailed description are presented in terms of
algorithms and
symbolic representations of operations on data bits within a computer memory.
These
algorithmic descriptions and representations can be used by those skilled in
the computer and
software related fields. In one embodiment, an algorithm is here, and
generally, conceived to
be a self-consistent sequence of operations leading to a desired result. The
operations
performed as methods stops or otherwise described herein are those requiring
physical
manipulations of physical quantities. Usually, though not necessarily, these
quantities take
the form of electrical or magnetic signals capable of being stored,
transferred, combined,
transformed, compared, and otherwise manipulated.
Non-limiting Software Features and Embodiments for Implementing Interface,
Detection and
other Features of Disclosure
[0096] The following description is intended to provide an overview of device
hardware
and other operating components suitable for performing the methods of the
disclosure
described herein. This description is not intended to limit the applicable
environments or the
scope of the disclosure. Similarly, the hardware and other operating
components may be
suitable as part of the apparatuses described above. The disclosure can be
practiced with
other system configurations, including personal computers, multiprocessor
systems,
microprocessor-based or programmable electronic device, network PCs,
minicomputers,
mainframe computers, and the like. The disclosure can also be practiced in
distributed
computing environments where tasks are performed by remote processing devices
that are
- 24 -
CA 02986226 2017-11-16
WO 2016/187218
PCT/US2016/032908
linked through a communications network such as in different rooms of a
catheter or cath lab.
[0097] Some portions of the detailed description are presented in terms of
algorithms and
symbolic representations of operations on data bits within a computer memory.
These
algorithmic descriptions and representations can be used by those skilled in
the computer and
software related fields. In one embodiment, an algorithm is here, and
generally, conceived to
be a self-consistent sequence of operations leading to a desired result. The
operations
performed as methods stops or otherwise described herein are those requiring
physical
manipulations of physical quantities. Usually, though not necessarily, these
quantities take
the form of electrical or magnetic signals capable of being stored,
transferred, combined,
transformed, compared, and otherwise manipulated.
[0098] Unless specifically stated otherwise as apparent from the following
discussion, it is
appreciated that throughout the description, discussions utilizing terms such
as "processing"
or "computing" or "searching" or "indicating" or "detecting" or "measuring" or
"calculating"
or "comparing" "generating" or "sensing" or "determining" or "displaying," or
Boolean logic
or other set related operations or the like, refer to the action and processes
of a computer
system, or electronic device, that manipulates and transforms data represented
as physical
(electronic) quantities within the computer system's or electronic devices'
registers and
memories into other data similarly represented as physical quantities within
electronic
memories or registers or other such information storage, transmission or
display devices.
[0099] The present disclosure, in some embodiments, also relates to apparatus
for
performing the operations herein. This apparatus may be specially constructed
for the
required purposes, or it may comprise a general purpose computer selectively
activated or
reconfigured by a computer program stored in the computer. Various circuits
and
components thereof can be used to perform some of the data collection and
transformation
and processing described herein.
[0100] The algorithms and displays presented herein are not inherently related
to any
particular computer or other apparatus. Various general purpose systems may be
used with
programs in accordance with the teachings herein, or it may prove convenient
to construct
more specialized apparatus to perform the required method steps. The required
structure for
a variety of these systems will appear from the description below. In
addition, the present
disclosure is not described with reference to any particular programming
language, and
various embodiments may thus be implemented using a variety of programming
languages.
In one embodiment, the software instructions are configured for operation on a
- 25 -
CA 02986226 2017-11-16
WO 2016/187218
PCT/US2016/032908
microprocessor or ASIC of an intravascular imaging / data collection system.
[0101] Embodiments of the disclosure may be embodied in many different forms,
including, but in no way limited to, computer program logic for use with a
processor (e.g., a
microprocessor, microcontroller, digital signal processor, or general purpose
computer),
programmable logic for use with a programmable logic device, (e.g., a Field
Programmable
Gate Array (FPGA) or other programmable logic device), discrete components,
integrated
circuitry (e.g., an Application Specific Integrated Circuit (ASIC)), or any
other means
including any combination thereof. In a typical embodiment of the present
disclosure, some
or all of the processing of the data collected using an OCT probe and the
processor-based
system or used to generate a control signal or initiate a user interface
command is
implemented as a set of computer program instructions that is converted into a
computer
executable form, stored as such in a computer readable medium, and executed by
a
microprocessor under the control of an operating system.
[0102] Thus, query, response, transmitted probe data, input data and other
data and signal
described herein are transformed into processor understandable instructions
suitable for
responding to user interface selections, controlling a graphical user
interface, control and
graphic signal processing, displaying cross-sectional information and images
from other data
collection modalities, generating and displaying stents and apposition bars
and other
intravascular data, displaying OCT, angiography, detecting shadows, detecting
peaks, and
other data as part of a graphic user interface and other features and
embodiments as described
above. Data and parameters suitable for display as GUI components or controls,
values, or as
another representation in a graphical user interface can include without
limitation
malapposition values, apposition bars, stent struts, missing data
representations, indicator
bars, shadows, angiography representations, three and two dimensional renders
and views,
and other features as described herein.
[0103] Computer program logic implementing all or part of the functionality
previously
described herein may be embodied in various forms, including, but in no way
limited to, a
source code form, a computer executable form, and various intermediate forms
(e.g., forms
generated by an assembler, compiler, linker, or locator). Source code may
include a series of
computer program instructions implemented in any of various programming
languages (e.g.,
an object code, an assembly language, or a high-level language such as
Fortran, C, C++,
JAVA, or HTML) for use with various operating systems or operating
environments. The
source code may define and use various data structures and communication
messages. The
- 26 -
CA 02986226 2017-11-16
WO 2016/187218
PCT/US2016/032908
source code may be in a computer executable form (e.g., via an interpreter),
or the source
code may be converted (e.g., via a translator, assembler, or compiler) into a
computer
executable form.
[0104] The computer program may be fixed in any form (e.g., source code form,
computer
executable form, or an intermediate form) either permanently or transitorily
in a tangible
storage medium, such as a semiconductor memory device (e.g., a RAM, ROM, PROM,
EEPROM, or Flash-Programmable RAM), a magnetic memory device (e.g., a diskette
or
fixed disk), an optical memory device (e.g., a CD-ROM), a PC card (e.g.,
PCMCIA card), or
other memory device. The computer program may be fixed in any form in a signal
that is
transmittable to a computer using any of various communication technologies,
including, but
in no way limited to, analog technologies, digital technologies, optical
technologies, wireless
technologies, networking technologies, and internetworking technologies. The
computer
program may be distributed in any form as a removable storage medium with
accompanying
printed or electronic documentation (e.g., shrink-wrapped software), preloaded
with a
computer system (e.g., on system ROM or fixed disk), or distributed over a
network.
[0105] Hardware logic (including programmable logic for use with a
programmable logic
device) implementing all or part of the functionality previously described
herein may be
designed using traditional manual methods, or may be designed, captured,
simulated, or
documented electronically using various tools, such as Computer Aided Design
(CAD), a
hardware description language (e.g., VHDL or AHDL), or a PLD programming
language
(e.g., PALASM, ABEL, or CUPL).
[0106] Programmable logic may be fixed either permanently or transitorily in a
tangible
storage medium, such as a semiconductor memory device (e.g., a RAM, ROM, PROM,
EEPROM, or Flash-Programmable RAM), a magnetic memory device (e.g., a diskette
or
fixed disk), an optical memory device (e.g., a CD-ROM), or other memory
device. The
programmable logic may be fixed in a signal that is transmittable to a
computer using any of
various communication technologies, including, but in no way limited to,
analog
technologies, digital technologies, optical technologies, wireless
technologies (e.g.,
Bluetooth), networking technologies, and internetworking technologies. The
programmable
logic may be distributed as a removable storage medium with accompanying
printed or
electronic documentation (e.g., shrink-wrapped software), preloaded with a
computer system
(e.g., on system ROM or fixed disk), or distributed from a server or
electronic bulletin board
over the communication system (e.g., the Internet or World Wide Web).
- 27 -
CA 02986226 2017-11-16
WO 2016/187218
PCT/US2016/032908
[0107] Various examples of suitable processing modules are discussed below in
more
detail. As used herein a module refers to software, hardware, or firmware
suitable for
performing a specific data processing or data transmission task. Typically, in
a preferred
embodiment a module refers to a software routine, program, or other memory
resident
application suitable for receiving, transforming, routing and processing
instructions, or
various types of data such as OCT scan data, user interface data, control
signals, angiography
data, user actions, frequencies, interferometer signal data, detected stents,
candidate stent
struts, FFR data, IVUS data , shadows, pixels, intensity patterns, scores,
projections, side
branch data, and guidewire data and other information of interest as described
herein.
[0113] Computers and computer systems described herein may include an
operatively
associated machine-readable medium such as computer-readable media such as
memory for
storing software applications used in obtaining, processing, storing and/or
communicating
data. It can be appreciated that such memory can be internal, external, remote
or local with
respect to its operatively associated computer or computer system.
[0108] Memory may also include any means for storing software or other
instructions
including, for example and without limitation, a hard disk, an optical disk,
floppy disk, DVD
(digital versatile disc), CD (compact disc), memory stick, flash memory, ROM
(read only
memory), RAM (random access memory), DRAM (dynamic random access memory),
PROM (programmable ROM), EEPROM (extended erasable PROM), and/or other like
computer-readable media.
[0109] In general, computer-readable memory media applied in association with
embodiments of the disclosure described herein may include any memory medium
capable of
storing instructions executed by a programmable apparatus. Where applicable,
method steps
described herein may be embodied or executed as instructions stored on a
computer-readable
memory medium or memory media. These instructions may be software embodied in
various
programming languages such as C++, C, Java, and/or a variety of other kinds of
software
programming languages that may be applied to create instructions in accordance
with
embodiments of the disclosure.
[0110] The term "machine-readable medium" or "computer-readable-medium"
includes
any medium that is capable of storing, encoding or carrying a set of
instructions for execution
by the machine and that cause the machine to perform any one or more of the
methodologies
of the present disclosure. While the machine-readable medium is shown in an
example
embodiment to be a single medium, the term "machine-readable medium" should be
taken to
-28-
CA 02986226 2017-11-16
WO 2016/187218
PCT/US2016/032908
include a single medium or multiple media (e.g., a database, one or more
centralized or
distributed databases and/or associated caches and servers) that store the one
or more sets of
instructions.
[0111] A storage medium may be non-transitory or include a non-transitory
device.
Accordingly, a non-transitory storage medium or non-transitory device may
include a device
that is tangible, meaning that the device has a concrete physical form,
although the device
may change its physical state. Thus, for example, non-transitory refers to a
device remaining
tangible despite this change in state.
[0112] The aspects, embodiments, features, and examples of the disclosure are
to be
considered illustrative in all respects and are not intended to limit the
disclosure, the scope of
which is defined only by the claims. Other embodiments, modifications, and
usages will be
apparent to those skilled in the art without departing from the spirit and
scope of the claimed
disclosure.
[0113] The use of headings and sections in the application is not meant to
limit the
disclosure; each section can apply to any aspect, embodiment, or feature of
the disclosure.
[0114] Throughout the application, where compositions are described as having,
including,
or comprising specific components, or where processes are described as having,
including or
comprising specific process steps, it is contemplated that compositions of the
present
teachings also consist essentially of, or consist of, the recited components,
and that the
processes of the present teachings also consist essentially of, or consist of,
the recited process
steps.
[0115] In the application, where an element or component is said to be
included in and/or
selected from a list of recited elements or components, it should be
understood that the
element or component can be any one of the recited elements or components and
can be
selected from a group consisting of two or more of the recited elements or
components.
Further, it should be understood that elements and/or features of a
composition, an apparatus,
or a method described herein can be combined in a variety of ways without
departing from
the spirit and scope of the present teachings, whether explicit or implicit
herein.
[0116] The use of the terms "include," "includes," "including," "have," "has,"
or "having"
should be generally understood as open-ended and non-limiting unless
specifically stated
otherwise.
[0117] The use of the singular herein includes the plural (and vice versa)
unless specifically
stated otherwise. Moreover, the singular forms "a," "an," and "the" include
plural forms
- 29 -
CA 02986226 2017-11-16
WO 2016/187218
PCT/US2016/032908
unless the context clearly dictates otherwise. In addition, where the use of
the term "about" is
before a quantitative value, the present teachings also include the specific
quantitative value
itself 10%, unless specifically stated otherwise.
[0118] It should be understood that the order of steps or order for performing
certain
actions is immaterial so long as the present teachings remain operable.
Moreover, two or
more steps or actions may be conducted simultaneously.
[0119] Where a range or list of values is provided, each intervening value
between the
upper and lower limits of that range or list of values is individually
contemplated and is
encompassed within the disclosure as if each value were specifically
enumerated herein. In
addition, smaller ranges between and including the upper and lower limits of a
given range
are contemplated and encompassed within the disclosure. The listing of
exemplary values or
ranges is not a disclaimer of other values or ranges between and including the
upper and
lower limits of a given range.
[0120] It is to be understood that the figures and descriptions of the
disclosure have been
simplified to illustrate elements that are relevant for a clear understanding
of the disclosure,
while eliminating, for purposes of clarity, other elements. Those of ordinary
skill in the art
will recognize, however, that these and other elements may be desirable.
However, because
such elements are well known in the art, and because they do not facilitate a
better
understanding of the disclosure, a discussion of such elements is not provided
herein. It
should be appreciated that the figures are presented for illustrative purposes
and not as
construction drawings. Omitted details and modifications or alternative
embodiments are
within the purview of persons of ordinary skill in the art.
[0121] It can be appreciated that, in certain aspects of the disclosure, a
single component
may be replaced by multiple components, and multiple components may be
replaced by a
single component, to provide an element or structure or to perform a given
function or
functions. Except where such substitution would not be operative to practice
certain
embodiments of the disclosure, such substitution is considered within the
scope of the
disclosure.
[0122] The examples presented herein are intended to illustrate potential and
specific
implementations of the disclosure. It can be appreciated that the examples are
intended
primarily for purposes of illustration of the disclosure for those skilled in
the art. There may
be variations to these diagrams or the operations described herein without
departing from the
spirit of the disclosure. For instance, in certain cases, method steps or
operations may be
- 30 -
CA 02986226 2017-11-16
WO 2016/187218
PCT/US2016/032908
performed or executed in differing order, or operations may be added, deleted
or modified.
[0123] Furthermore, whereas particular embodiments of the disclosure have been
described
herein for the purpose of illustrating the disclosure and not for the purpose
of limiting the
same, it will be appreciated by those of ordinary skill in the art that
numerous variations of
the details, materials and arrangement of elements, steps, structures, and/or
parts may be
made within the principle and scope of the disclosure without departing from
the disclosure
as described in the claims.
[0124] What is claimed is:
- 31 -