Note: Descriptions are shown in the official language in which they were submitted.
CA 02987838 2017-11-30
WO 2017/017533
PCT/1B2016/001374
RISK IDENTIFICATION AND RISK REGISTER GENERATION SYSTEM AND
ENGINE
FIELD OF THE INVENTION
[0001] This invention generally relates to mining and intelligent
processing of data
collected from content sources. More specifically, this invention relates to
providing data and
analysis useful in risk identification using information mined from
information sources,
investment related trends, threats, and opportunities.
BACKGROUND OF THE INVENTION
[0002] Organizations operate in risky environments. Competitors may
threaten their
markets; regulations may threaten margins and business models; customer
sentiment may
shift and threaten demand; and suppliers may go out of business and threaten
supply. Three
main areas of risk are operational, change and strategic. World events such as
terrorism,
natural disasters and the global financial crisis have raised the profile of
negative risk while
events such as the advent and widespread use of the Internet represent
positive risks. Now
more than ever, organizations must plan, respond and recognize all forms of
risks that they
face. Risk management is a central part of operations and strategy for any
prudent
organization and requires as a core business asset the ability to identify,
understand and deal
with risks effectively to increase success and reduce the likelihood of
failure. Early detection
and response to risks is a key need for any business and other entity.
[0003] Currently, various event alerts with respect to entities and
activities are
common. However, such alerts occur after the fact. While alerts as to the
actual occurrence of
an event which puts an entity or topic/concern at risk is important, the
mining of potential
risks is believed to be very useful in decision making with respect to such an
entity or issue.
In order to perform a meaningful risk assessment, it is often necessary to
compile not only
sufficient information, but information of the proper type in order to
formulate a judgment as
to whether the information constitutes a risk. Without the ability to access
and assimilate a
variety of different information sources, and particularly from a sufficient
number and type of
information sources, the identification, assessment and communication of
potential risks is
significantly hampered. Currently, gathering of risk-related information is
performed
manually and lacks defined criteria and processes for mining meaningful risks
to provide a
1
CA 02987838 2017-11-30
WO 2017/017533
PCT/1B2016/001374
clear picture of the risk landscape. Additionally, known methods do not
provide consistent
results and may return false positives.
[0004] With the advents of the printing press, typeset, typewriting
machines,
computer-implemented word processing and mass data storage, the amount of
information
generated by mankind has risen dramatically and with an ever quickening pace.
As a result of
the growing and divergent sources of information, manual processing of
documents and the
content therein is no longer possible or desirable. Accordingly, there exists
a growing need to
collect and store, identify, track, classify and catalogue, and process this
growing sea of
information/content and to deliver value added service to facilitate informed
use of the data
and predictive patterns derived from such information. Due to the development
and
widespread deployment of and accessibility to high speed networks, e.g.,
Internet, there exists
a growing need to adequately and efficiently process the growing volume of
content available
on such networks to assist in decision making. In particular the need exists
to quickly process
information pertaining to corporate performance and events that may have an
impact
(positive or negative) on such performance so as to enable informed decision
making in light
of the effect of events and performance, including predicting the effect such
events may have
on operational risk management, the price of traded securities or other
offerings.
[0005] In many areas and industries, including financial services
sector, for example,
there are content and enhanced experience providers, such as The Thomson
Reuters
Corporation, Wall Street Journal, Dow Jones News Service, Bloomberg, Financial
News,
Financial Times, News Corporation, Zawya, and New York Times. Such providers
identify,
collect, analyze and process key data for use in generating content, such as
reports and
articles, for consumption by professionals and others involved in the
respective industries,
e.g., Chief Risk Officers (CROs), procurement officers, financial consultants
and investors.
In one manner of content delivery, these financial news services provide
financial news
feeds, both in real-time and in archive, that include articles and other
reports that address the
occurrence of recent events that are of interest to investors. Many of these
articles and
reports, and of course the underlying events, may have a measureable impact on
the trading
stock price associated with publicly traded companies. Although often
discussed herein in
terms of publicly traded stocks (e.g., traded on markets such as the NASDAQ
and New York
Stock Exchange), the invention is not limited to stocks and includes
application to other
forms of investment and instruments for investment and to all forms of
entities, including
persons, industry groups, etc. Professionals and providers in the various
sectors and industries
2
CA 02987838 2017-11-30
WO 2017/017533
PCT/1B2016/001374
continue to look for ways to enhance content, data and services provided to
subscribers,
clients and other customers and for ways to distinguish over the competition.
Such providers
strive to create and provide enhance tools, including search and ranking
tools, to enable
clients to more efficiently and effectively process information and make
informed decisions.
[0006] Advances in technology, including database mining and management,
search
engines, linguistic recognition and modeling, provide increasingly
sophisticated approaches
to searching and processing vast amounts of data and documents, e.g., database
of news
articles, financial reports, blogs, tweets, updates, SEC and other required
corporate
disclosures, legal decisions, statutes, laws, and regulations, that may affect
business
performance and, therefore, prices related to the stock, security or fund
comprised of such
equities. Investment and other financial professionals and other users
increasingly rely on
mathematical models and algorithms in making professional and business
determinations.
Especially in the area of investing, systems that provide faster access to and
processing of
(accurate) news and other information related to corporate performance will be
a highly
valued tool of the professional and will lead to more informed, and more
successful, decision
making. Information technology and in particular information extraction (IE)
are areas
experiencing significant growth to assist interested parties to harness the
vast amounts of
information accessible through pay-for-services or freely available such as
via the Internet.
[0007] Many financial services providers use "news analysis" or "news
analytics,"
which refer to a broad field encompassing and related to information
retrieval, machine
learning, statistical learning theory, network theory, and collaborative
filtering, to provide
enhanced services to subscribers and customers. News analytics includes the
set of
techniques, formulas, and statistics and related tools and metrics used to
digest, summarize,
classify and otherwise analyze sources of information, often public "news"
information. An
exemplary use of news analytics is a system that digests, i.e., reads and
classifies, financial
information to determine market impact related to such information while
normalizing the
data for other effects. News analysis refers to measuring and analyzing
various qualitative
and quantitative attributes of textual news stories, such as that appear in
formal text-based
articles and in less formal delivery such as blogs and other online vehicles.
More particularly,
the present invention concerns analysis in the context of electronic content.
Expressing, or
representing, news stories as "numbers" or other data points enables systems
to transform
traditional information expressions into more readily analyzable mathematical
and statistical
expressions and further into useful data structures and other work product.
News analysis
3
CA 02987838 2017-11-30
WO 2017/017533
PCT/1B2016/001374
techniques and metrics may be used in the context of finance and more
particularly in the
context of investment performance ¨ past and predictive.
[0008] News analytics systems may be used to identify, measure and
predict:
operational risk management, volatility of earnings, stock valuation, markets;
reversals of
news impact; the relation of news and message-board information; the relevance
of risk-
related words in annual reports for predicting negative or positive returns;
and the impact of
news stories on stock returns. News analytics often views information at three
levels or
layers: text, content, and context. Many efforts focus on the first layer -
text, i.e., text-based
engines/applications process the raw text components of news, i.e., words,
phrases, document
titles, etc. Text may be converted or leveraged into additional information
and irrelevant text
may be discarded, thereby condensing it into information with higher
relevance/usefulness.
The second layer, content, represents the enrichment of text with higher
meaning and
significance embossed with, e.g., quality and veracity characteristics capable
of being further
exploited by analytics. Text may be divided into "fact" or "opinion"
expressions. The third
layer of news analytics ¨ context, refers to connectedness or relatedness
between information
items. Context may also refer to the network relationships of news.
[0009] Any number of events and potential events can have a
significant effect on
company operations and stock price behavior. A recent example of an event
affecting
valuation and behavior is the explosion, and resulting oil spill disaster, of
an offshore drilling
platform in the Gulf of Mexico off the Louisiana coast. This event greatly
affected the
operations, risk management, and financial performance of several entities,
including
publicly traded British Petroleum ("BP"). The news of the disaster had the
immediate effect
of causing BP common stock to decline sharply on the day of the disaster and
days following
but in addition there was a range of potential risks that could result
following the accident. In
addition to quantifiable financial losses associated with asset damage, oil
clean-up costs,
claims filed by those adversely affected by the spill, BP suffered from the
resulting political
and social fallout. The Exxon Valdez oil tanker grounding and spill is another
example.
Events like these can result in legal exposure for entities related to the
event and may have an
associated cost of compliance for managing the event and its effects.
[0010] What is needed is a system capable of automatically processing or
"reading"
news stories, filings, and other content available to it and quickly
interpreting the content to
identify risks and to arrive at a higher understanding of assessing risks
associated with an
entity (company, person, industry, sector), beyond singular, scalar numeric
and aggregate
4
CA 02987838 2017-11-30
WO 2017/017533
PCT/1B2016/001374
representations of risk. Presently, there exists a need to utilize and
leverage media and other
sources of entity information and a need for advanced analytics relevant to
corporate
performance, price behavior, investing, and reputational awareness to provide
a risk-based
solution. Given the vast amount of news, legal, regulatory and other entity-
related
information based on text, content and context, investors and those involved
in financial
services have a persistent need and desire for an understanding of how such
vast amounts of
information, even processed information, relates to actionable intelligence to
foresee, plan,
mitigate resource loss, and insure against risk including the likely movement
of a company's
stock price.
SUMMARY OF THE INVENTION
[0011] This invention is in the area of risk management. More
specifically, this
invention is in the area of information and decision support systems for
general computer-
supported risk identification and application to supply chain risk. The
present invention can
extract a risk register for a company or a set of companies from a news
archive such as
Reuters news. It is substantially superior to the state of the art (human
keyword searching) by
eliminating false positives due to polysemy and contextual meaning. For
example:
1. I feel fine, said Bill Gates at Microsoft;
2. Microsoft are facing a fine, said Bill Gates; and
3. (MICROSOFT IS -EXPO SED - T 0 FINE),
can be determined by the system of the present invention in an improved and
more effective
manner. More specifically, the system of the present invention can determine
that the
company, Microsoft, is exposed to a fine in the second example and that this
is a risk, while
determining the first example is not a risk for the company Microsoft and is
only an
expression of Bill Gates current mood. The invention also comprises a method
to propagate
company risks along a connected graph of supplier relationships and a
graphical user
interface to provide a user with visualizations related to identified risks.
[0012] The present invention provides a solution to multiple
scenarios and business
use cases. There are three main advantages for identifying risks associated
with an entity.
First, the present invention forms part of a 3rd party risk monitoring system
wherein the
system monitors and processes millions of sources, including media,
regulatory, and
enforcement sources and provides a risk score/index to an end user. The
present invention
5
CA 02987838 2017-11-30
WO 2017/017533
PCT/1B2016/001374
assists in risk taxonomy classification and validation. It furthermore
provides valuable input
into determination of a risk score due to confidence level established between
the risk type
and the entity extracted through the process of the present invention. The
present invention
also enables an anti-slavery open platform which processes content from
industry NGOs in
structured and unstructured content by applying the same logic as stated above
where the
present invention will define and validate the potential risk classification
and enable the
processing of millions of documents in a meaningful way contributing to
enriched content
distribution. The present invention also frees up significant research
capacity by deploying
the ability to process millions of inbound alerts to validate the confidence
in an alert to be
researched and curated onto a database. This benefit can realize significant
capacity gains
calculated in terms of analyst and/or researcher hours.
[0013] The present invention comprises a system and method that can
extract risk
registers for companies from news archives automatically, compute and
determine supply
chain risk and generate a graph of supply chain relationships, and also apply
the risk register
generation to social media and other sources. The present invention also
provides a user
interface to provide a user with visualizations related to identified risks
and generated risk
registers.
[0014] Current systems and methods for risk identification typically
involve human
labour: analysts manually read news articles and populate spreadsheets, run
Google searches
and write down the results or use copy & paste. Additionally, keyword-based
alerts may be
used, but lead to information overflow of irrelevant documents (false positive
problem),
because a keyword search engine does not understand the content, and the
keyword's context
is ignored.
[0015] The present invention eliminates a major percentage of false
positives over a
keyword search based method. The present invention enables the processing of
millions of
articles in a completely automated manner with no manual effort required and
solves the
problem of lack of coverage of existing risk registers. Existing registers are
also often stale,
whereas the present invention automatically updates the registers in near real
time. Moreover,
an automated method also provides better scal ability and higher consistency
(same input ->
same output, unlike humans). The present invention may also incorporate data
from
additional social media sources, for example Weibo, a Chinese microblogging
site akin to
twitter with over 600 million users as of 2013. This would enable significant
gains to be
made in performance by increasing the coverage of side effect data.
6
CA 02987838 2017-11-30
WO 2017/017533
PCT/1B2016/001374
[0016] The present invention provides different benefits based on
the environment in
which it is implemented. The benefit will be different for each of the use
cases. For example,
in extracting risk registers the present invention may be part of a more
complete risk scoring
process and could provide a more complete and effective system, the slavery
open platform
will provide an enriched content products offering that will improve the value
of the open
platform. The present invention may also provide for the reduction in research
manual effort
to process inbound alerts which would result in a cost avoidance strategy.
[0017] The present invention may be incorporated into an Enterprise
Content
Platform (ECP) that combines risk mining and supply chain graph information in
a single
database. This will provide supply chain risk mined from textual sources, and
may include
the results of risk mining using an SVP. The present invention may also be
used as a
component for event extraction application for detecting supply chain
disruptions (e.g.
Floods, explosions). The present invention may also be used in risk mining to
automatically
identify risks relating to suppliers in a supply chain.
[0018] There are known services providing preprocessing of data, entity
extraction,
entity linking, indexing of data, and for indexing ontologies that may be used
in delivery of
peer identification services. For example U.S. Pat. No. 7,333,966, entitled
SYSTEMS,
METHODS, AND SOFTWARE FOR HYPERLINKING NAMES, U.S. Pat. Pub.
2009/0198678, entitled SYSTEMS, METHODS, AND SOFTWARE FOR ENTITY
RELATIONSHIP RESOLUTION, U.S. Pat. App. No. 12/553,013, entitled SYSTEMS,
METHODS, AND SOFTWARE FOR QUESTION-BASED SENTIMENT ANALYSIS
AND SUMMARIZATION, filed September 02, 2009õ U.S. Pat. Pub. 2009/0327115,
entitled FINANCIAL EVENT AND RELATIONSHIP EXTRACTION, and U.S. Pat. Pub.
2009/0222395, entitled ENTITY, EVENT, AND RELATIONSHIP EXTRACTION, describe
systems, methods and software for the preprocessing of data, entity
extraction, entity linking,
indexing of data, and for indexing ontologies in addition to linguistic and
other techniques for
mining or extracting information from documents and sources.
[0019] Systems and methods also exist for identifying and ranking
documents
including U.S. Pat. Pub. 2011/0191310 (Liao et al.) entitled METHOD AND SYSTEM
FOR
RANKING INTELLECTUAL PROPERTY DOCUMENTS USING CLAIM ANALYSIS.
Additionally, systems and methods exist for identifying entity peers including
U.S. Pat. App.
No. 14/926,591, (Olof-Ors et al.) entitled DIGITAL COMMUNICATIONS INTERFACE
AND GRAPHICAL USER INTERFACE, filed October 29, 2015.
7
CA 02987838 2017-11-30
WO 2017/017533
PCT/1B2016/001374
[0020] Additionally, systems and methods for identifying risks and
developing risk
profiles include U.S. Pat. App. Ser. No. 13/337,662, entitled METHODS AND
SYSTEMS
FOR GENERATING COMPOSITE INDEX USING SOCIAL MEDIA SOURCED DATA
AND SENTIMENT ANALYSIS, filed December 27, 2011, published as U.S.
2012/0296845;
U.S. Pat. App. Ser. No. 13/337,703, entitled METHODS AND SYSTEMS FOR
GENERATING CORPORATE GREEN SCORE USING SOCIAL MEDIA SOURCED
DATA AND SENTIMENT ANALYSIS, filed December 27, 2011, published as U.S.
2012/0316916; U.S. Pat. App. Ser. No. 13/423,127, entitled METHODS AND SYSTEMS
FOR RISK MINING AND FOR GENERATING ENTITY RISK PROFILES, filed March
16, 2012, published as U.S. 2012/0221485; U.S. Pat. App. Ser. No. 13/423,134,
entitled
METHODS AND SYSTEMS FOR RISK MINING AND FOR GENERATING ENTITY
RISK PROFILES AND FOR PREDICTING BEHAVIOR OF SECURITY, filed March 16,
2012, published as U.S. 2012/0221486; and U.S. Pat. App. Ser. No. 12/628,426,
entitled
METHOD AND APPARATUS FOR RISK MINING, filed December 1, 2009, published as
U.S. 2011/0131076.
[0021] The following disclosures of technology and systems with which
the present
invention may be integrated and/or used in conjunction with: U.S. Pat.
Application Ser. No.
11/799,768, entitled METHOD AND SYSTEM FOR DISAMBIGUATING
INFORMATIONAL OBJECTS issued as Pat. No. 7,953,724; U.S. Pat. Application Ser.
No.
10/171,170, entitled SYSTEMS, METHODS, AND SOFTWARE FOR HYPERLINKING
NAMES, issued as Pat. No. 7,333,966; U.S. Pat. Application Ser. No.
11/028,464, entitled
SYSTEMS, METHODS, INTERFACES AND SOFTWARE FOR AUTOMATED
COLLECTION AND INTEGRATION OF ENTITY DATA INTO ONLINE DATABASES
AND PROFESSIONAL DIRECTORIES, issued as Pat. No. 7,571,174; U.S. Pat.
Application
Ser. No. 12/341,913, entitled SYSTEMS, METHODS, AND SOFTWARE FOR ENTITY
RELATIONSHIP RESOLUTION; U.S. Pat. Application Ser. No. 12/341,926, entitled
SYSTEMS, METHODS, AND SOFTWARE FOR ENTITY EXTRACTION AND
RESOLUTION COUPLED WITH EVENT AND RELATIONSHIP EXTRACTION; U.S.
Pat. Application Ser. No. 12/658,165, entitled METHOD AND SYSTEM FOR RANKING
INTELLECTUAL PROPERTY DOCUMENTS USING CLAIM ANALYSIS issued as Pat.
No. 9,110,971; U.S. Pat. Application Ser. No. 14/789,857, entitled METHOD AND
SYSTEM FOR RELATIONSHIP MANAGEMENT AND INTELLIGENT AGENT; U.S.
Pat. Application Ser. No. 13/594,864, entitled METHODS AND SYSTEMS FOR
8
CA 02987838 2017-11-30
WO 2017/017533
PCT/1B2016/001374
MANAGING SUPPLY CHAIN PROCESSES AND INTELLIGENCE; U.S. Pat. Application
Ser. No. 13/914,393, entitled METHODS AND SYSTEMS FOR BUSINESS
DEVELOPMENT AND LICENSING AND COMPETITIVE INTELLIGENCE; and U.S.
Pat. Application Ser. No. 14/726,561, entitled METHOD AND SYSTEM FOR PEER
DETECTION.
[0022]
In a first embodiment the present invention provides a computer-based system
for generating a risk register relating to a named entity comprising: a
computing device
having a processor in electrical communication with a memory, the memory
adapted to store
data and instructions for executing by the processor; a risk database
accessible by the
computing device and having stored therein a set of risk types based on an
induced taxonomy
of risk types previously derived at least in part upon operation of a machine
learning module;
an input adapted to receive a set of source data, the set of source data being
in electronic form
and representing textual content comprising potential risk phrases; a
entity/company-risk
relation classifier adapted to identify and extract company-risk relations
from the set of
source data, the company-risk relation classifier comprising: a risk tagger
adapted to identify
in the set of source data a set of risk candidates (ri) based on the set of
risk types; and a entity
or company tagger adapted to identify mentions of entity names (ci) in the set
of source data;
wherein the entity-risk relation classifier maps the identified set of risk
types to the identified
company names to generate a set of tuples [ENTITYc;RISK,1; and a risk register
aggregator
adapted to generate a first risk register based on the set of tuples
associated with a first entity.
[0023]
The system may further comprise wherein the identified names are stored in a
entity or company index and the first risk register is associated with
ENTITYci, defined as
the set of all risks 1...r...1R1 where the entity or company index (c) is the
same. The set of
source data received may comprise one or more of: an indexed search; a news
archive; a
news feed; structured data sets; unstructured data sets; social media content;
regulatory
filings. The entity/company-risk relation classifier may map the set of risk
types to the
company names (ci) in the set of source data to generate the set of tuples,
the results
comprising candidate risk exposure relationship tuples. The entity/company-
risk relation
classifier may further be adapted to filter the set of tuples to eliminate
false positive tuples.
The system may further comprise an output adapted to generate and transmit a
risk alert in
response to an update to the first risk register. The entity/company-risk
relation classifier may
be adapted to map the set of risk types to a plurality of entity or company
names (c1... c) to
generate a plurality of sets of tuples
tn) for each of the entity or company names and the
9
CA 02987838 2017-11-30
WO 2017/017533
PCT/1B2016/001374
risk register aggregator is further adapted to generate a plurality of risk
registers (rri...rrn)
respectively associated with company names (c1... c) and sets of tuples
tn). The input
may further be adapted to receive a search query and to execute a risk search
on the plurality
of risk registers (rri...rrn). The system may further comprise: a risk
register database adapted
to store the plurality of risk registers (rri...rrn); and a search engine
adapted to receive and
execute a search query on the plurality of risk registers (rri...rrn). The
system may further
comprise a user interface module adapted to generate for display a risk
visualization interface
representing aspects of the risk register. The company-risk relation
classifier may be adapted
to identify and extract company-risk relation mentions by using a set of
purpose-defined
features for risk sentence classification implemented as a Support Vector
Machine (SVM).
The Support Vector Machine (SVM) may be trained and wherein the set of purpose-
defined
features is derived from a corpus of text to inform classification based on a
machine learning
process. The set of purpose-defined features may include a tree kernel. The
company-risk
relation classifier may further comprise: a supply chain risk tagger adapted
to identify supply
chain relationships between one or more companies identified by the entity or
company
tagger and to identify in the set of source data a set of supply risk
candidates (sri) based on a
set of supply risk types associated with supply chain risks; wherein the first
risk register
comprises a tuple representing a supply risk type. The system may further
comprise a user
interface module adapted to generate for display a risk visualization
interface representing a
supply risk type of the first risk register. The system may further comprise a
risk presentation
module adapted to automatically generate a representation of risk for
inclusion in a user-
defined document. The user-defined document may be one of: an SEC filing; a
regulatory
filing; a power point presentation; a SWOT diagram; a supply-chain cluster
diagram; editable
text document. The entity may be selected from one of the group consisting of:
a company;
and a person and the expressions may be structured to conform to the
particular
implementation.
[0024]
In a second embodiment the present invention provides a method for
generating a risk register relating to a named entity comprising: receiving
input from an
indexed search and a news archive; creating from the input a risk taxonomy
with risk types
by a machine learning module; mapping the risk types to the named entity
identified in the
news archive, the results comprising candidate risk exposure relationship
tuples; filtering the
mapping results to eliminate false positive tuples; and generating in response
to the identified
tuples the risk register.
CA 02987838 2017-11-30
WO 2017/017533
PCT/1B2016/001374
[0025] The method may further comprise generating a risk alert in
response to an
update to the risk register. The method may further comprise performing a risk
search on the
risk register. The method may further comprise displaying a risk visualization
by representing
aspects of the risk register.
BRIEF DESCRIPTION OF THE DRAWINGS
[0026] In order to facilitate a full understanding of the present
invention, reference is
now made to the accompanying drawings, in which like elements are referenced
with like
numerals. These drawings should not be construed as limiting the present
invention, but are
intended to be exemplary and for reference.
[0027] Figure 1 is an exemplary risk identification and generation
systems that
employ risk mining techniques for use in implementing the present invention;
[0028] Figure 2 is a graphical user interface representing
visualizations related to
supply chain risk;
[0029] Figure 3 is a flowchart of a process for transitively
identifying risk;
[0030] Figure 4 is a flowchart representing the functional blocks of
a system for
generating a risk register in accordance with the present invention;
[0031] Figure 5 is an exemplary table of feature vectors for use in
accordance with
the present invention;
[0032] Figure 6 is a flowchart representing the functional blocks a
system for
generating a risk register in accordance with the present invention;
[0033] Figure 7 is a flowchart representing the process of generating
a risk register in
accordance with the present invention;
[0034] Figure 8 is a simple risk register and an extended risk register in
accordance
with the present invention;
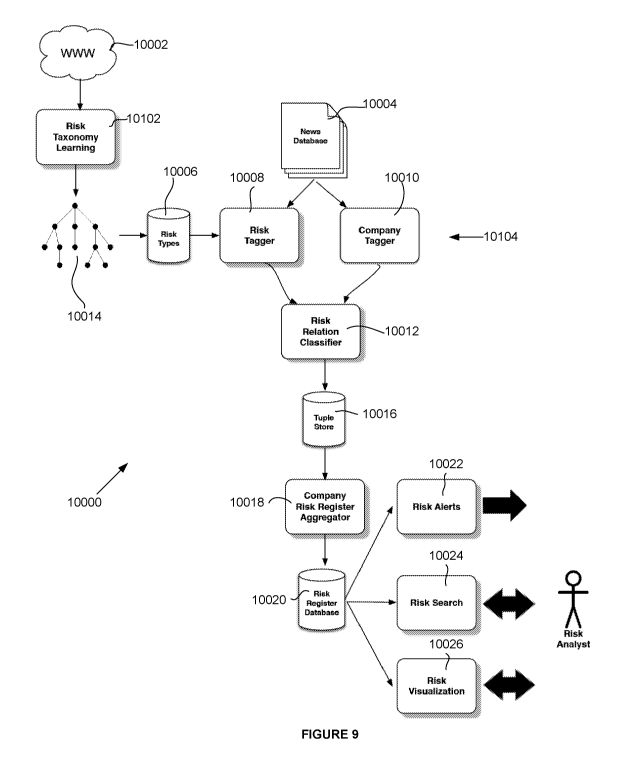
[0035] Figure 9 is a flowchart representing the process and
functional components for
generating a risk register and outputs based on the risk register in
accordance with the present
invention;
11
CA 02987838 2017-11-30
WO 2017/017533
PCT/1B2016/001374
[0036] Figure 10 is a set of qualitative risk types and a set of
quantitative risk types
associated with use in accordance with the present invention;
[0037] Figure 11 is a risk management plan related to the set of
risks in Figure 10 in
accordance with the present invention;
[0038] Figures 12 and 13 are flowcharts representing supply chain risk in
one manner
in accordance with the present invention;
[0039] Figure 14 is a chart representing a risk portfolio;
[0040] Figure 15 is a risk spiral diagram representing a negative
risk path;
[0041] Figures 16-24 are a series of user interface screens and
elements generated
based on identified risks and generated risk registers in accordance with the
present
invention;
[0042] Figures 25 and 26 are exemplary taxonomies in accordance with
the present
invention;
[0043] Figures 27 and 28 are a risk dashboard and user interface in
accordance with
the present invention; and
[0044] Figure 29 is an exemplary SWOT visualization generated based
on a risk
register.
DETAILED DESCRIPTION OF THE INVENTION
[0045] The present invention will now be described in more detail with
reference to
exemplary embodiments as shown in the accompanying drawings. While the present
invention is described herein with reference to the exemplary embodiments, it
should be
understood that the present invention is not limited to such exemplary
embodiments. Those
possessing ordinary skill in the art and having access to the teachings herein
will recognize
additional implementations, modifications, and embodiments, as well as other
applications
for use of the invention, which are fully contemplated herein as within the
scope of the
present invention as disclosed and claimed herein, and with respect to which
the present
invention could be of significant utility.
[0046] A risk is a potential future event or situation that has
adversarial implications;
it is the possibility of something bad happening in the future. A bad event is
when something
that once was just a risk¨whether it was recognized before or not¨has
materialized, i.e. it
12
CA 02987838 2017-11-30
WO 2017/017533
PCT/1B2016/001374
has actually happened. According to this terminology, a risk already
incorporates a potential
modality, and therefore it makes no sense to speak of a potential risk, as
that is already
implied in the risk term. Events can unfold, i.e. they can change their
spatiotemporal scope,
which may include other, dependent risks materializing in the process.
[0047] Risk permeates all aspects of doing business. However, to date,
support tools
for helping to systematically identify the whole spectrum of risks that a
company is exposed
to are lacking. The system of the present invention addresses these problems
and is able to
construct lists of risks a company faces, to be used in a qualitative
assessment of risk.
Existing risk management systems fail to incorporate a system or method for
systematic,
repeatable risk identification. The computer-supported risk identification
process of the
present invention comprises a more holistic risk management approach that
leads to more
consistent (i.e., objective, repeatable) risk analysis.
[0048] All activities of business are exposed to a broad diversity of
risks: a
company's business partners can engage in a lawsuit, a supplier can fail to
deliver the volume
or quality of the goods expected, the company location's environment can
become prone to
natural disasters like earthquakes, volcanoes, or human-made disasters like
political
instability. Additionally, the market appetite for a company's products may
change, or
technology disruptions may make the products superfluous altogether. Finally,
the business
can mismanage its customer relationships or its finances and go bankrupt. A
"black swan" is
a commonly used metaphor for an event that is so rare that humans might either
deem it
impossible, or might not be aware of it, yet one that could have tremendous
impact if it were
ever to materialize, and recent financial crises (e.g. 2008) and recent surge
in regulatory fines
(since 2014) have shown the global company ecosystem's fragility, further
supporting the
need for tool support. Black swans are discussed in at least N. Taleb, The
Black Swan: The
Impact of the Highly Improbable, Random House, 2007; Mandelbrot and N. N.
Taleb, How
The Finance Gurus Get Risk All Wrong, Fortune, n.a.(11):99-100, 2005; and
Lorey, F.
Naumann et al., Black Swan: Augmenting Statistics With Event Data, In
Proceedings of
CIKM 2011, Glasgow, United Kingdom, October 24-28, 2011, pages 2517-2520, ACM,
2011, ISBN 978-1-4503-0717-8.
[0049] Pursuing any kind of business activity is inseparably interwoven
with being
exposed to different kinds of risk: Is the customer I am dealing with liquid
and honest, i.e.
can I rely on being paid? Are my vendors delivering my supplies punctually,
and to the
quality I need? Am I in compliance with all applicable laws and regulations
(commercial law,
13
CA 02987838 2017-11-30
WO 2017/017533
PCT/1B2016/001374
health & safety, financial reporting, tax, human resources etc.)? Are my
products and services
still relevant, or is demand shrinking or are markets disrupted by new
inventions or
commoditization of technologies? Are my competitors outperforming my product
or
undercutting my pricing? Does my business have the right staff in terms of
skills? Am I
setting the right priorities? Is the cash flow positive and are the profit
margins acceptable?
Am I exposed to currency exchange risk because many of my customers are in
different
currency zones? Are my offices in countries that are politically stable as
well as free from
natural disasters so that they can carry out their business activities in an
undisturbed way?
The task of finding the comprehensive set of risks faced by an entity¨ its
risk register¨is
known as Risk identification. These risks and risk identification are
discussed in at least U.
Beck. Risk Society: Towards a New Modernity. Sage, Beverly Hills, CA, 1992;
John Adams.
Risk. Routledge, 1995; Peter L. Bernstein. Against the Gods: The Remarkable
Story of Risk.
Wiley, 1998; and Gerd Gigerenzer. Risik Savvy: How to Make Good Decisions.
Penguin,
New York, NY, USA, 2013.
[0050] The present invention computes a company's risk register as a
relationship
extraction task: given a company named entity mention and a mention of a risk
type, the
present invention classifies whether there is evidence to suggest that such a
tentative pair
indeed can be classified as a company risk relation instance. The present
invention extracts
company-risk pairs from news stories. Known methods for risk identification do
not generate
a company risk profile to capture a company's qualitative risk exposure.
Existing systems
and methods present "quantitative" studies intended to be used to exploit risk
for trading
rather than risk management. Similar methods are discussed in Kogan, D. Levin,
B. R.
Routledge, J. S. Sagi, and N. A. Smith, Predicting Risk From Financial Reports
With
Regression, In Proceedings of HLT-NAACL, 2009; De Saeger, K. Torisawa, and J.
Kazama,
Looking For Trouble, In Proceedings of the 22nd International Conference on
Computational
Linguistics (COLING 2008), pages 185-192, Morristown, NJ, USA, 2008, ACL. ISBN
978-
1-905593-44-6; and D. Saeger, K. Torisawa, J. Kazama, K. Kuroda, and M.
Murata, Large
Scale Relation Acquisition Using Class Dependent Patterns, volume 0, pages 764-
769, Los
Alamitos, CA, USA, 2009, IEEE Computer Society,
doi:
http ://doi .ieeecomputersociety. org/10, 1109/ICDM.2009.140.
[0051] The present invention provides the capability of automatic
reasoning with
respect to a supply chain. Improving upon known systems and methods, e.g. see
patent
publications identified in Background section above, the system computes a
risk register,
14
CA 02987838 2017-11-30
WO 2017/017533
PCT/1B2016/001374
mines and/or generates a supply chain graph. The inventive system determines,
e.g., logically
inferred (i.e., reasoned), a set of risks based on a company's dependency on a
set of suppliers
(layer 1) who in turn depend on a set of other suppliers (layer 2), and so on.
One problem in
building decision support systems is the lack of complete coverage in the data
expressing the
dependencies; in other words, the supply chain graph is not complete. For
example, Intel has
two suppliers of a given part and believes it has reduced its risk by having
multiple suppliers.
However, and unknown to Intel, its two suppliers of the part both depend on
supply of silicon
product from the same source. In this instance, if anything happens to the
source supplier
then both of Intel's suppliers present the risk of non-supply of the part to
Intel. The present
invention fills gaps in the supply chain data by applying logical inference
tools to the existing
knowledge to create new knowledge, thus filling the gaps. The system of the
present
invention creates better coverage of decision support systems to help
procurement specialists
and risk analysts capture a complete picture of the risks an entity faces,
specifically supply
chain risks.
[0052] Furthermore, if evidence for a risk to one entity being an
opportunity for
another entity is determined, then it could be inferred that the entities are
competitors. For
example, the following formula could be used:
competitor0f(X, Y) positiveRiskFor(X), negativeRiskFor(Y).
[0053] Additionally, the inverse could be performed: if it is known
or determined that
two companies or entities are competitors, an inference can be made for each
negative risk
found that an opportunity for the entity's competitors exists. Additional
refinements may
need to be made based on the initial inferences or reasonings as parts of
companies may
compete with parts of other companies. Additionally, other factors such as the
effect size and
exposures to and involvements in sub-areas may be included in the model to
increase the
model's accuracy.
[0054] In PROLOG, here are inference rules that model a fragment of
such a logics:
risk(X) : - positiveRiskFor(X); negativeRiskFor(X);
competitor0f(X, Y) competitor0f(Y, X);
comp etitor0f(X, Y) : - positiveRiskFor(X), negativeRiskFor(Y);
positiveRiskFor(X) : - negativeRisk(competitor0f(X));
negativeRiskFor(X) : - positiveRisk(competitor0f(X));
CA 02987838 2017-11-30
WO 2017/017533
PCT/1B2016/001374
competitor0f(X, Z) competitor0f(X, Y), competitor0f(Y, Z);
supplier0f(X, Z) supplier0f(X, Y), supplier0f(Y, Z);
negativeRiskFor(Y) : - supplier0f(X, Y), negativeRiskFor(X);
positiveRiskFor(Y) supplier0f(X, Y), positiveRiskFor(X).
[0055] For example,
"competitor0f(X, Z) competitor0f(X, Y), competitor0f(Y,
Z)" is read as "if there are three competitors X, Y, and Z, and X is a
competitor for Y, and Y
is a competitor of Z; then it is true that X is also a competitor of Z". This
is applying the
mathematical law of transitivity to companies. The model also assumes that
risks of suppliers
become the risks of the supplied companies by implications and so on. The
above logic also
models that risks to one company may be opportunities to its competitors
assuming the
competition has been previously identified or may be identified. The model may
also include
weighting to one or more of the variables to address problems such as semantic
drift, and to
avoid false reasonings, improper assumptions, or probabilistic version.
[0056] Risk identification is the first step in any comprehensive
risk management
cycle, and to date it has been carried out for many reasons, including the
following: the
management of a business genuinely wants to learn about the risks that the
business may
suffer from, as part of business planning, project management or strategic
planning activities,
or just for day-to-day operational use; the business may be obliged to report
risks to a
regulator, for example in the case of U.S. public companies the Form 10-K
filing must be
annually submitted to the Securities and Exchange Commission (SEC), and it
includes a
section ("ITEM 7A. Quantitative and Qualitative Disclosures About Market
Risk") on risks;
before an acquisition or Initial Public Offering (IPO) material risks have to
be formally
disclosed to potential acquiring entities and potential
investors/shareholders; a person looking
for a job may want to learn about the risks of a potential employer before
submitting a formal
application to it, to ascertain the economic viability of the company and its
the adherence to
his or her ethical standards (or the other way round); a bank may carry out a
comprehensive
risk analysis in order to establish whether or not to extend the credit line
for a company that is
one of their clients; or an investment manager may hold a portfolio of
companies he or she
has invested in, and may therefore want to ensure that the investment
portfolio is risk-
balanced.
[0057] The less overlap there is in the kind of risks that a
portfolio is exposed to, the
better.
16
CA 02987838 2017-11-30
WO 2017/017533
PCT/1B2016/001374
[0058] Known methods for risk management do not comprise automated
tool support
for the risk identification phase of the risk management process:
traditionally, people have
drawn up lists or spreadsheets of business risks from scratch by convening
informal meetings,
typically starting out with a blank sheet. The insufficiency of risk
identification has been
pointed out before, notably in the context of SEC filings, where risks are
often obtained from
competitors' lists via copy and paste. This has a number of disadvantages.
First, it is unlikely
that a list created from scratch in one session is comprehensive. Second, the
approach of
making up the risk register in a meeting without looking at any data means the
risk register
will not be complete and very likely, the risks identified thus will only be
the more obvious
cases.
[0059] The present invention comprises a system that provides a
computer-supported
risk identification process. The computer-supported risk identification system
accomplishes
this by supporting humans with automation help in eliciting evidence for risk
exposure from
archives and feeds of trusted prose text, such as news, earnings call
transcripts or brokerage
documents.
[0060] In one implementation, with reference to Figure 1, the present
invention
provides a Risk Register Generation System (RRGS or "RRG system") 1000 in the
form of a
news/media and other content analytics system for information extraction and
is adapted to
automatically process and "read" news stories and content from news,
governmental filings,
blogs, and other credible media sources, represented by news/media corpus
1100. Server
1200 is in electrical communication with corpus 1100, e.g., over one or more
or a
combination of Internet, Ethernet, fiber optic or other suitable communication
means. Server
1200 includes a processor module 1210, a memory module 1220, which comprises a
subscriber database 1230, a linguistic analyzer 1240, RRG module 1250, a user-
interface
module 1260, a training/learning module 1270 and a classifier module 1280.
Processor
module 1210 includes one or more local or distributed processors, controllers,
or virtual
machines. Memory module 1220, which takes the exemplary form of one or more
electronic,
magnetic, or optical data-storage devices, stores machine readable and/or
executable
instruction sets for wholly or partly defining software and related user
interfaces for
execution of the processor 1210 of the various data and modules 1230-1280.
[0061] Quantitative analysis, techniques or mathematics, such as
linguistic analyzer
module 1240 and RRG generation module 1250, which may also include predictive
behavior
determination capabilities, in conjunction with computer science methods
discussed
17
CA 02987838 2017-11-30
WO 2017/017533
PCT/1B2016/001374
hereinbelow, are processed by processor 1210 of server 1200 to arrive at RRGs.
The RRGS
1000 automatically accesses and processes news stories, filings, and other
content and applies
one or more computational linguistic techniques and resulting risk taxonomy
against such
content. The RRGS identifies risks and entities and associates risks with
particular entities
and scores the identified risks to generate a risk register data structure.
The RRGS 1000
leverages traditional and new media resources to provide a risk-based solution
that expands
the scope of conventional tools to provide an enhanced analysis data structure
for use by
financial analysts, investment managers, risk managers and others.
[0062] The RRGS 1000 may receive as input via news media source 1141,
blogs
1142, and governmental or regulatory filings source 1143 of news/media corpus
1100 content
from the following exemplary content sources: news websites (reuters.com,
Thomson
Financial, etc); websites of governmental agencies (epa.gov); third party
syndicated news
(e.g. Newsroom); websites of academic institutes, political parties
(mcgill.ca/mse,
www.democrats.org etc); online magazine websites (emagazine.com/); blogging
websites
(Blogger, ExpressionEngine, LiveJournal, Open Diary, TypePad, Vox, WordPress,
Xanga
etc); social and professional networking sites; and information aggregators
(Netvibes,
Evri/Twine, etc). The invention may optionally employ other technologies, such
as
translators, character recognition, and voice recognition, to convert content
received in one
form into another form for processing by the RRGS. In this manner, the system
may expand
the scope of available content sources for use in identifying and scoring
risks.
[0063] The RRGS 1000 of Figure 1 includes RRG generating module 1250
adapted to
process news/media information received as input via news/media corpus 1100
and to
generate one or more risk registers associated with one or more entities or
companies. The
RRGS 1000 may include a training or learning module 1270 that analyzes past or
archived
news/media, and may include use of a known training set of data. In this
manner the RRGS
may be adapted to build one or more risk registers.
[0064] In one exemplary implementation, the RRGS 1000 may be operated
by a
traditional financial services company, e.g., Thomson Reuters, wherein corpus
1100 includes
internal databases or sources of content 1120, e.g., TR News and TR Feeds,
Newsroom,
reuters.com, etc. For example, Thomson Reuters sources as the internal
database may include
legal sources (Westlaw), regulatory (SEC in particular, controversy data,
sector specific,
Etc.), social media (application of special meta-data to make it useful), and
news (Thomson
Reuters News) and news-like sources, including financial news and reporting.
In addition,
18
CA 02987838 2017-11-30
WO 2017/017533
PCT/1B2016/001374
corpus 1100 may be supplemented with external sources 1140, freely available
or
subscription-based, as additional data points considered by the RRGS and/or
predictive
model. Hard facts, e.g., explosion on an oil rig results in direct financial
losses (loss of
revenue, damages liability, etc.) as well as negative environmental impact and
resulting
negative greenness score, and sentiment, e.g., quantifying the effect of fear,
uncertainty,
negative reputation, etc., are considered as factors that drive green scoring
and/or composite
environmental or green index. The news/media sentiment analysis 1250 may be
used in
conjunction with linguistic analyzer 1240.
[0065] In one example of how the RRGS may be further extended to
process
additional information, upon identifying in content obtained via TR News 1121
or TR Feeds
1122, e.g., legal reporter (e.g., Westlaw), that a company "Newco" has
successfully enforced
a patent ("XYZ" patent), the RRG may be updated to include as a positive risk
"patent
success." This risk represents the potential for future successful efforts in
further enforcing
the patent against other competitors or in accounting for potential future
royalties and
revenues or increased margins. In presenting this risk to users, the "patent
success" risk may
include a link to the content from which the risk was derived.
[0066] Taking this a step further, in light of the previously
referenced internal
database-sourced mention concerning highly successful litigation by Newco in
enforcing
patent XYZ against one or more competitors, the RRG system may include
additional
capabilities to explore further risks associated with this principal risk. For
example, external
databases 1140 may include USPTO database of issued patents and the system may
identify
patent XYZ as being owned by Newco, e.g., assignment recordation database. (In
addition,
this confirms the legitimacy of the original article that claimed ownership in
the XYZ patent
by Newco) The system may recognize that patent XYZ names Employee as sole
inventor on
this and related patents. The RRGS may recognize a posting at Employee's
professional
networking site account that he is no longer an employee of Newco and further
that he is now
an employee of a competitor of Newco. Now the RRG system has two additional
risks
derived from an original risk. These risks may be reflected, respectively, in
the RRGs for
Newco and its competitor. The RRG system presents users, such as subscribers
of the RRG
service, with the RRG comprising the known risks for a particular entity.
[0067] In addition, the RRGS 1000 may include a classification module
1280 adapted
to generate a classification system of entity risks that serves as a
classification system for use
in risk-based investing and that may be used to create a composite risk index.
For example,
19
CA 02987838 2017-11-30
WO 2017/017533
PCT/1B2016/001374
companies presently assigned an RIC (Reuters Instrument Code), a ticker-like
code used to
identify financial instruments and indices, may be classified as "risk
compliant" (e.g.,
achieved/maintained a risk score or profile of a certain level and/or
duration). In this manner
the invention may be used to create a class of risk-RICs for trading purposes.
For example, a
"Risk Index" may be generated and maintained comprised, for instance, of
companies that
have attained a risk certification or risk-RIC or the like. A risk index may
attract investors
interested in low risk companies or sectors.
[0068] In one embodiment the RRGS 1000 may include a training or
machine
learning module 1270, such as Thomson Reuters' Machine Learning Capabilities
and News
Analytics, to derive insight from a broad corpus of risk related data, news,
and other content,
and may be used on providing a normalized risk score at the company (e.g.,
IBM) and index
level (e.g., S&P 500). This historical database or corpus may be separate from
or derived
from news/media corpus 1100.
[0069] In one manner, the corpus 1100 may comprise continuous feeds
and may be
updated, e.g., in near or close to real time (e.g., about 150 ms), allowing
the RRGS to
automatically analyze content, update RRGs based on "new" content in close to
real-time,
i.e., within approximately one second. However, the wider the scope of data
used in
connection with the RRGS, the longer the response time may be. To shorten the
response
time, a smaller window/volume of data/content may be considered. The RRGS may
include
the capability of generating and issuing timely intelligent alerts and may
provide a portal
allowing users, e.g., subscription-based analysts, to access not only the RRG
and related tools
and resources but also additional related and unrelated products, e.g., other
Thomson Reuters
products.
[0070] The RRGS 1000, powered by linguistics computational technology
to process
news/media data and content delivered to it, analyzes company-related
news/media mentions
to generate up-to-date risk registers. The quantitative and qualitative risk
components
provided by the RRGS 1000 may be used in market making, in portfolio
management to
improve asset allocation decisions by benchmarking portfolio risk exposure, in
fundamental
analysis to forecast stock, sector, and market outlooks, and in risk
management to better
understand abnormal risks to portfolios and to develop potential risk hedges.
[0071] Content may be received as an input to the RRGS 1000 in any of
a variety of
ways and forms and the invention is not dependent on the nature of the input.
Depending on
CA 02987838 2017-11-30
WO 2017/017533
PCT/1B2016/001374
the source of the information, the RRGS will apply various techniques to
collect information
relevant to the generation of the risk registers. For instance, if the source
is an internal source
or otherwise in a format recognized by the RRGS, then it may identify content
related to a
particular company or sector or index based on identifying field or marker in
the document or
in metadata associated with the document. If the source is external or
otherwise not in a
format readily understood by the RRGS, it may employ natural language
processing and
other linguistics technology to identify companies in the text and to which
statements relate.
[0072] The RRGS may be implemented in a variety of deployments and
architectures.
RRGS data can be delivered as a deployed solution at a customer or client
site, e.g., within
the context of an enterprise structure, via a web-based hosting solution(s) or
central server, or
through a dedicated service, e.g., index feeds. Figure 1 shows one embodiment
of the RRGS
as a News/Media Analytics System comprising an online information-retrieval
system
adapted to integrate with either or both of a central service provider system
or a client-
operated processing system, e.g., one or more access or client devices 1300.
In this
exemplary embodiment, RRGS 1000 includes at least one web server that can
automatically
control one or more aspects of an application on a client access device, which
may run an
application augmented with an add-on framework that integrates into a
graphical user
interface or browser control to facilitate interfacing with one or more web-
based applications.
[0073] Subscriber database 1230 includes subscriber-related data for
controlling,
administering, and managing pay-as-you-go or subscription-based access of
databases 1100.
In the exemplary embodiment, subscriber database 1230 includes one or more
user
preference (or more generally user) data structures 1231, including user
identification data
1231A, user subscription data 1231B, and user preferences 1231C and may
further include
user stored data 1231E. In the exemplary embodiment, one or more aspects of
the user data
structure relate to user customization of various search and interface
options. For example,
user ID 1231A may include user login and screen name information associated
with a user
having a subscription to the RRG/risk scoring service distributed via RRGS
100.
[0074] Access device 1300, such as a client device, may take the form
of a personal
computer, workstation, personal digital assistant, mobile telephone, or any
other device
capable of providing an effective user interface with a server or database.
Specifically, access
device 1300 includes a processor module 1310 including one or more processors
(or
processing circuits), a memory 1320, a display 1330, a keyboard 1340, and a
graphical
pointer or selector 1350. Processor module 1310 includes one or more
processors, processing
21
CA 02987838 2017-11-30
WO 2017/017533
PCT/1B2016/001374
circuits, or controllers. Memory 1320 stores code (machine-readable or
executable
instructions) for an operating system 1360, a browser 1370, and document
processing
software 1380. In the exemplary embodiment, operating system 1360 takes the
form of a
version of the Microsoft Windows operating system, and browser 1370 takes the
form of a
version of Microsoft Internet Explorer. Operating system 1360 and browser 1370
not only
receive inputs from keyboard 1340 and selector 1350, but also support
rendering of graphical
user interfaces on display 1330. Upon launching processing software an
integrated
information-retrieval graphical-user interface 1390 is defined in memory 1320
and rendered
on display 1330. Upon rendering, interface 1390 presents data in association
with one or
more interactive control features.
[0075] Generally, as shown in the flowchart 3000 in Figure 3, the
process for
identifying entity-risk relation mentions may involve identifying a first
entity from a set of
documents including supply chain data, identifying a second entity from the
set of
documents, identifying a risk associated with the second entity, and
determining if the risk
associated with the second entity affects the first entity.
[0076] Doing business involves the business entity being exposed to a
variety of
risks, and also involves and requires recognizing, avoiding, mitigating, or
insuring against
these risks as an integral part of running successful business. In the area of
supply chain
management there are suppliers (vendors) that sell goods to companies that
combine input
from multiple parties, process/recombine the input and sell the
processed/recombined input as
output to other companies, who may also be considered suppliers themselves.
This creates a
large, world-wide network of dependencies. In a world of global trade and
interconnectivity
where specialization levels are reaching unprecedented levels, risks connected
to the supply
chain are an important source of potential problems that need to be monitored.
[0077] For example, a supplier of special drilling equipment to oil
companies could
be affected by talent attrition risk. The talent attrition risk may have the
effect of placing the
company's existence at risk. If the drilling equipment is solely available
from a single
supplier, this fact should be red-flagged and the oil company should be made
aware as early
as possible to take appropriate action (e.g., sourcing from a backup supplier,
building their
own in-house backup method/work-around, insuring).
[0078] Likewise, if a car seat manufacturer is sourcing a particular
part from a
supplier whose factory was destroyed unexpectedly by an earthquake, the
manufacturer may
22
CA 02987838 2017-11-30
WO 2017/017533
PCT/1B2016/001374
break contract regarding delivering its car seats to its customer, large car
companies. Yet,
despite the importance of supply chain risk, there are no systematic tools
that can
systematically identify and alert the situations outlined above.
[0079]
Supply chains, which may also be referred to as value chains, may be
represented as a series of nodes and links, with each node representing an
activity like the
source of a material, conversion of materials into a product, intermediate
storage, and point of
sale/access to consumers. Links represent the routes and "containers" to move
materials
between nodes. Nodes and links form a company's supply chains and represent
risks. Many
firms have invested significant resources in building or implementing a risk
management
framework and supporting processes. How companies perceive and react to risks
may depend
on the nature of their business and distribution of products. ISO 31000 and
31010 provide
one exemplary approach to identifying risks but one-size-does-not-fit-all.
Finding an
approach suitable to a given company's situation is complex and requires a
flexible approach.
[0080]
The present invention uses supply chain data (i.e., WHO supplies WHAT to
WHOM) which is a prerequisite for the invention to determine supply chain
risks. Supply
chain data may be obtained using the following methods:
(1) purchase of commercial data sources from third party vendors;
(2) automated computer learning of a supply chain graph;
(3) found data: most companies have spreadsheets and procurement databases
internally available that describe their own suppliers as well as customers.
The
risks that these companies (those sourced from, as well as sold to) are
exposed
to, is usually not well modeled.
[0081]
The problem of identifying risks in the supply chain can be addressed by
using
a form of the transitive property or rule, for example: if a supplier of a
supplier of company A
has a problem, it infers that company A, too, transitively has a problem. This
is true with a
higher risk impact severity if there is no alternative supplier. Risk
propagation rules can be
used to propagate the known risks along the supply chain graph: for example, a
"reputation
risk" of Foxconn, a supplier of manufacturing labor services to Apple Inc,
resulting from
serial suicides of workers employed at Foxconn's factories because of inhumane
working
conditions, is a potential reputation risk also for Apple Inc., as the media
may report on their
business connection and its ethical implication. So clearly reputational risk
can be propagated
along supply chain graph connections as shown below.
23
CA 02987838 2017-11-30
WO 2017/017533
PCT/1B2016/001374
% supplier relationships are transitive:
supplier0f(X, Z) supplier0f(X, V), supplier0f(Y, Z).
% . . .
% risks are propagated accordingly:
supplierRisk(Y) risk(X), supplier0f(X, V).
[0082] The rules used to determine the supply chain risks can be
binary (true/false)
logical rules, or they can be implemented with a weighting system to give
appropriate
consideration to certain risk or entity types, or probabilistic version. The
rules may be
implemented using program-like structures that can be implemented in a
programming
language (notably PROLOG) as well as by electronic gates and specific hardware
modules.
The rules can be implemented by an apparatus with a Graphical User Interface
(GUI) that
displays supply chain as shown in the graphical user interface 2000 in Figure
2. The GUI
2000 may show risk registers 2002, the level of the risks in the registers
2004, and the
companies in the supply chain 2006.
[0083] The present invention uses company risk classification, which
comprises
finding all instances of company mentions and risk type mentions. It is then
determined
whether the company mentioned is exposed to the risk mentioned. Specifically,
the present
invention comprises a supervised risk classifier that extracts company-risk
relation mentions
using a set of purpose-defined features defined over sentences of text. In one
embodiment,
the extraction may be performed by a Support Vector Machine (SVM). The
relation classifier
uses input from a company named entity tagger as well as input from a weakly-
supervised
risk type taxonomy. The SVM may be trained over a set of hand-annotated news
stories from
an international news agency's news archive. The company-risk relation
extraction of the
present invention outperforms known methods of risk extraction, and the
performance of the
system is primarily driven by the tree kernel. The present invention is the
first system to
perform automated company-risk relation extraction.
[0084] To train the SVM of the present invention, sentences in which
risk phrases
were annotated were randomly sampled from the Reuters News Archive (RNA)
covering
many different S&P 500 companies. In a pre-processing step, these sentences
were tagged
with company mentions and potential risk type mentions automatically as
described below.
Two subjects were annotated in each sentence using a binary classification
scheme, where
class 0 means either a sentence does not mention a risk, or the risk mentioned
does not
24
CA 02987838 2017-11-30
WO 2017/017533
PCT/1B2016/001374
pertain to the company that the sentence is about. In the case where there is
more than one
company mentioned, the first company mentioned may be the one used as the
focus of the
risk identification.
[0085]
In order to identify company-risk relation mentions there is a first taxonomy
learning step that is executed offline, and only occasionally needs to be re-
run to keep the list
of risks (or risk universe) fresh. The taxonomy learning step generates the
universe of risk
type names, expressed as nouns or noun phrases. Second, at runtime, company
names and
risk type names are tagged in order to subsequently classify the relationship
between them
(what kind of risk, if any). In a further offline step, a weakly-supervised
learning method is
used to induce a taxonomy of risk types by applying Hearst patterns
recursively over search
engine result pages or the Web pages referenced in them. A process for
performing this type
of learning is described in at least L. Leidner and F. Schilder, Hunting For
The Black Swan:
Risk Mining From Text, In Proceedings of ACL 2010, pages 54-59, Uppsala,
Sweden, 2010,
ACL. URL http://www.aclweb.org/anthology/P10-4010. In one embodiment, the
Yahoo!
BOSS 2.0 API is used to induce a taxonomy of concept nodes.
[0086]
At runtime, the learning process is iterated over all documents to be
analyzed,
the document is broken into sentences, the sentence is tokenized at each
whitespace, and a
longest-match prefix comparison is performed between the taxonomy nodes and
the
beginning of each token of the sentence being analysis.
[0087] A named entity recognizer (e.g., OpenCalais) is applied to the input
sentence
in order to identify all mentions of company names. All possible pairs (ci,
I)) of company
names c with risk types r are generated, and a feature vector with the
features shown in
Figure 5 for each of the company names and risk types is also generated. These
feature
vectors are passed on to the training or classification step, respectively.
[0088] A binary SVM classifier is trained on the training portion of the
gold data
corpus. The SVM's objective function is whether or not a particular pair of
(COMPANY;
RISK) mentions (e.g. (BP; oil spill risk), (JP Morgan; front running)) are (1)
really used in a
company and risk sense, respectively; and (2) whether the risk mentioned is
actually about
the company mentioned. Given a set of tuples (COMPANY,; RISK) of mined company-
risk
relation instances, the risk register can be defined in the simplest form as
the list of all risks 1.
r
1R1 where the company index (c) is the same. The nature of risks is open-
ended and
changing making determination difficult. The classifier in accordance with the
present
CA 02987838 2017-11-30
WO 2017/017533
PCT/1B2016/001374
invention is versatile and flexible with COMPANY of the pair being closed and
RISK of the
pair being open ¨ risk is not "hard-wired," can expand universe of risk. Good
classification
quality depends significantly on SVM parameter tuning. In one embodiment, the
present
invention uses a Subset tree (SST) kernel with a linear vector kernel; the
trade-off parameter
C was set to 1:0. A tree kernel multiplier of 0:1 was used, and summation was
used for kernel
combination. The system uses 2,160 support vectors (from 3,000 training
examples), thus
indicating generalization has taken place.
[0089]
Machine learning is used in setting up the SVM classifier with a set of
features
taken from text to inform the classification. For example, Figure 5 represents
a chart of
features used in the Support Vector Machine including "TREE-KERNEL," which is
the most
critical feature of the feature set. The combination of all features improves
accuracy and
effectiveness as compared to individual features with the TREE-KERNEL feature
being
clearly dominant in the set.
[0090]
Figure 4 shows the learning curve when inducing classifiers with training data
sizes ranging from, for example, 500 to 3,000 data points (sentences). The
performance
stabilizes around Fl = 80%, so with the current model and parameters, the
training data is not
the limiting factor in the experimental settings.
[0091]
The entity/company-risk relation mention extraction of the present invention
can extract risk registers for any entity or company from a set of news
stories by aggregating
mentions of company-risk relations using supervised classification with a high
degree of
accuracy, and much more quickly and efficiently than with a naive lookup
tagger. Compared
to the state of the art in risk-related decision support systems, i.e. manual
gathering of risk
registers in a spreadsheet by a group of humans in a meeting, risk mining has
the following
advantages:
consistency: a computer mining risks executes in a sustained and repeatable
way, and does not suffer from fatigue as human analysts do;
resilience to signal-to-noise ratio: a computer can effortlessly deal with
large
quantities of information, and does not mind if more than 99% of it is
irrelevant, i.e. unlike any human analyst the computer does not suffer from
information overload;
impartiality: unless programmed otherwise, a computer can analyze risks
objectively and without bias;
26
CA 02987838 2017-11-30
WO 2017/017533
PCT/1B2016/001374
speed/throughput: the computer can deal with the big data challenges of
volume and velocity, i.e. it can process large quantities of text quickly and
without creating a backlog;
relevance filtering: automated risk mining provides computer-supported risk
identification in the form of human-machine symbiosis by providing a
technology that metaphorically permits the human analyst to put on "risk
glasses" that focus on the essential (risk relevant) segments of large text
collections;
accountability: because the risks are identified by a deterministic method and
supported by evidence linked from news stories, the process is repeatable and
transparent; and
supports human cognition: compared to humans trying to identify risks.
[0092]
The present invention assumes that the news stories are trustworthy. However,
a credibility scoring component may be integrated to filter out or properly
weight news
stories or other information coming from untrustworthy information sources.
The value of the
company-risk relation mention extraction system of the present invention is
bounded by the
talk about risks contained in the news archive. In a sense, it turns the
journalists into a risk
analyst crowd whose collective assessment is harvested. Companies that do not
get enough
coverage may have vastly incomplete company risk profiles. Finally, the
company-risk
relation mention extraction system of the present invention focuses on risks
expressed as
noun phrases, but the system may be adapted to identify and analyze risks
expressed using
verb phrases or otherwise.
[0093]
Risk identification is typically an early step in a sequence of activities
including Risk Management Planning, Risk Identification, Qualitative Risk
Analysis,
Quantitative Risk Analysis, Risk Response Planning and Risk Monitoring and
Control.
However, while the importance of risk identification is acknowledged,
automated tool
support for the process is not provided for in existing risk management
systems. The best
practices in project management documented by the Project Management Institute
(PMI)
suggest the risk register be generated as output by a set of tools from a set
of inputs as shown
in Figure 7. Participants in risk identification activities may include the
following: project
manager, project team members, risk management team (if assigned), customers,
subject
matter experts from outside the project team, end users, other project
managers, stakeholders,
27
CA 02987838 2017-11-30
WO 2017/017533
PCT/1B2016/001374
and risk management experts. Project documents and enterprise environmental
factors are
listed as inputs in Figure 7, and they include: Assumptions log; Other project
information
proven to be valuable in identifying risk; Published information, including
commercial
databases; Academic studies; Published checklists; Industry studies; and Risk
attitudes. These
best practices are described in at least PMI. A Guide to the Project
Management Body of
Knowledge (PMBOK Guide). The Project Management Institute Inc. (PMI), Newtown
Square, PA, USA, 5th edition, 2013.
[0094] While some of these sources of evidence may include prose or
text instances
of risks, there is no known system or method for tool support to locate them.
In known risk
management systems risk register elements can lie buried within large
collections of text such
as news archives and the computer-supported risk identification system of the
present
invention is needed to unravel them. Human performed methods for risk
identification
include surveys of the project, customer, and users for potential concerns,
and gives a list of
typical project risks; clearly as of its publication date, automatic tool
support for risk
identification was not yet on the horizon, and it is hoped that this paper
will generate initial
awareness in favor of automated or semi-automated methods to collect evidence
from textual
data. Known methods for manually identifying risks are described in at least
Harold R.
Kerzner. Project Management: A Systems Approach to Planning, Scheduling, and
Controlling. Wiley, 10th edition, 2009.
[0095] The International Organization for Standardization (ISO) and the
International
Engineering Commission (IEC) have produced a codification of terminology and
best
practices for risk management, including risk identification techniques, found
in ISO
31000:2009¨principles and guidelines on implementation, 2009; and ISO/IEC
31010:2009
¨ risk management ¨ risk assessment techniques, 2009. However, because the
standard was
issued in 2009, it predates first attempts to develop computerized tools to
support the risk
identification stage of the risk management process.
[0096] Key problems of risk management include (1) how to model risk,
(2) how to
obtain data for a chosen model so that it can be used in practice, and (3)
what decisions to
take based on the risks. A risk R basically has three properties to
characterize it:
[0097] the risk type RT : a name for the description of the risk that
characterizes the
nature of the adversarial potential;
28
CA 02987838 2017-11-30
WO 2017/017533
PCT/1B2016/001374
[0098] a likelihood RI,: the estimated odds how likely the risk
happens within a
certain time frame (e.g., 6 months) or not;
[0099] its impact RI: if it materializes, what is the severity of the
damage caused. This
could be expressed as minimum, expected and maximum loss in USD, for example,
akin to
loss databases used by insurances.
[00100] These can be expressed as: R = (RT ;RL;Ri). Unfortunately, the
probability of
an event and its impact are often confused by laypersons and experts alike. A
particularly
common error is to take the frequency of mention of a risk type as a proxy for
its probability:
while in some cases this makes sense, for example if there are increasingly
frequent reports of
political unrest coming from a country, this may indeed be suggestive of an
imminent civil
war or revolution, in many cases the frequent mention of a risk reflects a
more extensive,
detailed discussion, which may actually indicate less risk (well scrutinized
in this example
means better understood). The computer-supported risk identification system of
the present
invention focuses on risk identification, however, systems and methods for
risk likelihood
assessment may be incorporated into the system.
[00101] Regarding the modeling of risk, one of the easiest approaches
is simply listing
the risk types that a company is exposed to, the risk register shown in Figure
8. Figure 8
provides a Risk Register for a fictional publishing company. In its simplest
form, it is a set
comprising the list of risk types 9002. The extended risk register for the
fictional company
shows the 3 essential attributes of each risk R = (RT ;RL;Ri) in the table
9004. The ratings
"high", "medium" and "low" in Figure 9 are given only for didactic purposes; a
real
assessment should quantify risk to avoid subjective differences in
interpretation of these
terms. At the most sophisticated end of the spectrum, complex mathematical
graph-based
models could simulate propagation of risk evidence, probabilities and
causality through a
graph-based model. However, the present invention generates a table of
intended action to
deal with each risk type. More complex models may quantify probability and
impact, but it is
often hard to obtain data for the more complex models' parameters, and to
validate its
appropriateness as a model.
[00102] A risk register's value or merit can be judged along a set of
dimensions
including:
29
CA 02987838 2017-11-30
WO 2017/017533
PCT/1B2016/001374
[00103] comprehensiveness: does it contain all or at least most risks
that the entity it
pertains to is exposed to? This is difficult because in reality there does not
exist a complete
universe of risks for an entity to compare to.
[00104] currency: does it contain the risks significantly before they
materialize?
[00105] correctness: how correct are the risks in the risk register? This
can be
measured by Precision, the percentage of correct risks that are also present
in the risk register.
A risk can be deemed correct at different levels: at the most basic level, a
risk R, is correctly
included in a risk register for an entity e if the linguistic context from
which the risk mention
of r was extracted supports the inclusion decision. I.e., more human analysts
would include,
independently from each other, the risk in the risk register based on the
evidence than those
that don't (human agreement is always an upper bound of machine performance,
at least if
machines are evaluated against a human "ground truth", "gold standard" or
"reference
solution").
[00106] cost: all things being equal, a risk register is better than
another if it can be
produced more cheaply than another.
[00107] In the absence of an "oracle" that provides the complete set
of risks which
could be used for an absolute evaluation, one work-around is to have multiple
systems
developed by different groups using different methods for risk identification,
each producing
their own risk register for any given entity. Then the set union of all of
them could be formed
and reviewed by human judges, to create a resource that will be defined as the
gold standard,
and against which also coverage and recall can be measured to accommodate the
aforementioned "completeness" quality criterion. This methodology, known as
pooling, has
been applied successfully in the evaluation of search engines at the US
National Institute of
Standards and Technology (NIST) in the Text Retrieval Conferences (TREC).
[00108] There are three types of risks that may be categorized based on a
measure of
the "surprise" the risks would cause if the risk materialized:
[00109] Obvious risks can be important to bring to one's attention
(when their
materialization is imminent), but often we will want a filter to see only the
not-so-obvious;
[00110] Gray Swans are defined as risks that are hard to anticipate
because they are
unlikely, and they may have huge impact once they materialize; and
CA 02987838 2017-11-30
WO 2017/017533
PCT/1B2016/001374
[00111] Black Swan risks are defined as risks that cannot in principle
be anticipated,
they have a very low likelihood, yet their impact is enormous (black swans
were believed not
to exist until some were finally discovered). If there exists a class of risks
that cannot by
definition be anticipated, it naturally is outside of the scope of computer
supported techniques
for detecting them (which is why we can focus on "gray swans" here). This is
consistent with
information theory's view of surprise as information content (less surpising
more
predictable smaller information content). White swan risks may also exist.
A White Swan
is, for example, a bridge that can only handle small trucks, and it can be
certain that the
bridge will collapse because a few big six-ton trucks can be seen coming on
the highway, and
so it is known that the bridge is going to collapse, it's only a matter of
time. "Swans" are
discussed in more detail in Jessica Pressler, Nassim Taleb: There Are Actually
Three Types
Of Swans, New York Magazine, 2010, (online) cited 2015-10-01,
http://nymag.com/daily/intelligencer/2010/06/nassim taleb there are
actuall.html.
[00112] "Risk Mining" from Textual Sources
[00113] In this section, a system and method for computer-supported risk
identification
10000 is described at the conceptual level as shown in Figure 9, wherein an
entity tagger tags
entities, e.g., company tagger, and classifies and tags identified risk
phrases to relate data to
risks to which the entity is exposed. A goal is to retrieve all risks
associated with an entity or
company. The system takes three inputs: (i) the World Wide Web 10002, as
indexed by a
search engine, (ii) a set of company names, the risks of which need to be
determined (e.g. a
list of suppliers or an investment portfolio) and (iii) a news archive 10004
comprising trusted
news and analysis. The World Wide Web (WWW) 10002 is used to mine a taxonomy
of risk
types 10006, examples of which are shown in Figures 25 and 26, regardless of
the entity that
is exposed to them; the WWW 10002 was chosen because it is the largest
existing online
source of English prose. The news archive 10004 is the source of information,
from which
the risks can be extracted, essentially using journalists' insights to
"crowdsource" risk
mentions from their reporting. The company list is the real (variable) input,
and the output is
a risk register for each company.
[00114] The method comprises of three steps: a taxonomy learning step
10102, which
is run at least once to obtain an inventory of possible names for risks, a
tagging step 10104 in
which company names and risk type names, respectively, are annotated in the
text of the
news feed and/or news archive (by simple look-up, or possibly by a more
sophisticated
process such as machine learning) by a company tagger 10008 and risk tagger
10010
31
CA 02987838 2017-11-30
WO 2017/017533
PCT/1B2016/001374
respectively; and a classification step performed by a risk relation
classifier 10012, in which a
machine learning process decides whether a risk mention instance candidate
pair comprising
a company name mention and a risk type mention (co-occurring in the same
sentence) are
indeed related to each other, and that they indeed express a risk exposure
situation.
[00115] The first step creates a taxonomy of risk terms or phrases 10014,
which may
be referred to as the risk taxonomy. Unlike human-created taxonomy, the output
is very rich
in detail, but messy, "by machines, for machines" in a way. A graph is
obtained with as many
IS-A relationships as possible and "risk" as its root node by remote-
controlling a Web search
engine with search queries for linguistic patterns likely to retrieve risk
terms or phrases. The
method makes use of "Hearst patterns" ("financial risks such as " is likely to
retrieve Web
pages, in which this pattern is followed by "bankruptcy", for instance) to
induce a rich risk
type vocabulary. Qualitative 11002 and Quantitative 11004 risk registers may
be generated as
shown in Figure 10.
[00116] Software to automatically annotate prose text with company
names is easily
available today. Popular methods are based on name dictionaries (gazetteers),
linguistic rules
and/or machine learning. Likewise, terms and phrases from the generated risk
taxonomy can
be tagged or looked up in sentences. At the end of this step 10104, each
sentence that
contains a mention of a company name and a risk type name has both marked up
in step
10104, which creates candidate pairs (tuples). In one example, the pair
(Microsoft, fine)
could be generated by both of the following sentences, one correct and one
incorrect (i.e.,
undesirable in a risk mining context):
(a) Microsoft are facing a fine, said Bill Gates.
(b) I feel fine, said Microsoft 's Bill Gates.
Now the tuples have been formed, false positives need to be eliminated.
[00117] In order to eliminate spurious false positives in the list of
candidate risk
exposure relationship tuples, each pair comprising a company name and a risk
term or phrase,
taking into account the sentential context in which they occur, can be
classified using a risk
relation classifier 10012. For example, supervised machine learning is capable
of
distinguishing cases (a) and (b) after a few hundred training sentences have
been annotated
by human experts to induce a statistical model from that generalizes the
evidence provided in
these.
32
CA 02987838 2017-11-30
WO 2017/017533
PCT/1B2016/001374
[00118] Once risk company-relation mentions have been identified and
stored in the
tuple store 10016, they can be aggregated by a company risk register
aggregator 10018 so as
to form the actual risk register to be stored in the risk register database
10020. The naive way
of doing this is by forming the set of all risk mention instance tuples for
each company Cõ i.e.
to gather (C,;Ri) for all js to get the risk register for one company C,.
[00119] A higher frequency indicates merely an increased number of
mentions of a
risk, which is not identical, but may in some cases be correlated with, a
higher likelihood for
the risk to materialize: a spike in mentions of "earthquake" is likely to
result from imminent
or actual earthquakes, but a spike in "acquisition" may or not precede the
acquisition of a
company; some risks are less likely to materialize just because they are
mentioned often, and
that is because all public focus is on the topic, so the risk is at least not
overlooked.
[00120] Once a risk register is aggregated, it can be shown to a human
analyst for his
or her perusal as a risk alert 10022, risk search 10024, or risk visualization
10026. The risk
register is regularly updated as part of the Risk Monitoring and Control
activity based on new
relationships mined that may not have been seen by the system before. By
retrieving
mentions of risks related to companies, risk mining from text supports the
three goals of risk
measurement according: (1) uncovering "known" risks, (2) making the known
risks easier to
see, and (3) trying to understand and uncover the "unknown" or unanticipated
risks. The
goals of risk measurement are discussed in Thomas S. Coleman, A Practical
Guide to Risk
Management Paperback, Research Foundation of CFA Institute, 2011.
[00121] Case Study: Starbucks Corporation
[00122] Starbucks Corporation is a US-American coffee company that is
operating
coffee retail stores internationally. Civil unrest risk is perhaps not the
most obvious risk type
associated with this venture, yet the computer-supported risk identification
system of the
present invention would include this risk type in Starbucks' risk register. Is
this an error? In
this example, evidence shows that a Starbucks cafe was used by student
protesters as a base
to organize their demonstration. This makes sense as the Starbucks store is
the perfect place
for organizing a demo as it is centrally located, has free wireless Internet
access, and serves
coffee.
[00123] Once this risk type is enters the radar of the corporate risk
manager of
Starbucks, they can act on it. There are many ways to handle the risk (either
installing house
rules that ban demo organizers, or embracing the student protesters by
launching a campaign
33
CA 02987838 2017-11-30
WO 2017/017533
PCT/1B2016/001374
"We welcome the student revolution!"); the point is that it would be unlikely
that this kind of
risk could be conceived using traditional risk identification techniques
(i.e., a boardroom
meeting with an empty Excel spreadsheet).
[00124] Once the risk identification, likelihood and impact
assessments have
concluded, a risk management plan should define the actions to be taken to
influence the risks
in the company's favor. An example risk management plan is shown in Figure 11.
[00125] Risks can be investigated in isolation; however, quite often,
a chain of follow-
up risks is conceivable. Risk-risk connections can be causal or correlated in
nature: if a
country is exposed to earthquake risk, then its citizen may be exposed to
hygiene risk since it
is likely that water pipes may burst. The propagation of risk functions
regardless of the type
of risk, from hygiene risks to financial risks.
[00126] In 1995, Barings Bank failed (caused by unauthorized trading
by Nick Leeson,
its head derivatives trader in Singapore) due to particular risks specific
only to Barings
(operational risk), whereas the 2008 failure of Lehman Brothers, AIG, and
others was part of
a systemic meltdown of global financial systems caused by bad risk management
in the real
estate and credit markets. Risks can also be inherited from the geo-political
environment of
operations when countries are not politically stable or ridden by poverty or
natural disasters.
The World Economic Forum publishes an annual risk report naming the most
pressing global
risks.
[00127] Risk Propagation Along The Supply Chain
[00128] Imagine Chandni, a textile worker in an old and crowded
factory building
("sweat shop") in Bangladesh. In this hypothetical example, she earns $0.19
per hour,
although she is only twelve years old. She is hungry and lacks sleep, but kept
like a slave,
forced to work long hours, and locked in the factory so she cannot leave.
Figure 12 shows
how Chandni's personal risk register does not affect her direct employer much
(if she dies,
there will be another likely victim replacing her at the same cost), but the
human rights
violations she faces can become a reputation risk for the international
fashion brand that
subcontracted the textile factory that employs her.
[00129] The suicides of several employees of Foxconn (also known as
Hon Hai
Precision Industry Co., Ltd.), an electronics manufacturer that is a
subcontractor for Apple
Inc., has been a prime example of reputation damage by association. Foxconn
was reported to
exploit its workers, and some of them took their lives. This in turn caused
outrage by Apple
34
CA 02987838 2017-11-30
WO 2017/017533
PCT/1B2016/001374
Inc.'s customers when reported by news media. Another example is a
manufacturer of cars,
which may source its engines from a vendor. The engine may contain spark plugs
from yet
another vendor. If the spark plug vendor produces a very customized version
for the engine
manufacturer that cannot easily be replaced, a cash-flow problem of the spark
plug vendor
may delay or even halt production for the car manufacturer if no alternatives
can be sourced
easily. The more remote and indirect in the supply chain graph the risk is
from the company
that is ultimately (transitively) exposed, the harder it is to anticipate the
problem in the risk
identification process. A solution could be the overlaying of risk registers
onto the supply
chain graph as shown in Figure 13. For risk modeling to work very well, it
ought to be
connected to the real world; in the risk case, such a "calibration" means the
model is more
fictional.
[00130] Opposed to mere predictions, which ultimately are a form of
fiction, the
present system is directed to an informed-based determining process. A risk
model that is
informed by real-life signals, for example derived from loss databases (e.g.,
from the
insurance sector), and project management databases (as gathered by the
project management
offices in corporations), will compare favorably to one that is not linked to
the business
operation. This connection between risk model and risk reality is
bidirectional: the world
informs the model, the model makes predictions, predictions are compared with
real
outcomes as risk do or do not materialize, and outcomes are fed back to
improve models. For
example, an identified cash flow risk could be measured legal by how small
cash reserves
become, and by comparing the current balance to the lowest previous low. Or,
when
identifying legal risk, actual legal services and litigation cost may be fed
it back into our
model. For an organization to be effective, risk modeling and risk management
cannot
operate separately from other parts of the business (financial, legal,
operational departments).
[00131] Portfolio Risk
[00132] Given two publishing companies, Acme Inc. and Rainforest
Publishing Inc.,
they will have very different risk registers. They share the risks common to
all publishing
companies, but there will be a set of risks peculiar to individual companies
based on their
unique name (e.g. trademark violation risk), location (demand risk), pricing
(competitive
risk), kind of publications offered (sourcing risk, demand risk), advertising
and marketing
mix (operational risk), and so on. Ed G. Reedy is a fictional investment
manager in charge of
250 million US$ investment assets. At any time, he holds a portfolio of
securities (e.g. shares,
CA 02987838 2017-11-30
WO 2017/017533
PCT/1B2016/001374
options, forward contracts), which make him a stakeholder in the wellbeing,
and therefore
also in the risk exposure, of the underlying companies that make up his
portfolio.
[00133] His portfolio comprises five companies, each exposed to a
number of partly
different, partly overlapping risks, shown in Figure 14, and it was assembled
in a way that
ensures the companies have high-growth potential, and their risk as far as
"fundamentals"
(financial base numbers like revenue, EBITDA etc.) are not strongly
correlated. Once the risk
register for a company can be viewed (after extracting it from news text using
risk mining,
and having the output vetted by a human analyst), the portfolio risk can be
scrutinized based
on the qualitative risk types (as opposed to scrutinizing it based on
fundamentals-based
correlation only) by looking at risk overlap, to get a different perspective
on risk.
[00134] With reference now to Figures 5 and 7, a system for generating
risk registers
is provided. Figure 4 provides a flowchart 5000 comprising the functional
elements executed
by the system. A computer based system for generating a risk register would
comprise a
computing device having a processor and a memory, a risk database, an input, a
company-
risk relation classifier, a risk tagger, a company tagger, and a risk register
aggregator. The
system may also include a user interface module to generate for display a risk
visualization
interface representing aspects of the risk register. At block 5002 the risk
database accessible
by the computing device is loaded with a set of risk types generated based on
an induced risk
taxonomy previously derived at least in part upon operation of a machine
learning module. At
block 5004 the input receives a set of electronic source data representing
textual content and
comprising potential risk phrases. The set of source data received comprises
one or more of:
an indexed search; a news archive; a news feed; structured data sets;
unstructured data sets;
social media content; regulatory filings. The input may also receive a search
query and to
execute a risk search on the plurality of risk registers (rr ...rrn)
[00135] At blocks 5006-5012, a company-risk relation classifier, which
comprises a
risk tagger and a company tagger, identifies and extracts company-risk
relations from the set
of source data. At block 5008, the risk tagger identifies in the set of source
data a set of risk
candidates (r1) based on the set of risk types. At block 5010, the company
tagger identifies
mentions of company names (c1) in the set of source data. The identified names
are stored in a
company index and the first risk register is associated with COMPANYci,
defined as the set
of all risks 1...r...1R1 where the company index (c) is the same. At block
5012 the company-
risk relation classifier maps the identified set of risk types to the
identified company names to
generate a set of tuples [COMPANYc;RISK,1. Although described herein in terms
of
36
CA 02987838 2017-11-30
WO 2017/017533
PCT/1B2016/001374
company-risk relationship, the invention applies broadly to any type of
entity, e.g., company
or person, etc. The expressions used herein are more broadly considered in the
forms of entity
names (c1) and [ENTITYc;RISK,1. The company-risk relation classifier maps the
set of risk
types to the company names (c1) in the set of source data to generate the set
of tuples, the
results comprising candidate risk exposure relationship tuples. The company-
risk relation
classifier may further filter the set of tuples to eliminate false positive
tuples. The company-
risk relation classifier may further map the set of risk types to a plurality
of company names
(c1... c) to generate a plurality of sets of tuples
tn) for each of the company names and
generate a plurality of risk registers (rri...rrn) respectively associated
with company names
(c/...c,) and sets of tuples tn). The company-risk relation classifier may
also identify and
extract company-risk relation mentions by using a set of purpose-defined
features for risk
sentence classification implemented as a trained Support Vector Machine (SVM)
and the set
of purpose-defined features may be derived from a corpus of text to inform
classification
based on a machine learning process. The set of purpose-defined features may
include a
Moschitti-style tree kernel.
[00136]
In addition to the risk and company taggers, the company-risk relation
classifier may also comprise a supply chain risk tagger adapted to identify
supply chain
relationships between one or more companies identified by the company tagger
and to
identify in the set of source data a set of supply risk candidates (sr,) based
on a set of supply
risk types associated with supply chain risks.
[00137]
Finally, at block 5014, the risk register aggregator generates a first risk
register
based on the set of tuples associated with a first company that may include a
tuple
representing a supply risk type. A risk alert may be generated and transmitted
in response to
an update of the first risk register. The system may further comprise a risk
register database
adapted to store the plurality of risk registers (rri...rrn); and a search
engine adapted to
receive and execute a search query on the plurality of risk registers
(rri...rrn). The system
may output any information generated by the system using a risk presentation
module
adapted to automatically generate a representation of risk for inclusion in a
user-defined
document which may be one of: an SEC filing; a regulatory filing; a power
point
presentation; a SWOT diagram; a supply-chain cluster diagram; editable text
document.
[00138]
With reference now to Figure 6, a flowchart 7000 representing system for
generating a risk register relating to a named entity is provided. In block
7002 the system
receives input from an indexed search and a news archive. In block 7004 the
system creates
37
CA 02987838 2017-11-30
WO 2017/017533
PCT/1B2016/001374
from the input a risk taxonomy with risk types by a machine learning module.
At block 7006
the system maps the risk types to the named entity identified in the news
archive, the results
comprising candidate risk exposure relationship tuples. At block 7008 the
system filters the
mapping results to eliminate false positive tuples and in block 7010 the
system generates in
response to the identified tuples the risk register. The system may also
generate a risk alert in
response to an update to the risk register, perform a search on the risk
register, and display a
risk visualization by representing aspects of the risk register as described
below. A search
engine may be used to integrate services and provide user interface to
facilitate searching of
risks for entities of interest or for risk types of interest. A clustering
module may be used to
cluster based on industry or risk type and provide visualization of
relationships among
entities.
[00139] Graphical User Interface
[00140] With reference now to Figures 16-29, a set of screenshots of a
graphical user
interface and visualizations for display in the graphical user interface are
provided. The
elements shown in Figures 16-29 may be provided as part of a single risk
identification and
management system and graphical user interface or may be integrated separately
into other
risk management systems. Figure 16 provides a graphical user interface 1600
showing a set
of general risks comprising financial risks, operational risks, legal risks,
and market risks for
an entity, Apple Inc. The risks shown are represented by a numerical value in
a bar graph
1602. The graph 1602 also provides an indication as to whether the risks are
opportunities or
threats. The graphical user interface 1600 may also show idiosyncratic risks
and trends
associated with the entity, Apple Inc. A user is allowed to search by entity
(e.g., company)
name, entity ID, and may restrict search using other parameters, e.g., date
range. Risk types
(risks extracted and classified) avoid false positives.
[00141] Figure 17 provides a graphical representation of a company risk
profile 1700.
The risk profile may show a set of general risks 1702 including operational,
legal, market,
and financial risks, a set of idiosyncratic risks 1704 including environmental
risks, staff
attrition risks, and currency risk, and graphical representations of self
delta (self trend) 1706,
and peer delta (peer trend) 1708. The self trend 1706 and peer trend 1708 may
be selected
and seen in greater detail as shown in Figure 20. Figure 18 provides a list of
idiosyncratic
risks that may be associated with an entity. One or more of the risks may be
selected to view
additional data including graphical representations of the risks. For example,
as shown in
Figure 19 a "civil unrest" risk may be selected to view additional information
on how the risk
38
CA 02987838 2017-11-30
WO 2017/017533
PCT/1B2016/001374
was determined. Additional information such as related articles and documents
may be
accessed when the risk is selected.
[00142] Figures 21-24 provide another embodiment of a graphical user
interface called
the 360 Risk View 2100 for JP Morgan Chase. The 360 Risk View 2100 comprises
an entity
web visualization 2102 that shows the relatedness of entities in one or more
business areas or
supply chains and is shown in more detail in Figure 22. A word cloud 2104
shows the relative
importance or frequence of occurrence of terms or risks associated with an
entity. A list of
risks 2106 provides detailed risk information on general and idiosyncratic
risks for an entity
and is shown in greater detail in Figure 23. A detailed risk log 2108, shown
in Figure 24,
shows instances where an entity and risk have been identified and also
provides a quantitative
score associated with the entity-risk pairing.
[00143] With reference now to Figure 27, an entity risk dashboard 2700
is provided.
The dashboard 2700 enables a user to view graphical representations of risks
associated with
a particular entity. The dashboard 2700 also enables a user to view, receive,
and interact with
alerts 2708 related to identified risks. A risk meter 2702 provides a
graphical representation
of the level of risk associated with a certain risk type as a color on a scale
for risks such as
labor and legal, geopolitical, environmental, and security. A risk rank 2704
provides a user
with a list of the highest risks for a set of entities. A location risk chart
2706 indicates the top
risk types and the level of the risk for different geographical regions. A
trend chart 2710
indicates the type and level of risk from a certain information source, such
as Twitter, and
may also provide an indication as to which of the risks require action or user
attention. In
another view, risk view 2800, shown in Figure 28, a user may view specific
risk events for an
entity. In the risk view 2800 risk events for "fines" associated with an
entity are shown. The
chart 2802 indicates the amount of fines for each year in a defined time
frame, but may also
show the level of other selected risk types. Detail area 2804 may show
specific risk events
and additional details associated with those risk events. For example, the
detail area 2804 for
"fine" type risk events may show fines, event numbers, entities, fine amounts,
cause,
additional information, levying agency, event start and end dates, and total
fines. Additional
information such as the number of mentions of the risk event may be shown in a
graph 2806
when selected by a user.
[00144] With reference to Figure 29, the present invention may also
take identified
entity-risk information and generate a strength weakness opportunity threat
(SWOT) chart for
an entity. The SWOT chart may show the specific identified risks and the
category those risks
39
CA 02987838 2017-11-30
WO 2017/017533
PCT/1B2016/001374
fall into. For example, the chart may show a list of external risks as threats
and a list of
internal risks as weaknesses as identified by the system.
[00145] While the invention has been described by reference to certain
preferred
embodiments, it should be understood that numerous changes could be made
within the spirit
and scope of the inventive concept described. In implementation, the inventive
concepts may
be automatically or semi-automatically, i.e., with some degree of human
intervention,
performed. Also, the present invention is not to be limited in scope by the
specific
embodiments described herein. It is fully contemplated that other various
embodiments of
and modifications to the present invention, in addition to those described
herein, will become
apparent to those of ordinary skill in the art from the foregoing description
and accompanying
drawings. Thus, such other embodiments and modifications are intended to fall
within the
scope of the following appended claims. Further, although the present
invention has been
described herein in the context of particular embodiments and implementations
and
applications and in particular environments, those of ordinary skill in the
art will appreciate
that its usefulness is not limited thereto and that the present invention can
be beneficially
applied in any number of ways and environments for any number of purposes.
Accordingly,
the claims set forth below should be construed in view of the full breadth and
spirit of the
present invention as disclosed herein.