Note: Descriptions are shown in the official language in which they were submitted.
RADAR DETECTOR WITH MULTI-BAND DIRECTIONAL DISPLAY AND ENHANCED DETECTION OF
FALSE
ALERTS
TECHNICAL FIELD
The present disclosure relates to police radar detectors and, more
particularly, to enhancing
the display features and false alert detection in a radar detector device.
BACKGROUND
Radar detectors warn drivers of the use of police radar, and the potential for
traffic citations
if the driver exceeds the speed limit. The FCC has allocated several regions
of the electromagnetic
spectrum for police radar use. The bands used by police radar are generally
known as the X, K and
Ka bands. Each relates to a different part of the spectrum. The X and K bands
are relatively narrow
frequency ranges, whereas the Ka band is a relatively wide range of
frequencies. Within each of the
bands, the spectrum is typically subdivided into a number of smaller range
frequency blocks or sub-
bands.
Radar detectors typically comprise a microwave receiver and detection
circuitry that is
typically realized with a microprocessor or digital signal processor (DSP).
Microwave receivers are
generally capable of detecting microwave components in the X, K, and very
broad Ka band. In
various solutions, either a microprocessor or DSP is used to make decisions
about the signal content
from the microwave receiver. Systems including a DSP have been shown to
provide superior
performance over solutions based on conventional microprocessors due to the
DSP's ability to find
and distinguish signals that are buried in noise. Police use of laser has also
been countered with laser
detectors, and products are now available that combine laser detection into a
single product with a
microwave receiver to provide comprehensive protection.
- 1 -
Date Regue/Date Received 2022-08-02
Methods of conditioning detector response are gaining importance, due to an
increasing
number of signals present in the X, K and Ka bands from products that are
completely unrelated to
police radar. These products share the same regions of the spectrum and are
also licensed by the
FCC. The growing number of such signals is rapidly undermining the credibility
of radar detector
performance. Radar detectors cannot tell the difference between emissions from
many of these
devices and true police radar systems. As a result, radar detectors are
increasingly generating false
alerts, reducing the significance of warnings from radar detectors. Commonly-
assigned U.S. Patent
No. 8,525,723 provides a description of a number of stationary, unrelated
microwave sources, which
are also referred to herein as false sources or unknown sources.
Commonly-assigned U.S. Patent No. 6,670,905 ("the '905 patent") and U.S.
Patent No.
9,279,881 describe systems and methods that aid in the management of unrelated
sources, and
permit a detector to dynamically improve its handling of unrelated sources.
The '905 patent discloses
a Global Positioning Satellite System (GPS) enabled radar detector that uses
GPS to aid in the
management of non-police-related or otherwise irrelevant sources of radar
signals, permitting the
detector to dynamically improve its handling of such sources and reduce false
alerts. The
detector references previously-stored geographically- referenced information
on such sources,
and compares the detector's current location to locations of known stationary
false alert sources,
to improve the handling of signals from those sources.
When the detector is within a threshold distance of a stored false alert
source, the detector
suppresses alerts for frequency bands or sub-bands that correlate to the
frequency of the known
false alert source. False sources may be manually identified and "locked out"
by the user, or may be
automatically identified based upon multiple repeated encounters of the
detector with the source at
a particular geographic location. Thus, the GPS-enabled detector offers an
electronic method for
establishing current physical coordinates and using those coordinates to
ignore false sources.
Systems embodying the '905 patent have been successfully commercialized by the
assignee
of this application, but these systems continue to face certain challenges.
For instance, the
detection and suppression of false sources relies primarily upon location data
obtained by and
stored in a single detector. This may be adequate when a vehicle repeatedly
travels a similar path,
such as during a daily commute to/from work or school. However, when following
a new route, such
as on a road trip or vacation, the detector lacks a store of stationary false
alert source locations and,
thus, may produce numerous false alerts. The '905 patent, notes the
possibility that signal
information can be obtained from outside sources, such as internet sites or
other radar detectors, to
- 2 -
Date Regue/Date Received 2022-08-02
CA 03000392 2018-03-28
WO 2017/058906
PCT/US2016/054168
address this problem. However, even in this solution the location of a
stationary false source is
identified based on data which only provides a rough estimate of the false
source location. More
accurate identification and lockout of false alerts requires more precise
positioning data regarding
the geographic location of non-police radar sources.
To respond to these challenges, the assignee and others have developed social
networks
through which drivers can share radar events and sightings of police into a
social network, so that a
warning can be delivered to other drivers approaching the area. Unfortunately,
users of social
networks often report police activities that are not actually speed traps, for
example, social network
users may warn of a police car that is driving with traffic, waiting at a
traffic light on a cross street, or
involved in other activities that are not characteristic of a fixed location
speed trap. As recognized
by the present inventors, alerts that can be confirmed, e.g., via radar
detection, are more reliable.
Additionally, due to the increased number of false alert sources, the present
inventors
recognized that it is desirable to know the band of a detected signal. Knowing
the band enables a
driver to decide whether to discount an alert as likely emanating from a false
source, as may be the
case with many X-band signals; or to heed the alert and reduce speed, if the
signal is in the Ka-band
or a laser signal, which more commonly originate from a police radar source.
Additionally, when
receiving an alert, the present inventors recognize that it is desirable to
know not only the signal
band, but also the direction that the signal came from, since multiple signals
may be received at the
same time and accorded different levels of importance. For example, it may be
much more
significant to know that there is a Ka-band signal, particularly one
originating from the direction of
travel of the vehicle, rather than to know that there is an X-band signal
originating behind the
vehicle. Furthermore, when driving at a high rate of speed, such as on a
highway, a driver needs to
receive this information in as clear and concise a manner as possible, in
order to be able to make a
quick decision on how to respond. Accordingly, as recognized by the present
inventors, it is
desirable to have a radar detector with a display that conveys both signal
band and direction
simultaneously for one or more detected signals, and it may be desirable to
have a display that
provides multiple types of information through illumination of a single
indicator.
SUMMARY
In light of the above and according to one broad aspect of an embodiment of
the present
disclosure, an enhanced radar detector display is provided which depicts the
source direction of one
more detected signals simultaneously with the frequency band of the detected
signal. In one
example, the radar detector includes a housing and a radar receiver for
detecting radar signals
- 3 -
CA 03000392 2018-03-28
WO 2017/058906
PCT/US2016/054168
integrated within the housing. Electronics for controlling the radar receiver
and evaluating detected
radar signals are also integrated within the housing. The electronics evaluate
the detected radar
signals to determine a band and source direction of the detected signals. A
display in
communication with the electronics includes one or more indicators having an
appearance that
varies to convey both direction and band type of a detected signal.
In one example, the one or more indicators may be illuminated in selected
colors to
communicate source direction and band of a detected signal. The indicators may
have an arrow
shape. In one example, one indicator can individually depict both band type
and source direction of
a detected radar signal. In one example, the display may include four
orthogonally-spaced arrows,
one or more of the arrows being illuminated in a selected color to indicate
band type and source
direction of one or more detected radar signals.
According to another broad aspect of another embodiment of the present
disclosure,
disclosed herein is a method of displaying characteristics of a received radar
signal in a radar
detector display. In one example, the method may include determining a source
direction of the
.. received radar signal; determining a frequency band of the received radar
signal; determining a
strength of the received radar signal; and concurrently showing source
direction, band and signal
strength in a combined display. In one example, the radar detector display may
include multiple
different colors, the colors varying to visualize different band types.
According to another broad aspect of another embodiment of the present
disclosure,
disclosed herein is a method of using one or more radar detectors to identify
a physical location of a
radar source, the radar detectors comprising a radar receiver for detecting
radar signals and signal
processing electronics for controlling the radar receiver and evaluating
detected radar signals. In
one example, the method may include identifying and recording a geographic
location of a first mid-
ship point of a detected radar signal in a vehicle traveling in a first
direction during operation of a
radar detector; identifying and recording a geographic location of a second
mid-ship point of a
detected radar signal in a vehicle traveling in a second direction different
from the first direction
during operation of a radar detector; uploading the recorded geographic
location of the first and
second mid-ship points and first and second directions of travel to a host
server; and evaluating
coordinates and directions of the first and second mid-ship points to identify
first and second
midlines for a false source, and marking a false source at an intersection of
the first and second
m idlines.
- 4 -
CA 03000392 2018-03-28
WO 2017/058906
PCT/US2016/054168
In one example, the first direction of travel may be substantially
perpendicular to the second
direction of travel. The coordinates of the first and second mid-ship points
may be used for
suppressing an alert of the false source in a radar detector. The method may
also include marking a
location of a false source at an intersection of the first and second midlines
when the radar signal
detected at the first and second mid-ship points are of similar frequency.
According to another broad aspect of another embodiment of the present
disclosure,
disclosed herein is a method of detecting a location of a non-police radar
source and communicating
the location to a network of radar detectors. In one example, the method may
include receiving a
geographic location and direction of travel of a first mid-ship point of a
first radar signal detected in
a vehicle traveling in a first direction; receiving a geographic location and
direction of travel of a
second mid-ship point of a second radar signal detected in a vehicle traveling
in a second, different
direction; evaluating coordinates and directions of travel of the geographic
locations of the first and
second mid-ship points to identify midlines for a false source, and marking a
false source location at
an intersection of the first and second midlines; and downloading geographic
coordinates for the
marked false source location to one or more radar detectors. The method may
also include
receiving frequency information of the first and second radar signals, and
evaluating received
frequency information of the first and second radar signals to determine
whether a common source
location generated the first and second radar signals.
According to another embodiment of the present disclosure, an enhanced method
is
disclosed for detecting the location of a false alert source in order to
suppress alerts to signals
emanating from the location. In one example, a method may use one or more
radar detectors to
identify a physical location of a radar source. The radar detectors include a
radar receiver for
detecting radar signals and signal processing electronics for controlling the
radar receiver and
evaluating detected radar signals. The method may include identifying and
recording a geographic
location of a first mid-ship point of a detected radar signal in a vehicle
traveling in a first direction
during operation of a radar detector. The geographic location of a second mid-
ship point of a
detected signal is also identified and recorded in a vehicle traveling in a
second different direction.
The recorded geographic locations of the first and second mid-ship points and
first and second
directions of travel may be uploaded to a host server, or evaluated within the
radar detector itself.
In either case, the coordinates and directions of the first and second mid-
ship points are evaluated
to identify first and second midlines for a false source, and a false source
may be marked at an
intersection of the first and second midlines. The marked false source
location can be used in a
detector and/or downloaded to multiple detectors via a social network.
- 5 -
CA 03000392 2018-03-28
WO 2017/058906
PCT/US2016/054168
In this manner, one example of the present disclosure provides for recording
and analyzing
detector data gathered while traveling in different directions to better hone
in on the physical
location of radar sources. This data may be combined, e.g., in a detector or
in a common server
connected to several detectors, for identifying and localizing received
signals emanating from the
same source location. The geographical coordinates for these common source
locations can be
distributed to multiple detectors through a social network or other
communications method, to
enable vehicles traveling a roadway for the first time to identify and
suppress a false source.
In one example, a radar detector combines band type, signal strength and
source direction
in a single symbol on the display.
Other embodiments of the disclosure are described herein. The features,
utilities and
advantages of various embodiments of this disclosure will be apparent from the
following more
particular description of embodiments as illustrated in the accompanying
drawings.
BRIEF DESCRIPTION OF THE DRAWINGS
Fig. 1 is a block diagram of components of an exemplary police radar detector,
in accordance
with an embodiment of the present disclosure;
Fig. 2 depicts a radar detector display in a first exemplary display mode, in
accordance with
an embodiment of the present disclosure;
Fig. 3 is an illustration of a vehicle receiving radar signals from a police
radar source and a
false radar source, during different times of travel and different directions
of travel;
Fig. 4 depicts a radar detector display in another example display mode, in
accordance with
an embodiment of the present disclosure;
Fig. 5 depicts a radar detector display in another example display mode, in
accordance with
an embodiment of the present disclosure;
Fig. 6 depicts a radar detector display in another example display mode, in
accordance with
an embodiment of the present disclosure;
Fig. 7 is an illustration of radar detectors of the type described herein
detecting radar signals
from a false radar source while traveling in different directions;
- 6 -
Fig. 8A shows a flow chart of example operations of the radar detector of Fig.
1 in performing a multi-
vehicle evaluation of detected radar signals to locate a potential false
source, in accordance with an embodiment
of the present disclosure; and
Fig. 8B shows a flow chart of example operations of the host server in
performing a multi-
vehicle evaluation of detected radar signals to locate a potential false
source, in accordance with an
embodiment of the present disclosure.
DETAILED DESCRIPTION
Fig. 1 illustrates an exemplary radar detector 20 which features a processor
22, such as but not limited
to a fusion processor, for controlling all functions of the detector unit.
Processor 22 receives information on
radar signals from a microwave receiver, which includes a forward-facing
antenna horn 23a coupled to a
microwave receiver 24a, and a rearward-facing antenna horn 23b coupled to a
microwave receiver 24b. In one
embodiment, the microwave receivers may use the digital frequency synthesis
methods described in U.S. Patent
8,988,272. As illustrated, each antenna horn 23a and 23b may be coupled via
its own microwave path to a
common digital signal processing system (DSP) 26 for performing digital signal
identification and isolation in the
manner described in the '272 patent.
Receivers 24a and 24b are coupled to processor 22 via digital signal processor
(DSP) 26. Microwave
receiver 24 and DSP 26 may utilize any of the techniques known in the art for
detection of radar signals, for
rejecting noise, and increasing discrimination between actual and spurious
police radar signals. Further, receiver
24 and DSP 26 may be controlled by an optional second CPU 25, which can enable
additional signal evaluation
beyond that which is possible using a DSP.
Processor 22 is further connected to a laser detector 28 for detecting police
light detection and ranging
(LIDAR) signals. Laser detector 28 may be omnidirectional, or may include a
forward- facing detecting diode and a
rearward facing detecting diode to provide forward and rearward signal
strength information to processor 22.
Processor 22 is further connected to a GPS receiver 32 and/or a separate
differential GPS (DGPS) receiver 30,
such that differential GPS methodologies may be used where beacon signals are
available.
Processor 22 executes a stored program, found in integrated or off-chip
electrically erasable
programmable read only memory (EEPROM), flash memory, or masked read only
memory (ROM) 50.
The processor is programmed to manage and report detected signals in various
ways depending on
7
Date Regue/Date Received 2022-08-08
CA 03000392 2018-03-28
WO 2017/058906
PCT/US2016/054168
its stored program, including by one or more of the methods, operations, steps
and functions
described herein.
Processor 22 is coupled to a cellular interface 34 to permit social network
interaction with
servers and data from other radar detectors. In one embodiment, cellular
interface 34 comprises a
Bluetooth or other 802.1x compliant radio for connecting to a cellular phone,
smart phone, or other
cellular device, which may operate on the control of a separate application,
such as the assignee's
"Escort Live" smartphone app. In another embodiment, cellular interface 34 may
itself comprise a
cellular radio for direct connection to cell towers. Other communication
technologies may also be
used for social network interaction, such as satellite telephony, mesh
networking via wifi, Bluetooth,
.. 802.1x radio of other kinds, or other standards.
The radar detector further incorporates a user input keypad or switches 36.
Operational
commands are conveyed by the user to processor 22 via the keypad. Processor 22
is further coupled
with display 38, which comprises one or more light emitting diodes for
indicating various status
conditions, and an alphanumeric and graphical display for conveying detector
information to a user,
as will be described in more detail below. This display may be monochromatic,
but in embodiments
described below the display is a color display, e.g. using OLED technology, to
enhance the
information which may be presented. A speaker 40 is also provided to enable
processor 22 to deliver
audible feedback to a user under various alert conditions. Processor 22 may
further optionally
include a camera 42, positioned on a front-facing, side facing or rear facing
surface of the device,
.. and a video processor 44, for processing video or still images from camera
42.
In one example, processor 22 is further coupled to a Universal Serial Bus
(USB) interface 46
that provides a means for uploading and downloading information to and from
processor 22. USB
interface 46 may be used to automate the assimilation of coordinate
information into data
structures in memory 50. USB interface 46 may also be used to interface the
detector to a separate
host computer or product application containing a larger storage capacity than
available from
internal memory. USB interface 46 may also be used for the purposes of
firmware upgrades. From
time to time updates and bug fixes may become available, e.g. through a
manufacturer website. USB
interface 46 enables the user to apply the appropriate firmware upgrade or bug
fix. USB interface 46
may also be used to add other user waypoints.
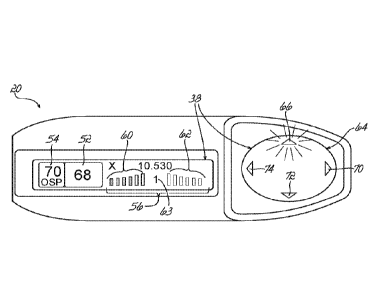
Referring now to the example of Fig. 2, a first mode for display 38 of radar
detector 20 will
now be described. In each of the exemplary modes described herein, display 38
is a multi-color
OLED and/or multi-color discrete LED's, having a number of different icons and
graphical symbols for
- 8 -
CA 03000392 2018-03-28
WO 2017/058906
PCT/US2016/054168
visually alerting the vehicle operator of detected radar signals, as well as
vehicular speed data. As
shown in Fig. 2, a speed indicator 52 on the display shows the current speed
or velocity of the
vehicle. An overspeed alert indicator 54 is located next to the speed
indicator 52. Overspeed alert
54 can be preset by the vehicle operator to provide a warning when the vehicle
travels over a
specified speed. If the vehicle travels at a speed in excess of the overspeed
limit preset in detector
20, the appearance of speed indicator 52 can change to alert the driver to the
excessive speed.
Display 38 further includes a combined signal band and strength panel 56 for
depicting or
displaying characteristics of a received radar signal, such as display band
and signal strength of a
received radar signal. Panel 56 includes a band indicator identifying a
particular band of one or
more received signals. The band type and frequency can optionally be displayed
on panel 56, as
shown for example by the "X" and "10.530" in Fig. 2. In the example of Fig. 2,
display 38 shows the
strength of a single, X-band radar signal originating from in front of the
vehicle. Panel 56 further
includes a graphical representation of signal strength, which can take any
number of forms such as,
for example, a bar graph as shown. One set of bars, shown at 60, indicates
signal strength in the
.. front of the vehicle, while a second set of bars 62 indicates signal
strength at the rear of the vehicle.
The individual bars may be illuminated to indicate strength, with an
increasing number of bars being
illuminated as the strength of the received signal increases. When the radar
detector 20 is aligned in
substantially the same direction as the motor vehicle in which it is mounted,
the direction of the
radar source relative to the detector is the same as that of the source
relative to the motor vehicle
(e.g., in front of, to the rear of, to the side of, etc.). In the exemplary
display mode of Fig. 2, the left
set of bars 60 is illuminated indicating that the detected signal is
originating from the front of the
vehicle. Finally, display panel 56 may include a source count 63, which
indicates the number of
sources being received. The source count is "1" in the example of Fig. 2,
indicating that only one
source is being received. In case more than one signal is received, the signal
strength information
presented in panel may be configured to represent the strongest signal in the
highest priority band,
where X is the lowest priority band, K is the medium priority band, and Ka and
Laser are the highest
priority, in one example.
In one example, display 38 may also include a source direction indicator 64,
which may for
example comprise four multi-color LEDs. Source direction indicator 64 visually
displays the direction
of a detected signal relative to the vehicle. In particular, referencing the
direction indicator 64, a
source direction can be determined relative to a vehicle in which the radar
detector is operating, as
discussed below in reference to Fig. 3.
- 9 -
CA 03000392 2018-03-28
WO 2017/058906
PCT/US2016/054168
In the example shown in Fig. 2, direction indicator 64 includes a first
directional arrow 66 for
indicating radar sources in front of the detector, a second directional arrow
70 for indicating sources
to the right of the detector, a third directional arrow 72 for indicating
sources located to the rear of
the detector and a fourth directional arrow 74 for indicating sources to the
left of the detector. In
operation, processor 22 will determine, based on the detected radar signals,
the control signals to
activate the correct one or more directional arrows 66, 70, 72, 74 of
direction indicator 64. The
directional arrows 66, 70, 72, 74 may be orthogonally-spaced, as shown in the
examples of Figures 2,
4, 5 and 6.
In one example, each of the directional arrows 66, 70, 72 and 74 may be
illuminated in
different colors such as but not limited to the colors of green, blue or red,
as selected to indicate the
radar band of the detected signal. For example, directional arrow 66 may be
illuminated in a green
color to indicate that an X-band signal is being detected predominantly from
the forward direction.
Similarly, a directional arrow may be illuminated in a blue color to indicate
that the detected signal is
in the K-band, and/or a directional arrow may be illuminated in a red color to
indicate that the
detected signal is in the Ka-band or is a laser signal. Additional colors may
be utilized to identify
additional detected radar bands or sub-bands, or to provide different colors
for detected signals in
the Ka and laser bands.
In one embodiment, four equally spaced source direction indicators 66, 70, 72,
74 are used
to show how the direction of the detected radar signal can be visualized in
the display panel. If
desired, the relative direction of the signal source may be indicated using
greater (or lesser)
numbers of directional arrows in order to depict the source direction with
greater specificity.
Referring to the example of Figs. 3 and 4, in one example a vehicle travels
forward from
position 90a through positions 90b and 90c, and the detector 20 detects a Ka
band police source 92
and an X band false source 94. At position 90a, both sources will be in front
of the vehicle, and
indicator 66 illuminates as seen in Fig. 4. Because Ka band is a higher
priority band, indicator 66 is
illuminated in a red color in one example. Furthermore, the strength of the Ka-
band source is
illustrated in area 60 of panel 56 of the display 38 in a red color. The Ka
band signal is additional
identified in panel 56 by the designation "Ka" and the frequency designation
"34.700". A number
"2" appears in the source count 63 to reflect that two signals are being
received.
As the vehicle continues moving to position 90b, the false source 94 will be
detected at
approximately equal strength from the front and rear, and thus will be
considered to be to the side
of the vehicle, while the police source 92 remains in front of the vehicle and
is detected
- 10-
CA 03000392 2018-03-28
WO 2017/058906
PCT/US2016/054168
predominantly from the front. In this circumstance, directional arrow 66
remains illuminated in a
red color to signify that a Ka-band signal is being detected from in front of
the vehicle, and the signal
strength and frequency of the Ka-band signal is presented in a red color in
area 60 of the display 38.
Thus, the illuminated directional arrow 66 is color matched with the bar graph
60 in panel 56. In this
manner, the directional arrows and display areas 60 and 62 provide a concise,
comprehensive visual
depiction of the source direction, strength and band of a detected radar
signal.
The X-band signal originating to the side of the vehicle is of lower priority
and thus, in one
embodiment, may not be reflected on the directional arrows, and similarly the
strength of the X-
band signal may not be presented in areas 60 and 62 because it is of lower
priority than the K-band
signal. The presence of the X-band signal will be notable, however, from the
presence of a "2" in the
source count area 63 in one example.
Continuing the scenario, when the vehicle reaches position 90c, the false
source 94 will be
detected predominantly behind the vehicle, while the police source 92 remains
in front of the
vehicle and is detected predominantly from the front. In this circumstance,
directional arrow 66
remains illuminated in a red color to signify that a Ka-band signal is being
detected from in front of
the vehicle, and the signal strength and frequency of the Ka-band signal is
presented in a red color in
area 60 of the display 38. Thus, the illuminated directional arrow 66 is color
matched with the bar
graph 60 in panel 56. In this manner, the directional arrows and display areas
60 and 62 provide a
concise, comprehensive visual depiction of the source direction, strength and
band of a detected
radar signal. Optionally, a letter "X" may be presented in area 61 of the
display to indicate that an
X band signal is originating from behind the vehicle, although its strength is
not being displayed.
Fig. 5 depicts another exemplary mode for display 38. In this embodiment, the
overspeed
alert has been replaced with a Bluetooth indicator 76, to indicate that the
radar detector has been
paired with a smart phone app, such as the assignee's "Escort Live" smart
phone app, but the app is
not presently communicating (e.g., the app has not been launched on the smart
phone). As before,
the speed at which the vehicle is traveling is shown in display area 52.
In the Fig. 5 embodiment, radar signals in both the Ka-band and X-band have
been detected,
as in the scenario described relative to Fig. 4. However, in this embodiment,
information relating to
both signal bands is displayed. Specifically, the bar graphs 60, 62 of the
Fig. 2 / Fig. 4 display modes
are replaced with bar graphs 80, 82 for each of the detected signals. Each bar
graph 80, 82 includes
two columns of bars for indicating the signal strength detected at the front
and the rear of the
vehicle, respectively. In the illustrated case, the Ka-band signal has been
detected at the front of the
- 11-
CA 03000392 2018-03-28
WO 2017/058906
PCT/US2016/054168
vehicle, as indicated by the illumination of the first column of bars in graph
80, with the number of
illuminated bars indicating the strength of the signal. The X-band signal has
been detected at the
side of the vehicle, as indicated by the illumination of both columns of bars
in graph 82. This is the
case which would occur, for example, at position 90b of Fig. 3. Each of the
bar graphs 80, 82 may be
illuminated in a color corresponding to the depicted band type, thus the bar
graphs 80 would be
depicted in a red color and the bar graphs 82 would be depicted in a green
color.
As shown in the example of Fig. 5, the direction of detection of both Ka-band
and X-band
signals is further visualized through the illumination of multiple directional
arrows in source
indicator 64. In the display, front directional arrow 66 is illuminated in
red, associated with the Ka-
band, to convey that the Ka-band signal source is in front of the vehicle, and
the side directional
arrows 70, 74 are illuminated in the color green, associated with the X-band,
to convey that the X-
band signal source is located at a side of the vehicle. In one embodiment, to
direct attention to the
highest priority band in the in indicator 64, the directional indicator for
the highest priority band may
blink; thus in the illustrated case indicator 66 would blink in a blue color.
Fig. 6 illustrates another example of a mode for display 38. Similar to Fig.
2, in this mode the
display shows signal strength information for only one signal, a single X-band
signal originating in
front of the vehicle. To indicate this information, the front bar graph 60 is
illuminated in the color
selected for indicating the X-band (e.g., green). Likewise, the forward
directional arrow 66 is
illuminated in the X-band color to show that an X-band signal as been detected
in front of the
vehicle. In addition to this information, the overspeed alert has been
replaced in this view with the
current posted speed limit, shown at 84. The posted speed limit can be
displayed when detector 20
has been paired with a smart phone app, as described above, and the app is
communicating ongoing
updates to processor 22, via interface 34, as the vehicle travels.
Figs. 2 and 4-6 display several exemplary modes for simultaneously informing a
user of the
source direction and band of a received signal using color and directional
arrows. Other exemplary
modes may also be used for combining signal source direction, band and
strength without departing
from the scope of the present disclosure. Furthermore, multi-band modes may be
used in display
panel 56 while signal-band modes are used on direction indicator 64, and vice-
versa.
In addition to the multi-band directional indicators described above, detector
20 of the
present disclosure may be configured to detect stationary false alert sources
with increased
accuracy. As described in the '905 patent referenced above, geographic
coordinates of marked false
sources are stored by processor 22 as tracking records in memory 50. Each of
these records includes
- 12 -
CA 03000392 2018-03-28
WO 2017/058906
PCT/US2016/054168
global positioning (GPS) coordinates of the location of the detected false
source as determined by
GPS receiver 32, and additional data such as the date/time that the source was
encountered,
counters for sub-bands or frequency blocks in each of the X, K and Ka bands,
and the like. In one
embodiment, further data on false alerts is captured, to allow the comparison
of false source
tracking records from multiple different paths of travel, either from the same
vehicle or from
multiple vehicles that are connected using a social network.
As in the detector described in the '905 patent, processor 22 gathers the
physical locations
of false signal detections, using physical locations determined from GPS
receiver 32. The signal
information from the radar detector including the detected signal band, and
the frequency block of
the detected signal are stored. Additionally, the detector records the travel
direction of the vehicle
at the point of false alert detection. This information is stored in memory 50
in the radar detector,
where it may be subsequently compared to other records. Furthermore, this
information may be
uploaded via a social network for combination with similar records from other
detectors. In one
embodiment, one particular location that may recorded in a tracking record is
the transition or mid-
ship point, when the signal from the stationary source transitions from the
front to the side of the
vehicle, before continuing to the rear of the vehicle; that is, the mid-ship
point is the center of the
area at which the side directional indicators 70, 74 are illuminated.
Referring again to the example of Fig. 3, as noted above, as a vehicle travels
in a first,
Northerly direction through position 90a, police source 92 and false source 94
will both be detected
as radar sources located in the front of the vehicle, and the front
directional arrow 66 will be
illuminated. As the vehicle reaches position 90b, approximately to the line 96
where the source 94 is
mid-ship of the vehicle, the police source 92 will continue to be detected in
front of the vehicle, but
the false source 94 will be detected as positioned at the side of the vehicle.
When this occurs,
processor 22 will read the geographic coordinates from GPS receiver 32 and
record those
coordinates as the mid-ship location of false source 94. This location data
will be recorded in a
tracking record in memory 50, along with the direction of travel of the
vehicle at the time that the
mid-ship point was reached. The frequency of the false source signal will also
be recorded in the
tracking record. On a return trip in the opposite, Southerly, direction, as
shown in Fig. 3, the
detector in the vehicle may reach point 90d, and may again note the mid-ship
location of the false
source 94 as the car crosses dashed line 96, and update the existing tracking
record, or create a
second tracking record, to further enhance the available information on the
physical location and
frequency of false source 94.
- 13 -
CA 03000392 2018-03-28
WO 2017/058906
PCT/US2016/054168
A given detector 20 will detect the same signal at the same geographic
coordinates and
frequency block multiple times, and take records of each encounter, before the
signal source is
marked as a false source or "locked out". The use of repeated encounters with
a stationary signal
source prior to marking the source as a false source is described in greater
detail in the '905 patent.
The records generated herein, however, further include a mid-ship point and
direction of travel for
that mid-ship point, which provide greater specificity regarding the false
source than was available in
the '905 patent.
When detector 20 is connected to a social network, such as the assignee's
"Escort Live"
smart phone software application, processor 22 may upload the tracking records
of the marked false
sources to a host server 48, either as those sources are being detected, or
after a source has been
repeatedly detected and marked false. Additional tracking records may also be
uploaded from other
radar detectors connected to the social network. The uploaded records can then
be compiled in a
database of multiple vehicle encounters with stationary radar sources. Host
server 48 shown in Fig.
1 includes a processor for performing a data analysis on the tracking records
to detect records
having similar geographic coordinates and frequency blocks. In particular, the
host processor flags
tracking records for false sources having similar frequency blocks and
location coordinates within a
specified physical area. For example, the host processor may compare records
having geographic
coordinates located within a /2 mile area. The host processor may then compare
the travel direction
of each vehicle that recorded data, as well as the frequency block and mid-
ship coordinates recorded
at each false source detection, in order to pinpoint more precisely the
physical location of the false
source.
Fig. 7 depicts another example of how the geographic coordinate data and
travel direction
can be used to more accurately determine the physical location of a false
alert source. As illustrated
in the example of Fig. 7, as a vehicle travels through positions 100a, 100b
and 100c past a likely false
source 94, a radar detector in the vehicle records position data for the
source, the frequency block,
and the direction of travel, (which is depicted as a Northerly direction), as
the vehicle passes a mid-
ship point indicated by dashed line 102. The radar detector in the vehicle
stores the data from the
encounter with source 94 in a tracking record that is held in memory and/or
uploaded to host server
48. Additional data for likely false source 94 may also recorded when the same
vehicle, or a second
vehicle also carrying a suitable radar detector consistent with the inventive
principles herein, passes
through position 100d. This second pass, in an Easterly direction, creates a
record of position data
for source 94 at the mid-ship point, indicated by dashed line 106, associated
with a direction of
travel in an Easterly direction. As shown in Fig. 7, as one or more vehicles
encounter the false source
- 14-
CA 03000392 2018-03-28
WO 2017/058906
PCT/US2016/054168
while traveling in various directions, additional tracking records for source
94 may be created,
recording the direction of travel along with the mid-ship coordinates and
frequency block of the
detected signal.
By comparing the tracking records obtained from multiple passes of source 94
by the same
vehicle in different directions, processor 22 may refine its understanding of
the location of source
94. Similarly, the host server 48 may combine tracking records from multiple
vehicles that pass
source 94 and detect and upload those records.
More specifically, the mid-ship coordinate detected by a pass of a false
source may be
combined with the direction of travel to create a mid-line for the location of
the source,
approximately represented by lines 102 and 106. The source can then be
pinpointed where the
midlines intersect, as shown by the intersection at source 94 of mid-ship
lines 102, 106. Notably, the
midlines from multiple encounters need not been a perpendicular angles, and
furthermore, data
from more than two passes at more than two directions may be averaged or
combined to pinpoint
the position of source 94 through triangulation. The intersection of midlines
coordinates from
multiple vehicles traveling in different directions, as shown in Fig. 7,
indicates a likely physical
location of a stationary false source, when the signals associated with the
position coordinates are
within the same frequency block.
The marked false source records from multiple vehicles can be continually
monitored and
compared by the host server. The host server can detect intersections within
the coordinate data
from multiple vehicles, and use the intersections to build a data store of
false alert source locations.
Because the false source locations will have been confirmed by comparing
coordinate data from
multiple vehicles, the actual physical location of the false source can be
more accurately estimated.
The false source locations can be continually monitored and updated within the
host computer, and
the location data made available for downloading and use by any radar detector
connected to the
social network. Using intersecting points of positional data from multiple
different radar detectors
enables accurate detection of the location of a fixed false source. Using the
multiple data points
allows for determining which side of a vehicle, as well as the distance from
the vehicle, that a false
alert source is located, thereby enabling more accurate detection and lockout
of false alert signals.
Thus, a vehicle traveling later in time, which has no prior experience with
the area of false source 94,
may be programmed via the social network to suppress or modify the alert to
source 94 when the
vehicle reaches points 104a or 104b and detects a signal with a frequency,
strength and/or direction
consistent with the false source 94.
- 15 -
CA 03000392 2018-03-28
WO 2017/058906
PCT/US2016/054168
Referring now to Figs. 8A and 8B, the example operations of processor 22 and
host server 48
are described in greater detail. Processor 22 performs a main loop of steps
during regular operation
of the radar detector to carry out the functions, operations, processes and
features of the present
disclosure. When processor 22 is initialized, i.e. when power is applied to
the GPS enabled radar
detector, the detector device is initialized in step 110. This initialization
step includes performing
diagnostic checks on the various circuitry illustrated in Fig. 1 to insure its
proper operation, as well as
initialization of the GPS receiver 32 to insure GPS signals can be received
accurately by processor 22.
At step 112, radar detection circuitry 24, 25 is accessed to obtain
information on radar signals
currently being received by the radar detector. If a radar signal is detected
in step 114, processor 22
uses position information from GPS receiver 32 in conjunction with the signal
information from
detection circuitry 24 to monitor the source direction of the signal in step
116. When the source
direction reaches a mid-ship point, as determined at step 120, the processor
records a current
location and travel direction in a tracking record at step 122, and records
the current strength
and/or frequency or frequency block in a tracking record in the tracking
record at step 124.
At step 126, processor 22 evaluates tracking records using the position
coordinates and the
frequency block of the detected signal to determine whether a source has
previously been identified
and marked at the location, and further, whether the source has been "locked
out". If not, control is
passed to operation 112. If the location is a marked false source, the
detector will suppress alerting
at that location. Furthermore, when the detector is connected to the social
network (step 128), the
processor 22 may upload the tracking records and/or the records of "locked
out" sources to host
server 48 (step 130). This may be done at the time the signal is determined to
be false and "locked
out", or at a suitable later time. If detector 20 is not connected to the
social network at the time a
record is created or updated, record may be stored in the detector memory for
later updating to the
social network, as indicated at step 132.
FIG. 8B illustrates examples of steps performed within host server 48 to
process marked
source tracking records from multiple vehicles in order to compile a data
store, database or data
cloud of marked false sources that are available to all of the detectors
connected to the social
network. Initially, host server 48 receives a tracking record from a detector
and stores the record in
the server, as indicated in steps 140 and 142. The host server performs an
analysis of the tracking
records, at step 144, as new tracking records are added to the data store in
order to identify new
false source locations. The host processor compares the frequency of the
detected signal to
frequencies of prior records, at step 146 to focus on radar sources emanating
signals in the same
frequency block. Next, for the sources having similar frequency, the processor
compares the travel
- 16 -
CA 03000392 2018-03-28
WO 2017/058906
PCT/US2016/054168
direction at step 150. For the tracking records having different travel
directions, the host processor
compares mid-ship coordinates and midlines, at step 152, to determine whether
there is an
intersection between the midlines (step 153). The host processor uses the
intersection point to
specify more precise coordinates for the false source at step 154. A check is
made at step 156 to
compare the previous data gathered at the intersection coordinates. If the
false source location is
new, a record of the false source is added to the data store at steps 160 and
162. If the false source
location had previously been identified, then the record of the false source
is updated at step 162.
At steps 164, 166, host server 48 provides the updated data store of false
source locations for
downloading to detectors connected through the social network. The individual
detectors may then
use the updated false alert source locations to lockout additional radar
sources, or to refine the
geographic location of a previously identified locked-out source.
Various embodiments of the present disclosure have been described and some of
those
embodiments have been elaborated in substantial detail. However, the scope of
the disclosure is
not to be limited by these embodiments which are presented as exemplary and
not exclusive. The
scope of the inventions being claimed is set forth by the following claims.
- 17 -