Note: Descriptions are shown in the official language in which they were submitted.
CA 03011242 2018-07-11
WO 2017/123214 PCT/US2016/013172
MULTI-PHASE CORIOLIS MEASUREMENT DEVICE AND METHOD
FIELD OF THE INVENTION
The present invention relates to flowmeters, and more particularly, to
Coriolis-
based measurement methods that provide continuous monitoring and greater
accuracy in
quantitative and qualitative measurements of multi-phase fluid flow.
BACKGROUND
Vibrating conduit sensors, such as Coriolis mass flowmeters and vibrating
densitometers, typically operate by detecting motion of a vibrating conduit
that contains
a flowing material. Properties associated with the material in the conduit,
such as mass
flow, density and the like, can be determined by processing measurement
signals
received from motion transducers associated with the conduit. The vibration
modes of
the vibrating material-filled system generally are affected by the combined
mass,
stiffness, and damping characteristics of the containing conduit and the
material
contained therein.
A typical Coriolis mass flowmeter includes one or more conduits (also called
flow tubes) that are connected inline in a pipeline or other transport system
and convey
material, e.g., fluids, slurries, emulsions, and the like, in the system. Each
conduit may
be viewed as having a set of natural vibration modes, including for example,
simple
bending, torsional, radial, and coupled modes. In a typical Coriolis mass flow
measurement application, a conduit is excited in one or more vibration modes
as a
material flows through the conduit, and motion of the conduit is measured at
points
spaced along the conduit. Excitation is typically provided by a driver, e.g.,
an
electromechanical device, such as a voice coil-type actuator, that perturbs
the conduit in
a periodic fashion. Mass flow rate may be determined by measuring time delay
or phase
differences between motions at the transducer locations. Two or more such
transducers
(or pickoff sensors) are typically employed in order to measure a vibrational
response of
the flow tube or conduits, and are typically located at positions upstream and
downstream of the driver. Instrumentation receives signals from the pickoff
sensors and
processes the signals in order to derive a mass flow rate measurement.
1
CA 03011242 2018-07-11
WO 2017/123214 PCT/US2016/013172
Flowmeters are used to perform mass flow rate measurements for a wide variety
of fluid flows. One area in which Coriolis flowmeters can potentially be used
is in the
metering of oil and gas wells. The product of such wells can comprise a
multiphase
flow, including the oil or gas, but also including other components, such as
water and/or
solids, for example. It is, of course, highly desirable that the resulting
metering be as
accurate as possible, even for such multiphase flows.
Coriolis meters offer high accuracy for single phase flows. However, when a
Coriolis flowmeter is used to measure aerated fluids or fluids including
entrained gas,
the accuracy of the meter can be degraded. This is similarly true for flows
having
entrained solids and for mixed-phase fluid flows, such as when hydrocarbon
fluids
contain water.
Entrained gas is commonly present as bubbles in the flow material. The size of
the bubbles can vary, depending on the amount of gas present, the pressure of
the flow
material, and the temperature. The extent of the decrease in performance is
not only
related to how much total gas is present, but also to the size of the
individual gas
bubbles in the flow. The size of the bubbles may affect the accuracy of the
measurement.
A related, yet significant, source of error arises from fluid decoupling.
Fluid
decoupling results from the motion of the gas bubbles with respect to the
liquid as a
result of the vibration of the tube. The relative motion of the gas bubbles
with respect to
the liquid is driven by a buoyant force that is similar to the force that
causes bubbles to
rise to the surface under the influence of gravity. However, in a vibrating
tube, it is the
acceleration of the vibrating tube that causes the bubbles to move more than
the
acceleration of gravity. Because the dense fluid resists the acceleration more
strongly
than the light bubbles, the bubbles are accelerated in the same direction as
the tube
acceleration. The bubbles thus move faster and further than the flow tube and
the bubble
motion causes some of the fluid to move more slowly than the flow tube. This
is the
basis of the decoupling problem. As a result, the fluid that has the lower
vibrational
amplitude undergoes less Coriolis acceleration and imparts less Coriolis force
on the
flow tube than it would in the absence of bubbles. This results in the flow
rate and
density characteristics being under-reported (negative flow and density
errors) when
entrained gas is present. Compensating for fluid decoupling has been difficult
because
2
CA 03011242 2018-07-11
WO 2017/123214 PCT/US2016/013172
there are several factors that determine how much the bubbles move with
respect to the
fluid. Fluid viscosity is an obvious factor. In a very viscous fluid, bubbles
(or particles)
are effectively frozen in place in the fluid and little flow error results.
Another influence
on bubble mobility is the bubble size. The drag on a bubble is proportional to
the surface
area, whereas the buoyant force is proportional to the volume. Therefore, very
small
bubbles have a high drag-to-buoyancy ratio and tend to move with the fluid.
Small
bubbles subsequently cause small errors. Conversely, large bubbles tend not to
move
with the fluid and result in large errors. The same holds true for particles.
Small particles
tend to move with the fluid and cause small errors.
The density difference between the fluid and the gas is another factor that
may
contribute to flowmeter inaccuracy. The buoyant force is proportional to the
difference
in density between the fluid and the gas. A high pressure gas can have a high
enough
density to affect the buoyant force and reduce the decoupling effect. In
addition, large
bubbles occupy more volume, leading to true fluctuations in the density of the
flow
material. Due to the compressibility of a gas, the bubbles can change in gas
quantity and
yet not necessarily change in size. Conversely, if the pressure changes, the
bubble size
can correspondingly change, expanding as the pressure drops or shrinking as
the
pressure increases. This can also cause variations in the natural or resonant
frequency of
the flowmeter and thus variations in the actual two-phase density.
Overall, when a Coriolis meter experiences the onset of multi-phase flow, the
sensor tube vibration is damped, resulting in the diminishment of flow tube
vibratory
amplitude. Typically, meter electronics compensate for this diminished
amplitude by
increasing the drive energy, or drive gain, in order to restore the amplitude.
There is,
however, a ceiling, as the maximum drive energy is limited for safety and
other reasons.
Therefore, as multi-phase flow becomes more pronounced, the relative
measureable
drive amplitude diminishes, which can no longer be augmented, as the driver is
already
performing at 100% drive gain. At this point, the meter electronics will
continue to drive
the tube vibration with diminished amplitude. In cases where multi-phase flow
is even
more severe, the amplitude of vibration becomes up to, and even greater than,
an order
of magnitude less than for single-phase flow. When this happens, the Coriolis
transmitter has difficulty in locking onto the primary natural frequency of
the sensor
tubes and the density accuracy suffers, and often results in measurements that
are less
3
CA 03011242 2018-07-11
WO 2017/123214 PCT/US2016/013172
than the actual values. Decreases in tube amplitude also affect the mass
measurement
of the Coriolis meter. Since the flow tube' s motion is attenuated, so are the
Coriolis
forces acting on the tube, which results in an under-measure of the mass flow
rate of the
gas-liquid mixture.
There remains a need in the art for a vibratory flowmeter that mitigates
problems
associated with increased drive gain due to multi-phase flow. There is a need
to adjust
flowmeter operation to tailor for differing types of multi-phase flow.
Embodiments
herein provide a flowmeter and related methods for determining when
trustworthy
readings are made. Embodiments herein provide a flowmeter and related methods
for
differentiating between types of multi-phase flow, and calculating flow
accordingly.
Embodiments herein provide a flowmeter and related methods that compensate for
under-read factors associated with multiphase flow. Thus, advances in the art
are made.
SUMMARY OF THE INVENTION
A method for improving flowmeter reliability is provided according to an
embodiment. The flowmeter comprises at least one flow tube, at least one
pickoff
sensor attached to the flow tube, at least one driver attached to the flow
tube, and meter
electronics in communication with the at least one pickoff sensor and driver.
The
method comprises vibrating at least one flow tube in a drive mode vibration
with the at
least one driver and receiving a sensor signal based on a vibrational response
to the
drive mode vibration from the at least one pickoff sensor. At least one flow
variable is
calculated. A pickoff sensor voltage is measured, and it is determined whether
the
pickoff sensor voltage is below a predetermined voltage threshold. The at
least one flow
variable is corrected during periods wherein the pickoff sensor voltage is
below the
predetermined voltage threshold.
Meter electronics for a flowmeter configured to improve measurement
reliability
is provided according to an embodiment. The flowmeter comprises at least one
flow
tube, at least one pickoff sensor attached to the at least one flow tube, and
at least one
driver attached to the flow tube. The meter electronics are in communication
with the at
least one pickoff sensor and the at least one driver, and is configured to
vibrate at least
one flow tube in a drive mode vibration with the at least one driver, and
receive a sensor
signal based on a vibrational response to the drive mode vibration from the at
least one
4
CA 03011242 2018-07-11
WO 2017/123214 PCT/US2016/013172
pickoff sensor. The meter electronics is also configured to calculate at least
one flow
variable, measure a pickoff sensor voltage, and determine whether the pickoff
sensor
voltage is below a predetermined voltage threshold. The at least one flow
variable is
corrected during periods wherein the pickoff sensor voltage is below the
predetermined
voltage threshold.
ASPECTS OF THE INVENTION
A method for improving flowmeter reliability is provided according to an
aspect.
The flowmeter comprises at least one flow tube, at least one pickoff sensor
attached to
the flow tube, at least one driver attached to the flow tube, and meter
electronics in
communication with the at least one pickoff sensor and driver. The method
comprises:
vibrating at least one flow tube in a drive mode vibration with the at least
one driver;
receiving a sensor signal based on a vibrational response to the drive mode
vibration
from the at least one pickoff sensor; calculating at least one flow variable;
measuring a
pickoff sensor voltage; determining whether the pickoff sensor voltage is
below a
predetermined voltage threshold; and correcting the at least one flow variable
during
periods wherein the pickoff sensor voltage is below the predetermined voltage
threshold.
Preferably, flow variables comprise at least one of: mass flow, volume flow,
density, and water cut.
Preferably, the water cut is measured with a water cut analyzer in
communication
with the meter electronics.
Preferably, the method comprising correcting the at least one flow variable
during periods wherein the pickoff sensor voltage is below the predetermined
voltage
threshold comprises an averaging.
Preferably, the averaging comprises the steps of: determining a point
immediately prior to when the pickoff sensor voltage fell below the
predetermined
voltage threshold and determining a first at least one flow variable at this
point;
determining a point wherein the pickoff sensor voltage returned above the
predetermined voltage threshold and determining a second at least one flow
variable at
this point; and calculating an average of the first and second at least one
flow variables.
5
CA 03011242 2018-07-11
WO 2017/123214 PCT/US2016/013172
Preferably, the method comprises the steps of: correlating the pickoff sensor
voltage with at least one of a mass flow rate under-read and a density under-
read;
deriving an under-read correction factor based on the correlation; and
applying the
under-read correction factor to the at least one flow variable.
Preferably, the method comprises the steps of: determining whether a fluid
flow
through the flowmeter is a multi-phase flow comprising predominantly a gas;
determining whether a fluid flow through the flowmeter is a multi-phase flow
comprising predominantly a liquid; applying a predominantly gas flow routine
of the
meter electronics if the fluid flow through the flowmeter is a multi-phase
flow
comprising predominantly a gas; and applying a predominantly liquid flow
routine of
the meter electronics if the fluid flow through the flowmeter is a multi-phase
flow
comprising predominantly a liquid.
Preferably, the method comprises the steps of: measuring a mass flow rate and
a
bulk density with the flowmeter; determining a gas density from a measured
temperature, pressure, and gas composition; empirically determining a liquid
density;
and determining volumetric gas flow rate, volumetric liquid flow rate, and gas
void
fraction from the mass flow rate, the bulk density, the gas density, and the
liquid
density.
Preferably, the method comprises the steps of: determining a Lockhart-
Martinelli
parameter; and determining a mass flow rate of a gas phase and a mass flow
rate of a
liquid phase.
Preferably, the method comprises the steps of: determining whether the liquid
comprises water; measuring liquid density with a water cut analyzer;
determining the
volumetric flow rate of an oil; and determining the volumetric flow rate of
the liquid.
Meter electronics for a flowmeter configured to improve measurement
reliability
are provided according to an aspect. The flowmeter comprises: at least one
flow tube; at
least one pickoff sensor attached to the at least one flow tube; and at least
one driver
attached to the flow tube, wherein the meter electronics are in communication
with the
at least one pickoff sensor and the at least one driver. The meter electronics
are
configured to: vibrate at least one flow tube in a drive mode vibration with
the at least
one driver; receive a sensor signal based on a vibrational response to the
drive mode
vibration from the at least one pickoff sensor; calculate at least one flow
variable;
6
CA 03011242 2018-07-11
WO 2017/123214 PCT/US2016/013172
measure a pickoff sensor voltage; determine whether the pickoff sensor voltage
is below
a predetermined voltage threshold; and correct the at least one flow variable
during
periods wherein the pickoff sensor voltage is below the predetermined voltage
threshold.
Preferably, the flow variables comprise at least one of: mass flow, volume
flow,
density, and water cut.
Preferably, the water cut is measured with a water cut analyzer in
communication
with the meter electronics.
Preferably, the meter electronics are configured to average at least one flow
variable during periods wherein the pickoff sensor voltage is below the
predetermined
voltage threshold.
Preferably, the average comprises the calculated average of a first and a
second
flow variable, wherein: the first flow variable is a pickoff sensor voltage
value
determined at a point immediately prior to when the pickoff sensor voltage
falls below
the predetermined voltage threshold; and the second flow variable is a pickoff
sensor
voltage value determined at a point immediately after the pickoff sensor
voltage returns
above the predetermined voltage threshold.
Preferably, the pickoff sensor voltage is correlated with at least one of a
mass
flow rate under-read and a density under-read, wherein the meter electronics
is
configured to derive an under-read correction factor based on the correlation,
and the
under-read correction factor is applied to the at least one flow variable.
Preferably, the meter electronics is configured to: determine whether a fluid
flow
through the flowmeter is a multi-phase flow comprising predominantly a gas;
determine
whether a fluid flow through the flowmeter is a multi-phase flow comprising
predominantly a liquid; apply a predominantly gas flow routine of the meter
electronics
if the fluid flow through the flowmeter is a multi-phase flow comprising
predominantly
a gas; and apply a predominantly liquid flow routine of the meter electronics
if the fluid
flow through the flowmeter is a multi-phase flow comprising predominantly a
liquid.
Preferably, the meter electronics is configured to: measure a mass flow rate
and a
bulk density with the flowmeter; determine a gas density from a measured
temperature,
pressure, and gas composition; empirically determine a liquid density; and
determine a
7
CA 03011242 2018-07-11
WO 2017/123214 PCT/US2016/013172
volumetric gas flow rate, a volumetric liquid flow rate, and a gas void
fraction from the
mass flow rate, the bulk density, the gas density, and the liquid density.
Preferably, the meter electronics is configured to: determine a Lockhart-
Martinelli parameter; and determine a mass flow rate of a gas phase and a mass
flow
rate of a liquid phase.
Preferably, the meter electronics is configured to: determine whether the
liquid
comprises water; measure the liquid density with a water cut analyzer;
determine the
volumetric flow rate of an oil; and determine the volumetric flow rate of the
liquid.
BRIEF DESCRIPTION OF THE DRAWINGS
FIG. 1 illustrates a flowmeter comprising a meter assembly and meter
electronics.
FIG. 2 shows a block diagram of the meter electronics according to an
embodiment.
FIG. 3 illustrates a graph of an implementation of an embodiment.
FIG. 4 illustrates a graph of an implementation of yet another embodiment.
DETAILED DESCRIPTION OF THE INVENTION
FIGS. 1-4 and the following description depict specific examples to teach
those
skilled in the art how to make and use the best mode of the invention. For the
purpose of
teaching inventive principles, some conventional aspects have been simplified
or
omitted. Those skilled in the art will appreciate variations from these
examples that fall
within the scope of the invention. Those skilled in the art will appreciate
that the
features described below can be combined in various ways to form multiple
variations
of the invention. As a result, the invention is not limited to the specific
examples
described below, but only by the claims and their equivalents.
FIG. 1 shows a vibratory flowmeter 5 according to an embodiment. The
flowmeter 5 comprises a sensor assembly 10 and meter electronics 20 coupled to
the
sensor assembly 10. The sensor assembly 10 responds to at least mass flow rate
and
density of a process material. The meter electronics 20 is connected to the
sensor
assembly 10 via leads 100 to provide density, mass flow rate, and temperature
information over a communication link 26, as well as other information. A
Coriolis
8
CA 03011242 2018-07-11
WO 2017/123214 PCT/US2016/013172
flowmeter structure is described although it is apparent to those skilled in
the art that the
present invention could also be operated as a vibrating tube densitometer.
The sensor assembly 10 includes manifolds 150 and 150', flanges 103 and 103'
having flange necks 110 and 110', parallel flow tubes 130 and 130', first and
second
drivers 180L and 180R, and first and second pickoff sensors 170L and 170R (for
brevity, the drivers and pickoff sensors may herein be collectively referred
to as
"transducers"). The first and second drivers 180L and 180R are spaced apart on
the one
or more flow tubes 130 and 130'. In some embodiments, there is only a single
driver.
In addition, in some embodiments, the sensor assembly 10 may include a
temperature
sensor 190. The flow tubes 130 and 130' have two essentially straight inlet
legs 131 and
131' and outlet legs 134 and 134' which converge towards each other at the
flow tube
mounting blocks 120 and 120'. The flow tubes 130 and 130' bend at two
symmetrical
locations along their length and are essentially parallel throughout their
length. The
brace bars 140 and 140' serve to define the axis W and the substantially
parallel axis W'
about which each flow tube oscillates. It should be noted that in an
embodiment, the
first driver 180L may be collocated with the first pickoff sensor 170L, the
second driver
180R may be collocated with the second pickoff sensor 170R.
The side legs 131, 131', 134, 134' of the flow tubes 130 and 130' are fixedly
attached to flow tube mounting blocks 120 and 120' and these blocks, in turn,
are fixedly
attached to the manifolds 150 and 150'. This provides a continuous closed
material path
through the sensor assembly 10.
When the flanges 103 and 103', having holes 102 and 102' are connected, via
the
inlet end 104 and the outlet end 104' into a process line (not shown) which
carries the
process material that is being measured, material enters an inlet end 104 of
the
flowmeter 5 through an orifice 101 in the flange 103 and is conducted through
the
manifold 150 to the flow tube mounting block 120. Within the manifold 150, the
material is divided and routed through the flow tubes 130 and 130'. Upon
exiting the
flow tubes 130 and 130', the process material is recombined in a single stream
within
the manifold 150' and is thereafter routed to the outlet end 104' connected by
the flange
103' having bolt holes 102' to the process line (not shown) via orifice 101'.
The flow
fluid can comprise a liquid. The flow fluid can comprise a gas. The flow fluid
can
9
CA 03011242 2018-07-11
WO 2017/123214 PCT/US2016/013172
comprise a multi-phase fluid, such as a liquid including entrained gases
and/or entrained
solids; or a gas including entrained liquids.
The flow tubes 130 and 130' are selected and appropriately mounted to the flow
tube mounting blocks 120 and 120' so as to have substantially the same mass
distribution, moments of inertia, and Young's modulus about the bending axes W-
-W
and W'--W', respectively. These bending axes go through the brace bars 140 and
140'.
Inasmuch as the Young's modulus of the flow tubes change with temperature, and
this
change affects the calculation of flow and density, the temperature sensor
190, which
may be a resistive temperature detector (RTD), is mounted to a flow tube 130,
130' to
continuously measure the temperature of the flow tube 130, 130'. The
temperature-
dependent voltage appearing across the temperature sensor 190 may be used by
the
meter electronics 20 to compensate for the change in the elastic modulus of
the flow
tubes 130 and 130' due to any changes in flow tube temperature. The
temperature
sensor 190 is connected to the meter electronics 20 by lead 195.
The flow tubes 130, 130' are typically driven by the driver 180L, 180R in
opposite directions about the respective bending axes W and W' and at what is
termed
the first out of phase bending mode of the vibratory flowmeter 5. The driver
180L,
180R may comprise one of many well-known arrangements, such as a magnet
mounted
to the flow tube 130 and an opposing coil mounted to a proximate flow tube
130'. An
alternating current is passed through the opposing coil to cause both flow
tubes 130,
130' to oscillate. A suitable drive signal is applied by the meter electronics
20 to the
driver 180L, 180R. Other driver devices are contemplated and are within the
scope of
the description and claims.
The meter electronics 20 receives sensor signals from the sensor assembly 10,
and also produces a drive signal which causes a driver 180L, 180R to oscillate
the flow
tubes 130, 130'. Other sensor devices are contemplated and are within the
scope of the
description and claims.
The meter electronics 20 processes the left and right velocity signals from
the
pick-off sensors 170L, 170R in order to compute a flow rate, among other
things. The
communication link 26 provides an input and an output means that allows the
meter
electronics 20 to interface with an operator or with other electronic systems.
CA 03011242 2018-07-11
WO 2017/123214 PCT/US2016/013172
In one embodiment, the flow tubes 130, 130' comprise substantially U-shaped
flow tubes, as shown. Alternatively, in other embodiments, the flowmeter 5 can
comprise substantially straight flow tubes 130, 130'. Additional flowmeter
shapes
and/or configurations can be used and are within the scope of the description
and claims.
The description of FIG. 1 is provided merely as an example of the operation of
a
flow metering device, and is not intended to limit the teaching of the present
invention.
FIG. 2 illustrates meter electronics 20 of the flowmeter 5 according to an
embodiment of the invention. The meter electronics 20 can include an interface
201 and
a processing system 203. The meter electronics 20 receives transducer signals
from the
sensor assembly 10, such as pickoff sensor 170L, 170R signals, for example
without
limitation. The meter electronics 20 processes sensor signals in order to
obtain flow
characteristics of the flow material flowing through the sensor assembly 10.
For
example, the meter electronics 20 can determine one or more of a phase
difference, a
frequency, a time difference (At), a density, a mass flow rate, a strain, and
a volume
flow rate from the sensor signals. In addition, other flow characteristics may
be
determined in some embodiments.
The interface 201 receives the sensor signals from the transducers via the
leads
100 illustrated in FIG. 1. The interface 201 can perform any necessary or
desired signal
conditioning, such as any manner of formatting, amplification, buffering, etc.
Alternatively, some or all of the signal conditioning can be performed in the
processing
system 203.
In addition, the interface 201 can enable communications between the meter
electronics 20 and external devices, such as through the communication link
26, for
example. The interface 201 can be capable of any manner of electronic,
optical, or
wireless communication.
The interface 201 in one embodiment includes a digitizer 202, wherein the
sensor
signal comprises an analog sensor signal. The digitizer 202 samples and
digitizes the
analog sensor signal and produces a digital sensor signal. The
interface/digitizer
201/202 can also perform any needed decimation, wherein the digital sensor
signal is
decimated in order to reduce the amount of signal processing needed and to
reduce the
processing time.
11
CA 03011242 2018-07-11
WO 2017/123214 PCT/US2016/013172
The processing system 203 conducts operations of the meter electronics 20 and
processes flow measurements from the sensor assembly 10. The processing system
203
executes one or more processing routines and thereby processes the flow
measurements
in order to produce one or more flow characteristics.
The processing system 203 can comprise a general purpose computer, a
microprocessing system, a logic circuit, or some other general purpose or
customized
processing device. The processing system 203 can be distributed among multiple
processing devices. The processing system 203 can include any manner of
integral or
independent electronic storage medium, such as the storage system 204.
The processing system 203 is configured to retrieve and execute stored
routines
in order to operate the flowmeter 5. The storage system 204 can store routines
including
a general flowmeter routine 205, a predominantly gas flow routine 220, a
predominantly
liquid flow routine 222, a gain routine 224, and correction routine 226. The
processing
system 203 can determine at least a magnitude, phase difference, time
difference, and a
frequency of transducer signals.
Other measurement/processing routines are
contemplated and are within the scope of the description and claims. The
storage system
204 can store measurements, received values, working values, and other
information. In
some embodiments, the storage system may store any one or more of a mass flow
(Th)
210, a density (p) 212, a viscosity (u) 214, a temperature (T) 216, other
values known in
the art, and products thereof, for example without limitation. The flowmeter
routine 205
can produce and store fluid and flow measurements. These values can comprise
substantially instantaneous measurement values or can comprise totaled or
accumulated
values, and may also comprise databases and lookup tables. For example, the
flowmeter
routine 205 can generate mass flow measurements and store such measurements in
the
storage system 204. The flowmeter routine 205 can generate density
measurements and
store them in the storage system 204. Other measurements are contemplated to
be
similarly generated and stored in the storage system, as will be appreciated
by one
skilled in the art. The mass flow 210 and density 212 values are determined
from the
transducer response, as previously discussed and as known in the art. The mass
flow 210
can comprise a substantially instantaneous mass flow rate value, can comprise
a mass
flow rate sample, can comprise an averaged mass flow rate over a time
interval, or can
comprise an accumulated mass flow rate over a time interval. The time interval
may be
12
CA 03011242 2018-07-11
WO 2017/123214 PCT/US2016/013172
chosen to correspond to a block of time during which certain fluid conditions
are
detected, for example, a liquid-only fluid state, or alternatively a fluid
state including
liquids and entrained gas. In addition, other mass flow quantifications are
contemplated
and are within the scope of the description and claims.
In an embodiment, flow is sensed by directly measuring the relative motion of
the outlet 134, 134' (or inlet 131, 131') side of a flowtube 130, 130' with
respect to the
inlet 131, 131' (or outlet 134, 134') side of the same flowtube 130, 130'.
During fluid
flow, signal outputs typically have an amplitude that is a function of flow
rate (which
corresponds to the mode shape gaining complexity, i.e. inlet/outlet phase, due
to flow).
In related embodiments, combined signals from one or more transducers on the
inlet
side of a meter and the combined signals from one or more transducers on the
outlet side
of the meter are input into the meter electronics. A phase measurement may be
derived
from the inlet and outlet signals.
In some circumstances, such as for direct wellhead measurement, for example,
the ability to continuously measure a well is desirable, as the information
gleaned is
vital for operational and management decisions.
Unfortunately, often such
measurements are difficult, for the presence of multiple components such as
entrained
gas, variable flow rates, and high watercuts render measurements unreliable.
In an embodiment, flow tube 130, 130' amplitude can be measured by the sensor
assembly 10 via the pickoff sensor 170L most proximate the flowmeter 5 inlet.
As this
pickoff sensor's signal falls below a certain threshold, the uncertainty of
the mass flow
rate and the uncertainty of the mixture density is generally too great to be
considered a
reliable measurement. The threshold for which a signal is considered
unreliable may be
different for mass rate measurements and density measurements, for example. As
a
multiphase flow is produced through a Coriolis sensor, such as from an oil and
gas well,
there are often periods of non-measureable flow and periods of measureable,
homogenous, flow. The measurable periods are typically characterized by low
gas void
fraction (GVF) flow in predominantly liquid flow and a low Lockhart-Martinelli
(LM)
parameter in wet gas flow. The LM is a dimensionless number used in two-phase
flow
calculations, and expresses the liquid fraction of a flowing fluid. See
Proposed
Correlation of Data for Isothermal Two Phase Flow, Two Component Flow in Pipes
Lockhart, R.W., Martinelli, R.C.; Chem. Eng. Prog., Vol. 45. 1949, pp. 39-48,
which is
13
CA 03011242 2018-07-11
WO 2017/123214 PCT/US2016/013172
incorporated by reference herein. During these periods of relatively
homogenous flow,
the mass flow and density error may be low enough to be acceptable for
generating
reliable measurements. It should be noted that these periods would also
correspond to
flow tube 130, 130' amplitudes above a pre-determined threshold.
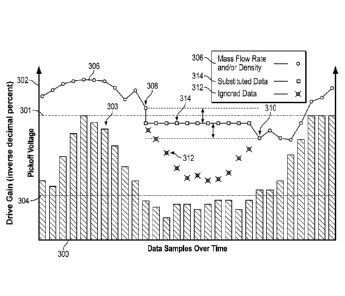
Turning to FIG. 3, an illustration of a flowmeter 5 determining a mass flow
rate
or density through periods of non-homogenous flow according to an embodiment
is
presented. The x-axis 300 represents data samples taken over a course of time,
while
the y-axis 302 represents a pickoff sensor voltage or the inverse of drive
gain, where
drive gain is an inverse decimal percentage. Each data sample is represented
by a bar
303. The reported mass flow rate and/or density is shown by line 306. A dashed
line
304 indicates a pre-determined pickoff voltage threshold or inverse drive gain
threshold.
Starting from the origin, it is clear that the first ten data points have a
voltage or inverse
drive gain that is above the voltage or inverse drive gain threshold 304.
However, the
eleventh data point represents the first of eleven data points below the
voltage or inverse
drive gain threshold 304. The first of these corresponding mass flow rate
and/or density
values below the voltage or inverse drive gain threshold 304 is indicated by
arrow 308,
while the first data point after the mass flow rate and/or density value that
corresponds
with a data point above the voltage or inverse drive gain threshold 304 is
indicated by
arrow 310.
In an embodiment, the meter electronics 20 receives mass flow, density,
temperature, and tube amplitude signals, for example without limitation, from
the sensor
assembly 10. A mass flow rate, and/or density is calculated. However, in an
embodiment, mass flow and/or density readings that correspond to tube
amplitudes or
inverse drive gains below the operator-entered threshold(s) are ignored in
calculations.
In FIG. 3, this would correspond to the data points starting at the point
indicated by
arrow 308 to the data point prior to the point indicated by arrow 310. In an
embodiment, the values for mass flow and density during these periods could be
substituted by an operator-entered set value. In another embodiment, the
values for
mass flow and density during these periods may be estimated. In a related
embodiment,
an average mass flow and/or density is provided. For example, a value provided
may be
the average between the value immediately prior to when the measured
transducer
amplitude dipped below the predetermined voltage or inverse drive gain
threshold 304
14
CA 03011242 2018-07-11
WO 2017/123214 PCT/US2016/013172
(point indicated by arrow 308) and the value when the measured transducer
amplitude or
inverse drive gain returned back above the predetermined voltage threshold 304
(point
indicated by arrow 310). This is illustrated in FIG. 3, as the ignored data
312 is
substituted by substitute data 314. These and other methods/calculations for
averaging
or substituting data are contemplated, and may be stored in meter electronics
20.
An embodiment is provided for accommodating situations of predominantly gas
having an entrained liquid therein. As an example, for oilfield application,
the entrained
liquid in natural gas may be mostly water, mostly condensate (or crude oil),
or a mixture
of both. In an embodiment encompassing non-mixture cases, the solution noted
above,
and related to FIG. 3, is appropriate. For this type of wet gas flow, the
meter electronics
may be configured to ignore multi-phase flow, and simply utilize substitute
Coriolis
values for periods where transducer amplitude or inverse drive gain readings
are low.
In an embodiment, for example without limitation, the following equations may
be utilized to determine the volume of the gas fraction and the volume of
liquid fraction:
15 Th = ((Vas Pgas ) (1.71iquid Pliquid))
(1)
Where:
Th, = mass flow rate
Vgas = Volumetric flow rate of gas
Pgas = Density of gas
20 Vliquid = Volumetric flow rate of liquid
Pliquid = Density of liquid
GVF ¨ PB- P liquid (2)
Pgas- P liquid
Where:
GVF = Gas void fraction
pB = Bulk density
GVF ¨ . Vas _g. (3)
V gas+ Vliquid
15
CA 03011242 2018-07-11
WO 2017/123214 PCT/US2016/013172
With reference to expressions (1)-(3), Th, and pB are values derived from the
flowmeter 5. The pgas is derived from temperature, pressure, gas composition,
and
well-known American Gas Association (AGA) equations. The piiquid is known from
empirical measurements. This leaves 1.4g-
- as, I.7liquid, and GVF as unknowns, which may
therefore be solved for.
For an embodiment having primarily-liquid flow with entrained gas, it is
possible
to determine a mathematic relationship between pickoff voltage and/or drive
gain and
GVF directly by previous empirical testing. By using expressions (1) and (3),
1as,
I.7liquid may be solved for using this alternate method.
In a related embodiment, for wet gas flow situations, the following equations
may additionally be utilized:
LAI _ ?illiquid Pgas (4)
.\Ilitgas Pliquid
Where:
LM = Lockhart-Martinelli parameter
?Illiquid = mass flow rate of liquid
Tilgas = mass flow rate of gas
in = ?Illiquid + Thgas (5)
Utilizing expressions (4) and (5) in conjunction with expressions (1)-(3)
allows,
with prior testing of a Coriolis sensor, the utilization of LM. This known
variable may
therefore be used to determine the iftgas and ?illiquid. Typically, the pgas
would be
determined as above using temperature, pressure, gas composition, and AGA
equations.
The piiquid would be entered by the operator. As noted above, in is the mass
flow rate
as derived from the flowmeter 5. This yields two equations with two unknowns¨
?illiquid and Mgas. In an embodiment, commonly used standard volume flow rates
may
be derived by dividing the mass rates by their base densities. This algorithm,
utilizing
the LM relationship for determining Mliquid and Mgõ would be used in the case
of
predominantly-gas mixtures.
16
CA 03011242 2018-07-11
WO 2017/123214 PCT/US2016/013172
So that this multiphase measurement system can distinguish between
predominantly-gas and predominantly-liquid flows, and still apply the correct
empirical
algorithms for the solution of determining the volume flows of liquid and gas,
a simple
relationship between density and Lockhart-Martinelli numbers, and density and
GVF is
utilized. In the case of predominantly gas, the measured Coriolis density
would need to
be below a certain value corresponding to the measureable upper value of LM
established by empirical testing. This density would be dependent on the
flowing
pressure of the system.
In the case of predominantly-liquid flows, the relationship between the
measured
Coriolis density and the measureable upper threshold of GVFs must be
determined
empirically. This density would also be dependent on the flowing pressure of
the
system. If it is determined that the Coriolis density at the flowing pressure
is outside of
either of the two ranges of predominantly-gas and predominantly-liquid, then
the
empirical solutions cannot be used, and expressions (1)-(3) can be used to
solve for the
volume flow of liquid and the volume flow of gas.
In cases where the liquid is a mixture of hydrocarbon and water, the density
of
the liquid could be determined, in an embodiment, either by sampling and/or
the use of a
water cut analyzer that can measure three-phase flow. Then the oil flow rate
and the
water flow rate may be defined by:
Vou = 1.7liquid (1 ¨ WC) (6)
1.7H2o = 1.7liquid . WC (7)
Where:
Vou = volumetric oil flow rate
WC = water cut (volumetric fraction of the water volume ratio compared to the
total volume)
= volumetric water flow rate
1.71-12o
The water cut can be measured by a water cut analyzer. In an embodiment, the
water cut analyzer is not affected by bubbles in liquid and/or can measure
water cut in
17
CA 03011242 2018-07-11
WO 2017/123214 PCT/US2016/013172
the mist phase of wet gas flow. Therefore, by using a water cut analyzer, P
liquid
(expressions (2) and (4)) may be more accurately determined by:
Puquid = (1 ¨ WC) 'Poll + ( WC ' Pu,o) (8)
Where:
Pou = oil density
P H20 = water density
Equations (6), (7), and (8) are merely examples of equations used in
determining
the amount of water and hydrocarbon in the liquid phase, and should in no way
limit the
embodiments to these particular equations. These and other equations are
contemplated
in the predominantly gas flow routine 220 and in the predominantly liquid flow
routine
222.
In oil and gas-related embodiments having a predominantly liquid flow, there
will typically be liquid hydrocarbon mixed with water in various ratios.
Therefore, the
use of some method of water cut measurement is typically relayed to meter
electronics
to facilitate distinguishing the liquid fraction of the total flow. Thus, in
an
embodiment, a water cut analyzer is placed in communication via communication
link
26 with the flowmeter.
20 In many of applications, the pressure is low enough that n
g as may be assumed to
be zero, in which case expression (2) would be substituted by:
P liquid ¨ PB
GVF = (9)
P liquid
In this case, the volume liquid flow rate may be determined by:
"liquid ¨ __________________
(10)
P liquid
Therefore, the volume rate of gas would then be determined by:
= (7//quid = GVF
(11)
'gas 1¨ GV F
18
CA 03011242 2018-07-11
WO 2017/123214 PCT/US2016/013172
Utilizing these equations, Voit and 1.1H20 are defined by equations (6) and
(7).
The standard volumes that are most commonly used may be computed from the
actual
volumes by knowledge of the oil, water, and gas densities and/or components at
actual
conditions. Then the densities at standard or base conditions may be
determined using
American Petroleum Institute (API) and AGA algorithms. The API algorithms
yield the
liquid volume correction factors (VCF), to convert actual volumes to standard
volumes.
The AGA algorithms may be employed to convert the actual gas volume to
standard
volume using temperature, pressure, and composition.
These are merely examples of equations used in flows having a predominantly
liquid phase, and should in no way limit the embodiments to these particular
equations.
These and other equations are contemplated in the predominantly liquid flow
routine
222.
As already noted, the mass flow and density measurements in two-phase flow are
usually less than the actual values. Therefore, the variables in the above
equations
measured directly from the flowmeter 5 are subject to this effect. A
relationship was
discovered to exist between pickoff sensor 170L or drive gain, and mass flow
and
density under-read. In an embodiment, algorithms with the meter electronics 20
may
iteratively correct the mass flow and density readings in real-time using
these correction
factors. This increases the accuracy of the Coriolis two-phase measurements.
Turning to FIG. 4, a mass flow correction factor corresponding to the pickoff
sensor or inverse drive gain is illustrated. Elements in common with FIG. 3
share the
same element number. The x-axis 300 represents data samples taken over a
course of
time, while the y-axis 302 represents a pickoff sensor voltage or inverse
drive gain.
Each data sample is represented by a bar 303. The reported mass flow rate
and/or
density is shown by line 306. A dashed line indicates a pre-determined pickoff
voltage
304 or inverse drive gain threshold. For reference, a normal, single-phase
pickoff
voltage or inverse drive gain is shown by line 301. Starting from the origin,
it is clear
that the first ten data points have a voltage or inverse drive gain that is
above the voltage
or inverse drive gain threshold 304. However, the eleventh data point
represents the
first of eleven data points below voltage or inverse drive gain threshold 304.
The first of
these corresponding mass flow rate and/or density values below the threshold
304 is
19
CA 03011242 2018-07-11
WO 2017/123214 PCT/US2016/013172
indicated by arrow 308, while the first data point after the mass flow rate
and/or density
value that corresponds with a data point above the threshold 304 is indicated
by arrow
310.
Line 306 represents the mass flow and/or density reading, while a corrected
mass
flow and/or density reading is shown by each point 316. A correction factor is
shown
above each data point bar, and the implementation of the correction factor is
illustrated
by line 318. Therefore, the correlated correction factor may be applied to
mass flow
and/or density readings, and further adjusted to compensate for under-reported
values
that are the result of low pickoff voltage or low inverse drive gain
percentage.
For the measurement of well performance in oil & gas well testing, for
example,
a separator is usually used to separate liquid from gas or separate oil from
water and gas.
In either case, the individual phases are measured separately with individual
flowmeters.
These separators are typically large, heavy pressure vessels having numerous
level
controls, safety valves, level sensors, control valves, piping, flowmeters,
and interior
devices to promote efficient separation. Such separators are usually
prohibitively
expensive, such that one separator must be shared by multiple wells for well
testing. A
manifold is usually provided that allows the wells to be tested one at a time,
typically for
a 24-hour test. The flowmeter 5 provided can measure the performance of a well
at the
wellhead, thus drastically reducing cost, associated labor, and overall
complexity.
By monitoring each site individually, there are considerable advantages to the
producers. The most obvious is the elimination of the separator and the
maintenance that
goes with it. Another advantage is the fact that all the wells in a field
would be
monitored simultaneously, so that real-time determinations can be made
regarding
strategies and tactics for efficient production and Enhanced Oil Recovery
(EOR). EOR
involves the injection of water, CO2, natural gas, surfactants, or steam;
which can be
expensive and must be applied at the right time with the right amount of
media. Having
real-time production data on an entire oilfield, for example without
limitation, would
give production and reservoir engineers valuable information on how to fine-
tune their
EOR. Operators would also have an advantage of early detection of wells that
have
developed problems, and can act quickly to remediate the problems. Another,
advantage
is that in a new field, the flow line gathering systems can incorporate a
trunk-line-and-
CA 03011242 2018-07-11
WO 2017/123214 PCT/US2016/013172
lateral design rather than having discrete flow lines to the test separator
for each well.
This saves capital costs on pipe, welding, trenching, and the real estate
required.
The present description depicts specific examples to teach those skilled in
the art
how to make and use the best mode of the invention. For the purpose of
teaching
inventive principles, some conventional aspects have been simplified or
omitted. Those
skilled in the art will appreciate variations from these examples that fall
within the scope
of the invention.
The detailed descriptions of the above embodiments are not exhaustive
descriptions of all embodiments contemplated by the inventors to be within the
scope of
the invention. Indeed, persons skilled in the art will recognize that certain
elements of
the above-described embodiments may variously be combined or eliminated to
create
further embodiments, and such further embodiments fall within the scope and
teachings
of the invention. It will also be apparent to those of ordinary skill in the
art that the
above-described embodiments may be combined in whole or in part to create
additional
embodiments within the scope and teachings of the invention.
Thus, although specific embodiments of, and examples for, the invention are
described herein for illustrative purposes, various equivalent modifications
are possible
within the scope of the invention, as those skilled in the relevant art will
recognize. The
teachings provided herein may be applied to other embodiments than those
described
above and shown in the accompanying figures. Accordingly, the scope of the
invention
is determined from the following claims.
21