Note: Descriptions are shown in the official language in which they were submitted.
Method for Evaluating Blush in Myocardial Tissue
CROSS-REFERENCE TO RELATED APPLICATIONS
This application claims the benefit of U.S. Provisional Application Serial
Number
61/023,818, filed January 25, 2008, the entire content is incorporated herein
by
reference.
BACKGROUND OF THE INVENTION
The invention relates to a method for evaluating myocardial blush in tissue
from
images recorded following injection of fluorescent dyes.
TIMI (Thrombolysis In Myocardial Infarction) studies initially suggested that
successful restoration of flow in an infarcted artery was the major goal of
reperfusion.
However, substantial evidence has grown over the years showing that distortion
of
microvasculature and myocardial perfusion is often present despite epicardial
artery
patency. This might be the result of a combination of distal embolization and
reperfusion injury with cellular and extracellular edema, neutrophil
accumulation and
release of detrimental oxygen free radicals.
Myocardial blush was first defined by van't Hof et al. as a qualitative visual
assessment of the amount of contrast medium filling a region supplied by an
epicardial coronary artery. It is graded as Myocardial Blush Grade: 0 (= no
myocardial blush or contrast density), 1 (= minimal myocardial blush or
contrast
density), 2 (= myocardial blush or contrast density which exists to lesser
extent and
its clearance is diminished compared to non-infarct-related coronary artery),
and 3 (=
normal myocardial blush or contrast density comparable with that obtained
during
angiography of a contralateral or ipsilateral non-infarct-related coronary
artery).
When myocardial blush persists (long "wash-out rate" or "staining"), it
suggests
.. leakage of the contrast medium into the extravascular space or impaired
venous
clearance and is graded 0.
The consequences of microvascular damage are extremely serious. In patients
treated with thrombolytics for acute myocardial infarction, impaired
myocardial
perfusion as measured by the myocardial blush score corresponds to a higher
1
CA 3011310 2018-07-11
mortality, independent of epicardial flow. Myocardial blush grade correlates
significantly with ST segment resolution on ECGs, enzymatic infarct size,
LVEF, and
is an independent predictor of long-term mortality. Myocardial blush grade may
be
the best invasive predictor of follow-up left ventricular function.
Determining the
myocardial blush has emerged as a valuable tool for assessing coronary
microvasculature and myocardial perfusion in patients undergoing coronary
angiography and angioplasty.
The degree of blush that appears during imaging (e.g., imaging with a
fluorescent
dye, such as ICG) is directly related to the underlying tissue perfusion.
Conventionally, to quantitatively characterize kinetics of dye entering the
myocardium using the angiogram, digital subtraction angiography (DSA) has been
utilized to estimate the rate of brightness (gray/sec) and the rate of growth
of blush
(cm/sec). DSA is performed at end diastole by aligning cine frame images
before the
dye fills the myocardium with those at the peak of a myocardial filling to
subtract
spine, ribs, diaphragm, and epicardial artery. A representative region of
myocardium
is sampled that is free of overlap by epicardial arterial branches to
determine the
increase in the grayscale brightness of the myocardium at peak intensity. The
circumference of the myocardial blush is then measured using a handheld
planimeter. The number of frames required for the myocardium to reach peak
brightness is converted into time by dividing the frame count by the frame
rate. This
approach is quite time-consuming and is difficult to perform on a beating
heart and to
conclude within a reasonable time.
Generally, conventional techniques gathering statistical information about a
ROI rely
on algorithms that track the ROI during movement of the underlying anatomy and
attempt to keep the ROI localized in the same tissue portion. For example, the
user
can draw an initial ROI in the image, ignoring any blood vessels not to be
included in
the calculation, with the initial ROI then adjusted to the moving anatomy
through
linear translation, rotation, and distortion. However, this approach is
computationally
intensive and not reliable with low contrast images.
.. Accordingly, there is a need for a method to determine blush of myocardial
tissue
while the heart is beating, to eliminate effects from features other than
myocardial
2
CA 3011310 2018-07-11
tissue that may migrate into the region of interest (blood vessels, clips, the
surgeon's
hands, etc...), and to produce useful information for the surgeon during a
medical
procedure within a "reasonable time," if not within "real time."
There is also a need for measuring improvement in cardiac function by
measuring
the time differential between when contrast in a blood vessel reaches its peak
intensity and when the contrast in a neighboring region in the myocardial
tissue
reaches its corresponding peak. If this time differential decreases after a
medical
procedure as compared to before the procedure, under uniform hemodynamic
conditions cardiac function can be said to have improved. A method for
tracking
.. blood vessels during image acquisition improves our ability to locate the
time at
which the contrast in a blood vessel achieves its peak intensity.
SUMMARY OF THE INVENTION
The present invention is directed to a method for evaluating myocardial blush
in
tissue from images recorded following injection of fluorescent dyes using a
static ROI
(Region-of-Interest) that is fixed in position on the image while the heart
(or other
tissue of interest) moves under it in the image sequence. The static ROI uses
a
statistical technique to eliminate intensity outliers and to evaluate only
those pixels
that have less inter-pixel intensity variance. The technique is highly robust,
and the
.. results depend only insignificantly on changes to the ROI size and
position, providing
the ROI is placed in the same general region of the anatomy.
According to one aspect of the invention, a method for determining perfusion
in
myocardial tissue using fluorescence imaging, includes the steps of defining a
static
region of interest (ROI) in an image of the myocardial tissue, measuring
fluorescence
intensity values of image elements (pixels) located within the ROI, and
determining a
blush value from an average of the intensity values of image elements located
within
a smallest contiguous range of image intensity values containing a first
predefined
fraction of a total measured image intensity of all image elements within the
ROI.
Advantageous embodiments may include one or more of the following features.
The
smallest range of contiguous image intensity values may be determined from a
3
CA 3011310 2018-07-11
histogram of a frequency of occurrence of the measured image intensity values,
wherein the first predefined fraction may be between 70% and 30%, preferably
between 60% and 40%, and most preferably at about 50%. Blush values are
determined, optionally continuously, over a predefined period of time. At
least one of
the blush rate and the washout rate may be determined from the slope of the
time-
dependent blush values.
Alternatively or in addition, the blush and associated perfusion may be
determined
by defining a second static ROI in the image of the myocardial tissue, with
the
second ROI including an arterial blood vessel, and determining a measure of
the
peak intensity of the arterial blood vessel from a total intensity of the
intensity values
of image elements located within a smallest contiguous range of high image
intensity
values containing a second predefined fraction, for example 20%, of a total
measured image intensity of brightest image elements within the ROI. This
measurement can then be used to determine an outcome of a procedure by
comparing an elapsed time between a maximum blush value and maximum measure
of perfusion before the procedure and an elapsed time between a maximum blush
value and maximum measure of perfusion after the procedure.
According to another aspect of the invention, a method for tracking a blood
vessel in
an image includes the steps of (a) acquiring a fluorescence image of tissue
.. containing a blood vessel, (b) delimiting a segment of the blood vessel
with
boundaries oriented substantially perpendicular to a longitudinal direction of
the
blood vessel, (c) constructing at least one curve extending between the
delimiting
boundaries and located within lateral vessel walls of the blood vessel,
wherein the at
least one curve terminates at the delimiting boundaries substantially
perpendicular to
.. the boundaries, and (d) determining a fluorescence signal intensity in the
fluorescence image along the at least one curve, with the signal intensity
being
representative of vessel perfusion.
In one exemplary embodiment, the at least one curve may be defined by a spline
function. For example, more than one curve may be constructed and the
fluorescence signal intensity may be determined by averaging the signal
intensity
4
CA 3011310 2018-07-11
from points on the curves having a substantially identical distance from one
of the
delimiting boundaries.
Advantageously, the position of the lateral vessel walls in the fluorescence
image
may be determined using an edge-detection algorithm, such as a Laplacian-of-a-
Gaussian operator.
In another exemplary embodiment, time-sequential fluorescence images of the
tissue containing the blood vessel may be acquired. Characteristic dimensions
of the
delimited segment may then be determined from the location of the lateral
vessel
walls in the first image, and positions of lateral vessel walls may be
determined in at
least one second image. The characteristic dimensions from the first image may
then
be matched to the positions of lateral vessel walls in the second image to
find a
location of the lateral vessel walls of the first image in the at least one
second image.
The steps (c) and (d) above are then repeated for the second image or images.
Advantageously, an average fluorescence signal intensity of all points may be
computed along the curve and a change in perfusion of the blood vessel may be
determined from a change in the average fluorescence signal intensity between
the
time-sequential images.
These and other features and advantages of the present invention will become
more
readily appreciated from the detailed description of the invention that
follows and
from the appended drawings.
BRIEF DESCRIPTION OF THE DRAWINGS
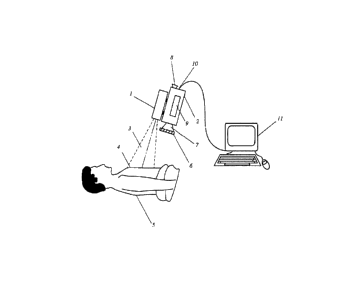
FIG. 1 shows schematically a camera system for observing ICG
fluorescence;
FIG. 2 shows an ICG fluorescent cardiac image, with the rectangle
delineating a
static ROI on the imaged area;
FIG. 3 shows a histogram of the number of pixels (vertical axis) as a
function of
the measured brightness value (horizontal axis);
5
CA 3011310 2018-07-11
FIG. 4 shows the location of pixels within the static ROI that contain at
least 50%
of the intensity counts over the smallest set of adjacent histogram bins in
FIG. 3;
FIG. 5 shows the static ROI of FIG. 2 (top image) and a smaller static
ROI
(bottom image) located within the ROI of the top image;
FIG. 6 shows the time dependence of the computed average intensity for
the
pixels highlighted in FIG. 4 (top image) and for the smaller static ROI of
FIG. 5 (bottom image) taken over a 28 second time period;
FIG. 7 shows an ICG fluorescent cardiac image with a static ROI before a
surgical procedure (top image), and after the procedure (bottom image);
FIG. 8 shows the time evolution of the average blush intensity for the
pixels within
the ROI of FIG. 7 before the procedure (top image) and after the
procedure (bottom image) taken over a 28 second time period;
FIG. 9 shows delineation of a segment of a blood vessel for analysis with
the
method of the invention;
FIG. 10 shows the delineated segment of FIG. 9 with lines terminating at the
vessel walls and line normals at the longitudinal end points;
FIG. 11 shows the vessel walls and line normals at the longitudinal end points
of
FIG. 10 with proper orientation;
FIG. 12 shows splines connecting the longitudinal end points of FIG. 11 and a
longitudinal intensity profile (upper left corner) taken before a procedure;
FIG. 13 shows splines connecting the longitudinal end points together with a
longitudinal intensity profile (upper left corner) and the time dependence of
the intensity profile (upper right corner) taken after a procedure;
6
CA 3011310 2018-07-11
DETAILED DESCRIPTION OF EXEMPLARY EMBODIMENTS
FIG. 1 shows schematically a device for non-invasively determining blush of
myocardial tissue by ICG fluorescence imaging. An infrared light source, for
example, one or more diode lasers or LEDs, with a peak emission of about 780-
800
nm for exciting fluorescence in ICG is located inside housing 1. The
fluorescence
signal is detected by a CCD camera 2 having adequate near-IR sensitivity; such
cameras are commercially available from several vendors (Hitachi, Hamamatsu,
etc.). The CCD camera 2 may have a viewfinder 8, but the image may also be
viewed during the operation on an external monitor which may be part of an
electronic image processing and evaluation system 11.
A light beam 3, which may be a divergent or a scanned beam, emerges from the
housing 1 to illuminate an area of interest 4, i.e. the area where the blush
of
myocardial tissue is to be measured. The area of interest may be about 10 cm x
10
cm, but may vary based on surgical requirements and the available illumination
intensity and camera sensitivity.
A filter 6 is typically placed in front of the camera lens 7 to block
excitation light from
reaching the camera sensor, while allowing fluorescence light to pass through.
The
filter 6 may be an NIR long-wave pass filter (cut filter), which is only
transparent to
wavelengths greater than about 815 nm, or preferably a bandpass filter
transmitting
at peak wavelengths of between about 830 and about 845 nm and having a full
width
at half maximum (FWHM) transmission window of between about 10 nm and 25 nm
in order to block the excitation wavelength band. The camera 2 may also be
designed to acquire a color image of the area of interest to allow real-time
correlation
between the fluorescence image and the color image.
In general, the surgeon is interested in how well the blood is perfusing the
tissue in
the area within a region of interest (R01). Blood vessels visible in the image
typically
include major blood vessels, e.g., arteries; however, arterial blood flow may
not be of
interest to the surgeon when considering perfusion of the surrounding
myocardial
tissue. Because these blood vessels may have either a higher or a lower
brightness
in the image, depending on the phase of the cardiac cycle, contributions from
blood
vessels to the measured image brightness may alter the myocardial blush grade
by
7
CA 3011310 2018-07-11
skewing the average image brightness upward or downward. In order to obtain a
correct value for the myocardial blush, the contributions from the blood
vessels must
be eliminated before the blush grade is computed.
FIG. 2 shows a typical ICG fluorescent image of a heart showing blood vessels
and
myocardial tissue, with a rectangle delineating a static ROI on the imaged
area. The
ROI is static, meaning that it does not track tissue movement when the heart
is
beating. This simplifies the computation, while the results computed with the
method
of the invention are robust and largely insensitive to tissue movement.
To compute meaningful average blush intensity within the delineated static
ROI, the
following needs to be taken into consideration:
1. The selected area of the anatomy within the ROI should consist primarily of
myocardial tissue, while minimizing the effects from blood vessels, clips,
etc.
that appear in the ROI and may move in and out of the ROI when the heart is
beating.
2. The measured myocardial blush value should be substantially independent of
the size of the ROI in the selected area of the anatomy.
According to one embodiment illustrated in FIG. 3, a histogram of the
grayscale
intensity values in the ROI of FIG. 2 is generated. The horizontal axis of the
histogram represents the full range of intensity values arranged in bins
(e.g., 28 =
256 bins for an 8-bit image representing pixel intensities 0 to 255), whereas
the
vertical axis indicates the number of pixels for each intensity value in a
bin. In
comparison, a histogram of a 12-bit image would have 212 = 4,096 intensity
bins.
A sliding window W is applied across the abscissa, and the smallest set of
adjacent
histogram bins containing in excess of a predetermined percentage of the total
intensity is determined. In the illustrated example, a percentage value of 50%
is
selected as criterion for the bins to be included, although other values can
be
selected as long as these selected values exclude outliers and provide a
reliable
assessment of the blush. For the histogram depicted in FIG. 3, the smallest
set of
adjacent histogram bins containing at least 50% of the intensity counts
results in a
8
CA 3011310 2018-07-11
window W which is 12 bins wide and includes the intensity values between 120
and
131.
The average intensity for the static ROI is then computed using only the
values
inside the window determined above, i.e., the number of pixels in a bin
multiplied
with the intensity in that bin and summed over all bins within the window W.
This approach excludes the intensity outliers (both low and high intensity
values)
from the computation of the average intensity representing the myocardial
blush
value in the ROI. In other words, only intensity values between 120 and 131
within
the ROI are included in the subsequent calculation.
Fig. 4 shows the location of pixels within the static ROI with intensity
values within
the window W (according to the selection criterion that about 50% of the
intensity
values are located within the window W). The bright areas indicate the pixels
included. As can be seen, the area with the included pixels need not be
contiguous.
FIG. 5 shows the static ROI of FIG. 2 (top image) and a smaller static ROI
(bottom
image) located within the ROI of the top image. The smaller ROI includes less
arterial blood vessels.
FIG. 6 shows schematically the computed average intensity for both the static
ROls
of FIG. 5 taken over a 28 second time interval. The elapsed time (from the
point an
increase in the intensity was detected, in seconds) is plotted on the
abscissa, and
the average intensity for the static ROI (in arbitrary units) is plotted on
the ordinate.
The two curves match within about 1 ¨ 3 percent.
The maximum blush is approximately 112 [arb. units], the blush rate measured
over
about 6.1 sec from about zero blush to about the maximum value is in linear
approximation about 16.2 [arb. units]/sec , and the washout rate measured over
about 6.1 sec from about the maximum blush value to about 15-20% blush is in
linear approximation about 10.5 [arb. units]/sec. Blush appears to increase
and
decrease (washout) exponentially, so the linear curve fitting described above
should
be considered only as an approximation. Other characteristic values of the
curves of
FIG. 6, such as a maximum slope or a curve fit with an exponential rise and
decay
time may also be used.
9
CA 3011310 2018-07-11
1
The average blush and the blush and washout rates obtained with this technique
agree with the blush values perceived by the naked eye.
The static ROI algorithm described above does not rely on image tracking and
is
generally insensitive to the motion artifacts because of the exclusion of
outliers. It is
computationally fast and works well with both low and high contrast images.
FIG. 7 shows pictures of the heart before and after a surgical procedure has
been
performed on the heart. A comparison of the blush determined with the
aforedescribed method of the invention before and after the procedure can be
used
to determine whether perfusion has improved as a result of the procedure.
For obtaining reliable and meaningful results, the ICG dosage, illumination
level and
camera sensitivity settings should be adjusted so that the detector in the
camera
does not saturate when areas in the image, such as arteries, reach their
maximum
intensity. If the camera nevertheless does saturate, the user needs to decide
whether the computed blush rate and washout rate are likely to represent the
actual
rates, had the detector not saturated.
Two approaches are proposed for comparing image data obtained before and after
the procedure: (1) comparing the blush and washout rates before and after the
procedure; and (2) comparing the elapsed time from blood vessel peak intensity
to
maximum blush on images taken before and after the procedure.
With the first approach, a time series of fluorescence images of the anatomy
is
acquired before (top image of FIG. 7) and after the surgical procedure (bottom
image
of FIG. 7) by, for example, injecting a bolus of ICG dye. Only one of the time
series
of images is shown. A ROI is delineated in each of the images in approximately
the
same area of the anatomy. The average intensity of the blush is then
determined in
each of, or in a subset of, the fluorescence images in the time series with
the method
of the invention described above with reference to the histogram of FIG. 3,
which
excludes outliers, such as arteries. The average ROI intensity from each image
in
the time series is normalized to the baseline average intensity of the ROI in
the first
frame to correct for residual ICG that may have remained in the system.
CA 3011310 2018-07-11
i
1
FIG. 8 shows schematically the computed average intensities (about 50% of the
intensity values are located within the window W of a histogram corresponding
to the
histogram of FIG. 3) for the static ROls of FIG. 7 taken over a 28 second time
interval. The top graph represents values before the procedure and the bottom
graph values after the procedure. The elapsed time (from the point an increase
in
the intensity was detected, in seconds) is plotted on the abscissa, and the
average
intensity for the static ROI (in arbitrary units) is plotted on the ordinate.
The broken
line through the data represents a smoothed curve of the raw data. This helps
to
mask variation in the measurement due to motion caused by the cardiac cycle or
respiration and serves as a visual guide for assessing the blush rate and
washout
rate. As mentioned above, saturation of the sensor should be avoided, because
saturation would make an absolute determination of the slope impractical.
The blush and washout rates are determined from the corresponding slopes of
straight lines connecting the 5% and 95% points in the average intensity
curves, i.e.,
the start of blush is taken as the time at which the intensity rises above the
baseline
by 5% of its maximum value, and the 95% point is the time at which the
intensity
reaches 95% of its maximum value. The same applies to the determination of the
washout rate, with the 5% point at the end of washout determined with
reference to
the final values, which may be higher than the initial 5% point due to
residual ICG
remaining in the myocardial tissue. The 5% and 95% thresholds are heuristic
thresholds used to discount for any noise that may appear in the image both
before
the blush appears, and as it nears its maximum value.
It will be understood that the slope of the straight lines represents an
average rate,
and that the rate can also be determined from a least-square curve fit or by
selecting
points other than 5% and 95%, as described in the illustrated example.
As indicated in FIG. 8, the blush rate following the procedure is about 43
units/sec,
compared to about 18 units/sec before the procedure, representing an
improvement
of about 140%. Likewise, the washout rate following the procedure is about 21
units/sec, compared to about 10 units/sec before the procedure, representing
an
improvement of more than 100%. Greater perfusion (blush) and washout rates
suggest faster movement of blood and greater maximum blush suggests a greater
11
CA 3011310 2018-07-11
1
1
,
,
volume of ICG-bound blood in the tissue and are hence clear indicators of
improved
perfusion through the tissue.
With the second approach, perfusion is determined from the time of maximum
blood
vessel (artery) intensity to maximum myocardial blush. For example, for
cardiac
surgery, the surgeon would draw two regions of interest (ROI), a first region
covering
the coronary artery feeding blood to the heart and a second region covering
myocardial tissue receiving blood from that artery. The maximum myocardial
blush
is determined from the histogram of the first region, as described above (FIG.
8).
Peak intensity of the blood vessel may advantageously be determined from an
area
in the first region showing pixel intensity greater than that of the
surrounding tissue.
For example, a histogram of the grayscale intensity values may be constructed
for
the first region and a sliding window W applied across the abscissa, wherein
the
smallest set of adjacent histogram bins containing a predetermined percentage,
for
example about 20%, of the pixels with the highest intensity. The lower
percentage of
pixels included in the computation of the average blood vessel intensity than
for
myocardial tissue gives the user some flexibility in drawing a larger ROI over
the
vessel to make the result less sensitive to lateral movement in the vessel
during
image acquisition.
It will be understood that the first and second regions need not be separate,
but may
overlap or even be identical, as long as the fluorescence signals from the
blood
vessels and the myocardial tissue can be clearly separated in the histogram.
It has been observed that before the procedure, the myocardial area may reach
maximum blush two seconds after the coronary artery reaches maximum
fluorescence intensity. After the procedure, it may only take one second for
the
myocardial blush to reach maximum blush after the coronary artery reaches
maximum fluorescence intensity following the vessel reaching maximum. This
finding would lead to the conclusion that cardiac function has improved.
As mentioned above, a blood vessel may move laterally during image acquisition
which may make it more difficult to reliably determine the fluorescence
intensity, for
example during ICG imaging, of a coronary artery. The proposed method provides
a
means for tracking the movement of the vessel by determining several,
typically
12
CA 3011310 2018-07-11
I
three, lines which follow the contour of a segment of interest of the blood
vessel and
approximately span the width of the vessel.
According to the method, features or edges in the image are determined by
filtering
using a 2D convolution with the Laplacian-of-a-Gaussian kernel. The detected
edges may be enhanced (thickened) by defining the edge by a width of at least
two
pixels. Both the original and the edge-enhanced images are stored.
Referring now to FIGS. 9 and 10, an operator delimits the segment of the
vessel of
interest by drawing two lines across the vessel, for example with a computer
mouse
(FIG. 9). The system then uses the previously determined edge information to
detect
the segment of each line located between the vessel edges and the mid-point of
that
segment, which is necessarily also the mid-point of the vessel, and constructs
a line
normal to each line segment (FIG. 10). Thereafter, the system aligns two line
normals with the major longitudinal axis of the vessel (FIG. 11).
Next, the system constructs a series of 3 parallel lines, for example cubic
spline, of
approximately equal length joining the two ends of the segment of interest.
However,
a greater or lesser number of lines can be used. The lines have at their
respective
end points the same slope as the respective line normals. Three exemplary
lines
which approximately span the width of the vessel are shown in FIG. 12. The
pixel
intensity is sampled at points of each line along the longitudinal axis of the
vessel.
Preferably, intensities are averaged across the three lines at each location
along the
longitudinal axis to produce an average vessel intensity at each location in
the
vessel. As indicated in the insert at the top left corner of FIG. 12, the
average
intensity in the vessel segment is approximately 55, substantially independent
of the
longitudinal location in the vessel.
The process is then repeated for the time series of images frame-by-frame,
while
making sure that the positions match from one frame to the next.
FIG. 13 illustrates a final frame in the image sequence processed in this
manner.
The insert at the top left corner of FIG. 13 shows, as in FIG. 12, the
averaged pixel
intensity along the three lines. The segment now fluoresces noticeably
stronger with
an average intensity in the vessel segment of approximately 179. The insert at
the
13
CA 3011310 2018-07-11
1
top right corner of FIG. 13 shows the change in the average intensity for all
of the
processed time-ordered frame sequence of images. The "fill time" of the blood
vessel
can be calculated from the slope of the latter curve (pixel intensity vs.
time).
While the invention is receptive to various modifications, and alternative
forms,
specific examples thereof have been shown in the drawings and are herein
described in detail. It should be understood, however, that the invention is
not limited
to the particular forms or methods disclosed, but to the contrary, the
invention is
meant to cover all modifications, equivalents, and alternatives falling within
the spirit
and scope of the appended claims.
14
CA 3011310 2018-07-11
I