Note: Descriptions are shown in the official language in which they were submitted.
CA 03014206 2018-08-09
WO 2017/152154
PCT/US2017/020833
QUANTITATIVE IN-SITU TEXTURE MEASUREMENT
APPARATUS AND METHOD
FIELD OF THE INVENTION
[001] The present invention relates to an in-situ quantitative measurement of
texture for
food products using acoustic techniques.
PRIOR ART AND BACKGROUND OF THE INVENTION
Prior Art Background
[002] Texture is one of the most important sensory characteristics that
determine consumer
preference for food products and is usually assessed by sensory evaluation.
However, sensory
evaluation is time-consuming and expensive, and therefore, reliable and
practical
instrumental methods are needed to accurately predict sensory texture
attributes and other
food snack properties.
[003] When a food snack such as potato chip is manufactured, textural
properties are
dependent on raw material characteristics (i.e. low solids or high solids
potatoes) and the
processing conditions that the raw material undergoes such as temperature
profile, slice
thickness, pulse electric field strength intensity and so on.
[004] The crispiness, softness and/or crunchiness of a potato chip are just a
few examples of
texture and mouthfeel characteristics that make food appealing and satisfying
to consumers.
Texture is one of the major criteria which consumers use to judge the quality
and freshness of
many foods. When a food produces a physical sensation in the mouth (hard,
soft, crisp, moist,
dry), the consumer has a basis for determining the food's quality (fresh,
stale, tender, ripe).
[005] A major challenge is how to accurately and objectively measure texture
and
mouthfeel. Texture is a composite property related to a number of physical
properties (e.g.,
hardness and fracturability), and the relationship is complex. Texture or
mouthfeel cannot be
quantitatively measured in a single value obtained from an instrument.
Mouthfeel is hard to
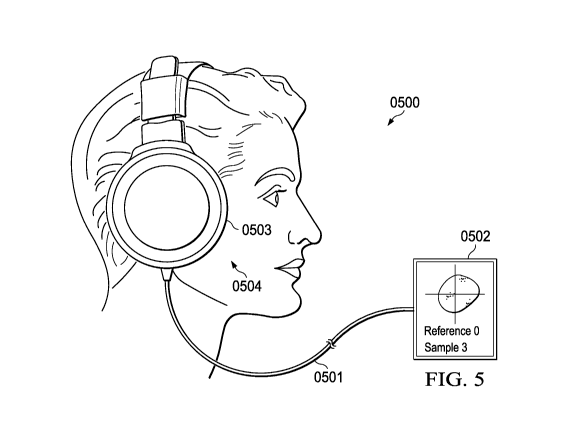
define as it involves food's entire physical and chemical interaction in the
mouth -- from
initial perception on the palate, to first bite, through mastication and
finally, the act of
swallowing. There is a need to quantitatively measure the food interaction in
the mouth.
[006] A problem with hardness is that their correlations with sensory tests
are not always as
high as expected. In many instances, the metric of peak force exerted on a
potato chip does
CA 03014206 2018-08-09
WO 2017/152154
PCT/US2017/020833
not adequately replicate the energy experienced by consumers. Therefore,
consumers'
judgments of Hardness can be more nuanced than a simple peak force metric from
a
destructive analytical test.
[007] Presently, there is no good correlation of any type between instrument
readings and
taste panel scores. The issue is that no instrument is capable of manipulating
a food product
precisely the same way as the human mouth during mastication. For example, an
instrument
may compress a food product between two plates, while a human would be biting
down with
incisors. Therefore, there is a need for a quantitative texture measurement
that has a good
correlation with a qualitative measurement from an expert panel.
Prior Art Texture Measurement System
[008] An Universal TA-XT2 Texture Analyzer from Texture Technologies Corp. can
perform a complete TPA calculation and comes with multiple standard probes,
including
various sizes of needles, cones, cylinders, punches, knives and balls. FIG 1.
Illustrates a prior
art system for measuring texture attributes such as hardness and
fracturability with a TA-XT2
Texture Analyzer. The system includes a probe (0101) that exerts a force on a
food snack
such as a potato chip and measure the amount of force required to break the
chip. Hardness
may be measured as a force required to deform the product to given distance,
i.e., force to
compress between molars, bite through with incisors, compress between tongue
and palate.
Prior Art Texture Measurement Method
[009] As generally shown in FIG. 2, a prior art texture measurement method
associated with
the prior art system may include the steps comprising:
(1) placing a food snack on a surface (0201);
(2) with a probe, exerting a force and break/deform the food snack (0202);
(3) generating an acoustic signal from the food snack or measuring the
force
exerted (0203);
Force exerted may depend on the shape of the food snack. For example, a U
shaped food snack or a curvy shaped food snack may be placed in either
direction and the force exerted to break the food snack may be different.
Therefore, there is a need for a shape independent quantitative texture
measurement.
(4) capturing the acoustic signal with an acoustic capturing device or
record the
force required to break the food snack (0204);
2
CA 03014206 2018-08-09
WO 2017/152154
PCT/US2017/020833
acoustic signal is captured for a period of time at preset frequencies and the
signal is plotted as Time (seconds) vs. Intensity (dB). There is a need to
measure acoustic signal in a wide range of frequencies.
(5) generating a texture model from the acoustic signal (0205); and
A model for texture attributes such as hardness and fracturability is
developed
from the Time vs. Intensity plot for the food snack. Alternatively, a model
from measured force may also be used to develop a model.
(6) measuring the texture attribute of the food snack from the texture
model.
Texture attributes of a food snack is measured from the model developed in
step (0205). The texture attributes are correlated to a qualitative texture
attributes number from an expert panel as described below in FIG. 3.
Prior Art Texture Correlation Method
[0010] As generally shown in FIG. 3, a prior art texture correlation method
may include the
steps comprising:
(1) shipping food snack samples to an expert panel (0301);
The shipping of the food snack samples may take time and the food snack may
undergo texture change during the shipping process. Therefore, there is a need
to limit the number of times food snacks are shipped the expert panel.
(2) qualitatively analyzing the food snack samples (0302);
The process starts with a well-trained sensory panel to carry out a meaningful
texture profile analysis, a panel of judges needs to have prior rating
knowledge of the texture classification system, the use of standard rating
scales and the correct procedures related to the mechanics of testing.
Panelist
training starts with a clear definition of each attribute. Furthermore, the
techniques used to evaluate the food product should be explicitly specified,
explaining how the food product is placed in the mouth, whether it is acted
upon by the teeth (and which teeth) or by the tongue and what particular
sensation is to be evaluated. Panelists are given reference standards for
evaluation so they can practice their sensory evaluation techniques and the
use
of scales. Hardness and fracturability are usually considered to be the most
important texture attribute. Presently there is no good correlation of any
type
between instrument readings and taste panel scores. Presently there are no
instruments capable of manipulating a food product precisely the same way as
3
CA 03014206 2018-08-09
WO 2017/152154
PCT/US2017/020833
the human mouth during mastication. For example, an instrument may
compress a food product between two plates, while a human would be biting
down with incisors. In fact, what an instrument measures may not relate at all
to what the consumer perceives. Therefore, there is a need to have a system
that can quantitatively measure texture attributes and correlate to the taste
panel scores.
(3) assigning a descriptive panel number for the texture attributes of the
food
snack sample (0303);
An organoleptic sensory evaluation is performed in which the trained panelists
assign intensity levels on various descriptors/texture attributes. For
example,
for evaluating the potato chips, hardness may be considered one important
attribute. In this case, panelists assign a hardness score based on a scale,
where
1 equals extremely soft and 15 equals extremely hard. The panelists may rate
the hardness of potato chip samples A, B and C's. After taste paneling is
complete, instrument readings of the food product are made as described
below in step (0304).
(4) measure texture attributes using an invasive analytical method (0304);
There is a need that the instrumental technique selected duplicates as closely
as possible how the mouth manipulates the particular food product. The
instrument should apply the same amount of force in the same direction and at
the same rate as the mouth and teeth do during mastication. The instrument
may record acoustic signals for a period of time and generate a model.
However, current instruments are limited by recording acoustics at discrete
frequencies. Therefore, there is a need for recording sound in a wider
frequency range.
(5) correlate the analytical and the qualitative texture attributes (0305);
and
Statistically correlate between sensory data (descriptive panel number) and
instrumental measurements. For example, prior art adjusted R2 correlation
numbers are in the range of 0.5 ¨ 0.65. Therefore, there is a need for a
strong
correlation between descriptive panel number and the analytical model.
(6) generating a correlation model (0306).
Current objective methods to measure texture are limited in detecting textural
changes
of a small magnitude with an acceptable degree of accuracy and require several
4
CA 03014206 2018-08-09
WO 2017/152154
PCT/US2017/020833
measurements of the same substrate to differentiate slightly different
substrate with
statistical significance. Currently in the food industry snacks and beverages
textures
are characterized either by measuring the force and gradient to make a
substrate fail
or by rheological means. In snacks, the TAXT2 is a well-known apparatus to
measure
force and gradient as a substrate fails; for beverages sometimes a rheometer
is utilized
to measure the viscosity or elasticity of fluid. While both types of
measurement have
been of vital importance to the industry, they do not explain the change in
force/gradient, rheology, mouthfeel, or interaction within a mouth the
consumer
experiences when the sample comes into contact with human saliva. Therefore
there
is a need to provide a quantitative model may be correlated through an 'in-
situ'
measurement.
[0011] Consequently, there is a need for a quantitative texture measurement
that
accomplishes the following objectives:
= Provide a quantitative method to measure finished product attributes such
as oil
content, moisture, slice thickness, and salt content.
= Provide for quantitative analytical measurement of the textural
attributes such as
hardness, fracturability, crispiness, and surface oiliness.
= Provide for an in-situ method to quantitatively measure consumer
experience of
eating a sample when the sample comes into contact with human saliva.
= Provide for an in-situ method to quantitatively texture attributes that
is calibrated to
the characteristics (viscosity and pH) of human saliva.
= Provide for frequency domain data to accurately model the texture
attributes.
= Provide for acoustic signal capture in a broad frequency range from 0 to
5000 KHz.
= Provide for shape independent quantitative test for texture measurement.
= Provide for a quantitative measurement of texture of a food snack from
initial
perception on the palate, to first bite, through mastication and finally, the
act of
swallowing.
= Provide for quantitative measurement of texture with minimum samples with
greater
accuracy and reliability.
CA 03014206 2018-08-09
WO 2017/152154
PCT/US2017/020833
= Provide for a less expensive quantitative texture measurement test.
= Provide for instant results of the quantitative measurement.
= Provide for repeatable and reproducible quantitative measurements of food
snacks.
= Provide a method to fingerprint food snacks with a quantitative
measurement of food
property.
[0012] While these objectives should not be understood to limit the teachings
of the present
invention, in general these objectives are achieved in part or in whole by the
disclosed
invention that is discussed in the following sections. One skilled in the art
will no doubt be
able to select aspects of the present invention as disclosed to affect any
combination of the
objectives described above.
6
CA 03014206 2018-08-09
WO 2017/152154
PCT/US2017/020833
Brief Summary of the Invention
[0013] The present invention in various embodiments addresses one or more of
the above
objectives in the following manner. The apparatus includes an acoustic
capturing device and
a data processing unit. When a human being eats/drinks a food snack, the
physical interaction
in the mouth sends pressure waves that propagate through the ear bone and
produce an
acoustic signal. The acoustic capturing device records and forwards the signal
to a data
processing unit. The data processing unit further comprises a digital signal
processing
module that smoothens, transforms and filters the received acoustic signal. A
statistical
processing module further filters the acoustic signal from the data processing
unit and
generates a quantitative acoustic model for texture attributes such as
hardness and
fracturability. The quantitative model is correlated with a qualitative
texture measurement
from a descriptive expert panel. Another method includes a food snack
fingerprinting using
an in-situ quantitative food property measurement.
[0014] The present invention system may be utilized in the context of method
of
quantitatively measuring texture of a food snack, the method comprises the
steps of:
(1) eating/drinking a food snack;
(2) generating an acoustic signal from eating/drinking the food snack;
(3) capturing the acoustic signal with an acoustic capturing device;
(4) forwarding the acoustic signal to a data processing unit; and
(5) measuring the texture attributes of the food snack with an in-situ
acoustic
texture model.
[0015] Integration of this and other preferred exemplary embodiment methods in
conjunction
with a variety of preferred exemplary embodiment systems described herein in
anticipation
by the overall scope of the present invention.
7
CA 03014206 2018-08-09
WO 2017/152154
PCT/US2017/020833
Brief Description of the Drawin2s
[0016] For a fuller understanding of the advantages provided by the invention,
reference
should be made to the following detailed description together with the
accompanying
drawings wherein:
[0017] FIG. 1 is a prior art destructive system for measuring texture in food
products.
[0018] FIG. 2 is a prior art chart for measuring texture with acoustic
signals.
[0019] FIG. 3 is a prior art method for correlating texture measurements.
[0020] FIG. 4 is a system for eating food snacks according to an exemplary
embodiment of
the present invention.
[0021] FIG. 5 is an acoustic capturing unit that captures acoustics from a
human being eating
a food snack according to an exemplary embodiment of the present invention.
[0022] FIG. 6 is an in-situ system for measuring texture attributes according
to an exemplary
embodiment of the present invention.
[0023] FIG. 7 is a data processing unit according to an exemplary embodiment
of the present
invention.
[0024] FIG. 8 is a digital signal processing unit according to an exemplary
embodiment of
the present invention.
[0025] FIG. 9 is a statistical processing unit according to an exemplary
embodiment of the
present invention.
[0026] FIG. 10 is a flow chart method for quantitative measurement of texture
according to
an exemplary embodiment of the present invention.
[0027] FIG. 11 is an exemplary flow chart method for quantitative correlation
of texture
according to a preferred embodiment of the present invention.
[0028] FIG. 12 is an exemplary flow chart method for quantitative texture
model
development according to a preferred embodiment of the present invention.
[0029] FIG. 13 an exemplary descriptive panel number versus texture attribute
chart
according to a preferred embodiment of the present invention.
[0030] FIG. 14 is an exemplary flow chart method for acoustic signal
processing according
to a preferred embodiment of the present invention.
8
CA 03014206 2018-08-09
WO 2017/152154
PCT/US2017/020833
[0031] FIG. 15 is an exemplary flow chart method for acoustic statistical
processing
according to a preferred embodiment of the present invention.
[0032] FIG. 16 is an exemplary food snack fingerprinting method according to a
preferred
exemplary embodiment.
[0033] FIG. 17 is an exemplary food snack fingerprinting matching table
according to a
preferred exemplary embodiment.
[0034] FIG. 18 is an exemplary quantitative in-situ discrete texture feedback
manufacturing
system according to a preferred embodiment of the present invention.
[0035] FIG. 19 is an exemplary quantitative in-situ discrete texture feedback
manufacturing
method according to a preferred embodiment of the present invention.
[0036] FIG. 20 is an exemplary acoustic signal time domain to frequency domain
transformation chart according to a preferred embodiment of the present
invention.
[0037] FIG. 21 is an exemplary texture attribute (hardness) vs. relevant
frequencies chart
according to a preferred embodiment of the present invention.
[0038] DIG. 22 is an exemplary texture attribute (fracturability) vs. relevant
frequencies
chart according to a preferred embodiment of the present invention.
[0039] FIG. 23 is another exemplary texture attribute (hardness) vs. relevant
frequencies
chart according to a preferred embodiment of the present invention.
9
CA 03014206 2018-08-09
WO 2017/152154
PCT/US2017/020833
Description of the Presently Exemplary Embodiments
[0040] While this invention is susceptible of embodiment in many different
forms, there is
shown in the drawings and will herein be described in detailed preferred
embodiment of the
invention with the understanding that the present disclosure is to be
considered as an
exemplification of the principles of the invention and is not intended to
limit the broad aspect
of the invention to the embodiment illustrated.
[0041] The numerous innovative teachings of the present application will be
described with
particular reference to the presently exemplary embodiment, wherein these
innovative
teachings are advantageously applied to in-situ quantitative measurement of
texture attributes
for food snacks apparatus and method. However, it should be understood that
this
embodiment is only one example of the many advantageous uses of the innovative
teachings
herein. In general, statements made in the specification of the present
application do not
necessarily limit any of the various claimed inventions. Moreover, some
statements may
apply to some inventive features but not to others.
[0042] The term "texture" as used herein is defined a composite property
related to a number
of physical properties such as hardness, fracturability, tooth-pack, roughness
of mass,
moistness of mass, residual greasiness, surface roughness, and surface
oiliness. It should be
noted that the term "texture" and "texture attribute" is used interchangeably
to indicate one or
more properties of texture. It should be noted that the terms "descriptive
panel number",
"taste panel score", "qualitative texture number" and "taste panel number" are
used inter-
changeably to indicate a qualitative measurement of texture measurements by an
expert
panel. It should be noted that the terms "in-situ acoustic model," "acoustic
model," "acoustic
texture model," and "quantitative texture attribute model," are used inter-
changeably to
indicate a quantitative model for a texture attribute of a food snack. The
term texture as used
herein with respect to a liquid or a beverage refers to properties such as
viscosity, density,
rheology and/or mouthfeel.
Exemplary Embodiment System for Ouantitative Measurement of Texture Attributes
(0400 - 0900)
[0043] One aspect of the present invention provides an in-situ method to
quantitatively
measure the texture attributes of food snacks. Another aspect of the present
invention
involves correlating the in-situ quantitative texture attribute measurement to
a qualitatively
measured texture attribute by an expert panel. The present invention is also
directed towards
CA 03014206 2018-08-09
WO 2017/152154
PCT/US2017/020833
developing a texture attribute model based on relevant frequencies in a
captured acoustic
signal. According to yet another aspect of the present invention, food snacks
are identified
("food finger printing") based on an in-situ quantitative food snack property
measurement.
[0044] Applicants herein have created a system that comprises an acoustic
capturing device
for recording/capturing an acoustic signal from a food snack and a data
processing unit that
processes the captured acoustic signal and generates a texture attribute
model. There are a
number of embodiments of this invention which fall within the scope of the
invention in its
broadest sense.
Exemplary Embodiment In-Situ System (0400 - 0600)
[0045] FIG. 4 (0400) generally illustrates a physical interaction of a human
being (0402)
interacting with a food snack (0403) that produces an acoustic signal (0401).
The physical
and chemical interaction in the mouth include steps from initial perception on
the palate, to
first bite, through mastication and finally, to the act of swallowing.
According to an
exemplary embodiment, the acoustic signal (0401) generated from the
consumption (eating
or drinking or chewing) of a food snack (0403) by a human being is
recorded/captured by an
acoustic capturing device. A headset is ergonomically positioned on the temple
and cheek
and the electromechanical transducer, which converts electric signals into
mechanical
vibrations, sends sound to the internal ear through the cranial bones.
Likewise, a microphone
may be used to record spoken sounds via bone conduction. According to another
preferred
exemplary embodiment, the food snack is a solid. According to yet another
preferred
exemplary embodiment, the food snack is a liquid. For example, the solid food
snack may be
a potato chip or a cheese puff The liquid may be a cold beverage, wine or hot
liquids such as
coffee or soup. The food snack may also be a semi-solid. Currently in the food
industry
snacks and beverages textures are characterized either by measuring the force
and gradient to
make a substrate fail or by rheological means. Saliva is a watery substance
located in the
mouths of humans and animals, secreted by the salivary glands. Human saliva is
99.5%
water, while the other 0.5% consists of electrolytes, mucus, glycoproteins,
enzymes,
antibacterial, and bacteria compounds such as secretory IgA and lysozyme. The
enzymes
found in saliva are essential in beginning the process of digestion of dietary
starches and fats.
Furthermore, saliva serves a lubricative function, wetting food and permitting
the initiation of
swallowing, and protecting the mucosal surfaces of the oral cavity from
desiccation. While
the characteristic of saliva such as pH, viscosity and others are different
from individual to
11
CA 03014206 2018-08-09
WO 2017/152154
PCT/US2017/020833
individual, some exemplary embodiments enable a means to 'calibrate' the
measurement with
snacks or beverage 'standards.' According to a preferred exemplary embodiment,
when a
food or beverage item is consumed information on texture information may be
captured with
the acoustic fingerprint of each food and beverage item include the
interaction with saliva.
As an example, differentiating sweeteners at the concentrations that are found
in beverages in
a rheological manner can prove to be very difficult; in other words to
distinguish the
viscosity of a Diet Pepsi 0 vs. a regular Pepsi 0 is difficult given the
measurement error;
however, when in contact with saliva, different sweeteners can have different
interactions
with human saliva given their chemical composition, the mixture of the
beverage and the
saliva produces viscosity differences that can be differentiated by an in-situ
model and
texture measurement as described in more detail in FIG. 10 (1000).
[0046] The present invention may be seen in more detail as generally
illustrated in FIG. 5,
wherein a system (0500) includes an acoustic capturing device (0503) that
records an
acoustic signal from a physical consumption of a food snack in a human being
(0504). The
acoustic signal may be forwarded to a data processing unit (0502) through a
connecting
element (0501). According to an exemplary embodiment, an acoustic capturing
device (0503)
may be positioned to record/capture an acoustic signal from the food snack.
The acoustic
capturing device may capture acoustic signals in the frequency range of 0 to
5000 KHz. A
headset may be ergonomically positioned on the temple and cheek and an
electromechanical
transducer, which converts electric signals into mechanical vibrations, sends
sound to the
internal ear through the cranial bones. Likewise, a microphone can be used to
record spoken
sounds via bone conduction. The acoustic capturing device may be physically
connected to a
data processing unit (0502) or wirelessly connected. The wired connecting
element may be a
hi-definition audio cable that can transmit data without substantial signal
loss. A texture
model generator may display data from the data processing unit (0502). The in-
situ texture
model generator may be integrated into the data processing unit (DPU) (0502).
[0047] The acoustic capturing device (0503) may be connected physically with a
conducting
cable to the DPU (0502) via an input-output module in the DPU (0502). In an
alternate
arrangement, the acoustic capturing device (0503) may forward an acoustic
signal to the
input-output module in the DPU (0404) wirelessly. The wireless protocol may
use standard
protocols such as WIFI or Bluetooth. In an exemplary embodiment, the acoustic
capturing
device (0503) may be remotely located and the acoustic signal may be forwarded
wirelessly
12
CA 03014206 2018-08-09
WO 2017/152154
PCT/US2017/020833
to the DPU (0502) with a protocol such as LTE, 3G and/or 4G. In another
exemplary
embodiment, the remotely located DPU (0502) may be connected to the acoustic
capturing
device (0503) with wired protocol such as Ethernet. The acoustic capturing
device may
capture the acoustic signal across a wide range of frequencies. Additionally,
the acoustic
capturing device may be placed an angle directly in front of the human being.
According to a
preferred exemplary embodiment, the acoustic capturing device captures
acoustic signals in a
unidirectional manner. According to another preferred exemplary embodiment,
the acoustic
capturing device captures acoustic signals in omnidirectional manner. The
acoustic capturing
device may forward the captured acoustic signal to a processing device
physically through a
cable. According to a preferred exemplary embodiment, the acoustic capturing
device is a
wireless microphone that contains a radio transmitter. In a preferred
exemplary embodiment,
the acoustic capturing device is a dynamic microphone. In another preferred
exemplary
embodiment, the acoustic capturing device is a fiber optic microphone. A fiber
optic
microphone converts acoustic waves into electrical signals by sensing changes
in light
intensity, instead of sensing changes in capacitance or magnetic fields as
with conventional
microphones. The acoustic capturing device may use electromagnetic induction
(dynamic
microphones), capacitance change (condenser microphones) or piezoelectricity
(piezoelectric
microphones) to produce an electrical signal from air pressure variations. The
microphones
may be connected to a preamplifier before the signal can be amplified with an
audio power
amplifier or recorded. The microphones may be regularly calibrated due to the
sensitivity of
the measurement. In another preferred exemplary embodiment, the acoustic
capturing device
has a digital interface that directly outputs a digital audio stream through
an XLR or XLD
male connector. The digital audio stream may be processed further without
significant signal
loss.
[0048] According to a preferred exemplary embodiment, the acoustic signal may
then be
captured for a period of time. The acoustic signal may be represented as
Intensity (dB) vs.
Time (secs). According to a preferred exemplary embodiment, the acoustic
signal is captured
for 1 sec to 5 minutes. According to yet another preferred exemplary
embodiment, the
acoustic signal from the food snack is captured for 2 sec. According to a more
preferred
exemplary embodiment, the acoustic signal from the food snack is captured for
1 sec.
According to a most preferred exemplary embodiment, the acoustic signal from
the food
snack is captured for 10 sec.
13
CA 03014206 2018-08-09
WO 2017/152154
PCT/US2017/020833
[0049] According to a preferred exemplary embodiment, the food snack may be
processed in
a human mouth for 1 sec to 3 minutes. According to yet another preferred
exemplary
embodiment, the food snack may be processed in a human mouth less than second.
According to a more preferred exemplary embodiment, the food snack may be
processed in a
human mouth for greater than 3 minutes. According to a most preferred
exemplary
embodiment, the food snack may be processed in a human mouth for 10 seconds to
20
seconds. According to another most preferred exemplary embodiment, the food
snack may be
processed in a human mouth for 5 seconds to 10 seconds.
[0050] The acoustic model may be developed using the method described in more
detail in
FIG. 10 (1000). The model may be programmed into the tool such as tool (0502)
for
measuring one or more texture attributes such as hardness, fracturability and
denseness. An
acoustic model for texture attribute hardness may be described below:
Hardness = f(Xi-n,Ii-n)
Hardness =Ci + I2C2 + I3C3 + InCn --------- (1)
Where, In is an intensity associated with a frequency Xn
Cn is a coefficient associated with the frequency Xn
Coefficients (Ci-Cn) are determined using the method described in FIG. 12
(1200). A signal
processing unit in the texture measurement tool (1306) identifies the relevant
frequencies
(Xn) and associated intensities (In). The tool (1306) may calculate a texture
attribute such as
hardness from the above model 1 by substituting the coefficients values (Ci-
Cn) from a
stored table for the food snack and the intensities (h) from the processed
acoustic signal.
Similarly, other texture attribute such as fracturability and denseness may be
calculated from
their respective models comprising the respective coefficients. It should be
noted that even
though the above represented model (1) shows a linear relationship between the
texture
attribute and intensities, a quadratic or polynomial model may also be
represented to
calculate the texture attributes. The hardness may also be compensated for
changes in the
characteristics of the human saliva when the food snack is consumed.
[0051] Similar acoustic models may be developed for models for other food
properties such a
moisture, solids content, oil content, slice thickness, density, blister
density and topical
seasonings. The relevant frequencies and associated intensities and the
coefficients of the
14
CA 03014206 2018-08-09
WO 2017/152154 PCT/US2017/020833
developed model may change depending on the food property. A generic model
that may
represent a food property may be described below:
Food property = f(Zi-n,Pi-n)
Food Property = Pith + P2D2 + P3D3 + PnDn (2)
Where, In is an intensity associated with a frequency Xn
Cn is a coefficient associated with the frequency Xn
Coefficients (Di-Dn) are determined using the energy excitation method
described in FIG. 9
(0900). A signal processing unit in the texture measurement tool (1306)
identifies the
relevant frequencies (Zn) and associated intensities (Pn). In addition to
texture attribute, the
tool (1306) may calculate a food property from the above model (2) by
substituting the
coefficients values (Di-Dn) from a stored table for the food snack and the
intensities (Pn)
from the processed acoustic signal. The food properties may include Solids
content,
Moisture, Density, Oil content, Slice thickness, Seasoning particle size, and
elements such as
sodium, calcium, copper, zinc, magnesium, and potassium.
[0052] It should be noted that even though the above represented model (1)
shows a linear
relationship between the texture attribute and intensities, a quadratic or
polynomial model
may also be represented to calculate the texture attributes. The food property
may also be
compensated for changes in the characteristics of the human saliva when the
food snack is
consumed. A table (table 1.0) may be used to measure food properties as shown
below from a
captured and processed acoustic signal. The values shown below in table 1.0
are for
illustration purposes only and should not be construed as a limitation.
Table 1.0
Food Property Relevant Intensities Coefficients Value
Limits
Frequencies (Zn) (Pn) (Dn)
Texture 14000 Hz 68 3.5 7 4 to
10
Attribute
15000 Hz 71 2.3
Solids content 16000 Hz 75 1.1 17 12 to
25
33,000 Hz 77 9.0
Density 88000 Hz 83 8.2 1.3 1 to
12
CA 03014206 2018-08-09
WO 2017/152154 PCT/US2017/020833
Viscosity 16000 Hz 59 2.5 36% 20%
to
46%
49,000 Hz 70 2.9
Slice thickness 76000 Hz 64 4.3 0.055 0.035
to
0.075
Rheology/Mout 64000 Hz 74 8.8 0.5% 0.1%
to
h Feel 15%
Exemplary Food Snack Fin2er Printin2 System Embodiment (0600)
[0053] As generally illustrated in FIG. 6, a food snack finger printing system
comprises a
food eating/drinking station (0601), an acoustic capture device (0602), a food
property
matching unit (0603) and a food finger printing display unit (0604). According
to a preferred
exemplary embodiment, a food snack is identified (finger printed) by matching
a measured
acoustic food property with an in-situ quantitative acoustic method, to an
entry in a database,
the database comprising a list of food snacks with associated food property
ranges. The food
property may be any property related to the food snack. According to a
preferred exemplary
embodiment, the food property may be a texture attribute such as hardness,
fracturability,
tooth-pack, roughness of mass, moistness of mass, residual greasiness, surface
roughness,
surface oiliness, and combinations thereof The food property may also be
moisture in the
food snack, brittleness, crispiness, solids content and so on. According to
yet another
preferred exemplary embodiment, the food property is a liquid property such as
viscosity,
rheology, density, and so on. The database comprising a list of food snacks
with associated
food property ranges may be maintained in a local computer database or
remotely in a
network storage database. New food snacks may be added to the database as more
in-situ
quantitative models are developed. A more detailed description of the database
is further
described in FIG. 17 (1700).
Exemplary Data Processin2 Unit (0700)
[0054] As generally illustrated in FIG. 7 (0700), a data processing unit (DPU)
(0701)
comprises a control unit, a display unit, a processing unit and an input
output module. The
control unit may further comprise a microcontroller (0707), a logic controller
(0706), and a
network controller (0705). The display unit may be connected to the control
unit via a host
bus. The display unit may further comprise a display terminal (0708) that is
configured to
16
CA 03014206 2018-08-09
WO 2017/152154
PCT/US2017/020833
display a graphical user interface (GUI) (0709). The GUI (0709) may be
navigated with a
pointing device or through a keyboard connected to the DPU. The GUI (0709) may
be used
to input parameters such as food snack specific frequencies, acoustic capture
time, acoustic
capture frequency range.
[0055] The processing unit may include a digital signal processing unit (0703)
and a
statistical processing unit (0704). The digital signal processing unit (0703)
may get input
from an input-output module (0702). The statistical processing unit (0704) may
receive input
from the digital processing unit (0703) and further process the input to find
relevant
frequencies for generating a quantitative acoustic model for a food snack.
When an acoustic
capturing device captures an acoustic signal, the signal may be forwarded to
the DPU (0701)
via the input-output module (0702). The input output module (0702) may further
comprise a
customized hardware such an analog to digital convertor (ADC) for capturing
and processing
a captured acoustic signal. The acoustic signal may be forwarded to the DPU
using a wired or
a wireless connection. The connection protocol and connecting conducting wires
may be
chosen such that there is minimum loss of signal and the signal to noise ratio
is acceptable for
further processing. A general purpose bus may carry data to and from different
modules of
the DPU (0701). It should be noted that the operation of the bus is beyond the
scope of this
invention.
[0056] The microcontroller (0707) may perform instructions from a memory or a
ROM
(0710). The instruction set of the microcontroller may be implemented to
process the data of
the acoustic signal. A custom instruction set may also be used by the
microcontroller to
prioritize and expedite the processing of the acoustic signal in real time
during a
manufacturing operation. The customization of the instruction set is beyond
the scope of this
invention. The logic controller may perform operations such as sequencing,
prioritization and
automation of tasks. The logic controller may also oversee the hand shake
protocol for the
bus interface. According to an exemplary embodiment, the logic controller
controls the logic
for identifying relevant frequencies in an acoustic signal. The logic
controller may comprise a
matching module that contains predefined frequencies for a plurality of food
snacks. The
logic controller may subsequently match the captured frequencies in the
acoustic signal and
quickly determine the texture of the food snack and the quality of the
texture. For example,
the matching module may include specific frequencies such as 14000 Hz and
75000 Hz.
When a recorded acoustic signal comprises the frequencies 14000 Hz or 75000
Hz, then the
17
CA 03014206 2018-08-09
WO 2017/152154
PCT/US2017/020833
logic controller may determine a match and alert the microcontroller with an
interrupt signal.
The microcontroller may then display the texture information on the display
(0708) via GUI
(0709). The logic controller may further continuously monitor the state of
input devices and
make decisions based upon a custom program to control the state of output
devices.
Exemplary Di2ital Si2nal Processin2 Module (0800)
[0057] Similar to the digital signal processing unit (0703) shown in FIG. 7
(0700), a digital
signal processing unit (DSP) (0800) is generally illustrated in FIG. 8 (0800).
The DSP (0800)
may further comprise a smoothing module (0801), a data transformation module
(0802), a
signal to noise enhancing module (0803) and a normalization module (0804).
[0058] According to an exemplary embodiment, the acoustic smoothing module
(0801)
receives input from an input-module in a data processing unit and smoothens
the received
raw acoustic signal. Acoustic signals are inherently noisy and the data is
discrete. The
acoustic signals may be represented as Intensity (dB) vs. Time (secs or micro
seconds). The
data is made continuous by applying a windowing function to the discrete data.
Windowing
functions that may be applied to the discrete data may include Barlett,
Blackmon, FlatTop,
Hanning, Hamming, Kaiser-Bessel, Turkey and Welch windowing functions. A
smoothing
window with good frequency resolution and low spectral leakage for a random
signal type
may be chosen to smoothen the data. It should be noted that any commonly known
windowing function may be applied to a raw acoustic signal to smoothen and
interpolate the
raw acoustic data.
[0059] The smoothened acoustic signal from the smoothing module (0801) may be
forwarded to a data transformation module (0802). The data transformation
module (0802)
may transform the acoustic signal represented in time domain as Intensity (dB)
vs. Time
(secs) to frequency domain as Intensity (dB) vs. Frequency (Hz) as generally
shown in FIG.
18 (1800). According to a preferred exemplary embodiment, the transformation
of acoustic
signal from a time domain representation to a frequency domain representation
provides for
accurately correlating texture attributes to the pertinent frequencies of a
food snack.
Combining multiple acoustic waves produces a complex pattern in the time
domain, but the
transformed signal using FFT clearly shows as consisting almost entirely of
distinct
frequencies. According to most preferred exemplary embodiment, a fast fourier
transformation (FFT) technique may be used to transform the acoustic signal
from a time
18
CA 03014206 2018-08-09
WO 2017/152154
PCT/US2017/020833
domain representation to a frequency domain representation. An example of the
transformation may be generally seen in FIG. 20 (2000).
[0060] The transformed frequency signal from the transformation module may be
noisy. A
signal to noise enhancement module (0803) may receive the transformed signal
from the data
transform module (0802) and enhance the signal-to-noise ratio of the signal
for further
processing. A technique for smoothing the data to increase the signal-to-noise
ratio without
greatly distorting the signal may be used. A process such as convolution may
also be used to
increase the signal-to-noise ratio. The convolution process may fit successive
sub-sets of
adjacent data points with a low-degree polynomial by the method of linear
least squares.
Normalization module (0804) may receive the enhanced signal-to-noise frequency
domain
signal from the signal to noise enhancement module (0803).
[0061] The DSP (0800) may also identify pertinent frequencies and associated
intensities
from the enhanced signal-to-noise frequency domain signal and store the
information in a
database. A texture attribute computing unit (0712) in the DPU (0701) may
further retrieve
the stored frequency and intensity information to compute a texture attribute
of a food snack.
After a photo acoustic model has been developed, the texture attribute
computing unit (0712)
may store coefficients for different food snacks. The texture attribute
computing unit (0712)
may then retrieve the stored coefficients and the stores frequency and
intensity information to
compute a texture attribute measurement or to fingerprint a food snack.
Exemplary Statistical Processin2 Unit (0900)
[0062] Similar to the statistical processing unit (0704) shown in FIG. 7
(0700), a statistical
processing unit (SPU) (0900) is generally illustrated in FIG. 9. The SPU
(0900) may further
comprise a dimensionality regression module (0901), a variance inflation
factor module
(0902), a principal component analysis module (0903), and a subset regression
module
(0904).
[0063] The smoothened, transformed and normalized signal from the digital
signal
processing unit (0703) is forwarded to SPU (0704) for developing texture
attribute model
with good correlation. The high dimensionality of spectral data requires
statistical filtering to
build meaningful models. For example, the acoustically smoothed signal may be
sampled at
512 linearly spaced frequencies, and each value may be averaged across
replicates and used
to create a statistical model. According to a preferred exemplary embodiment,
the
dimensionality regression module reduces the total frequencies of the spectral
data to a
19
CA 03014206 2018-08-09
WO 2017/152154
PCT/US2017/020833
reasonably acceptable number for model development with high correlation.
According to
another preferred exemplary embodiment, dimensionality reduction of the
frequencies for
variable selection is done using n the foregoing example, the total
frequencies may be
reduced from 512 to 18.
[0064] The data from the dimensionality regression module (0901) may be
processed with a
Variance inflation factors module (VIF) (0902). The VIF module measures how
much the
variance of the estimated regression coefficients are inflated as compared to
when the
predictor variables are not linearly related. The VIF is used to describe how
much
multicollinearity (correlation between predictors) exists in a regression
analysis. As it is
known, Multicollinearity is problematic because it can increase the variance
of the regression
coefficients, making them unstable and difficult to interpret. The square root
of the variance
inflation factor indicates how much larger the standard error is, compared
with what it would
be if that variable were uncorrelated with the other predictor variables in
the model. For
Example, if the variance inflation factor of a predictor variable were 5.27
('/5.27 = 2.3) this
means that the standard error for the coefficient of that predictor variable
is 2.3 times as large
as it would be if that predictor variable were uncorrelated with the other
predictor variables.
[0065] The data from variance inflation factors module (VIF) (0902) may
further be
processed with a principal component analysis module (0903). Principal
component analysis
(PCA) is a technique used to emphasize variation and bring out strong patterns
in a dataset.
It's often used to make data easy to explore and visualize. As defined in the
art, Principal
component analysis (PCA) is a statistical procedure that uses an orthogonal
transformation to
convert a set of observations of possibly correlated variables into a set of
values of linearly
uncorrelated variables called principal components. The number of principal
components is
less than or equal to the number of original variables. This transformation is
defined in such a
way that the first principal component has the largest possible variance (that
is, accounts for
as much of the variability in the data as possible), and each succeeding
component in turn has
the highest variance possible under the constraint that it is orthogonal to
(i.e., uncorrelated
with) the preceding components. According to a preferred exemplary embodiment,
a
principal components analysis is used to determine most relevant frequencies
in the acoustic
signal for developing a quantitative acoustic texture model. It should be
noted that any other
analysis technique known in the art may be used to identify principal
components such as the
relevant frequencies.
CA 03014206 2018-08-09
WO 2017/152154
PCT/US2017/020833
[0066] The data from the PCA module (0903) is further regressed with a best
subsets
regression module (0904) which is used to determine which of these most
relevant
frequencies are best for texture attribute model building with good
correlation. An R2 value
greater than 0.9 may be considered a good correlation between the measure
value from the
model and descriptive expert panel number.
Exemplary Texture Attribute Measurement Method
[0067] As generally shown in FIG. 10, an exemplary texture measurement method
may be
generally described in terms of the following steps:
(1) eating/drinking a food product (1001);
a human being may eat a food product via a molar chew, a natural chew and/or
a frontal bite. Once an eating method is selected, the eating method may be
consistently utilized throughout the process of development of the acoustic in-
situ model and also for capturing the acoustic signal.
(2) generating an acoustic signal from eating/drinking the food product
(1002);
an acoustic signal may be generated during eating from a jawbone conduction
that may vibrate an eardrum and change the pressure of the air surrounding the
ear drum. Jawbone conduction is the conduction of sound to the inner ear
through the bones of the skull. Bone conduction is one reason why a person's
voice sounds different to them when it is recorded and played back. Because
the skull conducts lower frequencies better than air, people perceive their
own
voices to be lower and fuller than others do, and a recording of one's own
voice frequently sounds higher than one expects it to sound. The acoustic
signals during the process of drinking or eating or chewing are perceived
differently by different human beings. An in-situ measure of the acoustic
signals and a model enables to distinguish various food snacks and liquids.
(3) capturing the acoustic signal with an acoustic capturing device (1003);
(4) converting the acoustic signal from a time domain to a frequency domain
(1004);
(5) identifying relevant frequencies and their associated intensities
(1005); and
(6) quantifying said texture attribute of the food product based on the
relevant
frequencies and the associated intensities (1006).
21
CA 03014206 2018-08-09
WO 2017/152154
PCT/US2017/020833
The texture attribute of the food snack may be measured with an in-situ
acoustic texture model. It should be noted that the in-situ acoustic texture
model used to measure a texture attribute may be compensated for changes in
the properties of the human saliva such as viscosity and pH. According to a
preferred exemplary embodiment, the calibration model may further be
developed to adjust or compensate for background noise, human to human
variation and method of eating/drinking.
[0068] This general method summary may be augmented by the various elements
described
herein to produce a wide variety of invention embodiments consistent with this
overall design
description. According to a preferred exemplary embodiment, when a food or
beverage item
is consumed a texture attribute may be measured with the acoustic fingerprint
of each food
and beverage item which include the interaction with human saliva.
Differentiating
sweeteners at the concentrations they are found in beverages for example a
Diet Pepsi 0 vs. a
regular Pepsi 0 and when in contact with saliva, different sweeteners can have
different
interactions with human saliva given their chemical composition, the mixture
of the beverage
and the saliva produces viscosity differences that can be modeled with an in-
situ model as
described above in FIG. 10 (1000).
Exemplary Texture Attribute Correlation Method
[0069] As generally shown in FIG. 11, an exemplary texture correlation method
may be
generally described in terms of the following steps:
(1) Shipping food snack samples to an expert panel (1101);
The shipping of the food snack samples may take time and the food snack may
undergo texture change during the shipping process. The number of times
samples are shipped to an expert panel is substantially reduced due a high
correlation in-situ model developed according to a preferred exemplary
embodiment.
(2) Qualitatively analyzing the food snack samples (1102);
quantitatively measure texture attributes by an expert panel for assigning
taste
panel scores ("descriptive panel number").
(3) Assigning a descriptive panel number for the texture attributes of the
food
snack sample (1103);
22
CA 03014206 2018-08-09
WO 2017/152154
PCT/US2017/020833
(4) Measuring texture attributes with an in-situ quantitative acoustic
model
(1104);
The in-situ model may be compensated with different coefficients to account
for individual human saliva and chewing preferences. For example, Human A
may be chewing with saliva having a viscosity A and pH A and use a chew
pattern A. Human B may be chewing with saliva having a viscosity B and pH
B and use a chew pattern B. When the in-situ model is developed using
method described in FIG. 12 (1200), the coefficients may be different for
Human A vs. Human B to account for the differences. A unique model may be
used for each of the texture attributes. Therefore, the texture attribute
would
be same independent of the human eating/drinking the solid/liquid.
(5) Correlating the texture attribute as measure by the in-situ
quantitative and the
qualitative expert panel texture attributes (1105); and
(6) Generating a correlation model for the texture attributes (1106).
[0070] This general method summary may be augmented by the various elements
described
herein to produce a wide variety of invention embodiments consistent with this
overall design
description.
Exemplary Texture Attribute Model Development Method (1200)
[0071] As generally shown in FIG. 12, an exemplary texture attribute model
development
method may be generally described in terms of the following steps:
(1) Receiving a raw acoustic signal (1201);
(2) Filtering, smoothing and transforming the raw acoustic signal (1202);
The signal may be adjusted for background noise. For example an empty cell
may be used to capture background frequencies that may be compensated by
addition or deletion in the captured acoustic signal. The background noise may
be compensated for frequencies below 20 KHz and may not be compensated
for frequencies above 20 KHz.
(3) Regressing and identifying relevant frequencies (1203);
(4) Generating a model for the texture attributes (1204).
Coefficients for the model may be determined based on step (1203) and
adjusted or compensated for saliva properties and chewing mechanism.
23
CA 03014206 2018-08-09
WO 2017/152154
PCT/US2017/020833
[0072] This general method summary may be augmented by the various elements
described
herein to produce a wide variety of invention embodiments consistent with this
overall design
description.
[0073] It should be noted that the method used to generate the aforementioned
texture
attribute model may be used to generate models for other food properties such
a moisture,
solids content, oil content, slice thickness, density, blister density and
topical seasonings. The
relevant frequencies and associated intensities and the coefficients of the
developed model
may change depending on the food property that is measured with the acoustic
method.
Exemplary Acoustic Si2nal Method (1300)
[0074] As generally illustrated in FIG. 13, an exemplary correlation plot
between
quantitative acoustic texture attributes such as hardness (diamond shaped
points), denseness
(triangle shaped points), and fracturability (square shaped points) on x-axis
and expert panel
number on y-axis is shown. According to a preferred exemplary embodiment, the
adjusted R2
is greater than 0.9.
Exemplary Acoustic Si2nal Processin2 Method (1400)
[0075] As generally shown in FIG. 14, an exemplary Acoustic Signal Processing
method
may be generally described in terms of the following steps:
(1) Receiving an raw acoustic signal (1401);
(2) Smoothing the raw acoustic signal with a windowing function to create a
smoothened acoustic signal (1402);
(3) Transforming the smoothened acoustic signal into a frequency domain
signal
(1403);
(4) Increasing the signal-to-noise of the frequency domain signal (1404);
and
(5) Normalizing and bucketing the frequency domain signal (1405).
[0076] This general method summary may be augmented by the various elements
described
herein to produce a wide variety of invention embodiments consistent with this
overall design
description.
Exemplary Acoustic Statistical Processin2 Method (1500)
[0077] As generally shown in FIG. 15, an exemplary Acoustic Signal Generation
method
may be generally described in terms of the following steps:
(1) Receiving a frequency domain acoustic signal (1501);
24
CA 03014206 2018-08-09
WO 2017/152154
PCT/US2017/020833
(2) Selecting variables based on dimensionality reduction of the
frequencies in the
frequency domain acoustic signal (1502);
(3) Filtering selected variables with a principal component analysis
(1503);
(4) Performing subset regression of the filtered variables (1504); and
(5) Generate an in-situ model of texture attributes with the filtered
variables
(1505).
The filtered variables may be the relevant frequencies in the acoustic signal
that show a
strong correlation. This general method summary may be augmented by the
various elements
described herein to produce a wide variety of invention embodiments consistent
with this
overall design description.
Exemplary Food Snack Finger Printing Method (1600)
[0078] As generally shown in FIG. 16, an exemplary food snack finger printing
method may
be generally described in terms of the following steps:
(1) eating/drinking a food snack (1601);
(2) generating an acoustic signal from eating/drinking the food snack
(1602);
(3) capturing the acoustic signal with an acoustic capturing device (1603);
(4) forwarding the acoustic signal to a data matching unit (1604);
(5) measuring a food property number of the food snack with an in-situ
acoustic
model (1605);
(6) comparing the food property number with an entry in a matching table
(1606);
(7) if a match exists in step (1606), finger printing the food snack
(1607); and
(8) if a match does not exist in step (1606), adding the food snack to the
database
for further use (1608).
[0079] The
above method enables a human being to distinguish and identify foods or
beverages by a simple act of consumption and recording the acoustic signal.
For example, a
sweetened beverage can be distinguished from another sweetened beverage by
consuming
both the beverages separately and recording the acoustic signals. The acoustic
signals may
then be matched to a preexisting database and then identified. The exemplary
method (1600)
may be utilized to conduct blind taste testing and target specific responses
of the taste testing.
A harder food snack may generate an acoustic signal associated with
frequencies and
intensities that are different than a softer food snack. Similarly, a food
snack with a greater
oil content may generate an acoustic signal associated with frequencies and
intensities that
CA 03014206 2018-08-09
WO 2017/152154
PCT/US2017/020833
are different than a less oil content food snack. Likewise, a beverage which
is acidic may
generate an acoustic signal associated with frequencies and intensities that
are different than
a non-acidic beverage. This general method summary may be augmented by the
various
elements described herein to produce a wide variety of invention embodiments
consistent
with this overall design description.
Exemplary Food Property Matching Table (1700)
[0080] As generally illustrated in FIG. 17, an exemplary food property
matching table (1700)
is shown. The table may include a food snack in column (1701) and an
associated food
property (1702) in another column. The entries (1710, 1711) may include data
for the food
snack and food property for matching purposes. For example, food snack column
(1701) may
comprise various solids and/or liquids and their associated texture or liquid
properties in
column (1702). Each of the entries in the table (1700) may be populated after
an in-situ
model for the food snack has been developed by the aforementioned methods
described in
FIG. 12 (1200). For example, an entry (1711), may be a potato chip A. A range
for the
texture or other food properties may be determined with the in-situ acoustic
model for the
potato chip A and entered as an entry in table (1700). Similarly, food
properties for other
food products are measured with the in-situ acoustic model and entered into
the table. The in-
situ acoustic model may or may not be correlated with an expert panel number.
The food
property may be a single texture attribute, a combination of texture
attributes or a composite
number comprising a combination of other food properties such as moisture,
brittleness, solid
content and so on. When a food snack is measured with an in-situ measurement
method a
food property number may be determined. The food property number may be
obtained from a
single sample or an average of multiple samples. The measured food property
number may
then be looked up in the column (1702) in the matching table (1700) and a
corresponding
food snack is determined in the column (1701). Thereby, a food snack is finger
printed based
on in-situ measurement. According to an exemplary embodiment, food snacks with
subtle
differences in food property may be differentiated with the food finger
printing technique.
For examples, various potato chips such as baked, fried, and/or textured may
be differentiated
by measuring each of them and looking up the corresponding potato chip in the
matching
table (1700) from the measured food property numbers. Foods may be separated
into buckets
with the in-situ measurement and matching process as aforementioned in FIG. 16
(1600).
Similarly, liquids with subtle differences may be put into separate buckets
based on a
particular liquid property such as viscosity, sweetness, mouth feel, density,
pH and so on.
26
CA 03014206 2018-08-09
WO 2017/152154
PCT/US2017/020833
Exemplary Discrete in-line feedback control with In-Situ Acoustic Ouantitative
Texture
Measurement (1800)
[0081] As generally illustrated in FIG. 18 (1800), a food snack manufacturing
system
comprising an in-situ Acoustic Quantitative Texture Measurement apparatus
(1806) is
positioned after a food processing unit (FPU) (1805). The system (1800)
illustrated in FIG.
18 (1800) may be used to manufacture potato chips. The manufacturing system
may comprise
a series of stations that include a sourcing stage (1801), a storage station
(1802), wash/peel
station (1803), slicing station (1804), frying station (1805), measurement
station (1806), a
seasoning station (1807), a packaging station (1808) and a labeling station
(1809). The food
snacks, such as potato chips, may be conveyed from station to station on a
conveyor belt in
the manufacturing system. According to a preferred exemplary embodiment, an in-
line
feedback control with in-situ acoustic quantitative texture measurement
apparatus enables to
manufacture consistent food texture quality. The acoustic quantitative texture
measurement
apparatus may be positioned immediately after (downstream) the FPU (1805) and
before a
seasoning unit (1807) or packaging unit (1808). A human being (1813) may be
positioned
close to the acoustic quantitative texture measurement apparatus (1806) to
consume food
snack output from FPU (1805). According to a preferred exemplary embodiment,
the
apparatus (1806) records/captures acoustic signal when the human being (1813)
consumes
(eats/drinks) food snack from FPU (1805) and processes the acoustic signal to
quantitatively
measure a texture attribute. According to a preferred exemplary embodiment,
depending on
the measured texture attribute, the human being may adjust process parameters
in an output
controller (1812) to control the output quality from the FPU (1805). The
output controller
(1812) may be connected to a slicing input controller (1810) and a frying
input controller
(1811). Typical process control equipment such as PI, PID control devices, may
be used to
control the input parameters of the slicing and frying units. For example, if
the texture
attribute, hardness falls outside an acceptable limit, a human being may
program the output
controller (1812) to adjust an input parameter to the frying unit such as
frying temperature or
frying time. The human being may also adjust program the output controller
(1812) to adjust
an input parameter to the slicing unit so that the slices are thinner or
thicker depending on the
correlation of the output texture attribute to the input parameters.
27
CA 03014206 2018-08-09
WO 2017/152154
PCT/US2017/020833
Exemplary Discrete in-line feedback control with In-Situ Acoustic Ouantitative
Texture
Measurement (1900)
[0082] A discrete feedback method for controlling a texture attribute of food
product
continuously output from a food processing unit, the method comprises the
steps of:
(1) Processing food ingredients in said food processing unit to produce
said food
product (1901);
(2) Consuming the food snack at set interval (1902);
The interval may be set as short as 10 minutes to as long as 6 hours. Shorter
intervals provide a tight quality control as the sample selected to measure
texture is representative of the interval. According to a preferred exemplary
embodiment, the interval is set within a range of 1 min to 10 hours. According
to a preferred more exemplary embodiment, the interval is set to 30 minutes
hour. According to a most preferred exemplary embodiment, the interval is set
to 1 hour.
(3) Quantitatively measuring a texture attribute of said food product with
a texture
measuring tool and a correlated in-situ acoustic texture model (1903);
An apparatus as aforementioned in FIG. 5 (0500) may be used to measure a
texture attribute such as hardness, fracturability, or denseness.
(4) If said texture attribute measured in step (3) is outside an acceptable
limit,
feeding back information to said food processing unit to adjust input
parameters to
said food processing unit such that a texture attribute measured for
subsequent food
products produced from said food processing unit falls with said acceptable
range
(1904);
An acceptable limit may be established for each of the texture attributes
based
on a taste panel correlation. The input process parameters to the food
processing units such as fryer and slicing units are adjusted manually. If the
measured texture attribute with the in-situ apparatus falls outside of an
acceptable range, an output controller (1812) may be adjusted to control the
output quality from the food processing unit. The acceptable range may be
based on a correlated expert panel number or past experience with mouthfeel.
This provides a significant advantage over prior method of tasting the food
snack and comparing it to a reference sample. The in-situ method enables a
28
CA 03014206 2018-08-09
WO 2017/152154
PCT/US2017/020833
quantitative feedback to the food processing unit, rather than a qualitative
feedback as currently performed in the art.
[0083] This
general method summary may be augmented by the various elements
described herein to produce a wide variety of invention embodiments consistent
with this
overall design description.
[0084] A discrete feedback system for controlling texture of a food product in
a continuous
manufacturing process using the method described above in FIG. 19 (1900) may
comprise a
food pre-processing unit, a food processing unit, a texture measuring tool
positioned
downstream from the food processing unit, wherein the texture measuring tool
is configured
to quantitatively measure a texture attribute of the food product that is
output from the food
processing unit when a human being eats or drinks a portion of the food
product and an
acoustic capturing device to capture an acoustic signal generated by the
eating or drinking
activity, and a controller controlling a plurality of input parameters to the
food processing
unit and the food pre-processing unit based on input from the texture
measuring tool.
According to a preferred exemplary embodiment, the controller utilizes the
texture attribute
information to control the plurality of input parameters to the food
processing unit and the
food pre-processing unit such that a texture attribute of a resultant food
product output from
the food processing unit falls within an acceptable limit.
[0085] According to another preferred exemplary embodiment, a discrete
feedforward system
for controlling texture of a food product in a continuous manufacturing
process, may
comprise a food pre-processing unit, a food processing unit, a texture
measuring tool
positioned downstream from the food pre-processing unit, wherein the texture
measuring tool
is configured to quantitatively measure an input attribute of food ingredients
that are input to
said food pre-processing unit when a human being eats or drinks a portion of
the food
ingredients and an acoustic capturing device to capture the acoustic signal
generated by the
eating activity; and a controller controlling a plurality of input parameters
to the food
processing unit and the food pre-processing unit based on input from the
texture measuring
tool. A feedforward method for controlling output texture of a food product
using the
aforementioned feedforward system, the method may be generally described in
terms of the
following steps:
(1)
measuring an input texture attribute of food ingredients with an input texture
measuring tool and a eating activity;
29
CA 03014206 2018-08-09
WO 2017/152154
PCT/US2017/020833
(2) programming plural input parameters to a food processing unit based on
the
input texture attribute;
(3) producing food product from the food processing unit; and
(4) measuring an output texture attribute of the food product with an
output
texture measuring tool and a eating activity.
The step of measuring the output texture attribute may further comprise the
steps of:
(5) determining if the output texture attribute is within an acceptable
output limit;
and
(6) if the output texture attribute is outside an acceptable output limit,
feeding
back output texture attribute information to an output controller to adjust
the
input parameters to the food processing unit;
Exemplary Acoustic Si2nal Time Domain to Frequency Domain Conversion (2000)
[0086] As generally illustrated in FIG. 20, an exemplary acoustic signal
captured in time
domain (transient) (2010) is converted to a frequency domain (2020) with
Fourier
transformation. During an eating activity of a food snack, an acoustic signal
is captured in
time domain and is recorded and plotted as Intensity (dB) vs. time (secs). The
recorded
acoustic signal may be transformed into a frequency domain signal as
illustrated in FIG. 20
(2020). The transformed acoustic signal may be further processed to identify
relevant
frequencies based on a statistical regression analysis. An acoustic model to
quantitatively
measure a texture attribute may be developed with the identified relevant
frequencies and
their associated intensities as variables.
Exemplary Texture Attribute vs. Relevant Frequencies Chart (2100 - 2300)
[0087] As generally illustrated in FIG. 21 and FIG. 22, an exemplary texture
attribute vs.
relevant frequencies chart may be used to compute the hardness of a food
snack. The relevant
frequencies may be identified by a statistical regression for a particular
texture attribute and a
food snack. For example, frequencies (2101) may be relevant for hardness and
frequencies
(2201) may be relevant for fracturability. According to a preferred exemplary
embodiment,
the relevant frequencies and corresponding intensities identified in a
transformed acoustic
signal may be substituted in an acoustic model to quantitatively measure a
texture attribute
such as hardness. It should be noted that the frequencies indicated on x-axis
are frequency
CA 03014206 2018-08-09
WO 2017/152154
PCT/US2017/020833
"buckets" as determined by an algorithm, and not the literal frequencies (i.e.
400 is not 400
Hz, it is more like 18,000 Hz).
[0088] As generally illustrated in FIG. 23, an exemplary texture attribute
Intensity (dB)
(2301) vs. relevant frequencies (2302) chart for a food snack treated with
various input
conditions. Plot (2314), (2315), (2316) are frequency vs. Intensity graphs for
a potato chip
with different solid content, moisture content and hardness of the input
ingredients such as
potatoes. For example, a plot (2314) may be a frequency vs. intensity plot for
a food snack
that has a different solids content in the input ingredients. Similarly, a
plot (2315) may be a
frequency vs. intensity plot for a food snack that has a different moisture
content and
different hardness in the input ingredients respectively. A plot (2306) may be
plotted for
background noise so that the resulting plot may be compensated for the noise.
After
identifying the relevant frequencies for a food snack such as a potato chip,
an acoustic signal
may be captured for each of the input conditions and the acoustic signal may
be further
processed to determine the intensities associated with the identified
frequencies for the food
property of the food snack. For example in FIG. 23, an identified frequency
40000 Hz may
have an intensity of 75 dB (2303) for plot (2313), an intensity of 74 dB
(2304) for plot (2314)
and an intensity of 76 dB (2305) for plot (2315). The intensities may be
substituted into a
food property model generated by aforementioned equation (2) and a food
property such as a
texture attribute may be calculated. As illustrated in FIG. 23, the 3
different input conditions
of the food ingredients (solids content, moisture content and hardness)
resulted in 3 different
associated intensities which further result in 3 different texture attributes.
Therefore, an
acoustic signal may be captured and processed for a food product and a texture
attribute may
be calculated based on the relevant frequencies. The input conditions may be
tailored to
achieve a desirable texture attribute value that is within a predefined limit.
The predefined
limit may be correlated to a qualitative descriptive panel number. Similarly,
plots may be
generated for various food properties by capturing an acoustic signal and
processing it. The
intensities associated with the various food properties at their respective
frequencies may be
determined and the food property may be calculated. A model may be generated
for each of
the food properties through signal processing and statistical regression as
aforementioned.
Therefore, an in-situ method may be used to identify differences in a food
product based on
any food property such as a texture attribute, moisture, oil content, density,
viscosity or
mouthfeel. The differences in the food product may be as minor as +-5% of the
desirable
value. For example, a desirable hardness value of 75 may provide an acoustic
signature that
31
CA 03014206 2018-08-09
WO 2017/152154
PCT/US2017/020833
may be differentiated from a hardness value of 70 that may be undesirable for
the food
product. The food product with the undesirable value (70) may be rejected and
not further
processed or packaged.
5ystem Summary
[0089] The present invention system anticipates a wide variety of variations
in the basic
theme of in-situ texture measurement with an apparatus that includes an
acoustic capturing
device and a data processing unit. When a human being eats/drinks a food
snack, the physical
interaction in the mouth sends pressure waves that propagate through the ear
bone and
produce an acoustic signal. The acoustic capturing device records and forwards
the signal to
a data processing unit. The data processing unit further comprises a digital
signal processing
module that smoothens, transforms and filters the received acoustic signal. A
statistical
processing module further filters the acoustic signal from the data processing
unit and
generates a quantitative acoustic model for texture attributes such as
hardness and
fracturability. The quantitative model is correlated with a qualitative
texture measurement
from a descriptive expert panel. Another method includes a food snack
fingerprinting using
an in-situ quantitative food property measurement.
[0090] This general system summary may be augmented by the various elements
described
herein to produce a wide variety of invention embodiments consistent with this
overall design
description.
Method Summary
[0091] The present invention method anticipates a wide variety of variations
in the basic
theme of implementation, but can be generalized as a method of quantitatively
measuring
texture of a food snack, the method comprises the steps of:
(1) eating/drinking a food snack;
(2) generating an acoustic signal from eating/drinking the food snack;
(3) capturing the acoustic signal with an acoustic capturing device;
(4) converting the acoustic signal from a time domain to a frequency
domain;
(5) identifying relevant frequencies and their associated intensities; and
(6) quantifying said texture attribute of the food product based on the
relevant
frequencies and the associated intensities.
32
CA 03014206 2018-08-09
WO 2017/152154
PCT/US2017/020833
[0092] This general method summary may be augmented by the various elements
described
herein to produce a wide variety of invention embodiments consistent with this
overall design
description.
5vstem/Method Variations
[0093] The present invention anticipates a wide variety of variations in the
basic theme of in-
situ quantitative texture attribute measurement. The examples presented
previously do not
represent the entire scope of possible usages. They are meant to cite a few of
the almost
limitless possibilities.
[0094] This basic system and method may be augmented with a variety of
ancillary
embodiments, including but not limited to:
= An embodiment wherein the data processing unit further comprises a
digital signal
processing unit and a texture attribute calculation unit.
= An embodiment wherein the digital signal processing unit is configured to
smoothen,
transform and filter the acoustic signal to identify relevant frequencies
relating to the
texture attribute.
= An embodiment wherein the texture attribute calculation unit is
configured to
calculate the texture attribute from the relevant frequencies.
= An embodiment wherein the texture attribute is selected from a group
comprising:
hardness, fracturablity, and denseness.
= An embodiment wherein the eating activity is a frontal bite with tooth of
the human
being.
= An embodiment wherein the eating activity is a molar chew of the human
being.
= An embodiment wherein the eating activity is a natural chew of the human
being.
= An embodiment wherein the food snack is a solid.
= An embodiment wherein the food snack is a liquid.
= An embodiment wherein the acoustic capturing device is a microphone; the
microphone is configured to be wired to the data processing unit.
= An embodiment wherein the acoustic capturing device is a microphone; the
microphone is configured to wirelessly connect with the data processing unit.
= An embodiment wherein the acoustic capturing device is configured to
capture
acoustic waves within the frequency range.
= An embodiment wherein the acoustic capturing device is configured to
capture sound
33
CA 03014206 2018-08-09
WO 2017/152154
PCT/US2017/020833
waves in a single direction.
= An embodiment wherein the acoustic capturing device is configured to
capture sound
waves in all directions.
= An embodiment wherein the acoustic capturing device is integrated with
the digital
signal processing unit.
[0095] One skilled in the art will recognize that other embodiments are
possible based on
combinations of elements taught within the above invention description.
Discrete In-situ Feedback Manufacturing System Summary
[0096] The present invention system anticipates a wide variety of variations
in the basic
theme of a discrete feedback system for controlling texture of a food snack in
a
manufacturing process. The system comprises an in-situ texture measuring tool
positioned
downstream of a food processing unit along with a human being consume a food
snack from
the food processing unit at a set interval. The in-situ tool quantitatively
measures a texture
attribute of the food snack when the human being consumes the food snack. When
the texture
attribute is outside of an acceptable limit, the human being controls input
parameters to the
food processing unit such that a subsequent texture attribute of a food snack
output from the
food processing unit falls within the acceptable limit.
[0097] This general system summary may be augmented by the various elements
described
herein to produce a wide variety of invention embodiments consistent with this
overall design
description.
Discrete In-situ Feedback Manufacturing Method Summary
[0098] The present invention method anticipates a wide variety of variations
in the basic
theme of implementation, but can be generalized as a method of quantitatively
measuring
texture of a food snack, the method comprises the steps of:
(1) processing food ingredients in the food processing unit to produce the
food
product;
(2) consuming the food product at a set interval;
(3) measuring a texture attribute of the food product with a texture
measuring tool
and a correlated in-situ acoustic texture model; and
34
CA 03014206 2018-08-09
WO 2017/152154
PCT/US2017/020833
(4) if the
texture attribute measured in step (3) is outside an acceptable limit,
feeding back information to the food processing unit to adjust input
parameters to the
food processing unit such that a texture attribute measured for subsequent
food
products produced from the food processing unit falls with the acceptable
range.
[0099] This general method summary may be augmented by the various elements
described
herein to produce a wide variety of invention embodiments consistent with this
overall design description.