Note: Descriptions are shown in the official language in which they were submitted.
SYSTEMS AND METHODS FOR RATING ASSET OWNER GOVERNANCE
FIELD
[0001] The present disclosure generally relates to asset owner
governance, and more
particularly to systems and methods for rating fiduciary effectiveness in
asset owner governance.
BACKGROUND
[0002] The Background and Summary are provided to introduce a foundation
and
selection of concepts that are further described below in the Detailed
Description. The
Background and Summary are not intended to identify key or essential features
of the claimed
subject matter, nor are they intended to be used as an aid in limiting the
scope of the claimed
subject matter.
[0003] The U.S. and many developed countries are currently facing a
retirement savings
crisis. Among other issues, the governance of institutional funds, such as
public pension plans, is
coming under greater scrutiny in light of the systematic and chronic under
funding, declining
investment returns, and shifts into higher risk asset classes. Many states and
local retirement
plans are on an unsustainable course, having failed to set aside enough money
to fund the
promises they have made. A disconnect often exists between an organization's
process and the
outcome of this process, specifically with regard to the overall effectiveness
of the organization's
investment performance and funding status.
[0004] Unfortunately, statutory fiduciary standards relative to the
management of
institutional funds by organizations offer little guidance from a process
point of view. Today
investors, donors, tax payers, and beneficiaries are often poorly equipped to
objectively evaluate
an organization's fiduciary effectiveness, or to otherwise distinguish the
effectiveness of one
organization in managing its assets over another.
[0005] While behavioral finance research remains a fruitful ground for
study, a number
of biases are known to impact people's ability to make effective retirement
decisions. Some
behavioral deficiencies can be neutralized with basic financial literacy,
reducing some portion of
poor investment decisions. This applies to those making decisions on their own
investments, as
well as those making decisions on behalf of others, such as trustees of
pension boards. However,
the issue of objective evaluation of fiduciary processes and effectiveness
persists.
1
CA 3015975 2018-08-29
=
SUMMARY
[0006] One embodiment of the present disclosure generally relates to
a method for rating
fiduciaries that govern assets. Governance variables relating to at least one
of environmental and
social factors for governing the assets are collected, where the governance
variables impact
performance for the assets. Control variables are assigned, where the control
variables also
impact the performance for the assets. A collection of actual test values are
compiled for the
governance variables, the control variables, and the performance for test
assets within the assets.
A weight factor indicating the impacts on the performance for the test assets
by each of the
governance variables and the control variables is assigned. A rating model
incorporating the
governance variables and the control variables with each respective weight
factor is constructed.
Actual asset values for the governance variables and the control variables for
a given asset within
the assets are collected and a given fiduciary within the fiduciaries that
governs the given asset is
rated by using the rating model with the actual asset values collected.
[0007] Another embodiment generally relates to a system for rating
fiduciaries that
govern assets. The system includes a collection of governance variables that
relate to at least one
of environmental and social factors for governing the assets, where the
governance variables
impact financial performance for the assets based on actual test data. The
system further
includes a collection of control variables, wherein the control variables also
impact the financial
performance for the assets. A collection of weight factors indicates the
impacts on the financial
performance for the test assets by each of the governance variables and the
control variables.
The weight factors are based on actual test values for the governance
variables, the control
variables, and the financial performance for test assets within the assets. A
given fiduciary
within the fiduciaries is rated by applying the weight factors to actual asset
values collected for
the given fiduciary for the governing variables and the control variables.
[0008] Another embodiment generally relates to a method for rating
fiduciaries that
govern funds. The method includes collecting governance variables relating to
environmental,
social, and governance factors for governing the funds. The governance
variables impact
financial performance for the funds and collecting the governance variables
includes gathering
data from meeting minutes of the fiduciaries. Control variables are assigned,
where the control
variables also impact the financial performance for the funds. A collection of
actual test values
for the governance variables, the control variables, and the financial
performance for test funds
2
CA 3015975 2018-08-29
within the funds are compiled. The actual test values for the governance
variables and the
control variables are taken over a test period, and the actual test values for
the financial
performance are taken over a delayed period that is delayed from the test
period. A weight factor
indicating the impacts on the financial performance for the test funds by each
of the governance
variablesand the control variables is assigned. Each weight factor of the
governance variables
and the control variables is normalized and a normalized weight factor is
correspondingly
assigned for each weight factor. A rating model incorporating the governance
variables and the
control variables with each respective normalized weight factor is
constructed. Actual fund
values for the governance variables and the control variables for a given fund
within the funds
are collected and a given fiduciary within the fiduciaries that governs the
given fund is rated by
using the rating model with the actual fund values collected.
[0009] Various other features, objects and advantages of the disclosure
will be made
apparent from the following description taken together with the drawings.
BRIEF DESCRIPTION OF THE DRAWINGS
[00010] The drawings illustrate the best mode presently contemplated of
carrying out the
disclosure. The same numbers are used throughout the drawings to reference
like features and
like components. In the drawings:
[00011] Fig. 1 is a schematic view of an exemplary system in accordance
with the present
disclosure;
[00012] Fig. 2 depicts a process flow of an exemplary method in accordance
with the
present disclosure;
[00013] Figs. 3-5 depict a detailed process flow for an exemplary method
similar Fig. 2;
[00014] Figs. 6a-12 depict exemplary variables and analysis corresponding
to certain
embodiments in accordance with the present disclosure; and
[00015] Figs. 13a-c depict exemplary variables relating to Environmental,
Social, and
Governance (ESG) factors.
DETAILED DISCLOSURE
[00016] This written description uses examples to disclose embodiments of
the present
application, including the best mode, and also to enable any person skilled in
the art to practice
3
CA 3015975 2018-08-29
or make and use the same. The patentable scope of the invention is defined by
the claims and
may include other examples that occur to those skilled in the art. Such other
examples are
intended to be within the scope of the claims if they have structural elements
that do not differ
from the literal language of the claims, or if they include equivalent
structural elements with
insubstantial differences from the literal language of the claims.
[00017] The present inventors have identified that the current system of
education for
financial literacy is inadequate in preparing people for making and managing
their financial
decisions. This has contributed to generations of Americans who suffer from a
lack of essential
working knowledge for planning, as well as for household budgeting, management
of credit,
savings, and investing.
[00018] This lack of financial prowess is further exacerbated by the lack
of a standard or
even effective mechanism for determining the performance of others delegated
to assist in
managing one's financial affairs. This at least in part arises from the common
belief that a
fiduciary's actions and behaviors in performing its fiduciary duty in managing
a fund is either
met, or not met, as in "either-or" proposition. However, by the time a
fiduciary's actions have
fallen to the point where their fiduciary duties would no longer be met from a
legal standpoint,
the fund is likely already in dire straights, including significant erosion in
financial position,
bankruptcy, fraud, litigation, and/or regulatory violations. Public awareness
of any of these
conditions is not likely to be widespread until it appears as a headline in
the news after the fact.
[00019] While much research has been done on the proper attributes of a
fiduciary or the
makeup of a board, many challenges remain. One common issue pointed out in the
literature is
that independent, outside directors may not have access to all of the
necessary information, or the
time or inclination to review it, to make effective decisions. Accordingly,
many boards have a
mix of internal and external board members. Empirical studies have also shown
that smaller
boards are often more effective.
[00020] The role of directors within committees may also play a role in
the effectiveness
of the board. Specifically, committees should be organized with specialized
roles to enhance the
board's performance in both its productivity and monitoring functions. Each
committee should
be set up with a defined set of functions and goals, and be staffed with
directors most likely to
attain each goal. Common committee structures follow this framework:
governance/nominating,
audit, compensation, strategy, finance (investments/capital budgeting) and
other ad hoc
4
CA 3015975 2018-08-29
committees. Committees exist to do the work of the board within a task-
specific area. They are
used to facilitate, evaluate and ratify long-term investment decisions and to
monitor the
performance of senior management. One would expect productivity-oriented
committees to be
staffed by insiders and monitoring-oriented committees by outsiders. This is,
in fact, how many
boards arrange themselves.
[00021] Board of director compensation structure is also important for
aligning interests of
the board with those of shareholders (e.g. stock ownership). Likewise, boards
are also
responsible for hiring the CEO and other top management, and structuring
management
compensation. The compensation issue has drawn much ire in recent years as the
pay packages
of CEOs have become increasingly larger, in many cases despite retention or
turnover. It has
been a hot button issue, and "say on pay" rights of shareholders have recently
been under
scrutiny.
[00022] Two forms of error are also present in investment management,
operational risk
and behavioral risk or error in human decision-making. As will become clear,
one is very
functional in form, and the other is more strategic. Operational risk can be
more easily controlled
and safeguarded against through audits, procedures and practices. However,
behavioral risk is
more subjective, ambiguous and difficult to judge in practice, and requires
structural and process
adjustments to limit it.
[00023] The disconnect between fiduciary standards and effectiveness has
perverse impact
across all major categories of institutional funds: a growing number of failed
private pension
plans, chronically underfunded state and municipal pension plans, and non-
profitable
organizations with such poor oversight that they are regularly vulnerable to
white collar crime.
These widespread problems in our nation's private and public pension system,
in both profit and
non-profit sectors, illustrate a system of financial management operating at a
level that gives
cause for real concern.
[00024] Previous studies have focused on investment managers, such as the
Morningstar
and FI360 rating systems. To date, no study has comprehensively examined
fiduciary
effectiveness of primary institutional fund organizations as a whole, nor
applied it so that it can
be used in comparing multiple organizations. Certainly, none have focused on
an overall
fiduciary effectiveness score for the governing fiduciary.
CA 3015975 2018-08-29
[00025] In the publication "The Governance of Public Pensions: An
Institutional
Framework" (Administration & Society, 1-29, January 28, 2016), authors Matkin,
Chen, and
Khalid call for a more comprehensive, data-driven approach to understanding
public pension
finance. This call to action demands two things: 1) more complete datasets are
needed to analyze
this complex topic; and 2) better ways of analyzing the data to improve both
public policy and
private sector activity.
[00026] The corporate governance methods of analysis and data collection
methods of
organizational behavior addressed in this paper may hold the keys to answering
this call. With
this empirical review now completed across a foundational and influential set
of asset owners in
the U.S., the inventors have the basis for evaluating these organizations and
additionally creating
new survey methods that may help organizations undertake meaningful self-
assessments. Most
importantly, the inventors can through these methods equip investors,
beneficiaries, donor and
taxpayers with the tools to understand, assess and compare these
organizations.
[00027] To that end, the present inventors have developed the presently
disclosed systems
and methods to identify and measure key factors that drive fiduciary
effectiveness. Information
from U.S. public pension plans was used in this initial development as such
information is more
readily available due to the disclosure requirements, including meeting
minutes, agendas,
financial statements, and other required information. This data is often
posted on fund websites,
or is otherwise available through public databases such as the Boston College
Public Retirement
Plans database. Through the data collected, factors were identified and a
model created to
provide explanatory power on whether an organization is at risk of significant
under funding or
other fiduciary problems, such as bankruptcy, civil litigation, regulatory
violation, or crime. In
this regard, the composite rating of fiduciary effectiveness subsequently
allows the construction
of an index of relative measures, making organizations comparable side-by-
side.
[00028] The presently disclosed rating system, a measure of overall
effectiveness, is
referred to herein as the fiduciary effectiveness quotient or FEQ. When the
measure applies
specifically to an individual as a fiduciary (or as part of a larger
fiduciary), the score is also
referred to as a member effectiveness quotient or MEQ. A higher score is
indicative of stronger
forms of governance, and structures within, the fiduciary, as well as overall
greater fiduciary
effectiveness.
6
CA 3015975 2018-08-29
[00029] Figure 1 depicts a high level view of one exemplary embodiment for
rating asset
owner governance, or rating fiduciaries that govern funds, in accordance with
the present
disclosure. It should be noted that the term "fiduciary," while often used in
the context of a board
or group of individuals, relates to any person or entity (or group thereof)
having a fiduciary duty.
In other words, a fiduciary includes a board, an organization, a committee, an
individual, a
government agency, a third party consultant or advisor, or any other person or
entity or group of
such tasked with governing a fund. By way of non-limiting example, funds
include portfolios of
real or financial assets, including financial securities such as bonds or
stocks, or other assets that
the fiduciary is charged with managing or overseeing. Although funds may also
include
liabilities, the foregoing will sometimes be collectively referred to as an
asset for brevity.
[00030] In the embodiment shown, the system 1 provides a model application
module 3
that generates an FEQ or MEQ rating 4 output for a fiduciary based on actual
fund values 2
inputted for a fund and fiduciary. In particular, actual fund values 2 for a
fund and fiduciary are
inputted via an input/output module 5 within the model application module 3.
The input /output
module 5 is in communication with a processing module 7, as well as with a
memory module 9.
[00031] The memory module 9 is configured to store a model 10 as presently
disclosed,
which incorporates governance variables 20, legal event variables 30, control
variables 40, and
normalized weight factors for variables 50. As will be discussed below, non-
normalized weight
factors may also be stored within the model 10 in the memory module 9.
Likewise, not all
embodiments include the elements shown, such as legal event variables 30.
Through
communication with the memory module 9, the processing module 7 applies the
actual fund
values 2 for the fund and fiduciary in the model 10 to output, via
input/output module 5, an FE,Q
or MEQ rating 4 for the fiduciary.
[00032] Certain aspects of the disclosure are described herein in terms of
functional and/or
logical block components and various processing steps. It should be recognized
that any such
functional and/or block components and processing steps may be realized by any
number of
hardware, software, and/or firmware components configured to perform the
specified functions.
For example, certain embodiments employ various integrated circuit components,
such as
memory elements, digital signal processing elements, logic elements, look-up
tables, or the like,
which are configured to carry out a variety of functions under the control of
one or more
processors or other control devices. The connecting lines shown in the various
figures contained
7
CA 3015975 2018-08-29
herein are intended to represent example functional relationships and/or
physical couplings
between the various elements. It should be noted that many alternative or
additional functional
relationships or physical connections may be present in a practical
embodiment.
[00033]
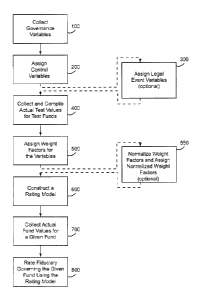
Figure 2 depicts an exemplary method for generating the model 10 for rating
fiduciaries in accordance with the present disclosure. To begin, governance
variables relating to
governing the funds are collected in step 100, whereby governance variables
impact the financial
performance for the funds. These may include the frequency of meetings, the
diversity of
fiduciary members with respect to gender or race, whether a board is given
training or practices
core values, whether there is a formal complaint process and others. In
certain embodiments,
which are discussed below, additional focus on diversity is provided beyond
fiduciary members,
specifically characterizing an organizations' performance with respect to
"social" concerns
within governance. A non-exhaustive list of governance variables is provided
in Figures 6a, 6b,
8a, and 9a. It should be noted that the values collected for some or all
variables (for example
"good board orientation") may also be licensed or otherwise obtained from
other sources to be
integrated into the presently disclosed systems and methods. In some
embodiments, integrating
data from one or more external sources is useful for streamlining the process
of information
acquisition.
[00034]
Returning to Figure 2, control variables are assigned in step 200. The control
variables also impact the financial performance of the funds, but do not
relate to the fiduciary's
governance of the funds. A non-extendable list of exemplary control variables
includes the
market asset value of a fund, allocations of cash, bonds, stocks of differing
economies and cap
sizes, and the annual contribution rate, also shown in Figures 8b and 9b.
[00035] In
certain embodiments, legal event variables are also assigned at step 300 as
shown in Figure 2. Where assigned, the legal event variables also impact
financial performance
for the funds, but relate to activities, investigations, statures, and other
variables involving laws,
regulations, and the like. These may overlap, or be in addition to an
organizations' performance
with respect to "environmental" concerns, which are discussed at length below.
A non-exclusive
list of variables is provided in Figure 7 and discussed further below. While
step 300 is optional,
the present inventors have discussed that also assigning legal event variables
results in more
accurate and comprehensive explanatory power between the actions and behaviors
of a fiduciary
in governing the funds and the resultant performance of the funds, thereby
resulting in a more
8
CA 3015975 2018-08-29
meaningful rating of the fiduciary. It should be known that while a
fiduciary's actions are often
discussed herein, refraining from taking one action constitutes taking a
different action in and of
itself.
[000361 Returning to Figure 2, a group of test funds were then identified
from within a
greater population of funds and a set of actual test values for the test funds
collected and
compiled in step 400. Specifically, step 400 includes the collection and
composition of actual test
values corresponding to the governance variables collected in step 100, the
control variables
assigned in step 200, and the legal event variables assigned in step 300
(where applicable) for
each fund within a group of test funds. Specific examples of the data
collected for each variable
type are discussed below.
[00037] Using statistical analysis techniques, which are also discussed in
detail below,
weight factors are assigned in step 500 for the variables. The weight factors
indicate or represent
the impacts on the financial performance of the test funds caused by each of
the governance
variables, control variables, and legal event variables (where applicable).
Each of the weight
factors assigned has a magnitude and direction, serving as coefficients for
each of these variables
for the final model of the present disclosure.
[00038] In certain embodiments, each of the weight factors assigned in
step 500 is further
normalized and assigned to a normalized weight factor in optional step 550. In
one embodiment,
this is a normalization of each weight factor to a 100 point scale, whereby
the "best," maximum,
or most preferred value (as the case may be for a particular variable) is
normalized to 100 and the
opposite (i.e., "worst") value normalized to zero within the index for each
variable. In some
cases, a maximum value may be reversed to correspond to a normalized value of
zero such that
100 remains the "best" or most desirable value. For example, the highest value
for criminal
actions against the fiduciary, (a negative, undesirable event) should be
normalized to zero.
[00039] Using either the weight factors assigned in step 500 or the
normalized weight
factors assigned in step 550, a rating model is constructed in step 600 that
incorporates the
governance variables, the control variables, the legal event variables (where
applicable), and
each respective weight factor or normalized weight factor. This rating model
can then be used to
align FEQ or MEQ scores to fiduciaries of specific funds. In particular,
actual fund values for a
given fund collected are inputted into the rating model in step 700, which in
step 800 produces a
rating for the fiduciary governing that given fund using the rating model.
9
CA 3015975 2018-08-29
i
[00040] The exemplary method of Figure 2 is shown in further
detail in Figures 3 through
5, which also depict the iterative process of producing a rating model that
provides high
explanatory value of financial performance based on the governance of a
particular fiduciary.
Method 1000 begins with step 1100 (Phase 1), which is identifying variables
for inclusion in the
FEQ or MEQ database. Within Phase 1, step 1110 is to identify variables both
independent and
dependent variables that are likely to be important inputs to fiduciary
functioning based on
reviews of academic literature and industry publications. These potential
variables are used to
construct a unique database in step 1120, which also includes the step of
identifying initial
samples to include in the database, identifying methods to operationalize
replicable data
collection, collecting data from different sources, and cleaning the data
through statistical and
other mathematical processes. As will become apparent later, it is often
necessary to update this
unique database in step 1130 as new variables are identified or new
observations are made. This
includes identifying changes to the criteria for sample inclusion and how to
operationalize
objective data collection, collecting data from different sources, and
cleaning the data as
described in steps 1131 through 1134 of the update process in step 1130.
[00041] The unique database constructed in step 1120 is then
subjected to regression
testing for efficacy of the FEQ or MEQ variables in step 1140. In the present
embodiment, the
regression testing includes holding out for the most recent observations for
testing, constructing
different specifications and definitions of variables, using the initial
screening to assess data
items without large numbers of missing observations and variables with
sufficient sample
variation, and predicting the sign (i.e., positive or negative) of the
relationship between
independent and dependent variables on the financial performance of the fund,
which are
depicted as steps 1141 through 1144. Step 1145 includes testing the relation
of dependent
variables to independent variables with different regression estimation
techniques. Through the
use of different statistical tests, the optimal method for estimating
regression is determined in
step 1146. Further discussion of statistical analysis techniques is provided
below. As depicted in
Figure 3, it is often necessary to reiterate through regression testing, both
between steps 1145
and 1146, as well as back to steps 1141 through 1144, in order to obtain
robust results. Once
robust results have been achieved, step 1147 is to decide on a final set of
independent variables
for factor analysis, which is then used to proceed to Phase 2, constructing
the FEQ or MEQ
rating model in step 1200.
CA 3015975 2018-08-29
I
[00042] In the embodiment shown in Figure 4, Phase 2 begins with the use
of principal
component analysis in step 1210 to estimate the factor loadings of the
independent variables
from Phase 1. This includes use of various statistical tests to determine the
optimal method for
principal component analysis method, and the use of various statistical tests
to determine the
optimal number of factor loadings, depicted as steps 1211 and 1212. These, and
other statistical
tests and analysis discussed herein, are readily understood by those of
ordinary skill in the art.
[00043] These determinations are then used to create an initial index for
each observation
in the data set in step 1220. As previously discussed, this data set may be a
set of actual test
values taken from a group of test funds within an overall group of funds. For
example, the initial
index may be based upon observations from a set of thirty individual test
funds within an overall
group of U.S. public funds.
[00044] In steps 1221 through 1224, standardized variables are created for
each
observation in the data set, whereby factor loadings are applied to
standardized independent
variables for each observation. The initial index is constructed for each
observation by
determining a weighting factor by the proportion of variation by total
cumulative variation for
the number of factors used. In certain embodiments, as discussed above, each
weighting factor is
then standardized to a normalized weight factor, such as an index of zero to
one hundred.
[00045] The efficacy of the initial index created in step 1220 is then
tested in step 1230,
such as through the use of regression analysis. In step 1231, exogenous
variables are identified
for inclusion in regression, which is reiterated until robust results are
achieved in step 1232. The
regression estimation may further comprise the steps of regressing the initial
FEQ or MEQ index
against different measures of effectiveness such as dependent variables,
identified in Phase I, as
well as using statistical methods to determine the best regression estimation
method for
producing the most robust results. Again, those one of ordinary skill in the
art are familiar with
regression testing and other statistical methods to achieve robust results.
[00046] This determination is then used to determine the optimal
regression speculation in
step 1233c, which is reiterated with step 1231, identifying exogenous
variables for inclusion in
the regression until robust results are achieved. In some cases, it is
necessary to return to Phase 1
if the 14EQ or MEQ index continues to not achieve robust results in step 1240.
Alternatively,
once robust results are achieved, the process moves to Phase 3 in step 1300.
11
CA 3015975 2018-08-29
[00047] Phase 3 relates to applying the FEQ or MEQ (step 1300), which
further includes
the step of performing a quintile analysis in step 1310 to measure the
differences in FEQ or
MEQ independent variables between the top and bottom quintiles. In other
words, differences
measured in all FEQ or MEQ variables can be compared for fiduciaries in the
top 20% in a top
20% of FEQ or MEQ ratings. These differences can then be interpreted to
identify differences in
fiduciary practices in step 1312, allowing investors and fiduciaries
themselves to assess the
particular fiduciary practices that result in optimal financial performance as
depicted in step 1320.
Further learnings from evaluation of fund practices can be incorporated into
phase 1 in step 1330,
as previously discussed.
[00048] While governance factors are limitless and ever-changing,
exemplary lists and
descriptions are provided in Figures 6a, 6b, 8a, and 9a. For example, FEQ (or
MEQ) factors may
include a board size as depicted by item number 11, or the instances of a key
word in meeting
minutes, such as "performance," "alert," "fees," or "adjust," as depicted by
item number 24. The
factor list and descriptions of Figures 6a and 6b further depict whether the
listed factor item was
included in the previously discussed exemplary FEQ or MEQ model, and whether
the particular
factor was identified to be a principal component factor, depicted by an
asterisk or a plus sign,
respectively.
[00049] Figure 7 depicts a non-exhaustive list of exemplary legal event
factors and
descriptions, along with exemplary logic for incorporating these factors into
modeling. For
example, item number two would be populated with a one for each event
involving a court at the
federal level, a zero for each event involving a court at the state level, or
be null if no court
events were reported. In this example, a "null" entry would be normalized as
being "best" on the
100 point scale in the embodiment previously described. Likewise, figures 8a
and 8b depict
exemplary governance variables and control variables respectively.
[00050] Figures 9a and 9b further depict descriptive statistics collected
for governance
variables and control variables, respectively, for a group of test funds
within the overall
population of funds. The data shown was collected from a group of test funds
comprising 35
public pension plans based on data publicly available and objectively
replicable. For example,
the governance variables shown in Figure 9a include the mean, median, standard
deviation, and
other statistical measures for investment return, funding ratios, and the page
length of meeting
minutes, as well as the corresponding FEQ scores across the group of 35 public
pension plans
12
CA 3015975 2018-08-29
comprising the test funds. Likewise, the control variables in figure 9b
include the mean, median,
and standard deviation, among others, for the market asset value, fixed
income, and investment
expenses for the 35 public pension plans.
[00051] In the embodiment shown, the investment return collected for each
of the 35
public pension plans is taken over a delayed time period relative to the data
taken for the other
variables. Specifically, the data shown reflects a one year delay between the
data collected for
investment return versus the data collected for governance, legal event
variables, and in certain
cases control variables. The present inventors adopted the one year delay in
this embodiment in
recognition of the natural and inherent delay between behaviors of the
fiduciary and the
consequent result of financial performance for the funds they govern. Data may
also be collected
and averaged over periods of time to reduce fluctuations and outliers.
[00052] It should be recognized that other delays, which may also vary by
the specific
factor, are anticipated by the present disclosure, whether longer or shorter
than the one year
delay previously discussed. Moreover, the optimal delay (in addition to
varying by factor) may
change over time, or may vary depending on the particular asset or asset mix
comprising the
funds.
[00053] As discussed above, Phase 3 of the embodiment shown in Figure 5
includes a
quintile analysis of the applied 1- ,Q or MEQ rating system. Figure 10 depicts
the FEQ data from
35 fiduciaries, corresponding to 35 funds, which were rated in accordance with
the present
disclosure. Specifically, the fiduciaries are plotted in descending order of
FEQ rating from the
first to the 35th fiduciary, reflected as the dashed line in Figure 10. In
other words, the fiduciary
with the highest FEQ (approximately 73) is shown first along the x-axis,
descending down to the
score of the 35t11 position. From here, the boundaries of the 1st and 5th
quintiles are marked with
lines Q1 and Q5, respectively, depicting the funds with the top 20% and bottom
20% FEQ scores.
[00054] The present inventors have identified that by generating FEQ
scores in
accordance with the presently disclosed model, and further by segregating the
fiduciaries into
first and fifth quintile groups, differences in fiduciary behaviors and other
variables can be
ascertained between the top performing and bottom performing groups. However,
the present
disclosure anticipates other groupings and delimiting boundaries for
separation to compare and
contrast fiduciaries based on FEQ score, performance, and the collected
variables in accordance
with the presently disclosed systems and methods.
13
CA 3015975 2018-08-29
[00055] The results of an exemplary quintile analysis for
comparison of 35 test funds are
shown in Figures 11 and 12. Specifically, Figure 11 depicts the 1-1,Q scores
as well as actual
values for governance variables between funds in the top quintile and bottom
quintile. Namely,
the FEQ scores of funds between the top quintile and bottom quintile differ by
87%, also having
a 48% difference in investment returns. In other words, the substantial
difference in FEQ score
provides explanatory value in identifying the funds having the greatest
difference in investment
returns. Likewise, Figure 11 shows the differences between funds in the top
quintile and bottom
quintile for the legal index, whereby funds in the top quintile outperform
funds in the bottom
quintile by 27.1% in the present embodiment.
[00056] It should be recognized that while the foregoing
largely discussed the legal index
of legal event variables as a component of an FEQ or MEQ index, it may also or
alternatively
stand alone. For example, a legal index rating fiduciaries, or even non-
fiduciaries (such as
businesses, employers, service providers, or communities) would allow people
to compare and
contrast options from a legal perspective on an objective basis. In one
embodiment, a prospective
employee could compare employers by their respective legal index scores,
either within an
industry or against others of the same size, region, or the total population.
Likewise, the index
may assist in selecting an advisor, supplier or even celebrity spokesperson
for protecting public
image through association. The legal index rating may also be used for setting
pricing of
insurance plans for directors and officers, for example. In this regard,
various embodiments of
the legal index are useful for fiduciaries and/or non-fiduciaries.
[00057] Along these lines, the present inventors believe that
there is a presently-unmet
public interest in measuring the governance of public organizations who issue
municipal bonds.
Using the presently disclosed systems and methods, the inventors identified
differences in bond
yield spreads between organizations in the top and bottom quintiles of each
index ¨ 25 bps (by
FEQ) and 46 bps (by Legal Index), respectively. This is in contrast to systems
and methods
known in the art, which are driven by outliers and lack the ability to
distinguish between top and
bottom performers. It will be recognized that the FEQ/MEQ and/or Legal Index
ratings would
be equally applicable to corporate bonds as well, for example.
[00058] Additional detail is now provided regarding the
specific steps and data sources
used to generate the FEQ model and subsequent results shown in Figures 9a
through 12.
14
CA 3015975 2018-08-29
1
[00059] In particular, these details are provided in the context of the
exemplary process
flow shown in Figure 2.
[00060] Steps 100, 200, and 300 preferably include an interdisciplinary
approach of
identifying key factors that references the current literature across finance,
law, organizational
behavior (sociology and psychology) and ethics, which comprehensively informs
the process of
understanding and determining applicable categories and attributes. Since a
tremendous number
of factors can be gleaned from the wide variety of sources available, it is
important to prioritize
and select those that are likely to be most important. From there, data is
obtained for each factor,
which is then analyzed to determine which factors are significant. In certain
embodiments, these
factors can be generalized into four broad categories: Board Structure, Board
Process, Human
Factors and Decision-making. Likewise, there are at least four distinct
theoretical approaches of
examining public pension fund governance, which include: Political Economy,
Organizational
Design, Institutional, Empirical or "Corporate Governance."
[00061] In the FEQ model and results shown in Figures 9a through 12, data
was collected
from a sample of 163 of the largest state and municipal pension systems from
approximately
6,300 public retirement systems in the United States. This sample represents
assets of over $1.4
trillion, or 47% of the population by assets. This dataset made available many
of the financial
and control variables as necessary inputs into the governance models developed
and discussed
herein. Data was examined from these plans over a five-year period, 2008-2012,
which was
selected to capture a market cycle.
[00062] This timeframe, of course, coincides with the Great Recession, the
financial crisis
that effectively began in 2008. While this may represent an extraordinary
period in financial
history, the present inventors believe using this period strengthens the power
of the test for the
present analysis because it permits examination of governance practices and
their related effects
under extreme conditions. In other words, it is likely that how organizations
prepare, think, and
act in advance and during times of crisis is critical to their performance
during such periods.
[00063] As discussed above, one year forward returns reflecting that the
governance
process were used, having a one year lag based on analysis of the data. This
one year lag was
selected based on identifying a typical time delay after decisions made by
fiduciaries to see a
measurable impact. For example, the decision to change investment strategies,
while having
CA 3015975 2018-08-29
1
some immediate effect of course, requires time before it is has a quantifiable
impact that is
measurable in the data.
[00064] Once collection of the data was completed, cleansing
was required to ensure there
were no errors in the recorded observations, as discussed above. In addition
to a manual review
of the data, it also involved reviewing and analyzing the aggregate statistics
for any
abnormalities in the data including any unusual outliers. It should be
recognized that while this
step was provided manually, automated alternatives are also anticipated in
practice.
[00065] Once the set of factors was determined, the next step
was to identify the data
sources to gather empirical data on each factor. Public pensions were
initially selected as a
primary organizational type for analysis, though the presently disclosed
methods and systems
would apply equally to private funds, corporate pension funds, trusts, and
other assets. This
reason for selecting this population was threefold. First, source data is
readily available through
public disclosures. Public organizations have more information publicly
available, which include,
for example, meeting minutes, agenda, and other memoranda that are in the
public domain.
Second, existing data sets are available e.g. the Boston College database, and
other industry data.
Finally, developing rating scores for fiduciaries of public pensions allows
for immediate
contribution to the debate within the public sphere around this topic.
[00066] Data was collected in two separate databases, one
containing over 50 asset owner
governance variables (the Governance Database), and one containing over 20
legal variables (the
Legal Database). For the Governance database, data was collected from meeting
minutes for
every organization available online over the five year study period. For the
legal database, data
was collected from multiple legal database sources, including Bloomberg,
Westlaw and Lexis
Legal.
[00067] There are two ways to test whether the index is a
useful measure, in terms of both
absolute and relative effectiveness. An absolute measure is binomial in
nature: either the
organization was effective, or it was not. If the correct factors were
identified, then the factors
should be explanatory in nature. An absence of the critical factors could be
indicative that the
organization is bound for a fiduciary problem (e.g., underfunding, bankruptcy,
litigation, etc.). A
high FEQ, according to the theory, should translate into to a low ineffective
score based on the
two variables, case frequency and severity.
16
CA 3015975 2018-08-29
I
[00068] The second method of testing whether the grade is effective, on a
relative, and as
noted earlier, a lagged basis given the delayed effect of governance on
performance outcomes
observed in the data, i.e. fund returns, is a phenomenon that can be measured
ongoing. These
ongoing measures can indicate how well has the organization governed itself,
and then in turn
performed in its investment returns and other financial measures.
Theoretically, the more critical
governance factors that are satisfied, the better the investment performance.
[00069] With respect to absolute effectiveness, the first step in
analyzing the data is
determining whether effectiveness is conditionally present based on the
combined variables. The
FEQ as a rating and measurement system can only be useful if it, in fact,
demonstrates some
explanatory power. For this purpose, the Legal Index was also constructed to
evaluate each
organization. This is based on a reversed scale (to be consistent with the FEQ
scaling). In
general, 0-80 is ineffective and 80-100 is effective. These ranges were
determined from what
was observed in the data. Plans that fell below the critical value of 0.50 for
a funding ratio
consistently saw Legal Index measures below 80 on the index.
[00070] Legal case data was obtained and qualitative data scored to make
quantitative data,
which was used to formulate a qualitative framework for integrating the
aggregate data set into a
broader Asset Owner Governance model or rating model.
In this manner, the following equation was constructed:
Eq. 1: FUNDR = f(FEQ, LI, X)
[00071] In the above equation, FUNDR is the funding ratio of the pension,
the best
measure of overall effectiveness that addresses how the well funded the
retirement plan is. The
Legal Index (LI) variable is comprised of the frequency and severity
variables. FEQ is the
Fiduciary Effectiveness Quotient, and FEQ is defined by an index rating of
(all or some portion)
of the following factors: Structure, Process and People. Finally, X is defined
as other control
variables needed for the model.
[00072] An ineffective condition is defined as significant underfunded
position,
bankruptcy, significantly poor underperformance, criminal case, civil
litigation, or significant
board, committee or management reorganization. There could be any number to
look at
empirically to test the theory that if certain conditions are not met, then
the probability of an
organization being effective diminishes with each factor, as it will be known
in retrospect
17
CA 3015975 2018-08-29
i
whether the organization was effective. In this case, because no bankruptcies
were included in
the inventors' data set, the inventors focused on significantly underfunded
plans by which the
inventors define any plan with a funding ratio below 0.50 as significantly
underfunded, and
therefore ineffective.
[00073] As the inventors note above, there are two summary
variables that the inventors
have isolated to test for absolute effectiveness: 1) severity of an
ineffective condition; 2)
frequency of the ineffective condition.
[00074] To determine relative effectiveness, the inventors
used performance data for the
specified period of each organization in the inventors' sample. The inventors
tested the validity
of a hypothesis that the correct effectiveness factors had been identified. A
composite rating was
then examined as the independent variable and the investment performance
outcome as the
dependent variable. The composite rating was then used to assess the
relationship between these
metrics. The inventors tested the hypothesis that the governance factors,
which determine
fiduciary effectiveness, also impact return performance.
The following regression model was then created and tested:
Eq. 2: R = f(FEQ, X)
[00075] In the above equation, R is the investment return, and
FEQ is the Fiduciary
Effectiveness Quotient defined by an index rating of the following factors:
Structure, human
factors and process. X represents several other control factors that include
size of the assets,
types and proportions of the investments, investment expenses, and demographic
and fiscal
variables.
[00076] A priori, the present inventors expected there will be
a linear relation between
these two variables. Depending on the outcome of the research, when the
inventors were
successful in finding statistical support for this hypothesis, the inventors
would have established
an empirical link between fiduciary effectiveness and performance outcomes,
and have a basis
and methodology for quantitatively measuring, predicting, evaluating and
comparing fiduciary
effectiveness.
[00077] A model of relative effectiveness was created.
Mathematically, fiduciary
effectiveness may be reduced to this basic equation:
18
CA 3015975 2018-08-29
I
Eq. 3: FE = G(S, Pr, P)
Where, FE: Fiduciary Effectiveness
S: Board / Committee Structure
Pr: Process (or Engagement)
P: People
[00078] Consistent with corporate governance theory, the inventors
narrowed the list of
variables down to a set of 17 variables for the purpose of analysis for one
embodiment of the
presently disclosed systems and methods. Variables were analyzed in terms of
their expected
and estimated signs and related p-values, testing that the estimated
coefficient does not equal
zero. In general, governance variables will be proxies for the decision-making
that occurs within
the organization. Engagement variables such as attendance, meeting length,
meeting minutes
page length and meeting frequency convey information about how active and
focused the board
is. Structural variables, such as board turnover, use and attendance of the
consultant and number
of members likewise consider how the board is set up to interact and make
decisions.
[00079] Using an ordinary least squares regression, the inventors reviewed
seventeen
governance factors in relation to investment returns. Nine out of 17
governance factors had
consistent estimated signs with expected signs. The inventors initially
expected the following
factors would result in higher investment returns: 1) meeting length would
indicate greater levels
of focus and engagement; 2) more board members on the (a) audit and (b)
investment
committees would indicate deeper involvement; 3) more staff involvement would
result in
greater knowledge sharing; 4) less (a) board and (b) board chair turnover
would mean greater
continuity in governance; 5) fewer board members would be more effective,
which would be
consistent with other Corporate Governance findings; and 6) involvement by the
consultant
through attendance and participation would be helpful to the organization for
their outside
expertise and guidance.
[00080] The inventors also constructed "Investment Discussion" as a
variable, which
involved key word counts within the meeting minutes as a proxy for the type
and substance of
the discussion. These key words included "performance", "watch", "returns",
"on notice", "alert",
"fees", "risk", "asset", "allocation", "pay to play", and "adjust", which
denote ideas around
investment concepts, decisions-points, and investment governance issues. While
the expected
19
CA 3015975 2018-08-29
signs did not match the estimated results found in the quintile analysis, they
were consistent with
the theory that more key words found in the documents were common among better
governed,
higher performing organizations.
[00081] These data are in addition to the data available to us from the
Center for
Retirement Research (CRR) at Boston College. CRR, in their Public Pension
Plans database,
which has a host of financial and actuarial data gleaned from public filings
and disclosures. For
the inventors' purpose, the inventors have incorporated a number of financial
variables for
analytical purposes, primarily to examine investment performance. In
particular, the inventors
have used three variables from this data set: 1) market assets, which
represents the total asset
value of the plan in nominal U.S. dollars; 2) investment returns, which are
available on a rolling
basis of 1, 5, and 10 years; and 3) the funding ratio, which is the market
value of the assets in
relation to the liabilities as measured by the actuarial Projected Benefit
Obligation (PBO). The
inventors have used the one-year investment returns to examine each plan's
factors and related
performance. The inventors have determined that a one-year forward relation
exists, and
therefore have incorporated the 1-year investment return as a leading
dependent variable; returns
essentially lag the fiduciary process by a year. The inventors have used
market assets as a
control variable for plan size.
[00082] In the case of investment expenses, the inventors' results were
initially surprised
on a couple of levels: 1) the inventors expected that this would be a
detractor to returns, and the
opposite relationship was indicated in the estimation; and 2) the estimated
coefficient was not
statistically significant. The reason why this was a surprising result is
because the industry has
become obsessed with investment expenses over the past several years, which
has fed into a
debate over "active" (higher cost, research-driven and actively-managed
investments) versus
"passive" (lower cost, index-defined) investments, and in this case the
inventors found no such
relationship to investment returns.
[00083] The inventors also incorporated asset allocation measures
(equities, fixed income,
real estate, alternative investments, and cash and cash equivalents) to
account for the differences
in types and proportions of investments. While governance decisions drive the
investment
process, investment returns are also influenced by decisions that occur at the
investment manager
level, so it is necessary to apply both sets of variables in examining the
relationship to
investment returns. In looking for proxies for state and municipal budgetary
influences, as the
CA 3015975 2018-08-29
well as demographics of the beneficiary population, the inventors used the
actual annual
contribution rates and total beneficiaries variables for each factor,
respectively.
[00084] Total beneficiaries embody both "active members" or those still
working, and
"retired members", those who are obviously in retirement and already receiving
benefit
payments. These will vary based on the distribution of the beneficiary
population for each plan.
In preliminary analysis, these additional variables were assigned to ascertain
the formulation of
five final models. The inventors applied the same set of primary and control
variables in two of
the models. The other models only required one or two primary variables in
fitting a complete
model, and based on the principle of parsimony, and using a "stepwise"
approach to each model,
the inventors used the fewest variables in each case to find the best "fit"
for the model.
[00085] Finally, the inventors also examined the funding ratio as a
dependent variable,
consistent with the conceptual overview presented herein. To understand why
all three
dependent variables would be impacted by the FEQ in a similar way, one need
only refer to the
review the theory and chain of relationships within the U.S. Public Pension
System. Governance
is among the set of endogenous factors that affects investment returns.
Investment returns impact
the funding disparity and requirements of state and local governments, as
measured by the
funding ratio. The inventors also examined the relationship of pension risk to
bond yield spreads
to understand how the funding status and legal risk of the pension system
impacts the bond yield
spread of related general obligation municipal bonds.
A Legal Index was also created based on the following equation:
Eq. 4: LI = H(CS, CF)
Where, LI: Legal Index
CS: Case Severity
CF: Case Frequency
[00086] The inventors have developed a qualitative case severity
framework, which has
been further refined and expanded to incorporate the many varieties of cases
encountered in this
area of the law. These range from fraud on one extreme to minor statutory
duties of plan
operations on the other. These then were expanded to cover the following
categories, in order of
declining severity: investments-fraud; investments-breach of fiduciary
duty/contract; benefit
21
CA 3015975 2018-08-29
management/disbursement; plan operations; minor statutory duties concerning
operations;
ulterior investment concerns; and undefined.
[00087] Exemplary statistical processes and tests used throughout the
development and
application of the systems and methods are disclosed herein. However, it
should be recognized
that alternative statistical processes, tests, and orders of application are
also anticipated herein.
When working with unbalanced panel data with a large number of regressors
(such as the 17
governance factors discussed above), but with a limited time series (five
years of annual periods),
there are a number of steps that were taken to ensure the model was correctly
specified to handle
the potential cross-section effects. As the inventors noted earlier, an
unbalanced panel is one
where there are missing observations, in this case due to the inconsistency of
reporting by the
public pensions both in points of time of when they report and what they
report. Because their
meeting minutes are obviously determined by when the boards meet ¨ and every
organization
maintains their own meeting schedule, which, of course, varies by organization
¨ this created an
unbalanced panel sample. Additionally, there were some years when minutes for
a number of
plans were not available.
[00088] The inventors first undertook an ordinary least squares regression
to begin
examining the data. The inventors applied the Hausman test to test whether the
model is subject
to fixed, or random, effects. In the immediate case, it was clear that the
model would be subject
to fixed effects when running the comparison test. The Chi-squared statistic
had a p-value of
0.0000, which required strongly rejecting the null hypothesis that the model
was subject to
random effects. The inventors also checked for redundancy among the
instrumental variables by
applying the fixed effects redundancy test, and again the cross-section F and
Chi-squared
statistics both had p-values of 0.0000, strongly supporting non-redundancy of
fixed effects
among cross sections. This is important because the inventors did not want to
subject the model
to omitted variable bias.
[00089] Next, a White diagonal co-efficient covariation method was applied
to correct for
heteroscedasticity, which is a common problem with panel data. This did not,
however, address
the issue of multicollinearity one encounters when applying a large number of
regressors within
a multivariate equation.
[00090] Principal Components Analysis (PCA or Factor Analysis) is one
method for
addressing multicollinearity among regressors. A data reduction technique, it
seeks to explain
22
CA 3015975 2018-08-29
observable phenomena with a fewer number of variables. By reducing the number
of variables
to their "principle components", the essential statistical properties are
preserved, without the
repetitive and potentially distortive effects of multicollinearity (i.e., sign
reversal or over-
estimated standard errors.) It also has the additional benefit of making
possible the
summarization of factors to a manageable index term, which can then be applied
to comparative
peer group analysis (i.e., through separation of economic units into
quintiles), which was one
goal of the research. One drawback to the use of the PCA method is that, in
general, regressors
can bias the results. In the present case, Principal Component Extraction was
conducted based
on an Eigenvalue of 1 or greater and the PCA factor loadings and
interpretation of the
components.
[00091] The
inventors analyzed the seventeen governance variables using these PCA. This
generated 17 factor loadings. The inventors applied the Kaiser Criterion to
extract the
Eigenvectors. In this embodiment, the inventors determined the principal
component factor
selection by eliminating any factor with an Eigenvalue less than 1. This
generated six
components that captured 69% of the total variance of all 17 variables. Once
the inventors had
these factor loadings, they were able to combine the loadings with each
variable, and then apply
PCA-determined weights to each new factor. This was done after applying a
Varimax rotation.
Any individual factor that had an Eigenvector of 0.20 or greater was
considered as containing
meaningful, relevant information for the principal component and helped in the
interpretation.
The principal components of the present embodiment are summarized here:
Professionalism ¨ This principal component may be interpreted as the level of
professionalism within the organization. It is comprised of consultant
attendance,
meeting duration, page length of the minutes, board participation on the audit
committee, employee composition, board participation on the investment
committee and investment discussion.
Board Composition ¨ This principal component may be interpreted as the
composition
and capacity of those serving on the board. It is comprised of appointee
composition, employee composition, board attendance and retiree composition.
23
CA 3015975 2018-08-29
Engagement ¨ This principal component may be interpreted as the degree of
engagement
by the board members, staff and consultant. It is comprised of consultant
attendance, staff composition, board attendance and board chair turnover.
Staff ¨This principal component may be interpreted as the extent of
involvement by
professional staff. It is comprised of staff composition and treasury
composition.
Institutional Knowledge ¨ This principal component may be interpreted as the
continuity
within the organization of its institutional knowledge. It is comprised of
appointee
composition, board turnover, board size, and consultant turnover.
Diligence ¨ This principal component may be interpreted by the extent of the
diligence
and thoroughness of the organization in exercising its governance process. It
is
comprised of consultant attendance, page length of meeting minutes, treasury
composition and investment discussion.
[00092] The weighted combination of these principal components ultimately
constituted
the index for each plan and year for a total of 35 Plans and 113 observations.
Each variable was
standardized prior to combination. Once the variables were reduced to a single
index, the
inventors could then normalize or scale the index to reinterpret the index
values on a scale of 0-
100. This final step allowed the ranking and segmentation of cross-sections
into quintile
groupings for further analysis and comparison.
[00093] Now that the inventors had a single standardized index measure, it
was time to re-
estimate the inventors' regression model with the specifications outlined
above using the
following equation:
Eq. 5: R(Y),,,,,=C + 132A4VA(X2),õ, + B3Eq(X3),,, + B4Fx(X4)õ +
B5Re(X5),õ1
+ B6A(X6),,,1+ 137CCE(X7)1+ B81E(X8),1,,+ ABN(X9)11+ B10RC(X10)1, +
Where, R,+,: One year forward investment return
C: Constant
FEQ: Fiduciary Effectiveness Index (FEQ)
MVA: Market Asset Value
Eq: Equity allocation
Fx: Fixed income allocation
Re: Real estate allocation
A: Alternative investment allocation
24
CA 3015975 2018-08-29
CCE: Cash and cash equivalent allocation
IE: Investment expenses
BN: Total beneficiaries
RC: Required contribution rate
ci: Cross-section (Plan)
ti: Time period (Annual)
11: Random error term
[00094] The dependent variable was the one-year forward return to allow
for a one-year
lag in the regressor. As discussed above, this reflects the point that
fiduciary activities do not
immediately have an impact (e.g., managers are hired and fired over time,
allocations may
change periodically, etc.) Also, to fill out the inventors' model, the
inclusion of some additional
demographic, actuarial and financial factors reduced the number of common
cross-sections to 31.
[00095] The control variables chosen for the model were selected to
capture additional
effects that also determine or impact investment returns. Market asset value,
or plan size,
represents the total assets in the plan. The size of the plan may impact the
types of investments
available to the plan or the direction of those investments. Asset allocation
percentages related to
equities, fixed income, real estate and alternatives were also chosen since
differences in asset
allocation can have a large impact on investment returns. The inventors also
incorporated
investment expenses, which some believe to be a key driver of investment
return. The inventors
also selected total beneficiaries and required contribution rates, two
actuarial variables, to
capture differences in plan populations and funding requirements, which the
inventors
considered also potentially influential in investment decision-making.
[00096] With the exception of investment expenses and required
contribution rate, every
coefficient estimate associated with the regressor was identified to be
statistically significant
below the 3% level using a one-tail test for the primary variable (FEQ) and a
two-tail test for the
control variables. The model based on the F-Statistic was statistically
significant below the 1%
level. This combination of factors explains 69% of the variation in one-year
forward returns (R-
squared). The expected and estimated signs for the FEQ were consistent; an
increase in the FEQ
is related to an increase in returns. The FEQ coefficient may be interpreted
as follows: A one-
CA 3015975 2018-08-29
unit change in the index is associated with a 0.36% change in investment
return when all other
variables are held constant.
[00097] Having demonstrated statistical evidence of a relationship of the
FEQ with
investment performance, the inventors turned to the other dependent variables
to continue the
inventors' exploration of the potential far-reaching impact of fiduciary
effectiveness. The next
model examines the relationship between the FEQ and bond yield spreads.
[00098] Beginning with the inventors' focal variable (the FEQ, a summary
of 17
governance variables in the present embodiment), it was not necessary to use
control variables in
this case. In other words, the inventors were able to explain most of the
variation in the
dependent variable with the FEQ index alone.
The regression equation was used as follows:
Eq. 6: BY(Y),,,=C + + ,u
Where, BY: Bond Yield Spread
C: Constant
FEQ: Fiduciary Effectiveness Index (FEQ)
ci: Cross-section (Plan)
ti: Time period (Annual)
Random error term
[00099] The inventors were initially expecting an inverse relationship
(i.e., a one-unit
increase in the FEQ would mean a commensurate decrease in the bond yield
spread). However,
the sign was identified as being positive. In other words, the expectation was
initially that better
governance would translate into lower yield spreads. Here this was not to be
the case, yet in the
inventors' quintile analysis described both above and in additional detail
below, the inventors did
find such differences among the groupings. However, the differences were
somewhat
inconsistently across peer groups, which may be due to a couple of factors.
First, the inventors
had limited data availability for this analysis, and secondly, as noted
earlier, investors during the
study period were not as attune to pension risk, which came after especially
starting in early
2013. Therefore, the inventors determined that there is strong evidence of a
relationship, though
26
CA 3015975 2018-08-29
the direction of that relationship was not consistent either in the available
data, during the study
period, or both.
[000100] Further summarizing the model estimation, the FEQ coefficient was
interpreted as
follows: A one-unit change in the index is associated with a 5.6 basis point
change in the bond
yield spread. Bond yield spreads are measured in basis points (i.e. 1% = 100
basis points or bps).
[000101] The final model under relative effectiveness examined the
relationship between
the FEQ and the funding ratio. Here the inventors had no data limitation and
made use of the
complete sample of 35 cross-sections:
Eq. 7: FR(Y),,,=C + AFEQ(X,),,, + ,u
Where, FR: Funding Ratio (FUNDR)
C: Constant
FEQ: Fiduciary Effectiveness Index (FEQ)
ci: Cross-section (plan)
ti: Time period (annual)
Ix Random error term
[000102] The inventors further developed a second model based on the
absolute
effectiveness of selected variables. The inventors collected case information
during the study
period on available legal and regulatory case for almost every plan included
in the Boston
College database, regardless of whether the plan is noted in the case as the
defendant or plaintiff.
Using these data, the inventors have constructed four variables for
examination relative to
fiduciary effectiveness: case severity; total case frequency; defendant case
frequency; and
plaintiff case frequency. Two main factors were anticipated to be indicators
of how severe a
system may be under financial and ultimately legal stress: 1) how often cases
occur, and 2) the
quality of the cases involved. The inclusion of the defendant and plaintiff
variables help
distinguish between "good" legal activity, where the board is diligently
protecting its rights
versus "bad" legal activity, where the questions of fairness and equity keep
recurring ¨ and
potentially growing ¨ between stakeholders and the plan.
[000103] The inventors also subjected the four legal variables to PCA. This
generated 2
factor loadings, to which a Scree Plot was applied to extract the
Eigenvectors. Specifically, the
principal component factor selection was completed by eliminating any factor
that appeared to
27
CA 3015975 2018-08-29
contain less information (i.e. percentage variance) based on the Scree Plot.
This generated two
factors that captured 83% of the total variance of all 4 variables. Once the
inventors had the
factor loadings, they combined the loadings with each variable, and then apply
PCA-determined
weights to each new factor. The inventors used a minimum Eigenvector of 0.40
to aid in
interpreting each component.
[000104] The weighted combination of these factors ultimately comprised the
index. Each
variable was standardized prior to combination. Once the variables were
reduced to a single
index, the index was then normalized to reinterpret the index values on a
scale of 0-100. In
certain cases it was necessary to reverse the index (subtract each measure
from 100) to make
consistent with the FEQ measure (i.e., 0 worst, 100 best). This allowed the
ranking and
segmentation of cross-sections into quintile groupings for further analysis
and comparison.
[000105] Using the same specification and tests for this unbalanced panel
regression, the
inventors developed the following regression models. Again, the panel was
unbalanced because
not every observation was available for all plans as described in the earlier
section. Legal case
data was also uniquely varied in that states report legal cases inconsistently
as well. When
considering the most relevant variable for measuring the health of the overall
plan, which could
be affected by governance issues, financial and legal problems, or all three,
the funding ratio was
selected as the dependent variable. The first model is an extension of the
model that considered
the FEQ as the only regressor. Now, taking both the Legal Index and the
fiduciary effectiveness
index as the regressors, the inventors constructed the following equation:
Eq. 8: FUNDR(Y),,,=C + BILL, + +
Where, FUNDR: Funding Ratio
C: Constant
LI: Legal Index
FEQ: Fiduciary Effectiveness Index
ci: Cross-section (Plan)
ti: Time period (Annual)
Random error term
[000106] While the addition of the Legal Index did not impact the overall
fit of the model
from the original regression model (i.e., small increase in the adjusted R-
Square and slight
28
CA 3015975 2018-08-29
decrease in the F-Statistic), the inventors did determine that the estimated
coefficient on the
Legal Index is statistically significant at below the 3% level, and the FEQ is
significant at below
the 1% level. The overall model is significant below the 1% level. As such,
this combination of
factors explains 93% of the variation in the funding ratio (R-squared). The
expected and
estimated signs for the Legal Index were consistent, and as noted earlier,
remain inconsistent for
the FEQ. The model results may be interpreted as follows: A one-unit change in
the Legal Index
is associated with a 0.000971 change in the funding ratio when the FEQ is held
constant.
[000107] The inventors then tested the model in being able to differentiate
effectiveness on
an absolute basis. Since there were no cases of bankruptcy in the sample, the
inventors instead
established an absolute ineffectiveness criterion of 50% funded or below for
any plan.
[000108] The inventors constructed a binomial dependent variable for a
probit model based
on the funding ratio. Every variable above 0.50 was assigned a one and
anything equal to or
below, a zero. The purpose of the model is to estimate the probability that an
observation with
particular characteristics will fall into one of two categories, in this case
a plan deemed effective
or ineffective. The value of 0 indicates the plan is underfunded and
ineffective, and the value of
1 indicates the plan is effective. This model allows us to examine the related
conditions that are
causally determining absolute ineffectiveness (i.e., poor governance,
underperforming
investments, inadequate contributions, etc).
[000109] Whereas, the continuous variable of financial performance provides
a
comparative snapshot of the pension fund from which the inventors can examine
a trend that
may improve or worsen, the failure mode of the absolute condition gives a
measure of failure
that is both deeper and more intractable.
[000110] The probit model is most often estimated using the standard
maximum likelihood
procedure. While a probit binary response model is helpful for probability
estimation and
categorization, the coefficients themselves are not related in a linear
fashion with the
probabilities. This means coefficient estimates do not give the marginal
impact of a change in the
attribute on the probability of the dependent variable, and the inventors
cannot easily interpret
the marginal impact of an independent variable on probability. The marginal
impact is not only a
function of the coefficient estimates, but of the value or size of independent
variable as the well.
One final note, the inventors used White's method for heteroscedasticity
correction just as with
the prior models.
29
CA 3015975 2018-08-29
[000111] With this as background, the following regression equation was
developed, using
the probit method for the model testing absolute effectiveness:
Eq. 9: Pr(FUNDR(1,0)õ=C + BIFEQ(Xi),õ,+ B2L1(X2),,1+ B3MVA(X3),,+ B4Eq(X4)õ +
B5Fx(X5),,, + B6Re(X6),1,+ B7A(X7),,,+ B8CCE(X8),,,+
Where, P(FUNDR(1,0): Probability of the funding ratio being above or
below 0.50
C: Constant
FEQ: Fiduciary Effectiveness Index (FEQ)
LI: Legal Index
MVA: Market Asset Value
Eq: Equity allocation
Fx: Fixed income allocation
Re: Real estate allocation
A: Alternative investment allocation
CCE: Cash and cash equivalent allocation
BN: Total beneficiaries
RC: Required contribution rate
ci: Cross-section (Plan)
ti: Time period (Annual)
ja: Random error term
[000112] The estimated coefficient on the FEQ was determined to be
significant below the
1% level. Market Asset Value, Allocation to Real Estate and Allocation to Cash
also have
statistically significant coefficient estimates at the 5% level or below.
Including the Legal Index
did improve the overall fit of the model by increasing both the pseudo-R
squared and reducing
the Likelihood Ratio statistic. The overall model was statistically
significant below the 1% level
based on the probability of the Likelihood Ratio test statistic. The McFadden
pseudo R-squared
is modestly high at 0.51. To help interpret these results, an Expectation-
Prediction Evaluation for
Binary Specification was performed using 0.5 as the cutoff. The model
demonstrates a 93%
success rate in correctly estimating the binomial measure of effectiveness.
[000113] Next a quintile breakdown of the legal factors was conducted
factor by factor. The
fiduciary effectiveness of boards and committees charged with managing
investment pools can
CA 3015975 2018-08-29
be measured both on a relative and absolute basis as discussed above. The
inventors'
examination of the meeting minutes data of 35 public pension plans generated
sufficient
information over a five-year period to ascertain 17 governance factors. When
subjected to
Principle Components Analysis, a data reduction technique, the inventors
produced a
standardized index measure, the Fiduciary Effectiveness Quotient (FEQ). When
combined with
other financial and demographic variables, the inventors were able to
construct a model that
explained a large percentage of the variation in investment return
performance. As a standalone
measure, the explanatory power of the index was even greater when applied to
municipal bond
yields and the funding ratio.
[000114] Turning to a measure of absolute effectiveness, the inventors'
collection of legal
case data over the study period for 153 plans yielded two variables of
interest: case severity and
case frequency. Case severity is based on a qualitative assessment of each
case type across 20
categories. Case frequency is simply a measure of how often the cases occur
for each plan. The
inventors found evidence of a statistical relationship between the funding
ratio when regressing it
against the Legal Index and the fiduciary effectiveness measure. When applying
a probit model,
the inventors the were able to identify with 93% accuracy based on a similar
grouping of
independent variables found in the inventors' first model including both the
FEQ and Legal
Index, whether a plan was likely to be deemed effective or ineffective based
on a minimum
funding ratio criterion of 0.50.
[000115] The foregoing was then used to address the very simple question,
"how do I (i.e.,
beneficiaries, taxpayers, bond holders, stock holders, issuers, etc.) know
that my money is being
managed effectively by an organization whose members I do not know and over
whom the I
have little or no control?" Unlike a company which is subject to the change of
control market,
where a buyer (or a creditor) will come in and take over a poorly run company,
a poorly run
pension plan has no such corrective mechanism other than bankruptcy, or
municipal bond market
pressure.
[000116] There were several major findings in the development and
application of the
presently disclosed systems and methods. Boards and other fiduciaries of top
quintile plans,
when compared to bottom quintile plans, display the following governance
characteristics: 1)
Have a higher FEQ Score (87% higher), 2) Meet more often (42% more), 3) Meet
longer (23%
longer), 4) Turnover their membership less frequently (31% less), 5) Have more
substantive
31
CA 3015975 2018-08-29
discussions (75% higher), 6) Have fewer board members (26% fewer), 7) Have
greater
attendance (8% more), 8) Have higher participation on investment and audit
committees (61%
and 78%, respectively), 9) Have their consultant present (51% more), 10)
Turnover their board
leadership less (26% less), 11) Have more staff participation in meetings (36%
more), 12) Have
more appointed than elected members (71% more), 13) Tend to be larger plans
(9% larger), 14)
Have 48% higher returns long-term, and 15) Have 27% less interest cost on
related municipal
bonds.
[000117] As discussed above, the inventors also identified the unexpected
result that
investment expenses had no statistical significance in relation to investment
returns in the first
regression model that looked at investment returns in relation to the FEQ and
other variables for
35 plans in the inventors' sample set. This discovery is of particular
interest because it calls into
question the current emphasis in the industry on reducing investment expenses.
In actuality, the
industry sentiment appears to be an over-emphasis on reducing investment
expenses, which may
actually harm pension plan performance. Large pension systems that use low-
expense strategies,
such as the state of Nevada, did not score particularly the well on the FEQ,
having average to
below average returns, and average to below average funding ratios.
[000118] With respect to legal characteristics, top quintile plans, when
compared to bottom
quintile plans, were also determined by the inventors to: 1) Have a higher
Legal Index score
(27% higher), 2) Have much fewer legal cases (5x less), and fewer frivolous
cases (20x less), 3)
Be named defendants less (96x less), 4) Pursue litigation less as plaintiffs
(42x less), 5) Be 5.7%
better funded, and 6) Have less than half of the bond interest cost on related
municipal bonds.
[000119] Further embodiments of the present disclosure relate to specific
areas of interest
within governance. For example, the systems and methods described above may
incorporate
data relating to Environmental, Social, and Governance (ESG) factors. Below is
a brief
background on ESG, challenges identified by the present inventors relating to
ESG within the
systems and methods currently known in the market, and a list of exemplary ESG
factors.
Through experimentation and development, the present inventors have identified
that, as with
governance more generally, no systems or methods known in the market provide
meaningful
ratings for the fiduciaries with respect to ESG factors, and particularly with
respect to the
corresponding impacts on financial performance. It should be recognized that
assessing non-
32
CA 3015975 2018-08-29
financial impacts is also anticipated by the present disclosure, including the
impact of issuing
bonds for charter schools on student test scores or literacy rates, for
example.
[000120] As previously discussed, these factors may be utilized for rating
the performance
of particular companies, municipalities or organizations, funds, and the like.
Likewise,
"fiduciary" is used to broadly describe the individuals and/or entities
involved in governing such
companies, municipalities, organizations, funds, and the like, including
through assessment of
the mechanisms implemented by, and/or behaviors of, such fiduciaries.
[000121] In the early years of the new millennium, the major part of the
investment market
still accepted the historical assumption that ethically directed investments
were by their nature
likely to reduce financial return. Philanthropy was not known to be a highly
profitable business
and Milton Friedman provided a widely accepted basis that the costs of
behaving in an ethically
responsible manner would exceed the benefits. However the assumptions have
since been
fundamentally challenged.
[000122] Early efforts began with Robert Levering and Milton Moskowitz's
listing of the
Fortune 100 Best Companies to Work For, which considered corporate social
responsibility and
how financial performance fared as a result. Of the three areas of concern
that ESG represented,
the environmental and social had received most of the public and media
attention, based in part
on growing fears concerning climate change. In other words, this brought the
spotlight onto the
corporate governance aspect of responsible investment. The analysis concerned
how the
companies were managed, what the stockholder relationships were, and how the
employees were
treated. Moskowitz argued that improving corporate governance procedures did
not damage
financial performance, but in contrast maximised productivity, ensured
corporate efficiency, and
led to the sourcing and utilizing of superior management talents.
[000123] In 2011, Alex Edmans, a finance professor at Wharton, published a
paper in the
Journal of Financial Economics showing that the 100 Best Companies to Work For
outperformed
their peers in terms of stock returns by 2-3% a year over 1984-2009, and
delivered earnings that
systematically exceeded analyst expectations.
[000124] During this same period, the United Nations Environment Programme
Finance
Initiative in 2005 commissioned a report from the international law firm
Freshfields Bruckhaus
Deringer on the interpretation of the law with respect to investors and ESG
issues. The
Freshfields report concluded that not only was it permissible for investment
companies to
33
CA 3015975 2018-08-29
integrate ESG issues into investment analysis but it was arguably part of
their fiduciary duty to
do so. In 2014, the Law Commission (England and Wales) confirmed that there
was no bar on
pension trustees and others from taking account of ESG factors when making
investment
decisions.
[000125] Where Friedman had provided the academic support for the argument
that the
integration of ESG type factors into financial practice would reduce financial
performance,
numerous reports began to appear in the early years of the century which
provided research that
supported arguments to the contrary. In 2006 Oxford University's Michael
Barnett and New
York University's Robert Salomon published an influential study which
concluded that the two
sides of the argument might even be complementary ¨ they propounded a
curvilinear relationship
between social responsibility and financial performance, both selective
investment practices and
non-selective could maximize financial performance of an investment portfolio,
the only route
likely to damage performance was a middle way of selective investment. Besides
the large
investment companies and banks taking an interest in matters ESG, an array of
investment
companies specifically dealing with responsible investment and ESG based
portfolios began to
spring up throughout the financial world.
[000126] Many in the investment industry believe the development of ESG
factors as
considerations in investment analysis to be inevitable. The evidence toward a
relationship
between consideration for ESG issues and financial performance is becoming
greater and the
combination of fiduciary duty and a wide recognition of the necessity of the
sustainability of
investments in the long term has meant that environmental social and corporate
governance
concerns are now becoming increasingly important in the investment market. ESG
has become
less a question of philanthropy than practicality.
[000127] There has been uncertainty and debate as to what to call the
inclusion of
intangible factors relating to the sustainability and ethical impact of
investments. Names have
ranged from the early use of buzz words such as "green" and "eco", to the wide
array of possible
descriptions for the types of investment analysis - "responsible investment",
''socially responsible
investment" (SRI), "ethical", "extra-financial", "long horizon investment"
(LHI), "enhanced
business", "corporate health", "non-traditional", and others. But the
predominance of the term
ESG has now become fairly widely accepted. A survey of 350 global investment
professionals
34
CA 3015975 2018-08-29
conducted by AXA Investment Managers and AQ Research in 2008 concluded the
vast majority
of professionals preferred the term ESG to describe such data.
[000128] Interest in ESG and sustainable investing runs strong for plan
participants,
according to Natixis 2016 Survey of Defined Contribution Plan Participants. In
fact, more than
six in ten participants agreed they would be more likely to contribute or
increase their
contributions to their retirement plan if they knew their investments were
doing social good.
[000129] In January 2016, the PRI, UNEP FT and The Generation Foundation
launched a
three year project to end the debate on whether fiduciary duty is a legitimate
barrier to the
integration of environmental, social and governance issues in investment
practice and decision-
making.
[000130] This follows the publication in September 2015 of Fiduciary Duty
in the 21st
Century by the PRI, UNEP Fl, UNEP Inquiry and UN Global Compact. The report
concluded
that "Failing to consider all long-term investment value drivers, including
ESG issues, is a failure
of fiduciary duty". It also acknowledged that despite significant progress,
many investors have
yet to fully integrate ESG issues into their investment decision-making
processes.
[000131] Despite the rapid growth of ESG funds across several measures, the
present
inventors have identified four main obstacles to the market today. The first
obstacle, which
relates to definitions and standards, presents a high challenge. A survey
recently conducted by
McKinsey found that 59% of institutional investors, already implementing some
form of ESG
strategy in their portfolios, were struggling with clarity around standards
and terminology, that
shows some degree of confusion on the subject.
[000132] For example, MSCI scores Exxon an A- with low controversy scores,
compared
to peers a relatively good ESG score. It becomes difficult to decide how to
make such a
comparison, whether certain sectors, such as oil producers, should even be
included in
comparative ratings, and the like.
[000133] Another criticism is directed at the ratings firms themselves
regarding the
inconsistency of ratings. These ratings are often not the same, or even
similar, for a given issuer.
For example, FTSE gives Warren Buffett's Berkshire Hathaway BRK.B the lowest
score of any
member of the S&P 500, while MSCI gives it a BB, the bottom end of its
"average" category.
Comcast CMCSA is the other way around, scoring 4.4 out of five at FTSE, but
rating only B, or
"laggard," from MSCI. Consequently, the empirical argument on better risk-
adjusted
CA 3015975 2018-08-29
performance is untenable if one cannot even rely on predictable, consistent
standards for a given
issuer. If a fiduciary's interpretation of the data leads them to use MSCI' s
rating, rather than
Sustainalytics' rating (for example) or vice versa, and that trade leads to
inferior portfolio
performance, the subsequent response is unclear. In short, it is very
challenging to meet the
fiduciary obligation to maximize performance, recognizing that superior ESG
practices drive
better returns, when ESG ratings lack standards and are thus inconsistent.
[000134] Standards and reporting are catching up through the good work of
organizations
like the Sustainable Accounting Standards Board (SASB). Their final set of
recommendations is
due out in August of 2018. Likewise, the launch of the Morningstar
Sustainability Rating was a
positive development in late 2016 for fund analysis. However, the present
inventors have
identified that the role of values expression in ESG investing needs to be
better understood, and
the gray areas clarified, in relation to SRI principles. For example, it must
be clear whether ESG-
minded inventing is focused on better performance, impact, or both. Likewise,
the systems and
methods known in the art suffer from a lack of differentiation between ESG
managers and the
standards for reporting performance (and ESG behaviors) to investors.
[000135] In conjunction with these improved standards, the systems and
methods of the
present disclosure provide for consistent ratings of fiduciaries with respect
to governance,
including ESG factors in particular.
[000136] Another challenge is with adoption of ESG, including awareness and
understanding its role and how it is different from SRI or even Impact
Investing. There has been
some discussion, particularly with faith-based organizations, on explaining
the differences.
However, not enough investors, especially retail investors, are jumping in.
[000137] The present inventors have identified this trend to be less demand
driven, and
more supply driven. Moreover, through investigation, the present inventors
have demonstrated
how ESG can be an integral component on the asset management side of the
business to mitigate
risk, as well as to drive higher returns. As asset managers better understand
ESG as a core
investment process item, the notion of a separate ESG product, different from
other active or
indexed products starts to diminish. In time, ESG considerations will become
the way investing
is done, and theoretically should affect all manner of investing. The problem
today is that too
many fiduciaries are claiming to be ESG managers without any standards of
practice attached to
that. The systems and methods provided in the present disclosure provide
consistency across
36
CA 3015975 2018-08-29
assets, allowing investors and the like to better discern which fiduciaries
truly focus on ESG
factors within asset governance, and which simply apply buzzwords to
capitalize on labeling
themselves as being ESG-minded or green.
[000138] A third challenge relates to the quality and availability of the
underlying
information itself. Specifically, the present inventors have identified that
there is a need for
more information, better issuer disclosure, and better quality information
providing practical
insight. Some institutions, such as the Global Reporting Initiative (GRI),
Governance and
Accountability Institute and SASB, are beginning to collect such information.
However, this has
created another problem, which is of having too much information for
fiduciaries and investors
to manage. The present inventors have identified that relevant governance
factors can run to 150
variables or more, making it very challenging to distill down to meaningful
data. In contrast to
the systems and methods known in the art, those presently disclosed allow the
most important of
these variables to be modeled within a single index. As an investment manager,
client, or
investment board looking at a report, such a single index measure is necessary
for an informed
and accurate comparison.
[000139] Yet another is the application of ESG factors outside the context
of public
markets. As was reported in the Wall Street Journal recently, new issuances
within the private
markets have eclipsed the public markets for the last six years in a row. The
number of publicly
traded companies is now less than half compared to two decades ago. The
question becomes how
this work relating to the impacts of ESG minded governance can also be applied
in the private
markets (e.g., private equity). Specifically, public markets offer the benefit
of providing
information through ongoing disclosure requirements, which is also a reason
many companies no
longer want to remain public. Similarly, systems and methods known in the art
have not
adequately addressed such assets as municipal bonds and the like. One of the
constraints on the
growth of ESG among municipal ETFs has been the lack of data available to the
exchanges. In
light of this, governments need to be held to the same standards, especially
in light of the rapid
growth in green bonds, recent tax legislation around Opportunity Zones, and
the emergence of
Social Impact Bonds. This may be best driven by a combination of participation
by issuers,
investors, intermediaries and standard-setting organizations, just as in the
public side of ESG.
[000140] Through this additional information, the presently disclosed
systems and methods
provide for rating of fiduciaries that govern assets, whether public, private,
municipal, and the
37
CA 3015975 2018-08-29
like. In addition to the data sources provided in Figs. 6a-6b for governance
generally, Figs. 13a-
c depict exemplary variables relating to Environmental, Social, and Governance
(ESG) factors.
Figs. 13a-c also depict exemplary categorization for variables, such as
employing programs and
targets for reducing air emissions or water usage within "environmental"
concerns, and rates of
employee turnover within "social" concerns.
[000141] It should be recognized that these categories are merely
exemplary, which may be
subdivided, added to, or recombined in alternative manners. Likewise, the
listed subsets of data
within a category are merely examples. For example, additional data may relate
to concerns or
opportunities in nuclear energy, human rights, consumer protection, and/or
animal welfare.
[000142] In certain alternative embodiments, such as those for rating
municipalities as
fiduciaries, top level categories may be governance/fiscal issues, public
safety (including crime
rates), education (including literacy rates, graduation rates, etc),
diversity, poverty (including
income disparity, the percentage at or below the poverty line), heath metrics
(including access to
healthcare, percentages of insured, percentages of people receiving
assistance), and
environmental factors (including air quality, industrial sites and illegal
waste dumping, mercury
exposure, water safety, mass transit, food "deserts" or access to affordable
and nutritious food,
green space, lead poisoning, climate change and basic living, and heat
exposure).
[000143] It should further be recognized that, like factors for governance
more generally as
discussed above, this data may be provided from a wide variety of sources. In
the context of
ESG factors, MSCI, Sustainalytics, and others may provide relevant data used
in the presently
disclosed systems and methods.
[000144] In further embodiments according to the present disclosure,
additional data-
mining tools are anticipated for providing data for modeling. For example,
rather than providing
known keywords to search within the meeting minutes of a particular
organization (discussed
above), additional tools may be used to instead identify the keywords or
patterns of highly-rated
fiduciaries. This ensures that models remain current with the times, and also
provides for further
learning of the system as a whole. Such a pattern engine will also help
identify new areas of
focus as new problems, injustices, and opportunities arise in the future.
[000145] In the above description, certain terms have been used for
brevity, clarity, and
understanding. No unnecessary limitations are to be inferred therefrom beyond
the requirement
of the prior art because such terms are used for descriptive purposes and are
intended to be
38
CA 3015975 2018-08-29
,
broadly construed. The different assemblies described herein may be used alone
or in
combination with other devices. It is to be expected that various equivalents,
alternatives and
modifications are possible within the scope of any appended claims.
39
CA 3015975 2018-08-29
I