Note: Descriptions are shown in the official language in which they were submitted.
CA 03025776 2018-11-27
WO 2017/210115 PCT/US2017/034711
Methods of Mast Cell Tumor Prognosis and Uses Thereof
Cross reference to related applications
[0001] This application claims the benefit of 62/343,503 filed May 31,
2016, Matthew Breen,
entitled Methods of Mast Cell Tumor Prognosis and Uses Thereof with Atty. Dky.
No. 127-97-
PROV which is hereby incorporated by reference in its entirety.
1. FIELD
[0002] The present disclosure provides methods for detecting a high-risk
phenotype of a mast
cell tumor (MCT) in a biological sample from a mammal, preferably a dog. Kits,
PCR probes and
primers to detect high-risk MCT are also provided.
2. BACKGROUND
2.1. Introduction
[0003] Mast cell tumors (MCTs) are a common form of skin tumor in the
domestic dog,
accounting for up to 20% of all skin cancers in this species (Finnie and
Bostock, 1979, Rothwell
et al., 1987, Villamil et al., 2011). The clinical behavior of MCTs varies
widely from benign
tumors, which can be cured by surgical removal alone, to highly malignant
tumors that exhibit
aggressive biologic behavior and high rates of metastasis, even in dogs
treated with a combination
of surgery, radiation therapy and chemotherapy. This variable biological
behavior of MCTs poses
a clinical challenge to veterinary clinicians.
[0004] Treatment decisions are made based on the presence or absence of
prognostic factors,
such as histological grading, clinical stage, and expression of cell
proliferation markers. Among
many prognostic indicators, histopathological grading of tumors with Patnaik's
3-tier (grades 1-
3, with grade 3 being the most malignant) and Kiupel' s 2-tier grading (either
low or high grade)
schemes has been widely used for the prognostication and treatment decision
(Patnaik et al., 1984,
Kiupel et al., 2011). These schemes are based on consideration of histological
features such as
cellular morphology, mitotic index and extent of tissue involvement. These
histological features,
however, can be subjective, leading to inter-observer difference in grading.
In addition,
histopathological grading requires a tumor biopsy, which may involve general
anesthesia and
1
CA 03025776 2018-11-27
WO 2017/210115 PCT/US2017/034711
costly and potentially invasive surgical procedures. The need for a reliable,
non-invasive
prognostic test for canine MCTs remains paramount.
[0005] Numerical and structural chromosomal abnormalities are hallmarks of
cancer. Such
changes to the genome have been utilized widely as diagnostics and prognostics
in a range of
human cancers (Mitelman et al., 2007, Frohling and Dohner, 2008, Hanahan and
Weinberg, 2011).
Recent advancement in genomics technology now allows us to analyze the genetic
abnormalities
in the dog at a genome-wide level (Breen, 2009). DNA copy number changes
correlated with
prognosis have a potential to offer a molecular means of predicting outcome as
well as
identification of potential therapeutic targets. Genome-wide copy number
analysis has thus far not
been performed in canine MCTs, with the exception of a single MCT cell line
(Lin et al., 2009).
3. SUMMARY OF THE DISCLOSURE
[0006] This disclosure is directed to a method for detecting a high-risk
phenotype of a mast
cell tumor (MCT) in a biological sample by enumeration of certain regions of
certain dog
chromosome (CFA) from a dog which comprises: (a) measuring copy numbers of
regions of dog
chromosome (CFA) CFA5:38, CFA 20:32, CFA 20:46, and CFA 31:18, in the
biological sample;
(b) comparing the measured copy numbers to those of appropriate canine normal
controls; and (c)
if the copy numbers of regions of CFA 31:18 and CFA 20:46 are increased and
the copy numbers
of regions of CFA5:38 and CFA 20:32 are reduced from that of the appropriate
controls, detecting
that the dog has increased likelihood of a high-risk phenotype of a mast cell
tumor (MCT).
[0007] In one embodiment of the method of par. [0006], the copy number
increases are > 1.5.
[0008] In another embodiment of the method of par. [0006] or [0007], the
copy number
reductions are < 0.5. In yet another embodiment, both the copy number
increases are > 1.5 and
the copy number reductions are < 0.5.
[0009] In the methods of par. [0006]-[0008], the copy numbers may be
measured by
fluorescence in situ hybridization (FISH); polymerase chain reaction (PCR),
such as digital droplet
PCR; comparative genomic hybridization (CGH); or next generation sequencing.
[0010] In the methods of par. [0006]-[0009], the biological sample may be a
tissue sample
such as a fresh-frozen sample or a fresh sample or a fixed sample such as a
formalin-fixed, paraffin-
embedded (FFPE) sample.
2
CA 03025776 2018-11-27
WO 2017/210115 PCT/US2017/034711
[0011] The invention also provides a kit for detecting a high-risk
phenotype of a mast cell
tumor (MCT) in a biological sample in a dog comprising: (a) at least a
plurality of reagents selected
from the group consisting of: nucleic acid probes and/or primers capable of
specifically detecting
CFA5:38, CFA 20:32, CFA 20:46, and CFA 31:18,; and (b) instructions for use in
measuring a
copy number of regions of CFA5:38, CFA 20:32, and CFA 20:46, and CFA 31:18 in
a biological
sample from a dog, wherein if the copy numbers of regions of CFA 20:46 and CFA
31:18 are
increased and the copy numbers of regions of CFA5:38 and CFA 20:32 are reduced
from that of
measured copy numbers for appropriate controls, and detecting that the dog has
increased
likelihood of a high-risk phenotype of a mast cell tumor (MCT).
[0012] In the kit of par. [0011], the reagents may comprise primers with
SEQ ID NOS:4-7 and
11-14 and probes with SEQ ID NOS:15-18.
[0013] The disclosure also provides a method for treating a dog with a mast
cell tumor (MCT)
which comprises: (a) measuring copy numbers of regions of CFA5:38, CFA 20:32,
CFA 20:46,
and CFA 31:18, in a biological sample from the dog; (b) comparing the measured
copy numbers
to those of appropriate canine normal controls; (c) if the copy numbers of
regions of CFA 20:46
and CFA 31:18 are increased and the copy numbers of regions of CFA5:38 and CFA
20:32 are
reduced from that of the appropriate controls, detecting that the dog has
increased likelihood of a
high-risk phenotype of a mast cell tumor (MCT); and (d) treating the dog with
a chemotherapy
regimen.
[0014] In the method of treatment, the chemotherapy regimen may comprise a
treatment with
an alkylating agent, a tyrosine kinase inhibitor, a vinca alkaloid or a
combination thereof. The
alkylating agent may be a nitrosourea such as lomustine. The tyrosine kinase
inhibitor may be
toceranib, masatinib, or imatinib. The vinca alkyloid may be vinblastine.
4. BRIEF DESCRIPTION OF THE FIGURES
[0015] Fig. 1: Representative oaCGH profiles of four canine MCT cases
(Cases, 68, 38, 54
and 48) from the cohort used in the present study. In each case, the oaCGH
profiles present the
10g2 tumor/reference ratio on the y-axis and the genome coordinates of the
¨180,000 probes on the
custom array positioned by chromosome location across all 38 canine autosomes
and X
chromosomes on the x-axis. Histological grading and KIT mutational statuses
were as follows:
case 68, Grade 1/low grade (3-tier/2-tier grading system) tumor without KIT
mutation; case 38,
3
CA 03025776 2018-11-27
WO 2017/210115 PCT/US2017/034711
Grade 2/low grade tumor with KIT Exon 11 ITD mutation; case 54, Grade3/high-
grade tumor
without KIT mutation; case 48, Grade 3/high-grade tumor with KIT Exon 11 ITD
mutation.
[0016] Fig. 2A and 2B: Genomic imbalance in MCTs grouped by 3-tier (left)
and 2-tier (right)
histological grading. (2A) Numbers of copy number aberrations CNAs and (2B)
total (combined)
length of all CNAs was compared between groups stratified by histological
grading.
[0017] Fig. 3A and 3B: Penetrance plots of genome-wide CNAs in canine MCTs,
stratified by
(3A) 3-tier and (3B) 2-tier grading schemes. Genomic locations are plotted
along the x-axis. The
y-axis indicates the percentage of corresponding cohort that demonstrated
either copy number gain
(shown in darker gray above the midline) or loss (shown in lighter gray below
the midline) of the
corresponding chromosome region. CNAs were more frequent in higher grade
tumors.
[0018] Fig. 4A and 4B: Genomic imbalance in MCTs with wild-type KIT and
tumors with
mutant KIT. (4A) Numbers of CNAs and total CNA length was compared in tumors
with and
without KIT mutations. (4B) Penetrance plots of genome-wide CNAs in canine
MCTs, stratified
by KIT mutational status. Genomic locations are plotted along the x-axis. The
y-axis indicates the
percentage of corresponding cohort that demonstrated either copy number gain
(shown in darker
gray above the midline) or loss (shown in lighter gray below the midline) of
the corresponding
chromosome region. Canine MCTs without KIT mutations exhibited limited numbers
of CNAs
except for CFA 20. Canine MCTs with KIT mutations exhibited a wide range of
CNAs with high
frequencies, including gains of CFA 4, 13, 31, 36 and 38 and loss of 5, 16 and
28.
[0019] Fig. 5A and 5B: GISTIC analysis of CGH profiles of MCTs with wild-
type KIT and
tumors with mutant KIT. The peak region of significance is highlighted in dark
grey, flanked by a
broader region of reduced significance shown in pale grey. Genomic locations
are plotted along
the x-axis, and G-scores for statistical significance are shown on the y-axis.
[0020] Fig. 6A and 6B: Comparison analysis of penetrance plots of CNAs in
high-risk and
low-risk MCTs. The y-axis indicates the percentage of difference of CNA
frequencies (darker
gray: gain, lighter gray: loss) between two groups. Regions where CNA
frequencies are
significantly different between two groups are shown in darker gray (gain) or
lighter gray (loss)
above chromosome position. (6A) Comparison of KIT mutant tumors and low-risk
tumors. (6B)
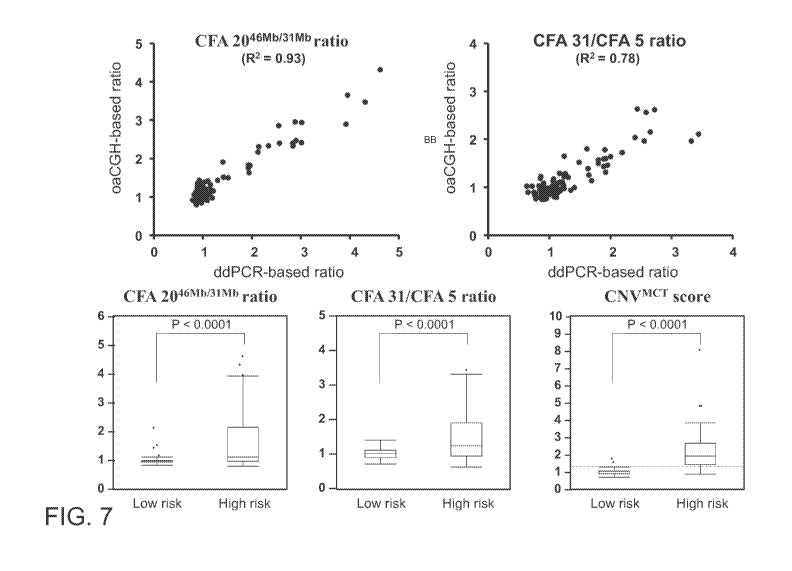
Comparison of high-grade tumors and low-risk tumors.
[0021] Fig. 7: Performance of the ddPCR assays. Upper two panels:
correlation of ratios
estimated with oaCGH and ddPCR (x-axis, ddPCR-based ratio; y-axis, oaCGH-based
ratio).
4
CA 03025776 2018-11-27
WO 2017/210115 PCT/US2017/034711
Lower three panels. Difference between low-risk and high-risk MCTs in CFA
2046Mb/31Mb ratio,
CFA 31/CFA 5 ratio and CNA1`4cT score. The broken line indicates the CNA1`4cT
score cut-off value
of 1.27, the threshold valued identified to separate low-risk and high-risk
MCTs.
[0022] Fig. 8A and 8B: Genomic imbalance in CFA 20 in MCTs with wild-type
KIT gene,
stratified by (8A) 3-tier and (8B) 2-tier histological grading. Frequency of
loss of a middle segment
of CFA 20 (15-43 Mb) and gain of a distal segment of CFA 20 (45-50 Mb)
increased as
histological grade increased.
[0023] Fig. 9A and 9B: Genomic imbalance in MCTs with exon 11 ITD mutations
and tumors
with other types of KIT mutation. (9A) Numbers of CNAs and total CNA length
was compared in
mutant KIT tumors by their mutational type. (9B) Penetrance plots of genome-
wide CNAs in
canine MCTs, stratified by KIT mutational type. Genomic locations are plotted
along the x-axis.
The y-axis indicates the percentage of corresponding cohort that demonstrated
either copy number
gain (shown in darker gray above the midline) or loss (shown in lighter gray
below the midline)
of the corresponding chromosome region.
[0024] Fig. 10A and 10B: Penetrance plots of genome-wide CNAs in MCTs with
KIT
mutations, stratified by (10A) 3-tier and (10B) 2-tier grading schemes.
Genomic locations are
plotted along the x-axis. The y-axis indicates the percentage of corresponding
cohort that
demonstrated either copy number gain (shown in darker gray above the midline)
or loss (shown in
lighter gray below the midline) of the corresponding chromosome region.
[0025] Fig. 11: The MCTcNA score in a validation cohort consisting of 38
MCT cases. High-
risk MCTs exhibited significantly increased MCTcNA score compared to low-risk
tumors. The
broken line indicates the MCTcNA score cut-off value of 1.26, the threshold
value used to separate
low-risk and high-risk MCTs. Box plots indicate 25th to 75th percentiles with
whiskers indicating
the minimum and maximum values and with dots showing outliers
5. DETAILED DESCRIPTION OF THE DISCLOSURE
[0026] This disclosure provides a method for genomic profiling of canine
mast cell tumors
that identifies DNA copy number aberrations (CNAs) associated with aggressive
tumor phenotype
CA 03025776 2018-11-27
WO 2017/210115 PCT/US2017/034711
[0027] Briefly, canine mast cell tumor (MCT) is the most common skin
malignancy in dogs
and presents with heterogeneous biological behaviors, posing a clinical
challenge to veterinary
clinicians. Knowledge regarding the underlying molecular aberrations in the
development and
progression of MCTs are largely unknown. Characterization of genomic
alterations in the tumors
may identify genome regions and/or genes responsible for the malignant
alteration of canine
MCTs, facilitating the development of new therapeutic strategies and improved
clinical
management of this cancer. We performed genome-wide DNA copy number analysis
of 109
canine primary MCTs using oligo array comparative genomic hybridization
(oaCGH). We
demonstrated a stepwise accumulation of numerical CNAs as tumor grade
increases. Tumors with
KIT mutations showed genome-wide aberrant copy number profiles, with frequent
CNAs of genes
in the p53 and RB pathways, whereas CNAs were less common in tumors with wild-
type KIT. We
evaluated the presence of four CNAs associated with high-risk tumor phenotypes
as a means to
predict aggressive tumors. Presence of these CNAs was able to predict high-
risk phenotypes with
a sensitivity of 75-91% and specificity of 86-93%, when using oaCGH and
digital droplet PCR
platforms. Further investigation of genome regions identified in this study
may lead to the
development of a molecular tool for classification and prognosis, as well as
identification of
therapeutic target molecules.
[0028] In this disclosure genome-wide DNA copy number profiling of a cohort
of 109 primary
MCTs, using oligo array comparative genomic hybridization (oaCGH) was
performed. We
identified a stepwise accumulation of CNAs in canine MCTs as tumor
histological grade increases.
We also demonstrated a strong correlation of several CNAs with the presence of
KIT gene
mutations, which is found in 20-30% of canine MCTs. Using four CNAs associated
with high
histological grade or KIT gene mutations, we developed and evaluated two
simple digital droplet
PCR (ddPCR) assays as a means to predict tumors with poor prognostic factors
in 147 canine MCT
specimens.
[0029] The relevant regions of CFA 5, CFA 20, & CFA 31 and more
specifically the CFA
5:37 Mb, CFA 20:31 Mb, CFA 20:46 Mb and CFA 31:16 Mb regions may be found in
Tables 3,
4,5 and the Figures.
[0030] Method of detection: The copy number status of the regions assessed
may be measured
by, but is not limited to, fluorescence in situ hybridization (FISH),
polymerase chain reaction
(PCR), comparative genomic hybridization (CGH), or next generation sequencing
(NGS). The
6
CA 03025776 2018-11-27
WO 2017/210115 PCT/US2017/034711
biological sample must be a biopsy of the mass and may be a fresh sample, a
fresh-frozen sample
of the suspected mass, a sample in a preservative such as, for example,
RNAlater, or a sample that
has been processed for pathologic assessment. For example, the tissue specimen
may have been
soaked in one of several options to fix the tissues for histologic evaluation,
such as, but not limited
to, conventional histologic fixatives including, 10% neutral buffered
formalin, B5, zinc-formalin.
The sample may also have been soaked in formalin free fixatives such as, but
not limited to, for
example, 70% ethanol FineFIX, RCL-2 and HOPE.
[0031] The invention also provides a method of selecting treatment for a
dog with MCT. The
detection and quantification of the copy number status at regions of CFA 5,
CFA 20 and CFA 31
would indicate the presence of a high-risk MCT and thus may be used to direct
therapy
accordingly. If the dog has MCT, the therapy may be, for example, surgical
resection of the mass
with wide margins, the extent of which is determined by the size and precise
location of the mass,
surgical resection followed by radiation therapy and/or chemotherapy such as,
but not limited to,
Vinblastine or Lumustine, and/or treatment with one or more tyrosine kinase
inhibitors (TKIs)
such as, toceranib (Palladia()) or masatinib (KinavetC)), and imatinib
(GleevacC)).
5.1. Definitions
[0032] While the following terms are believed to be well understood by one
of ordinary skill
in the art, the following definitions are set forth to facilitate explanation
of the presently disclosed
subject matter.
[0033] Mast cells are derived from the bone marrow and can be found in
various tissues
throughout the body, generally residing in the connective tissues associated
with the skin, lungs,
nose, and mouth. The primary functions of mast cells are to aid tissue repair
and the formation of
new blood vessels and defend the body against parasitic infestations. In
addition, mast cells contain
several types of dark granules containing histamine and heparin, which are
used by the body to
modify immune reactions and inflammation. A "mast cell tumor" (MCT) is type of
round-cell
tumor containing mast cells, which may also be referred to as a mastocytoma.
MCTs are found in
humans and many animal species; in human medicine it also can refer to an
accumulation or nodule
of mast cells that resembles a tumor. MCTs are a common form of skin tumor in
the domestic dog,
accounting for up to 20% of all skin cancers in this species. The clinical
behavior of MCTs varies
widely from benign tumors, which can be cured by surgical removal alone, to
highly malignant
7
CA 03025776 2018-11-27
WO 2017/210115 PCT/US2017/034711
tumors that exhibit aggressive biologic behavior and high rates of metastasis,
even in dogs treated
with a combination of surgery, radiation therapy and chemotherapy.
[0034] "Copy number" is a measurement of DNA, whether of a single locus,
one or more loci,
or an entire genome. A "copy number" of two is "wild-type" in a dog (because
of diploidy, except
for sex chromosomes). A "copy number" of other than two in a dog (except for
sex chromosomes)
deviates from wild-type. Such deviations include gains, i.e., increases in
copy number generally
up to 5 copies per cell, deletions, i.e., decreases in copy number, i.e.,
either 1 or 0 copies per cell,
and amplifications, i.e., increases in copy number generally in excess of 5
copies per cell.
[0035] "Labeled," "labeled with a detectable label," and "detectably
labeled" are used
interchangeably herein to indicate that an entity (e.g., a probe) can be
detected. "Label" and
"detectable label" mean a moiety attached to an entity to render the entity
detectable, such as a
moiety attached to a probe to render the probe detectable upon binding to a
target sequence. The
moiety, itself, may not be detectable but may become detectable upon reaction
with yet another
moiety. Use of the term "detectably labeled" is intended to encompass such
labeling.
[0036] The detectable label can be selected such that the label generates a
signal, which can
be measured and the intensity of which is proportional to the amount of bound
entity. A wide
variety of systems for labeling and/or detecting molecules, such as nucleic
acids, e.g., probes, are
well-known. Labeled nucleic acids can be prepared by incorporating or
conjugating a label that is
directly or indirectly detectable by spectroscopic, photochemical,
biochemical, immunochemical,
electrical, optical, chemical or other means. Suitable detectable labels
include radioisotopes,
fluorophores, chromophores, chemiluminescent agents, microparticles, enzymes,
magnetic
particles, electron dense particles, mass labels, spin labels, haptens, and
the like. Fluorophores and
chemiluminescent agents are preferred herein.
[0037] "Nucleic acid sample" refers to a sample comprising nucleic acid in
a form suitable for
hybridization with a probe, such as a sample comprising nuclei or nucleic
acids isolated or purified
from such nuclei. The nucleic acid sample may comprise total or partial (e.g.,
particular
chromosome(s)) genomic DNA, total or partial mRNA (e.g., particular
chromosome(s) or gene(s)),
or selected sequence(s). Condensed chromosomes (such as are present in
interphase or metaphase)
are suitable for use as targets in in situ hybridization, such as FISH.
[0038] "Predetermined cutoff" and "predetermined level" refer generally to
a cutoff value that
is used to assess diagnostic/prognostic/therapeutic efficacy results by
comparing the assay results
8
CA 03025776 2018-11-27
WO 2017/210115 PCT/US2017/034711
against the predetermined cutoff/level, where the predetermined cutoff/level
already has been
linked or associated with various clinical parameters (e.g., severity of
disease,
progre s s ion/nonpro gre s s ion/improvement, etc.).
[0039] "Probe," in the context of the present disclosure, is an
oligonucleotide or polynucleotide
that can selectively hybridize to at least a portion of a target sequence
under conditions that allow
for or promote selective hybridization. In general, a probe can be
complementary to the coding or
sense (+) strand of DNA or complementary to the non-coding or anti-sense (-)
strand of DNA
(sometimes referred to as "reverse-complementary"). Probes can vary
significantly in length. A
length of about 10 to about 100 nucleotides, such as about 15 to about 75
nucleotides, e.g., about
15 to about 50 nucleotides, can be preferred in some applications such as PCR,
whereas a length
of about 50 to about 1 X 10⁶ nucleotides can be preferred for chromosomal
probes and a length of
about 5,000 to about 800,000 nucleotides or more preferably about 75,000 to
about 200,000 for
BAC probes.
[0040] The invention encompasses fragments of nucleic acids that can serve
(1) as probes for
detecting segments of domestic dog (Canis familairis, CFA) genome referred to
as chromosomes
5, 20 or 31 (hereafter referred to as CFA 5, CFA 20 and CFA 31). The dog
genome has been
sequenced and is available for example, USCS canfam2 at
http://genome.ucsc.edu/cgi-
bin/hgGateway?db=canFam2 and the NCBI Canis lupus familiaris genome database;
or
ENSEMBL database CanFam3.1 (GCA 000002285.2). See also, Lindblad-Toh et al.
2005
"Genome sequence, comparative analysis and haplotype structure of the domestic
dog" Nature
438 (7069), 803-819.
[0041] The changes in copy number of regions of CFA 5, CFA 20 and/or CFA 31
may be
detected by a number of methods well known in the art, e.g., Southern and
northern blotting, dot
blotting, colony hybridizations, hybridization to an array, comparative
genomic hybridization
(CGH), etc. or (2) as polymerase chain reaction (PCR) primers to amplify CFA
5, CFA 20 and/or
CFA 31. PCR primers can comprise, in addition to CFA 5, CFA 20 and/or CFA 31
nucleic acid
sequences, other sequences such as restriction enzyme cleavage sites that
facilitate the use of the
amplified nucleic acid. PCR is described in the following references: Saiki et
al. 1988 Science 239
487-491; PCR Technology, Erlich, ed., Stockton Press, (1989). As explained
below, PCR can be
useful to detect abnormally low or high levels of target regions of
chromosomes including CFA 5,
CFA 20 and/or CFA 31.
9
CA 03025776 2018-11-27
WO 2017/210115 PCT/US2017/034711
[0042] Hybridization techniques are well known in the art and are described
by Sambrook, J.,
E. F. Fritsch, and T. Maniatis (Molecular Cloning: A Laboratory Manual, Cold
Spring Harbor
Laboratory Press, Cold Spring Harbor, N.Y., chapters 9 and 11, (1989)) and
Current Protocols in
Molecular Biology (F. M. Ausubel et al., eds., John Wiley & Sons, Inc.,
sections 2.10 and 6.3-6.4
(1995)), the relevant portions of which are incorporated by reference herein.
Moderately stringent
conditions for filter hybridizations include hybridization in about 50%
formamide, 6 x SSC at a
temperature from about 42 C to 55 C and washing at about 60 C in 0.5 x SSC,
0.1 % SDS. Highly
stringent conditions are defined as hybridization conditions as above, but
with washing at
approximately 68 C in 0.2 x SSC, 0.1 % SDS. SSPE (1 xSSPE is 0.15 M NaCI, 10
mM NaH2PO4,
and 1.26 mM EDTA, pH 7.4) can be substituted for SSC (1 xSSC is 0.15 M NaCI
and 1 5 mM
sodium citrate) in the hybridization and wash buffers; washes, optionally at
least two washes, are
performed for 15 minutes after hybridization is complete.
[0043] It should be understood that the wash temperature and wash salt
concentration can be
adjusted as necessary to achieve a desired degree of stringency by applying
the basic principles
that govern hybridization reactions and duplex stability, as known to those
skilled in the art and
described further below (see e.g., Sambrook et al., supra). When nucleic acids
of known sequence
are hybridized, the hybrid length can be determined by aligning the sequences
of the nucleic acids
(for example, using GAP) and identifying the region or regions of optimal
sequence
complementarity. The hybridization temperature for hybrids anticipated to be
less than 50 base
pairs in length should be 5 to 10 C less than the melting temperature (Tm) of
the hybrid, where
Tm is determined according to the following equations. For hybrids less than
18 base pairs in
length, Tm (degrees C) = 2(# of A + T bases) + 4(# of G + C bases). For
hybrids above 18 base
pairs in length, Tm (degrees C) = 81.5 + 16.6(logio[Na+]) + 0.41 (% G + C) -
(600 N), where N is
the number of bases in the hybrid, and [Na+] is the concentration of sodium
ions in the
hybridization buffer. Each such hybridizing nucleic acid has a length that is
at least 15 nucleotides
(or at least 18 nucleotides, or at least 20, or at least 25, or at least 30,
or at least 40, or at least 50,
or at least 100. Sambrook et al., supra.
[0044] Throughout the present specification, the terms "about" and/or
"approximately" may
be used in conjunction with numerical values and/or ranges. The term "about"
is understood to
mean those values near to a recited value. For example, "about 40 [units]" may
mean within
25% of 40 (e.g., from 30 to 50), within 20%, 15%, 10%, 9%, 8%, 7%,
6%, 5%,
CA 03025776 2018-11-27
WO 2017/210115 PCT/US2017/034711
4%, 3%, 2%, 1%, less than 1%, or any other value or range of values
therein or therebelow.
Furthermore, the phrases "less than about [a valuer or "greater than about [a
valuer should be
understood in view of the definition of the term "about" provided herein. The
terms "about" and
"approximately" may be used interchangeably.
[0045] Throughout the present specification, numerical ranges are provided
for certain
quantities. It is to be understood that these ranges comprise all subranges
therein. Thus, the range
"from 50 to 80" includes all possible ranges therein (e.g., 51-79, 52-78, 53-
77, 54-76, 55-75, 60-
70, etc.). Furthermore, all values within a given range may be an endpoint for
the range
encompassed thereby (e.g., the range 50-80 includes the ranges with endpoints
such as 55-80, 50-
75, etc.).
[0046] As used herein, the verb "comprise" as is used in this description
and in the claims and
its conjugations are used in its non-limiting sense to mean that items
following the word are
included, but items not specifically mentioned are not excluded.
[0047] Throughout the specification the word "comprising," or variations
such as "comprises"
or "comprising," will be understood to imply the inclusion of a stated
element, integer or step, or
group of elements, integers or steps, but not the exclusion of any other
element, integer or step, or
group of elements, integers or steps. The present disclosure may suitably
"comprise", "consist of',
or "consist essentially of', the steps, elements, and/or reagents described in
the claims.
[0048] It is further noted that the claims may be drafted to exclude any
optional element. As
such, this statement is intended to serve as antecedent basis for use of such
exclusive terminology
as "solely", "only" and the like in connection with the recitation of claim
elements, or the use of a
"negative" limitation.
[0049] Unless defined otherwise, all technical and scientific terms used
herein have the same
meanings as commonly understood by one of ordinary skill in the art to which
this disclosure
belongs. Preferred methods, devices, and materials are described, although any
methods and
materials similar or equivalent to those described herein can be used in the
practice or testing of
the present disclosure. All references cited herein are incorporated by
reference in their entirety.
[0050] Polynucleotide Amplification and Determination
[0051] In many instances, it is desirable to amplify a nucleic acid
sequence using any of several
nucleic acid amplification procedures which are well known in the art.
Specifically, nucleic acid
amplification is the chemical or enzymatic synthesis of nucleic acid copies
which contain a
11
CA 03025776 2018-11-27
WO 2017/210115 PCT/US2017/034711
sequence that is complementary to a nucleic acid sequence being amplified
(template). The
methods and kits of the invention may use any nucleic acid amplification or
detection methods
known to one skilled in the art, such as those described in U.S. Pat. Nos.
5,525,462 (Takarada et
al.); 6,114,117 (Hepp et al.); 6,127,120 (Graham et al.); 6,344,317
(Urnovitz); 6,448,001 (Oku);
6,528,632 (Catanzariti et al.); and PCT Pub. No. WO 2005/111209 (Nakajima et
al.); all of which
are incorporated herein by reference in their entirety.
[0052] Commonly used methods known in the art for the quantification of
mRNA expression
in a sample include northern blotting and in situ hybridization (Parker and
Barnes, Methods Mol.
Biol. 106:247-83, 1999), RNAse protection assays (Hod, Biotechniques 13:852-
54, 1992), PCR-
based methods, such as reverse transcription PCR (RT-PCR) (Weis et al., TIG
8:263-64, 1992),
and array-based methods (Schena et al., Science 270:467-70, 1995).
Alternatively, antibodies may
be employed that can recognize specific duplexes, including DNA duplexes, RNA
duplexes, and
DNA-RNA hybrid duplexes, or DNA-protein duplexes. Representative methods for
sequencing-
based gene expression analysis include Serial Analysis of Gene Expression
(SAGE), bead-based
technologies, single molecule fluorescence in situ hybridization (smFISH)
studies, and gene
expression analysis by massively parallel signature sequencing. Velculescu et
al. 1995 Science
270 484-487; Streefkerk et al., 1976, Pro Biol Fluid Proc Coll 24 811-814;
Soini U.S. Pat. No.
5,028,545; smFISH, Lyubimova et al. 2013 Nat Protocol 8(9) 1743-1758.
[0053] In some embodiments, the nucleic acids are amplified by PCR
amplification using
methodologies known to one skilled in the art. One skilled in the art will
recognize, however, that
amplification can be accomplished by any known method, such as ligase chain
reaction (LCR),
Q13-replicase amplification, rolling circle amplification, transcription
amplification, self-sustained
sequence replication, nucleic acid sequence-based amplification (NASBA), each
of which
provides sufficient amplification. Branched-DNA technology may also be used to
qualitatively
demonstrate the presence of a sequence of the technology, which represents a
particular
methylation pattern, or to quantitatively determine the amount of this
particular genomic sequence
in a sample. Nolte reviews branched-DNA signal amplification for direct
quantitation of nucleic
acid sequences in clinical samples (Nolte, 1998, Adv. Clin. Chem. 33:201-235).
[0054] The PCR process is well known in the art and is thus not described
in detail herein. For
a review of PCR methods and protocols, see, e.g., Innis et al., eds., PCR
Protocols, A Guide to
Methods and Application, Academic Press, Inc., San Diego, Calif. 1990; U.S.
Pat. No. 4,683,202
12
CA 03025776 2018-11-27
WO 2017/210115 PCT/US2017/034711
(Mullis); which are incorporated herein by reference in their entirety. PCR
reagents and protocols
are also available from commercial vendors, such as Roche Molecular Systems
(Pleasanton, CA).
PCR may be carried out as an automated process with a thermostable enzyme. In
this process, the
temperature of the reaction mixture is cycled through a denaturing region, a
primer annealing
region, and an extension reaction region automatically. Machines specifically
adapted for this
purpose are commercially available.
[0055] High Throughput, Single Molecule Sequencing, and Direct Detection
Technologies
[0056] Suitable next generation sequencing technologies are widely
available. Examples
include the 454 Life Sciences platform (Roche, Branford, CT) (Margulies et al.
2005 Nature, 437,
376-380); 111umina' s Genome Analyzer, GoldenGate Methylation Assay, or
Infinium Methylation
Assays, i.e., Infinium HumanMethylation 27K BeadArray or VeraCode GoldenGate
methylation
array (Illumina, San Diego, CA; Bibkova et al., 2006, Genome Res. 16, 383-393;
U.S. Pat. Nos.
6,306,597 and 7,598,035 (Macevicz); 7,232,656 (Balasubramanian et al.)); or
DNA Sequencing
by Ligation, SOLiD System (Applied Biosystems/Life Technologies; U.S. Pat.
Nos. 6,797,470,
7,083,917, 7,166,434, 7,320,865, 7,332,285, 7,364,858, and 7,429,453 (Barany
et al.); or the
Helicos True Single Molecule DNA sequencing technology (Harris et al., 2008
Science, 320, 106-
109; U.S. Pat. Nos. 7,037,687 and 7,645,596 (Williams et al.); 7,169,560
(Lapidus et al.);
7,769,400 (Harris)), the single molecule, real-time (SMRTTm) technology of
Pacific Biosciences,
and sequencing (Soni and Meller, 2007, Clin. Chem. 53, 1996-2001) which are
incorporated herein
by reference in their entirety. These systems allow the sequencing of many
nucleic acid molecules
isolated from a specimen at high orders of multiplexing in a parallel fashion
(Dear, 2003, Brief
Funct. Genomic Proteomic, 1(4), 397-416 and McCaughan and Dear, 2010, J.
Pathol., 220, 297-
306). Each of these platforms allow sequencing of clonally expanded or non-
amplified single
molecules of nucleic acid fragments. Certain platforms involve, for example,
(i) sequencing by
ligation of dye-modified probes (including cyclic ligation and cleavage), (ii)
pyrosequencing, and
(iii) single-molecule sequencing.
[0057] Pyrosequencing is a nucleic acid sequencing method based on
sequencing by synthesis,
which relies on detection of a pyrophosphate released on nucleotide
incorporation. Generally,
sequencing by synthesis involves synthesizing, one nucleotide at a time, a DNA
strand
complimentary to the strand whose sequence is being sought. Study nucleic
acids may be
13
CA 03025776 2018-11-27
WO 2017/210115 PCT/US2017/034711
immobilized to a solid support, hybridized with a sequencing primer, incubated
with DNA
polymerase, ATP sulfurylase, luciferase, apyrase, adenosine 5' phosphsulfate
and luciferin.
Nucleotide solutions are sequentially added and removed. Correct incorporation
of a nucleotide
releases a pyrophosphate, which interacts with ATP sulfurylase and produces
ATP in the presence
of adenosine 5' phosphsulfate, fueling the luciferin reaction, which produces
a chemiluminescent
signal allowing sequence determination. Machines for pyrosequencing and
methylation specific
reagents are available from Qiagen, Inc. (Valencia, CA). See also Tost and
Gut, 2007, Nat. Prot.
2 2265-2275. An example of a system that can be used by a person of ordinary
skill based on
pyrosequencing generally involves the following steps: ligating an adaptor
nucleic acid to a study
nucleic acid and hybridizing the study nucleic acid to a bead; amplifying a
nucleotide sequence in
the study nucleic acid in an emulsion; sorting beads using a picoliter
multiwell solid support; and
sequencing amplified nucleotide sequences by pyrosequencing methodology (e.g.,
Nakano et al.,
2003, J. Biotech. 102, 117-124). Such a system can be used to exponentially
amplify amplification
products generated by a process described herein, e.g., by ligating a
heterologous nucleic acid to
the first amplification product generated by a process described herein.
[0058] Certain single-molecule sequencing embodiments are based on the
principal of
sequencing by synthesis, and utilize single-pair Fluorescence Resonance Energy
Transfer (single
pair FRET) as a mechanism by which photons are emitted as a result of
successful nucleotide
incorporation. The emitted photons often are detected using intensified or
high sensitivity cooled
charge-couple-devices in conjunction with total internal reflection microscopy
(T1RM). Photons
are only emitted when the introduced reaction solution contains the correct
nucleotide for
incorporation into the growing nucleic acid chain that is synthesized as a
result of the sequencing
process. In FRET based single-molecule sequencing or detection, energy is
transferred between
two fluorescent dyes, sometimes polymethine cyanine dyes Cy3 and Cy5, through
long-range
dipole interactions. The donor is excited at its specific excitation
wavelength and the excited state
energy is transferred, non-radiatively to the acceptor dye, which in turn
becomes excited. The
acceptor dye eventually returns to the ground state by radiative emission of a
photon. The two dyes
used in the energy transfer process represent the "single pair", in single
pair FRET. Cy3 often is
used as the donor fluorophore and often is incorporated as the first labeled
nucleotide. Cy5 often
is used as the acceptor fluorophore and is used as the nucleotide label for
successive nucleotide
additions after incorporation of a first Cy3 labeled nucleotide. The
fluorophores generally are
14
CA 03025776 2018-11-27
WO 2017/210115 PCT/US2017/034711
within 10 nanometers of each other for energy transfer to occur successfully.
Bailey et al. recently
reported a highly sensitive (15pg methylated DNA) method using quantum dots to
detect
methylation status using fluorescence resonance energy transfer (MS-qFRET)
(Bailey et al. 2009,
Genome Res. 19(8), 1455-1461, which is incorporated herein by reference in its
entirety).
[0059] An example of a system that can be used based on single-molecule
sequencing
generally involves hybridizing a primer to a study nucleic acid to generate a
complex; associating
the complex with a solid phase; iteratively extending the primer by a
nucleotide tagged with a
fluorescent molecule; and capturing an image of fluorescence resonance energy
transfer signals
after each iteration (e.g., Braslav sky et al., PNAS 100(7): 3960-3964 (2003);
U.S. Pat. No.
7,297,518 (Quake et al.) which are incorporated herein by reference in their
entirety). Such a
system can be used to directly sequence amplification products generated by
processes described
herein. In some embodiments the released linear amplification product can be
hybridized to a
primer that contains sequences complementary to immobilized capture sequences
present on a
solid support, a bead or glass slide for example. Hybridization of the primer-
released linear
amplification product complexes with the immobilized capture sequences,
immobilizes released
linear amplification products to solid supports for single pair FRET based
sequencing by synthesis.
The primer often is fluorescent, so that an initial reference image of the
surface of the slide with
immobilized nucleic acids can be generated. The initial reference image is
useful for determining
locations at which true nucleotide incorporation is occurring. Fluorescence
signals detected in
array locations not initially identified in the "primer only" reference image
are discarded as non-
specific fluorescence. Following immobilization of the primer-released linear
amplification
product complexes, the bound nucleic acids often are sequenced in parallel by
the iterative steps
of, a) polymerase extension in the presence of one fluorescently labeled
nucleotide, b) detection
of fluorescence using appropriate microscopy, TIRM for example, c) removal of
fluorescent
nucleotide, and d) return to step a with a different fluorescently labeled
nucleotide.
[0060] The technology may be practiced with digital PCR. Digital PCR was
developed by
Kalinina and colleagues (Kalinina et al., 1997, Nucleic Acids Res. 25; 1999-
2004) and further
developed by Vogelstein and Kinzler (1999, Proc. Natl. Acad. Sci. U.S.A. 96;
9236-9241). The
application of digital PCR is described by Cantor et al. (PCT Pub. Nos. WO
2005/023091A2
(Cantor et al.); WO 2007/092473 A2, (Quake et al.)), which are hereby
incorporated by reference
in their entirety. Digital PCR takes advantage of nucleic acid (DNA, cDNA or
RNA) amplification
CA 03025776 2018-11-27
WO 2017/210115 PCT/US2017/034711
on a single molecule level, and offers a highly sensitive method for
quantifying low copy number
nucleic acid. Fluidigm Corporation, BioRad's Digital PCR and Raindance
technologies all offer
systems for the digital analysis of nucleic acids. See, Karlin-Neumann G et
al. (2012). Probing
copy number variations using Bio-Rad's QX100TM Droplet DigitalTM PCR system.
Bio-Rad
Bulletin 6277; Diderot et al., Clinical Chemistry February 2013
clinchem.2012.193409.
[0061] In some embodiments, nucleotide sequencing may be by solid phase
single nucleotide
sequencing methods and processes. Solid phase single nucleotide sequencing
methods involve
contacting sample nucleic acid and solid support under conditions in which a
single molecule of
sample nucleic acid hybridizes to a single molecule of a solid support. Such
conditions can include
providing the solid support molecules and a single molecule of sample nucleic
acid in a
"microreactor." Such conditions also can include providing a mixture in which
the sample nucleic
acid molecule can hybridize to solid phase nucleic acid on the solid support.
Single nucleotide
sequencing methods useful in the embodiments described herein are described in
PCT Pub. No.
WO 2009/091934 (Cantor).
[0062] In certain embodiments, nanopore sequencing detection methods
include (a) contacting
a nucleic acid for sequencing ("base nucleic acid," e.g., linked probe
molecule) with sequence-
specific detectors, under conditions in which the detectors specifically
hybridize to substantially
complementary subsequences of the base nucleic acid; (b) detecting signals
from the detectors and
(c) determining the sequence of the base nucleic acid according to the signals
detected. In certain
embodiments, the detectors hybridized to the base nucleic acid are
disassociated from the base
nucleic acid (e.g., sequentially dissociated) when the detectors interfere
with a nanopore structure
as the base nucleic acid passes through a pore, and the detectors
disassociated from the base
sequence are detected.
[0063] A detector also may include one or more regions of nucleotides that
do not hybridize
to the base nucleic acid. In some embodiments, a detector is a molecular
beacon. A detector often
comprises one or more detectable labels independently selected from those
described herein. Each
detectable label can be detected by any convenient detection process capable
of detecting a signal
generated by each label (e.g., magnetic, electric, chemical, optical and the
like). For example, a
CD camera can be used to detect signals from one or more distinguishable
quantum dots linked to
a detector.
16
CA 03025776 2018-11-27
WO 2017/210115 PCT/US2017/034711
[0064] Next generation sequencing techniques may be applied to measure
expression levels or
count numbers of transcripts using RNA-seq or whole transcriptome shotgun
sequencing. See,
e.g., Mortazavi et al. 2008 Nat Meth 5(7) 621-627 or Wang et al. 2009 Nat Rev
Genet 10(1) 57-
63.
[0065] Nucleic acids in the invention may be counted using methods known in
the art. In one
embodiment, NanoString's n Counter system may be used. Geiss et al. 2008 Nat
Biotech 26(3)
317-325; U.S. Pat. No. 7,473,767 (Dimitrov). Alternatively, Fluidigm's Dynamic
Array system
may be used. Byrne et al. 2009 PLoS ONE 4 e7118; Helzer et al. 2009 Can Res 69
7860-7866.
For reviews, see also Zhao et al. 2011 Sci China Chem 54(8) 1185-1201 and
Ozsolak and Milos
2011 Nat Rev Genet 1287-98.
[0066] The invention encompasses any method known in the art for enhancing
the sensitivity
of the detectable signal in such assays, including, but not limited to, the
use of cyclic probe
technology (Bakkaoui et al., 1996, BioTechniques 20: 240-8, which is
incorporated herein by
reference in its entirety); and the use of branched probes (Urdea et al.,
1993, Clin. Chem. 39, 725-
6; which is incorporated herein by reference in its entirety). The
hybridization complexes are
detected according to well-known techniques in the art.
[0067] Reverse transcribed or amplified nucleic acids may be modified
nucleic acids.
Modified nucleic acids can include nucleotide analogs, and in certain
embodiments include a
detectable label and/or a capture agent. Examples of detectable labels
include, without limitation,
fluorophores, radioisotopes, colorimetric agents, light emitting agents,
chemiluminescent agents,
light scattering agents, enzymes and the like. Examples of capture agents
include, without
limitation, an agent from a binding pair selected from antibody/antigen,
antibody/antibody,
antibody/antibody fragment, antibody/antibody receptor, antibody/protein A or
protein G,
hapten/anti-hapten, biotin/avidin, biotin/streptavidin, folic acid/folate
binding protein, vitamin
B12/intrinsic factor, chemical reactive group/complementary chemical reactive
group (e.g.,
sulfhydryl/maleimide, sulfhydryl/haloacetyl derivative, amine/isotriocyanate,
amine/succinimidyl
ester, and amine/sulfonyl halides) pairs, and the like. Modified nucleic acids
having a capture agent
can be immobilized to a solid support in certain embodiments.
[0068] The invention described herein may be used in conjunction with other
molecular
techniques for detection of cancer such as US Pat Pub 2013/0171637 (Giafis et
al.) the contents of
which are hereby incorporated by reference in its entirety.
17
CA 03025776 2018-11-27
WO 2017/210115 PCT/US2017/034711
[0069] Statistical Methods
[0070] The data may be ranked for its ability to distinguish biomarkers in
both the 1 versus all
(i.e., disease versus normal) and the all-pairwise (i.e., normal versus
specific disease) cases. One
statistic used for the ranking is the area under the receiver operator
characteristic (ROC) curve (a
plot of sensitivity versus (1-specificity)). Although biomarkers are evaluated
for reliability across
datasets, the independent sample sets are not combined for the purposes of the
ROC ranking. As a
result, multiple independent analyses are performed and multiple independent
rankings are
obtained for each biomarker' s ability to distinguish groups of interest.
[0071] It is to be understood that other genes and/or diagnostic criteria
may be used in this
invention. For example, animal characteristics, standard blood workups, the
results of imaging
tests, and/or histological evaluation may optionally be combined with
biomarkers disclosed herein.
[0072] Such analysis methods may be used to form a predictive model, and
then use that model
to classify test data. For example, one convenient and particularly effective
method of
classification employs multivariate statistical analysis modeling, first to
form a model (a
"predictive mathematical model") using data ("modeling data") from samples of
known class (e.g.,
from subjects known to have, or not have, a particular class, subclass or
grade of lung cancer), and
second to classify an unknown sample (e.g., "test data"), according to lung
cancer status.
[0073] Pattern recognition (PR) methods have been used widely to
characterize many different
types of problems ranging for example over linguistics, fingerprinting,
chemistry and psychology.
In the context of the methods described herein, pattern recognition is the use
of multivariate
statistics, both parametric and non-parametric, to analyze spectroscopic data,
and hence to classify
samples and to predict the value of some dependent variable based on a range
of observed
measurements. There are two main approaches. One set of methods is termed
"unsupervised" and
these simply reduce data complexity in a rational way and also produce display
plots that can be
interpreted by the human eye. The other approach is termed "supervised"
whereby a training set
of samples with known class or outcome is used to produce a mathematical model
and is then
evaluated with independent validation data sets.
[0074] Unsupervised PR methods are used to analyze data without reference
to any other
independent knowledge. Examples of unsupervised pattern recognition methods
include principal
component analysis (PCA), hierarchical cluster analysis (HCA), and non-linear
mapping (NLM).
18
CA 03025776 2018-11-27
WO 2017/210115 PCT/US2017/034711
[0075] Alternatively, and in order to develop automatic classification
methods, it has proved
efficient to use a "supervised" approach to data analysis. Here, a "training
set" of biomarker
expression data is used to construct a statistical model that predicts
correctly the "class" of each
sample. This training set is then tested with independent data (referred to as
a test or validation
set) to determine the robustness of the computer-based model. These models are
sometimes termed
"expert systems," but may be based on a range of different mathematical
procedures. Supervised
methods can use a data set with reduced dimensionality (for example, the first
few principal
components), but typically use unreduced data, with all dimensionality. In all
cases the methods
allow the quantitative description of the multivariate boundaries that
characterize and separate
each class, for example, each class of lung cancer in terms of its biomarker
expression profile. It
is also possible to obtain confidence limits on any predictions, for example,
a level of probability
to be placed on the goodness of fit (see, for example, Sharaf; Illman;
Kowalski, eds. (1986).
Chemometrics. New York: Wiley). The robustness of the predictive models can
also be checked
using cross-validation, by leaving out selected samples from the analysis.
[0076] Examples of supervised pattern recognition methods include the
following nearest
centroid methods (Dabney 2005 Bioinformatics 21(22):4148-4154 and Tibshirani
et al. 2002 Proc.
Natl. Acad. Sci. USA 99(10):6576-6572); soft independent modeling of class
analysis (SIMCA)
(see, for example, Wold, (1977) Chemometrics: theory and application 52: 243-
282.); partial least
squares analysis (PLS) (see, for example, Wold (1966) Multivariate analysis 1:
391-420; Joreskog
(1982) Causality, structure, prediction 1: 263-270); linear discriminant
analysis (LDA) (see, for
example, Nillson (1965). Learning machines. New York.); K-nearest neighbor
analysis (KNN)
(see, for example, Brown and Martin 1996 J Chem Info Computer Sci 36(3):572-
584); artificial
neural networks (ANN) (see, for example, Wasserman (1993). Advanced methods in
neural
computing. John Wiley & Sons, Inc; O'Hare & Jennings (Eds.). (1996).
Foundations of distributed
artificial intelligence (Vol. 9). Wiley); probabilistic neural networks (PNNs)
(see, for example,
Bishop & Nasrabadi (2006). Pattern recognition and machine learning (Vol. 1,
p. 740). New York:
Springer; Specht, (1990). Probabilistic neural networks. Neural networks,
3(1), 109-118); rule
induction (RI) (see, for example, Quinlan (1986) Machine learning, 1(1), 81-
106); and, Bayesian
methods (see, for example, Bretthorst (1990). An introduction to parameter
estimation using
Bayesian probability theory. In Maximum entropy and Bayesian methods (pp. 53-
79). Springer
Netherlands; Bretthorst, G. L. (1988). Bayesian spectrum analysis and
parameter estimation (Vol.
19
CA 03025776 2018-11-27
WO 2017/210115 PCT/US2017/034711
48). New York: Springer-Verlag); unsupervised hierarchical clustering (see for
example Herrero
2001 Bioinformatics 17(2) 126-136). In one embodiment, the classifier is the
centroid based
method described in Mullins et al. 2007 Clin Chem 53(7):1273-9, which is
herein incorporated by
reference in its entirety for its teachings regarding disease classification.
[0077] It is often useful to pre-process data, for example, by addressing
missing data,
translation, scaling, weighting, etc. Multivariate projection methods, such as
principal component
analysis (PCA) and partial least squares analysis (PLS), are so-called scaling
sensitive methods.
By using prior knowledge and experience about the type of data studied, the
quality of the data
prior to multivariate modeling can be enhanced by scaling and/or weighting.
Adequate scaling
and/or weighting can reveal important and interesting variation hidden within
the data, and
therefore make subsequent multivariate modeling more efficient. Scaling and
weighting may be
used to place the data in the correct metric, based on knowledge and
experience of the studied
system, and therefore reveal patterns already inherently present in the data.
[0078] If possible, missing data, for example gaps in column values, should
be avoided.
However, if necessary, such missing data may be replaced or "filled" with, for
example, the mean
value of a column ("mean fill"); a random value ("random fill"); or a value
based on a principal
component analysis ("principal component fill"). Each of these different
approaches will have a
different effect on subsequent PR analysis.
[0079] "Translation" of the descriptor coordinate axes can be useful.
Examples of such
translation include normalization and mean centering. "Normalization" may be
used to remove
sample-to-sample variation. Many normalization approaches are possible, and
they can often be
applied at any of several points in the analysis. "Mean centering" may be used
to simplify
interpretation. Usually, for each descriptor, the average value of that
descriptor for all samples is
subtracted. In this way, the mean of a descriptor coincides with the origin,
and all descriptors are
"centered" at zero. In "unit variance scaling," data can be scaled to equal
variance. Usually, the
value of each descriptor is scaled by 1/StDev, where StDev is the standard
deviation for that
descriptor for all samples. "Pareto scaling" is, in some sense, intermediate
between mean centering
and unit variance scaling. In pareto scaling, the value of each descriptor is
scaled by 1/sqrt(StDev),
where StDev is the standard deviation for that descriptor for all samples. In
this way, each
descriptor has a variance numerically equal to its initial standard deviation.
The pareto scaling may
be performed, for example, on raw data or mean centered data.
CA 03025776 2018-11-27
WO 2017/210115 PCT/US2017/034711
[0080] "Logarithmic scaling" may be used to assist interpretation when data
have a positive
skew and/or when data spans a large range, e.g., several orders of magnitude.
Usually, for each
descriptor, the value is replaced by the logarithm of that value. In "equal
range scaling," each
descriptor is divided by the range of that descriptor for all samples. In this
way, all descriptors
have the same range, that is, 1. However, this method is sensitive to presence
of outlier points. In
"autoscaling," each data vector is mean centered and unit variance scaled.
This technique is a very
useful because each descriptor is then weighted equally and large and small
values are treated with
equal emphasis. This can be important for analytes present at very low, but
still detectable, levels.
[0081] Several supervised methods of scaling data are also known. Some of
these can provide
a measure of the ability of a parameter (e.g., a descriptor) to discriminate
between classes, and can
be used to improve classification by stretching a separation. For example, in
"variance weighting,"
the variance weight of a single parameter (e.g., a descriptor) is calculated
as the ratio of the inter-
class variances to the sum of the intra-class variances. A large value means
that this variable is
discriminating between the classes. For example, if the samples are known to
fall into two classes
(e.g., a training set), it is possible to examine the mean and variance of
each descriptor. If a
descriptor has very different mean values and a small variance, then it will
be good at separating
the classes. "Feature weighting" is a more general description of variance
weighting, where not
only the mean and standard deviation of each descriptor is calculated, but
other well-known
weighting factors, such as the Fisher weight, are used.
[0082] The methods described herein may be implemented and/or the results
recorded using
any device capable of implementing the methods and/or recording the results.
Examples of devices
that may be used include but are not limited to electronic computational
devices, including
computers of all types. When the methods described herein are implemented
and/or recorded in a
computer, the computer program that may be used to configure the computer to
carry out the steps
of the methods may be contained in any computer readable medium capable of
containing the
computer program. Examples of computer readable medium that may be used
include but are not
limited to diskettes, CD-ROMs, DVDs, ROM, RAM, and other memory and computer
storage
devices. The computer program that may be used to configure the computer to
carry out the steps
of the methods and/or record the results may also be provided over an
electronic network, for
example, over the internet, an intranet, or other network.
21
CA 03025776 2018-11-27
WO 2017/210115 PCT/US2017/034711
[0083] The process of comparing a measured value and a reference value can
be carried out in
any convenient manner appropriate to the type of measured value and reference
value for the
discriminative gene at issue. "Measuring" can be performed using quantitative
or qualitative
measurement techniques, and the mode of comparing a measured value and a
reference value can
vary depending on the measurement technology employed. For example, when a
qualitative
colorimetric assay is used to measure expression levels, the levels may be
compared by visually
comparing the intensity of the colored reaction product, or by comparing data
from densitometric
or spectrometric measurements of the colored reaction product (e.g., comparing
numerical data or
graphical data, such as bar charts, derived from the measuring device).
However, it is expected
that the measured values used in the methods of the invention will most
commonly be quantitative
values. In other examples, measured values are qualitative. As with
qualitative measurements, the
comparison can be made by inspecting the numerical data, or by inspecting
representations of the
data (e.g., inspecting graphical representations such as bar or line graphs).
[0084] The process of comparing may be manual (such as visual inspection by
the practitioner
of the method) or it may be automated. For example, an assay device (such as a
luminometer for
measuring chemiluminescent signals) may include circuitry and software
enabling it to compare a
measured value with a reference value for a biomarker protein. Alternately, a
separate device (e.g.,
a digital computer) may be used to compare the measured value(s) and the
reference value(s).
Automated devices for comparison may include stored reference values for the
biomarker
protein(s) being measured, or they may compare the measured value(s) with
reference values that
are derived from contemporaneously measured reference samples (e.g., samples
from control
subjects).
[0085] As will be apparent to those of skill in the art, when replicate
measurements are taken,
the measured value that is compared with the reference value is a value that
takes into account the
replicate measurements. The replicate measurements may be taken into account
by using either
the mean or median of the measured values as the "measured value."
[0086] The invention also includes methods of identifying animals for
particular treatments or
selecting animals for which a particular treatment would be desirable or
contraindicated.
[0087] The methods above may be performed by a reference laboratory, a
veterinary hospital
pathology laboratory, a university veterinary laboratory, a veterinarian's
office or a veterinarian.
The methods above may further comprise an algorithm and/or statistical
analysis.
22
CA 03025776 2018-11-27
WO 2017/210115 PCT/US2017/034711
[0088] Samples
[0089] The sample may be a biopsy specimen of the suspected mass. For
detection of the copy
number status by FISH, cells from the mass are used to provide templates for
the FISH probes.
For PCR and DNA sequence based assays, the required template DNA may be
obtained from the
cells of the suspected mass.
[0090] Compositions and Kits
[0091] The invention provides compositions and kits for detecting a mast
cell tumor in a dog
comprising: (a) at least one reagent selected from the group consisting of: a
nucleic acid probe
capable of specifically detecting target regions of CFA 5, CFA 20 or CFA 31;
and (b) instructions
for use in measuring a copy number of these region of CFA 5, CFA 20 or CFA 31
in a biological
sample from a dog wherein if the copy number status of the regions of CFA 5,
CFA 20 and/or
CFA 31 differ from that of a normal control.
[0092] The instructions comprise determining in a sample of relevant cells
obtained from the
dog the presence of chromosomal abnormalities, wherein the presence of
chromosomal
abnormalities involving at least two of the probes indicates that the patient
has mast cell tumor.
Such kits may further comprise, or consist of, blocking agents or other
probes, various labels or
labeling agents to facilitate detection of the probes, reagents for
hybridization (e.g., buffers), a
metaphase spread, and the like.
[0093] The following Examples further illustrate the disclosure and are not
intended to limit
the scope. In particular, it is to be understood that this disclosure is not
limited to particular
embodiments described, as such may, of course, vary. It is also to be
understood that the
terminology used herein is for the purpose of describing particular
embodiments only, and is not
intended to be limiting, since the scope of the present disclosure will be
limited only by the
appended claims.
6. EXAMPLES
[0094] Materials and Methods
[0095] Tissue specimens
[0096] The retrospective cohort study recruited 147 formalin fixed paraffin
embedded (FFPE)
tissue specimens of canine cutaneous MCTs that had been diagnosed between 2003
and 2012.
Initial diagnosis for each case was based on histological evaluation of the
FFPE specimen by a
23
CA 03025776 2018-11-27
WO 2017/210115 PCT/US2017/034711
veterinary pathologist. To eliminate inter-observer variation in tumor
grading, the H&E slides
were re-evaluated for 3-tier and 2-tier tumor grading and mitotic index by a
single board-certified
veterinary pathologist. H&E-stained slides of each specimen were assessed used
to identify and
mark regions enriched for neoplastic regions, excluding any surrounding normal
tissues. A series
of 25-i.tm slices was then obtained from the corresponding FFPE tissue block,
and regions of non-
tumor tissues removed by macrodissection. Tumor DNA was isolated using a
QIAamp FFPE DNA
extraction kit (Qiagen, Valencia, CA, USA). Spectrophotometry (NanoDrop,
Thermo Scientific,
Wilmington, DE) and agarose gel electrophoresis were used to determine DNA
quantity and
integrity. Sample information is shown in Table 1.
[0097] KIT gene mutation analysis
[0098] Activating KIT gene mutations are reported to be present in 10-30%
of canine MCTs,
with presence of a mutation being correlated with poor clinical outcomes (Gil
da Costa, 2015).
PCR amplification for exons 8, 9, and 11 of the canine KIT gene was performed
using Taq RED
Master Mix Kit (Genesee Scientific, San Diego, CA, USA). Primers were designed
using primer-
BLAST software (www.ncbi.nlm.nih.gov/tools/primer-blast/) and are shown in
Table 2. The
presence of internal tandem repeat (ITD) mutation in exons 8 and 11 was
visualized using agarose
gel electrophoresis. When an ITD mutant band was present in the PCR products
of exons 8 or 11,
the band was excised and purified using QIAquick Gel Extraction Kit (QIAGEN),
followed by
DNA (Sanger) sequencing analysis. PCR products without evidence of ITD
mutations were
subjected to direct sequencing to detect other sequence changes of minor
frequencies. All
sequencing was performed at the North Carolina State University Genome
Research Laboratory
(research.ncsu.edu/gs1/). The sequencing data were analyzed using 4peaks
software
(nucleobyte.com) and were compared with the canine KIT gene reference sequence
(GeneID:
AY313776).
[0099] Array comparative genomic hybridization
[00100] oaCGH analysis was performed on DNA samples from 109 primary tumors
using
Agilent SurePrint G3 Canine Genome 180K microarrays which contain 171,534
coding and
noncoding 60-mer oligonucleotide sequences spaced at ¨13 kb intervals (AMADID
25522,
Agilent Technologies, Santa Clara, CA, USA). A sex-matched equimolar pool of
genomic DNA
from peripheral blood of > 100 healthy dogs was used as a common reference.
Probe preparation,
array hybridization, and post-hybridization washing were performed as reported
previously
24
CA 03025776 2018-11-27
WO 2017/210115 PCT/US2017/034711
(Thomas et al., 2014, Poorman et al., 2015, Roode et al., 2015, Shapiro et
al., 2015). Scanned data
were extracted using Feature Extraction Software v10.10 (Agilent Technologies)
and assessed for
data quality using Agilent QC metrics. Extracted data were filtered to exclude
probes displaying
non-uniform hybridization or signal saturation and imported into Nexus Copy
Number software
v7.5 (Biodiscovery Inc., El Sequendo, CA, USA). Data was normalized using the
FASST2
segmentation algorithm. Genomic copy number aberrations were defined as a
minimum of three
consecutive probes with 1og2 tumor: reference values > 0.201 (gain) or <
¨0.234 (loss). CNAs
were defined as recurrent when CNAs were present in >20% of cases. The
megabase (Mb) location
of dog genes along the corresponding chromosome were based on the CanFam v3
genome
sequence assembly accessed via the UCSC genome browser (genome.ucsc.edu/).
[00101] The Genomic Identification of Significant Targets in Cancer (GISTIC)
algorithm was
used to identify regions across the genome in tumors with and without KIT
mutations with a
statistically high frequency of aberration over the background (Q-bound <
0.05, G score > 1.0),
indicating that these regions are more likely to contain a functional mutation
associated with
driving cancer pathogenesis (Beroukhim et al., 2007). Chromosomal regions were
identified have
having significantly different aberration frequencies between two groups when
they had > 50%
difference between two groups also had a P < 0.05 and Q-bound <0.05 based on a
two-tailed
Fisher's exact test.
[00102] Digital PCR analysis
[00103] Four ddPCR assays, each comprising two PCR primers and a TaqMan
probe, were
designed within the genome sequences of high penetrance of copy number change
at each of CFA
5:37 Mb, CFA 20:31 Mb, CFA 20:46 Mb and CFA 31:16 Mb. Primers and TaqMan
probes were
designed using PrimerQuest (www.idtdna.com) and
Prime-BLAST
(www.ncbi.nlm.nih.gov/tools/primer-blast/) software. For each assay, a double-
Quenched probe
(Integrated DNA Technologies, Coralville, IA) was used to reduce background
fluorescence (5'-
FAM/ZEN/3'-IBFQ probe for CFA 20:46 Mb and CFA 31: 16 Mb assays and HEX/ZEN/3'-
IBFQ
probe for CFA 5: 37 Mb and CFA 20: 31 Mb assays). Sequences and locations of
primers and
probes used in this study are shown in Table 2.
[00104] Two duplex ddPCR reactions were performed using a combination of CFA
20:46 Mb
and CFA 20: 31Mb (CFA 2046Mb/31Mb assay), and CFA 31:16 Mb and CFA 5: 37Mb
(CFA 31/CFA
assay). Each reaction mixture comprised 1 x Droplet Supermix (Bio-Rad), 500 nM
of each
CA 03025776 2018-11-27
WO 2017/210115 PCT/US2017/034711
primer, 250 nM of FAM- and HEX-labeled probes and ¨55 ng of genomic DNA. The
PCR reaction
mixtures were partitioned into an emulsion of ¨20,000 droplets (mean SD:
17,572 2,153
droplets/reaction) using a QX200TM Droplet Generator (Bio-Rad Laboratories,
Richmond, CA).
PCR was performed on T100Tm Thermal Cycler (Bio-Rad) using thermal cycle
condition as
follows: denaturation at 95 C for 10 min; 40 cycles of 94 C for 30 sec and 58
C for 60 sec; 98 C
for 10 min. Post PCR, droplets were analyzed on QX200TM Droplet Reader (Bio-
Rad). The ratios
of CFA 20: 46Mb and CFA 20:31 Mb (CFA 2046MbR1Mb ratio) and CFA 31:16 Mb and
CFA 5: 37
Mb (CFA 31/CFA 5 ratio) were calculated on the Poisson distribution using
QuantasoftTM software
V1.7.4 (Bio-Rad). Comparison of copy number ratios determined by ddPCR and
aCGH was
performed as previously described (Mochizuki et al., 2015). To consolidate
these two ratios into
one parameter, score of CNAs associated with high-risk MCTs (CNAmcr score) was
calculated
and assessed to predict tumors with high-risk phenotypes using the following
equation:
[00105] CNAmcT score = CFA 2046Mb/31Mb ratio x CFA 31/CFA 5 ratio
[00106] Statistical analysis
[00107] Association analysis was performed with Fisher's exact test or
Pearson's chi-squared
test to evaluate difference in frequencies between groups, and with Wilcoxon
rank-sum test to
compare continuous values between groups. The correlation of two values was
evaluated with
Pearson's correlation coefficient analysis. To determine the suitable
threshold for discriminating
high-risk MCTs from low-risk MCTs, a receiver operating characteristic (ROC)
curve analysis
was performed. Statistical analyses were performed using JMP software v11 (SAS
Institute, Cary,
NC). Significance was set at P <0.05.
[00108] Results
[00109] Pathological findings
[00110] A total of 147 canine MCTs were included in the present study. Of
these, genome-wide
DNA copy number profiles were obtained for 109 tumors by oaCGH (oaCGH cohort).
The
remaining 38 tumors served as a validation cohort for ddPCR analysis. Tumors
were graded by 3-
tier histological grading (Grade 1: 18 tumors, Grade 2: 93 tumors and Grade 3:
36 tumors) and by
2-tier histological grading (low grade: 87 tumors and high grade: 60 tumors).
There was no
significant difference in histological grading between the oaCGH and
validation cohorts.
[00111]
[00112] Canine MCT show stepwise accumulation of CNAs as histological grade
increases
26
CA 03025776 2018-11-27
WO 2017/210115 PCT/US2017/034711
[00113] The oaCGH analysis of DNA isolated from 109 canine MCT tumor specimens
revealed
that all MCT cases showed various numbers (16-575, median: 107) of CNAs
throughout the
genome. Whole chromosome and subchromosomal CNAs were detected in canine MCTs
(CNA
size: <26 kilobases (kb) to 117 megabases (Mb), median: 359 kb).
Representative genome-wide
DNA copy number profiles are shown in Fig. 1. Segregation of oaCGH data by 3-
tier and 2-tier
histological grading schemes revealed that higher-grade tumors had
significantly more CNAs than
low- or intermediate-grade counterparts in both numbers and altered length
(Fig. 2). Penetrance
plots demonstrated increased frequency of CNAs in a stepwise manner, as tumor
histological grade
increases (Fig. 3).
[00114] KIT gene mutation status and its association with CNAs in canine MCTs
[00115] A KIT gene mutation was detected in 42 of 147 (29%) tumors, with
increased frequency
in high-grade tumors (in 3-tier grading system, 6%, 23% and 56% in grades 1, 2
and 3 tumors,
respectively, P < 0.0001; in 2-tier grading system, 13% and 52% in low-grade
and high-grade
tumors, respectively, P < 0.0001). The six most common mutations detected were
1) an ITD
mutation in exon 11, with or without involvement of intron 11 and exon 12
(hereafter called as
exon 11 ITD mutations), accounting for 74% (31/42) of all KIT mutations,
followed by 2) Exon
11 indel (9.5%), 3) Exon 8 ITD (4.8%), 4) Exon 9 S479I (4.8%), 5) Exon 9 N5081
(4.8%), and 6)
Exon 8 Q430R (2.4%) mutations. Frequencies of the KIT mutation were not
different in the aCGH
and validation cohorts.
[00116] Segregation of oaCGH data by KIT mutational status demonstrated
that tumors with
KIT mutations exhibited significantly more CNAs, both in number and total
length, than wild type
(Fig. 4A). Genomic imbalance in 76 tumors with wild-type KIT gene (wt-KIT
tumors) was limited
to primarily small aberrations of low frequencies (Fig. 4B). The only
recurrent CNAs > 1 Mb were
deletion of a mid-segment of CFA 20 (at 15-43 Mb) and/or gain of the distal
portion of CFA 20
(at 45-50 Mb), detected in ¨25% of wt-KIT tumors. Frequency of these CNAs
significantly
increased as histological grade increases, suggesting a possible association
of this genomic
aberration on CFA 20 with a malignant phenotype in wt-KIT tumors (Fig. 8).
[00117] Recurrent CNAs in KIT mutant tumors (mut-KIT tumors) include whole
chromosome
gain of CFA 4, 13, 31, 36 and 38 and loss of CFA 5, 16 and 28 as well as many
subchromosomal
changes (Fig. 4B). When mut-KIT tumors were further segregated by tumors with
exon 11 ITD
mutations (n = 24) and those with other types of mutation (n = 9), there was
no significant
27
CA 03025776 2018-11-27
WO 2017/210115 PCT/US2017/034711
difference in number, total length, and frequency of CNAs between two groups,
resulting in similar
penetrance plots (Fig. 9). Unlike wt-KIT tumors, further segregation of mut-
KIT tumors by their
histological grading did not show any CNAs that differed statistically in
frequency between
groups, partly due to their small sample sizes (Fig. 10). Therefore, mut-KIT
tumors were treated
as a single entity for further analysis, regardless of specific mutation type
and histological grade.
[00118] Comparison analysis of CNAs detected in wt-KIT and mut-KIT tumors
identified that
deletion of CFA 5, including TP53 (CFA 5: 32.5 Mb, 2.6% vs 60.6%) and gain of
CFA 31,
including RUNX1 (CFA31: 30.3 Mb, 6.6% vs 63.6%), and a small number of
subchromosomal
regions on CFA36, occurred significantly more frequently in mut-KIT tumors,
whereas there was
no region occurring more frequently in wt-KIT tumors (Table 3).
[00119] These CNAs were further interrogated using GISTIC analysis to
differentiate CNAs
containing possible pathogenic genes from background random CNAs. GISTIC
analysis identified
131 CNAs (72 gain and 59 loss) in wt-KIT tumors, including gain of regions
containing TERT
(CFA34: 11.3 Mb, G-score = 10.20, Q-bound = 3.28 x 10⁻¹⁰) and CDK4 (CFA10: 1.8
Mb, G-score
= 7.18, Q-bound = 2.89 x 10⁻⁶). In mut-KIT tumors, GISTIC analysis identified
62 discrete CNAs
(23 gain and 39 loss) including a copy number gain of CFA13: 47.0 Mb that
flanks the KIT
oncogene (CFA13: 47.1 Mb, G-score = 7.64, Q-bound = 2.01 x 10⁻⁵), as well as
gains of other
oncogenes such as RUNX1 (CFA31: 30.3 Mb, G-score = 13.43, Q-bound = 4.29 x 10-
15) and
MDM4 (CFA38: 1.0 Mb, G-score = 6.60, Q-bound = 4.64 x 10⁻⁴). Details of CNAs
identified by
GISTIC analysis are provided in Tables 4 and 5 for wt-KIT tumors and mut-KIT
tumors,
respectively.
[00120] CNAs associated with high-risk MCTs
[00121] From these data, we hypothesized that several CNAs may be used to
segregate
biologically aggressive MCTs from benign tumors. Due to the unavailability of
clinical outcomes
of the cohort, we used histological grading score and KIT mutational status to
define "high-risk
MCTs". As the 2-tier histological grading has been demonstrated to be superior
in predicting
clinical outcomes with higher inter-observer consistency (Kiupel et al., 2011,
Takeuchi et al., 2013,
Sabattini et al., 2015), we only used the 2-tier grading system (low or high
grade) hereafter. We
defined tumors with high histological grade and/or KIT mutations as "high-risk
MCT" and those
with low histological grade without KIT mutations as "low-risk MCTs", based on
the 2-tier
histological grade and KIT mutational status. As mut-KIT tumors and high-grade
wt-KIT tumors
28
CA 03025776 2018-11-27
WO 2017/210115 PCT/US2017/034711
showed dissimilar copy number profiles, we sought regions where frequencies of
CNAs are
significantly higher in (1) mut-KIT tumors and (2) high-grade wt-KIT tumors,
compared to low-
grade wt-KIT tumors, to find genomic aberrations to separate high-risk and low-
risk MCTs.
[00122] Comparison analysis revealed that genomic loss of CFA 5 and genomic
gain of CFA
31 with a few subchromosomal CNAs occurred at significantly higher frequencies
in mut-KIT
tumors, compared to low-grade wt-KIT tumors (Fig. 6A). The comparison of high-
grade and low-
grade wt-KIT tumors revealed that only loss of middle portion of CFA 20 and
gain of distal portion
of CFA 20 were significantly different between two groups (Fig. 6B). Based on
these findings, we
then chose loss of CFA 5: 37.8 Mb and gain of CFA 31: 16.7 Mb as markers to
differentiate mut-
KIT tumors from low-risk MCTs and loss of CFA 20: 31.6 Mb and gain of CFA20:
46.4 Mb as
markers to separate high-grade wt-KIT tumors from low-risk MCTs. Each case was
then evaluated
to have these alterations to predict high-risk MCTs. The presence of at least
one of these four
CNAs was able to predict high-risk MCTs with sensitivity of 91% and
specificity of 89% in the
cohort.
[00123] Digital PCR analysis
[00124] Based on the aCGH data, two duplex ddPCR assays were designed to
detect four CNAs
associated with high-risk tumor phenotypes by calculating CFA 2046Mb/31Mb
ratio and CFA 31/CFA
ratio. The performance of the ddPCR assays was evaluated by comparing copy
number ratios
derived from oaCGH and ddPCR analyses. The results of two platforms were well
correlated in
109 tumors with oaCGH profiles (R2 = 0.93 for CFA 2046Mb/31Mb ratio and 0.78
for CFA 31/CFA
5 ratio, Fig. 7). High-risk tumors showed significant increase in the CNA1`4cT
score as well as the
CFA 2046Mb/31Mb and CFA 31/CFA 5 ratios (all, P < 0.0001, Fig. 7). ROC curve
analysis was
performed to evaluate CNA1`4cT score as an indicator for high-risk MCTs. The
area under the ROC
curve was 0.89. A cut-off CNA1`4cT score of 1.27 was determined at a point
where the sum of
sensitivity and specificity values was highest. At this cut-off point, the
sensitivity and specificity
of high-risk MCT detection in the oaCGH cohort were 76% (42/55) and 96%
(52/54), respectively.
[00125] The CNA1`4cT score was then evaluated in a validation cohort
consisting of 38 MCTs.
The CNA1`4cT score showed significant increase in high-grade tumors (P =
0.007, SUPPLEMENT
Fig. 4) and was able to predict high-risk tumor phenotype with the sensitivity
of 69% (11/16) and
specificity of 86% (19/22) at the cut-off value of 1.27. Since there was no
statistical difference in
sensitivity and specificity between the oaCGH cohort and validation cohorts,
these two cohorts
29
CA 03025776 2018-11-27
WO 2017/210115 PCT/US2017/034711
were combined. Overall sensitivity and specificity of the CNA1`4cT score in
147 MCTs for the
prediction of high-risk tumors were 75% and 93%, respectively. Four of five
low-risk MCTs
misclassified by the CNA1`4cT score were Patnaik's grade 2 tumors with mitotic
index of 2-4, while
remaining one was grade 1 tumor with mitotic index of 0. By evaluating a DNA
samples from a
canine MCT for the presence of a KIT exon 11 IDT and for the CNA1`4cT score,
the combined
sensitivity and specificity to predict a high-risk tumor phenotype is 89% and
93%, respectively.
[00126] Discussion
[00127] In this study, genome-wide DNA copy number analysis of 109 canine MCTs
revealed
the heterogeneous nature of genomic alteration in canine MCTs. Comparison of
copy number
profiles of tumors of different histological grades demonstrated a stepwise
accumulation of copy
number alterations as histological grade increases, suggesting that these
genomic alterations
contribute to the aggressive biological behavior.
[00128] The KIT signaling pathway plays a critical role in the survival and
proliferation of mast
cells (Roskoski, 2005). Activating mutations of the KIT gene results in
constitutive activation of
KIT protein without ligand binding, resulting in neoplastic transformation of
mast cells. Indeed,
more than 80% of human mast cell neoplasms harbor the KIT gene mutations
(Haenisch et al.,
2012), whereas the mutation is less frequent (20-30%) in canine MCTs (Letard
et al., 2008,
Takeuchi et al., 2013). In this study, distinct copy number profiles between
MCTs with and without
KIT mutations were demonstrated with extensive CNAs affecting multiple
chromosomes in mut-
KIT tumors. GISTIC analysis identified a significant peak of gain at KIT locus
on CFA 13 as a
potential region associated with driving cancer pathogenesis in mut-KIT MCTs.
Although whole
chromosomal gain of CFA 13 is the most common recurrent chromosomal
abnormality across
canine cancers (Thomas et al., 2009, Angstadt et al., 2011, Hedan et al.,
2011, Thomas et al., 2011,
Thomas et al., 2014, Poorman et al., 2015, Roode et al., 2015, Shapiro et al.,
2015), the GISTIC
analysis successfully identified the KIT locus in mut-KIT tumors by taking
into account both
frequency and magnitude of copy number change, proving the utility of this
analysis to identify
pathogenic region and potential somatic mutations in cancer (Beroukhim et al.,
2007).
[00129] Loss of CFA 5 occurred in >50% of mut-KIT MCTs, but is a genomic
alteration
uncommon in other canine cancers. Among many tumor suppressor genes located on
CFA 5, loss
of TP53 may represent a key genetic event in the development and progression
of mut-K/T MCTs.
In addition to loss of TP53 detected in 57.6% of mut-KIT tumors, GISTIC
analysis identified a
CA 03025776 2018-11-27
WO 2017/210115 PCT/US2017/034711
significant peak of gain on CFA 38 encompassing MDM4, which is a family member
of MDM2
and serves as a negative regulator of tumor suppressor p53. Frequent gains of
MDM4 (48.5%) and
MDM2 (9.1%), coupled with frequent loss of TP53, highlights that disruption of
the p53 pathway
may be a key molecular alteration in mut-KIT MCTs as 75.8% of this subtype
harbored one or
more these CNAs, while these CNAs were present in only 6.6% of wt-KIT tumors.
[00130] Similar to these CNAs that could lead to the p53 pathway deregulation,
CNAs
involving genes of the RB pathway, another major tumor suppressor pathway
regulating cell cycle
and replication, were also common in mut-KIT tumors. These CNAs include loss
of CDKN2A/p16
(CFA 11: 41.2 Mb, 21.2% of mut-KIT tumors), loss of RB] (CFA 22: 3.1 Mb,
18.2%), gain of
CDK4 (CFA 10: 1.8 Mb, 15.2%), and gain of CDK6 (CFA 14: 18.3 Mb, 24.2%),
leading to
deregulation of the RB pathway in 48.5% of mut-KIT MCTs, whereas only 23.7% of
wt-KIT
tumors presented with these CNAs. A previous study also identified altered
expressions of genes
involved in the cell cycle and the p53 pathway in undifferentiated MCTs
(Giantin et al., 2014),
suggesting that frequent CNAs involved in these two major tumor suppressor
pathways may
change expression levels of these genes and result in the aggressive
biological behavior of mut-
KIT MCTs.
[00131] Compared to mut-KIT tumors, copy number changes of wt-KIT tumors were
very
limited, with the only recurrent chromosomal alterations > 1 Mb being a ¨30 Mb
loss of CFA
20:15-43 Mb and a ¨5 Mb gain of CFA 20: 45-50 Mb. Gain of the distal portion
of CFA 20 has
been detected previously in canine osteosarcoma, hemangiosarcoma, benign
melanocytoma and
acute leukemias (Angstadt et al., 2011, Thomas et al., 2014, Poorman et al.,
2015, Roode et al.,
2015), loss of mid-region of CFA 20 is uncommon in canine cancers, suggesting
that this genomic
alteration may play an important role in the development of MCTs in a KIT-
independent manner.
[00132] Interestingly, a recent genome-wide association studies in golden
retrievers identified
SNPs located at CFA 20: 31Mb-50Mb (CanFam v3) that are associated with
increased risk of
developing MCTs (Arendt et al., 2015). A SNP in the GNAI2 gene (CFA20:
39,080,161), which
introduce an alternative splice of this gene resulting in a truncated protein,
shows a strong
association with development of MCTs, along with other SNPs in this region
encompassing
hyaluronidase genes. These SNPs should be further examined to determine any
associated with
the development of MCTs and also with progression to a malignant tumor
phenotype in the general
dog population.
31
CA 03025776 2018-11-27
WO 2017/210115 PCT/US2017/034711
[00133] Along with mid-region of CFA 20, GISTIC analysis also identified
significance of copy
number gains of TERT (CFA34: 11.3 Mb, 36.8% of wt-KIT tumors) and CDK4 (CFA10:
1.8 Mb,
23.7%) in wt-KIT tumors. It is of note that frequencies of these CNAs
increased in tumors of higher
grade suggesting their potential roles in the tumor progression. This is of
particular interest for
discovery of therapeutic molecular targets for wt-KIT tumors, since KIT-target
therapy is less
effective in dogs with MCTs without KIT gene mutations compared to mut-KIT
tumors (London
et al., 2009, Hahn et al., 2010). Further studies will elucidate the molecular
abnormalities crucial
for the progression from benign MCTs to malignant tumors in a KIT-independent
manner.
[00134] A major challenge in the clinical management of canine MCTs lies in
accurate
prognostication. The application of molecular profiling analysis may provide
an objective means
to predict clinical outcomes of this cancer. Molecular profiling using gene
expression analysis has
been shown to separate differentiated and undifferentiated MCTs and predict
clinical outcomes by
quantifying expression of 13 genes (Giantin et al., 2014). In this study, we
were able to predict
high-risk MCTs with a sensitivity of 91% and a specificity of 89% using just
four CNAs on a
genome-wide oaCGH platform. To reduce the cost and processing time, we
developed a simple
ddPCR assay to detect these four CNAs. The ddPCR test was able to predict high-
risk tumor
phenotypes with sensitivity of 75% and specificity of 93%, indicating its
potential use for risk
stratification of canine MCTs. Whereas specificity was comparable between the
two platforms,
the oaCGH showed superior sensitivity in detecting these CNAs. This is partly
because the
specimen used in this study was degraded FFPE tissue-derived DNA, which
results in generation
of single-stranded DNA and artificial copy number alterations (Bhat et al.,
2010, Bhat et al., 2011).
Although two platforms showed a good correlation in copy number assessment, it
is pertinent that
DNA degradation may lead to false-negative results in the ddPCR. Another
possible advantage of
genome-wide oaCGH is the simultaneous detection of less frequent CNAs in
addition to the four
CNAs examined by the ddPCR, which may help refine the detection algorithm.
Although the
ddPCR is a fast, cost-effective way of detecting high-risk tumor-associated
CNAs, refinement of
the assay may be necessary to improve sensitivity.
[00135] One major limitation of this study was lack of the clinical outcome of
the cases, limiting
the analysis of clinical relevance of these molecular alterations. Future
studies using clinical
specimens (e.g., cytological slides) in a cohort of dogs with MCTs, where
clinical outcomes,
32
CA 03025776 2018-11-27
WO 2017/210115 PCT/US2017/034711
including treatment and survival time are available, are necessary to evaluate
the value of these
CNAs as a prognostic indicator in a clinical setting.
[00136] In Table 6, the copy number variations (CNV) described herein were
used to
differentiate high-risk MCTs (Mut-KIT tumors and high-grade tumors) and low-
risk MCTs (wild-
type KIT, low-grade tumors) with the sensitivity of 91% and specificity of
89%.
[00137] In summary, we characterized CNAs of canine MCTs and identified
different genomic
imbalances between tumors of different histological grades and those of
different KIT mutation
status. Additional investigation will aid further clarification regarding
genes within copy number
aberrant regions that are important in the development and progression of
canine MCTs. Four
CNAs identified in this study may serve as an objective, rapid molecular assay
for the identification
of aggressive MCTs.
7. REFERENCES
[00138] ANGSTADT, A. Y., MOTSINGER-REIF, A., THOMAS, R., KISSEBERTH, W. C.,
GUILLERMO COUTO, C., DUVAL, D. L., NIELSEN, D. M., MODIANO, J. F. & BREEN, M.
2011.
Characterization of canine osteosarcoma by array comparative genomic
hybridization and RT-qPCR:
signatures of genomic imbalance in canine osteosarcoma parallel the human
counterpart. Genes
Chromosomes Cancer, 50, 859-74.
[00139] ARENDT, M. L., MELIN, M., TONOMURA, N., KOLTOOKIAN, M., COURTAY-CAHEN,
C., FLINDALL, N., BASS, J., BOERKAMP, K., MEGQUIR, K., YOUELL, L., MURPHY, S.,
MCCARTHY, C., LONDON, C., RUTTEMAN, G. R., STARKEY, M. & LINDBLAD-TOH, K.
2015.
Genome-Wide Association Study of Golden Retrievers Identifies Germ-Line Risk
Factors Predisposing to
Mast Cell Tumours. PLoS Genet, 11, e1005647.
[00140] BEROUKHIM, et al. 2007. Assessing the significance of chromosomal
aberrations in cancer:
methodology and application to glioma. Proc Natl Acad Sci US A, 104, 20007-12.
[00141] BHAT, S., CURACH, N., MOSTYN, T., BAINS, G. S., GRIFFITHS, K. R. &
EMSLIE, K. R.
2010. Comparison of methods for accurate quantification of DNA mass
concentration with traceability to
the international system of units. Analytical chemistry, 82, 7185-7192.
[00142] BHAT, S., MCLAUGHLIN, J. L. & EMSLIE, K. R. 2011. Effect of sustained
elevated
temperature prior to amplification on template copy number estimation using
digital polymerase chain
reaction. Analyst, 136, 724-732.
33
CA 03025776 2018-11-27
WO 2017/210115 PCT/US2017/034711
[00143] BREEN, M. 2009. Update on genomics in veterinary oncology. Top
Companion Anim Med,
24, 113-21.
[00144] FINNIE, J. W. & BOSTOCK, D. E. 1979. Skin neoplasia in dogs. Aust Vet
J, 55, 602-4.
[00145] FROHLING, S. & DOHNER, H. 2008. Chromosomal abnormalities in cancer. N
Engl J Med,
359, 722-34.
[00146] GIANTIN, M., GRANATO, A., BARATTO, C., MARCONATO, L., VASCELLARI, M.,
MORELLO, E. M., VERCELLI, A., MUTINELLI, F. & DACASTO, M. 2014. Global gene
expression
analysis of canine cutaneous mast cell tumor: could molecular profiling be
useful for subtype classification
and prognostication? PLUS One, 9, e95481.
[00147] GIL DA COSTA, R. M. 2015. C-kit as a prognostic and therapeutic marker
in canine cutaneous
mast cell tumours: From laboratory to clinic. Vet J, 205, 5-10.
[00148] HAENISCH, B., NOTHEN, M. M. & MOLDERINGS, G. J. 2012. Systemic mast
cell
activation disease: the role of molecular genetic alterations in pathogenesis,
heritability and diagnostics.
Immunology, 137, 197-205.
[00149] HAHN, K. A., LEGENDRE, A. M., SHAW, N. G., PHILLIPS, B., OGILVIE, G.
K.,
PRESCOTT, D. M., ATWATER, S. W., CARRERAS, J. K., LANA, S. E., LADUE, T.,
RUSK, A., KINET,
J. P., DUBREUIL, P., MOUSSY, A. & HERMINE, 0. 2010. Evaluation of 12- and 24-
month survival rates
after treatment with masitinib in dogs with nonresectable mast cell tumors. Am
J Vet Res, 71, 1354-61.
[00150] HANAHAN, D. & WEINBERG, R. A. 2011. Hallmarks of cancer: the next
generation. Cell,
144, 646-74.
[00151] HEDAN, B., THOMAS, R., MOTSINGER-REIF, A., ABADIE, J., ANDRE, C.,
CULLEN, J.
& BREEN, M. 2011. Molecular cytogenetic characterization of canine histiocytic
sarcoma: A spontaneous
model for human histiocytic cancer identifies deletion of tumor suppressor
genes and highlights influence
of genetic background on tumor behavior. BMC Cancer, 11, 201.
[00152] KIUPEL, M., WEBSTER, J. D., BAILEY, K. L., BEST, S., DELAY, J.,
DETRISAC, C. J.,
FITZGERALD, S. D., GAMBLE, D., GINN, P. E., GOLDSCHMIDT, M. H., HENDRICK, M.
J.,
HOWERTH, E. W., JANOVITZ, E. B., LANGOHR, I., LENZ, S. D., LIPSCOMB, T. P.,
MILLER, M. A.,
MISDORP, W., MOROFF, S., MULLANEY, T. P., NEYENS, I., O'TOOLE, D., RAMOS-VARA,
J.,
SCASE, T. J., SCHULMAN, F. Y., SLEDGE, D., SMEDLEY, R. C., SMITH, K., P, W.
S., SOUTHORN,
E., STEDMAN, N. L., STEFICEK, B. A., STROMBERG, P. C., VALLI, V. E.,
WEISBRODE, S. E.,
YAGER, J., HELLER, J. & MILLER, R. 2011. Proposal of a 2-tier histologic
grading system for canine
cutaneous mast cell tumors to more accurately predict biological behavior. Vet
Pathol, 48, 147-55.
34
CA 03025776 2018-11-27
WO 2017/210115 PCT/US2017/034711
[00153] LETARD, S., YANG, Y., HANSSENS, K., PALMERINI, F., LEVENTHAL, P. S.,
GUERY,
S., MOUSSY, A., KINET, J. P., HERMINE, 0. & DUBREUIL, P. 2008. Gain-of-
function mutations in the
extracellular domain of KIT are common in canine mast cell tumors. Mol Cancer
Res, 6, 1137-45.
[00154] LIN, T. Y., THOMAS, R., TSAI, P. C., BREEN, M. & LONDON, C. A. 2009.
Generation and
characterization of novel canine malignant mast cell line CL1. Vet Immunol
Immunopathol, 127, 114-24.
[00155] LONDON, C. A., MALPAS, P. B., WOOD-FOLLIS, S. L., BOUCHER, J. F.,
RUSK, A. W.,
ROSENBERG, M. P., HENRY, C. J., MITCHENER, K. L., KLEIN, M. K. &
HINTERMEISTER, J. G.
2009. Multi-center, placebo-controlled, double-blind, randomized study of oral
toceranib phosphate
(SU11654), a receptor tyrosine kinase inhibitor, for the treatment of dogs
with recurrent (either local or
distant) mast cell tumor following surgical excision. Clinical Cancer
Research, 15, 3856-3865.
[00156] MITELMAN, F., JOHANSSON, B. & MERTENS, F. 2007. The impact of
translocations and
gene fusions on cancer causation. Nat Rev Cancer, 7, 233-45.
[00157] MOCHIZUKI, H., SHAPIRO, S. G. & BREEN, M. 2015. Detection of Copy
Number
Imbalance in Canine Urothelial Carcinoma With Droplet Digital Polymerase Chain
Reaction. Vet Pathol.
Nov. 2015
[00158] PATNAIK, A. K., EHLER, W. J. & MACEWEN, E. G. 1984. Canine cutaneous
mast cell
tumor: morphologic grading and survival time in 83 dogs. Vet Pathol, 21, 469-
74.
[00159] POORMAN, K., BORST, L., MOROFF, S., ROY, S., LABELLE, P., MOTSINGER-
REIF, A.
& BREEN, M. 2015. Comparative cytogenetic characterization of primary canine
melanocytic lesions using
array CGH and fluorescence in situ hybridization. Chromosome Res, 23, 171-86.
[00160] ROODE, S. C., ROTROFF, D., AVERY, A. C., SUTER, S. E., BIENZLE, D.,
SCHIFFMAN,
J. D., MOTSINGER-REIF, A. & BREEN, M. 2015. Genome-wide assessment of
recurrent genomic
imbalances in canine leukemia identifies evolutionarily conserved regions for
subtype differentiation.
Chromosome Res.
[00161] ROSKOSKI, R., JR. 2005. Signaling by Kit protein-tyrosine
kinase¨the stem cell factor
receptor. Biochem Biophys Res Commun, 337, 1-13.
[00162] ROTHWELL, T. L., HOWLETT, C. R., MIDDLETON, D. J., GRIFFITHS, D. A. &
DUFF,
B. C. 1987. Skin neoplasms of dogs in Sydney. Aust Vet J, 64, 161-4.
[00163] SABATTINI, S., SCARPA, F., BERLATO, D. & BETTINI, G. 2015. Histologic
grading of
canine mast cell tumor: is 2 better than 3? Vet Pathol, 52, 70-3.
[00164] SHAPIRO, S. G., RAGHUNATH, S., WILLIAMS, C., MOTSINGER-REIF, A. A.,
CULLEN,
J. M., LIU, T., ALBERTSON, D., RUVOLO, M., BERGSTROM LUCAS, A., JIN, J.,
KNAPP, D. W.,
CA 03025776 2018-11-27
WO 2017/210115 PCT/US2017/034711
SCHIFFMAN, J. D. & BREEN, M. 2015. Canine urothelial carcinoma: genomically
aberrant and
comparatively relevant. Chromosome Res, 23, 311-31.
[00165] TAKEUCHI, Y., FUJINO, Y., WATANABE, M., TAKAHASHI, M., NAKAGAWA, T.,
TAKEUCHI, A., BONKOBARA, M., KOBAYASHI, T., OHNO, K. & UCHIDA, K. 2013.
Validation of
the prognostic value of histopathological grading or c-kit mutation in canine
cutaneous mast cell tumours:
a retrospective cohort study. The Veterinary Journal, 196, 492-498.
[00166] THOMAS, R., BORST, L., ROTROFF, D., MOTSINGER-REIF, A., LINDBLAD-TOH,
K.,
MODIANO, J. F. & BREEN, M. 2014. Genomic profiling reveals extensive
heterogeneity in somatic DNA
copy number aberrations of canine hemangiosarcoma. Chromosome Res, 22, 305-19.
[00167] THOMAS, R., DUKE, S. E., WANG, H. J., BREEN, T. E., HIGGINS, R. J.,
LINDER, K. E.,
ELLIS, P., LANGFORD, C. F., DICKINSON, P. J., OLBY, N. J. & BREEN, M. 2009.
'Putting our heads
together': insights into genomic conservation between human and canine
intracranial tumors. J Neurooncol,
94, 333-49.
[00168] THOMAS, R., SEISER, E. L., MOTSINGER-REIF, A., BORST, L., VALLI, V.
E., KELLEY,
K., SUTER, S. E., ARGYLE, D., BURGESS, K., BELL, J., LINDBLAD-TOH, K.,
MODIANO, J. F. &
BREEN, M. 2011. Refining tumor-associated aneuploidy through 'genomic
recoding' of recurrent DNA
copy number aberrations in 150 canine non-Hodgkin lymphomas. Leuk Lymphoma,
52, 1321-35.
[00169] VILLAMIL, J. A., HENRY, C. J., BRYAN, J. N., ELLERSIECK, M., SCHULTZ,
L., TYLER,
J. W. & HAHN, A. W. 2011. Identification of the most common cutaneous
neoplasms in dogs and
evaluation of breed and age distributions for selected neoplasms. J Am Vet Med
Assoc, 239, 960-5.
TABLE 1
Clinical and histopathologic findings in 109 canine mast cell tumors
Breed Labrador Retriever (34), Boxer (32), Pug (32), Golden
Retriever (8),
Mixed (6), other breeds (35, each < 5)
Gender Female (77), Male (70)
3-tier histopathlogical grading Grade 1 (18), Grade 2 (93), Grade 3 (36)
2-tier histopathlogical grading Low (87), High (62)
TABLE 2
Primer and probe sequences used in this study
Target Forward (SEQ ID NOS:1-7) Reverse (SEQ ID
NOS:8-14)
KIT exon 8 GGTGAGGTGTTCCAGCAGTC CCTTCCCTCGTGCACATTA
36
CA 03025776 2018-11-27
WO 2017/210115 PCT/US2017/034711
KIT exon 9 ACGTATGCCAATTCCAATGT GCCATTGATGGAATGGACTT
KIT exon 11 GAAGCTAATGGGGTTCCCTAA
AAAGATGATCTGTCTCTCTTTTCTCC
CFA 5: 37 Mb
GTCATGTGTTAGCAGAGAGAGA
TTGCCTAGAGTATGGCGAAG
CFA 20: 31Mb
GGGTTACCCAAAGTAGTCTGA TACTTTGTCTTCCTGGTTGTAACT
CFA 20:46 Mb AAGGTTCTTAGCACAGAGGAATC
AACATCCTATGCTCTGCTTCTG
CFA 31: 16 Mb AGCTGGATTTACAAATAGCACTTTC GGAAGAGAAGGCAATGAATAGGA
Target Probe (SEQ ID NOS:15-18) Location
CFA 5: 37 Mb
TTGGCTGTTCTCTCTGTGTCCGTT CFA 5: 37,905,014¨ 37,905,113
CFA 20: 31Mb
TTTGGCTACCCTTCCTAAGACACAGC CFA 20: 31,487,071-31,487,165
CFA 20:46 Mb
TTCTCTTCTCAGGCCGTTCCGTTT CFA 20: 46,772,055-46,772,149
CFA 31: 16 Mb TGTGAGATTTGCATTACATGACCCTGGA
CFA 31: 16,758,969-16,759,073
TABLE 3 Genomic regions significantly different between mut-KIT tumors and wt-
KIT tumors
37
Freq
Freq
in
in wt- Diff
Region Loc Event Length mut- IT p-
value q-bound Gene Symbols 0
K (%)
KIT t.)
(%)
(%)
o
1-,
-4
t.)
chr5:0-133,326 ql 1 Loss 133,326 66.7
13.2 53.5 5.26E-08 5.71E-07 cOR9R4, L0C102155730
o
1-,
chr5:133,326-381,054 q11 Loss 247,728 60.6
0.0 60.6 1.59E-13 1.60E-11 L0C102156207, LOC102155804
vi
chr5:381,054-415,492 ql 1 Loss 34,438 60.6
1.3 59.3 2.88E-12 1.11E-10
chr5:415,492-431,007 ql 1 Loss 15,515 63.6
5.3 58.4 1.67E-10 2.84E-09
chr5:431,007-481,597 ql 1 Loss 50,590 66.7
7.9 58.8 5.39E-10 8.10E-09
chr5:481,597-571,794 ql 1 Loss 90,197 69.7
7.9 61.8 9.19E-11 1.85E-09 L0C102156249, LOC102156294
chr5:571,794-589,240 ql 1 Loss 17,446 69.7
9.2 60.5 3.47E-10 5.61E-09
chr5:589,240-599,748 ql 1 Loss 10,508 69.7
10.5 59.2 1.18E-09 1.59E-08
P
chr5:599,748-626,252 ql 1 Loss 26,504 63.6
10.5 53.1 3.13E-08 3.41E-07 .
chr5:626,252-650,764 ql 1 Loss 24,512 63.6
13.2 50.5 2.37E-07 2.43E-06 2
u,
,
oe
L0C100687391, LOC102155966, .
r.,
chr5:650,764-749,787 ql 1 Loss 99,023 66.7
14.5 52.2 1.36E-07 1.40E-06 B3GAT1 ,2
.3
,
chr5:754,021-761,056 ql 1 Loss 7,035 63.6
7.9 55.7 2.91E-09 3.74E-08 GLB1L2 ,
,
chr5:761,056-769,157 ql 1 Loss 8,101 63.6
0.0 63.6 2.33E-14 6.04E-12 GLB1L2 ,
chr5:769,157-774,383 ql 1 Loss 5,226 60.6
0.0 60.6 1.59E-13 1.60E-11 GLB1L2
GLB1L2, GLB1L3,
chr5:774,383-880,302 ql 1 Loss 105,919 63.6
0.0 63.6 2.33E-14 6.04E-12 L0C102156417, L00607396
L0C102156417, L00607396,
L0C102156118, ACAD8,
THYN1, VPS26B, NCAPD3,
Iv
n
chr5:880,302-1,142,528 q11 Loss 262,226 60.6 0.0 60.6 1.59E-13
1.60E-11 JAM3
chr5:1,142,528-1,153,946 ql 1 Loss 11,418 60.6
1.3 59.3 2.88E-12 1.11E-10 JAM3 cp
tµ.)
o
chr5:1,153,946-1,167,298 ql 1 Loss 13,352 60.6
2.6 58.0 2.72E-11 6.21E-10 JAM3
-4
chr5:1,167,298-1,182,071 ql 1 Loss 14,773 57.6
2.6 54.9 1.56E-10 2.67E-09 o
.6.
chr5:1,182,071-1,211,221 ql 1 Loss 29,150 60.6
6.6 54.0 3.94E-09 4.98E-08 -4
1-,
1-,
chr5:1,211,221-1,224,769 ql 1 Loss 13,548 60.6
7.9 52.7 1.46E-08 1.64E-07
chr5:1,224,769-1,333,535 q11 Loss
108,766 60.6 10.5 50.1 1.42E-07 1.46E-06 IGSF9B
chr5:1,333,535-1,360,338 ql 1 Loss 26,803 60.6 7.9
52.7 1.46E-08 1.64E-07 SPATA19
0
chr5:1,360,338-1,404,082 ql 1 Loss 43,744 60.6
1.3 59.3 2.88E-12 1.11E-10 SPATA19 tµ.)
o
chr5:1,404,082-1,491,974 ql 1 Loss 87,892 57.6 1.3 56.3
1.75E-11 4.38E-10
-4
tµ.)
chr5:1,491,974-1,776,954 ql 1 Loss 284,980 57.6 0.0
57.6 1.02E-12 5.07E-11
o
1-,
chr5:1,776,954-1,922,199 ql 1 Loss 145,245 57.6 1.3 56.3
1.75E-11 4.38E-10
vi
chr5:1,922,199-2,400,485 q11 Loss 478,286 57.6 0.0 57.6 1.02E-12 5.07E-11
OPCML
chr5:2,400,485-2,584,033 ql 1 Loss 183,548 54.5 0.0
54.5 6.22E-12 1.92E-10 OPCML
chr5:2,584,033-2,704,511 q11 Loss 120,478 57.6 0.0 57.6 1.02E-12 5.07E-11
OPCML
chr5:2,704,511-3,349,181 q11 Loss 644,670 54.5 0.0 54.5 6.22E-
12 1.92E-10 NTM
chr5:3,349,181-3,399,027 ql 1 Loss 49,846 57.6 0.0
57.6 1.02E-12 5.07E-11 NTM
chr5:3,399,027-3,433,371 ql 1 Loss 34,344 63.6 1.3
62.3 4.46E-13 3.02E-11 NTM
chr5:3,433,371-3,464,227 ql 1 Loss 30,856 63.6
2.6 61.0 4.45E-12 1.48E-10 NTM P
chr5:3,464,227-3,499,187 ql 1 Loss 34,960 69.7
5.3 64.4 4.36E-12 1.48E-10 NTM 2
u,
,
chr5:3,499,187-3,576,535 ql 1 Loss 77,348 72.7
5.3 67.5 6.18E-13 3.91E-11 NTM .
r.,
NTM, L0C102154392,
.
,
.3
chr5:3,576,535-3,690,776 ql 1 Loss 114,241
69.7 5.3 64.4 4.36E-12 1.48E-10
L0C102154472 ,
,
,
chr5:3,690,776-3,710,651 ql 1 Loss 19,875
69.7 2.6 67.1 9.50E-14 1.12E-11 ,
chr5:3,710,651-3,753,162 ql 1 Loss 42,511 69.7
1.3 68.4 8.56E-15 3.54E-12
chr5:3,753,162-3,807,807 ql 1 Loss 54,645 66.7 0.0 66.7
3.18E-15 3.41E-12
ql 1 -
chr5:3,807,807-4,031,844 q12 Loss 224,037 57.6 0.0 57.6 1.02E-12 5.07E-11
NCAPD3
NCAPD3, SNX19,
L0C102151125, ADAMTS15,
Iv
n
ADAMTS8, ZBTB44, ST14,
chr5:4,031,844-4,721,545 q12 Loss 689,701 54.5 0.0 54.5 6.22E-
12 1.92E-10 APLP2
cp
tµ.)
APLP2, L0C102154549,
o
1-,
-4
chr5:4,721,545-5,115,444 q12 Loss 393,899 57.6
0.0 57.6 1.02E-12 5.07E-11 PRDM10, NFRKB,
TMEM45B o
BARX2, L0C102152251,
.6.
-4
1-,
chr5:5,115,444-5,377,336 q12 Loss 261,892 60.6 0.0 60.6 1.59E-13 1.60E-11
L0C102156865 1-,
chr5:5,377,336-5,667,233 q12 Loss 289,897 57.6
0.0 57.6 1.02E-12 5.07E-11 L0C102156865, ARHGAP32
chr5:5,667,233-5,821,501 q12 Loss 154,268 60.6
0.0 60.6 1.59E-13 1.60E-11 ARHGAP32, KCNJ5, KCNJ1
0
chr5:5,821,501-5,854,005 q12 Loss
32,504 57.6 0.0 57.6 1.02E-12 5.07E-11 FLI1 tµ.)
o
chr5:5,854,005-5,867,075 q12 Loss 13,070 54.5
0.0 54.5 6.22E-12 1.92E-10 FLI1
-4
tµ.)
chr5:5,867,075-5,926,290 q12 Loss 59,215 51.5
0.0 51.5 3.58E-11 7.73E-10 FLI1
o
1-,
chr5:6,218,480-6,467,492 q12 Loss 249,012 54.5
0.0 54.5 6.22E-12 1.92E-10 L0C102153240
vi
chr5:6,467,492-6,667,635 q12 Loss 200,143 57.6 0.0 57.6 1.02E-12
5.07E-11
chr5:6,667,635-6,817,010 q12 Loss
149,375 54.5 0.0 54.5 6.22E-12 1.92E-10
chr5:6,817,010-6,908,015 q12 Loss
91,005 57.6 0.0 57.6 1.02E-12 5.07E-11
chr5:6,908,015-7,040,574 q12 Loss
132,559 54.5 0.0 54.5 6.22E-12 1.92E-10
chr5:7,040,574-7,122,705 q12 Loss
82,131 51.5 0.0 51.5 3.58E-11 7.73E-10
chr5:7,440,761-7,479,883 q12 Loss
39,122 51.5 0.0 51.5 3.58E-11 7.73E-10
chr5:7,479,883-7,489,731 q12 Loss
9,848 57.6 0.0 57.6 1.02E-12 5.07E-11 P
chr5:7,489,731-7,693,556 q12 Loss 203,825 60.6
1.3 59.3 2.88E-12 1.11E-10
KIRREL3 2
u,
,
.6.
,
o chr5:7,693,556-7,918,502 q12 Loss
224,946 57.6 1.3 56.3 1.75E-
11 4.38E-10 KIRREL3 .
r.,
chr5:7,918,502-7,937,124 q12 Loss 18,622 57.6
3.9 53.6 9.72E-10 1.34E-08
KIRREL3 -- .
,
.3
,
chr5:7,937,124-7,968,162 q12 Loss
31,038 60.6 3.9 56.7 1.79E-10 2.97E-09 KIRREL3 ,
,
chr5:7,968,162-8,094,810 q12 Loss
126,648 60.6 7.9 52.7 1.46E-08 1.64E-07 KIRREL3 ,
chr5:8,113,294-8,135,481 q12 Loss 22,187 57.6 2.6
54.9 1.56E-10 2.67E-09 KIRREL3, ST3GAL4
chr5:8,135,481-8,151,341 q12 Loss
15,860 57.6 0.0 57.6 1.02E-12 5.07E-11 ST3GAL4
chr5:8,592,141-8,608,158 q12 Loss 16,017 54.5 0.0
54.5 6.22E-12 1.92E-10 PUS3, HYLS1
PATE2, PATE1, ACRV1,
chr5:8,608,158-9,046,592 q12 Loss 438,434 60.6
0.0 60.6 1.59E-13 1.60E-11 CHEK1, STT3A, E124, FEZ1
Iv
chr5:9,046,592-9,062,538 q12 Loss
15,946 57.6 0.0 57.6 1.02E-12 5.07E-11 PKNOX2 n
,-i
chr5:9,062,538-9,218,872 q12 Loss 156,334 60.6
0.0 60.6 1.59E-13 1.60E-11 PKNOX2, L0C102156272
cp
PKNOX2, L0C102156272,
tµ.)
o
1-,
chr5:9,218,872-9,395,688 q12 Loss 176,816 57.6
0.0 57.6 1.02E-12 5.07E-11
TMEM218, SLC37A2 -4
o
SLC37A2, CCDC15, HEPACAM,
c,.)
.6.
-4
HEPN1, ROB04, ROB03,
1-,
chr5:9,395,688-9,670,771 q12 Loss 275,083 54.5
0.0 54.5 6.22E-12 1.92E-10 MSANTD2, ESAM, VSIG2
VSIG2, NRGN, SPA17, SIAE,
chr5:9,670,771-9,837,421 q12 Loss 166,650 66.7 0.0
66.7 3.18E-15 3.41E-12 TBRG1, PANX3, OR8A1
0
L0C489314, L0C489315,
tµ.)
o
1¨,
L0C100686868, L0C489317,
-4
tµ.)
0R8B4, cOR8C4,
o
L0C100687027, L00609966,
1¨,
vi
cOR8B15, LOC100686309,
L0C100686560, L0C100687264,
L0C100687028, L0C489325,
L0C100687427, L0C489326,
0R8D2, L0C100687661,
chr5:9,837,421-10,291,526 q12 Loss 454,105 63.6 0.0
63.6 2.33E-14 6.04E-12 L0C102151657
0R28D07, 0R16Al2, ORO8E10,
P
VWA5A, L0C100688048,
.
2
LOC100688253, cOR10D5P,
u,
,
.6.
,
1¨,
L0C489338, L0C489340, .
r.,
chr5:10,291,526-10,518,964 q12 Loss 227,438 60.6
0.0 60.6 1.59E-13 1.60E-11
L0C489341, cOR10G11, OR1OS 1 .
,
.3
,
,
cOR8C5, 0R4D5, TMEM225,
,
,
r.,
L0C100688741, L0C489347,
,
cOR6M4, cOR6M5, OR6M1,
chr5:10,518,964-10,717,556 q12 Loss 198,592 60.6 1.3
59.3 2.88E-12 1.11E-10 OR6X1, ZNF202
ZNF202, LOC102155174,
chr5:10,717,556-10,824,977 q12 Loss 107,421 66.7 1.3
65.4 6.42E-14 9.66E-12 SCN3B, GRAMD1B
chr5:10,824,977-10,867,242 q12 Loss 42,265 69.7 1.3
68.4 8.56E-15 3.54E-12 GRAMD1B
chr5:10,867,242-10,929,698 q12 Loss 62,456 63.6
1.3 62.3 4.46E-13 3.02E-11 GRAMD1B
Iv
n
chr5:10,929,698-11,178,647 q12 Loss 248,949 57.6 1.3
56.3 1.75E-11 4.38E-10 GRAMD1B, L00609517
q12 -
cp
tµ.)
o
chr5:11,178,647-11,307,095 q13 Loss 128,448 60.6 1.3
59.3 2.88E-12 1.11E-10 FOXRED1, CLMP, HSPA8
-4
chr5:11,307,095-11,365,230 q13 Loss 58,135 63.6 1.3
62.3 4.46E-13 3.02E-11
.6.
chr5:11,365,230-11,372,266 q13 Loss 7,036 57.6
1.3 56.3 1.75E-11 4.38E-10 BSX -
4
1¨,
1¨,
chr5:11,372,266-11,378,881 q13 Loss 6,615 54.5 1.3
53.2 9.97E-11 1.85E-09
chr5:11,378,881-11,425,343 q13 Loss 46,462 54.5
2.6 51.9 8.40E-10 1.18E-08 C5H1 lorf63
chr5:11,616,512-11,647,820 q13 Loss 31,308 54.5 2.6 51.9
8.40E-10 1.18E-08
0
chr5:11,647,820-11,670,962 q13 Loss 23,142 57.6 2.6 54.9
1.56E-10 2.67E-09 tµ.)
o
chr5:11,670,962-11,842,755 q13 Loss 171,793 60.6 2.6
58.0 2.72E-11 6.21E-10
-4
tµ.)
chr5:11,842,755-11,941,764 q13 Loss 99,009 63.6 2.6 61.0
4.45E-12 1.48E-10 L0C100682870
o
1-,
chr5:11,941,764-12,064,197 q13 Loss 122,433 60.6 2.6
58.0 2.72E-11 6.21E-10 L0C100682870
vi
chr5:12,064,197-12,133,064 q13 Loss 68,867 63.6 2.6 61.0 4.45E-12
1.48E-10 BUD, L0C102156815
chr5:12,133,064-12,216,348 q13 Loss 83,284 66.7 3.9 62.7
4.94E-12 1.59E-10 L0C102156815
chr5:12,216,348-12,272,269 q13 Loss 55,921 63.6 3.9 59.7
3.09E-11 6.77E-10
chr5:12,272,269-12,353,441 q13 Loss 81,172 66.7 3.9 62.7
4.94E-12 1.59E-10
chr5:12,353,441-12,383,117 q13 Loss 29,676 69.7 3.9 65.7
7.29E-13 4.00E-11
chr5:12,383,117-12,432,341 q13 Loss 49,224 60.6 3.9 56.7
1.79E-10 2.97E-09
chr5:12,432,341-12,543,948 q13 Loss 111,607 57.6 2.6 54.9
1.56E-10 2.67E-09 SORL1 P
SORL1, SC5D, L0C102157382,
2
u,
.6. chr5:12,543,948-12,959,155 q13 Loss
415,207 60.6 2.6 58.0 2.72E-
11 6.21E-10 LOC489316, TECTA ,
,
tµ.)
.
chr5:12,959,155-13,022,344 q13 Loss 63,189 66.7 2.6 64.0 6.76E-13
3.91E-11 cOR8B3, TBCEL
o
,
.3
chr5:13,022,344-13,134,971 q13 Loss
112,627 63.6 2.6 61.0 4.45E-12 1.48E-10 TBCEL, cOR8B
1P, GRIK4 ,
,
,
cOR8D5, GRIK4, 0R08H04,
,
chr5:13,134,971-13,672,471 q13 Loss 537,500 66.7 2.6 64.0 6.76E-13
3.91E-11 L00607862, ARHGEF12
TMEM136, POU2F3, OAF,
chr5:13,672,471-13,833,005 q13 Loss 160,534 66.7 1.3
65.4 6.42E-14 9.66E-12 L0C100683683
chr5:13,833,005-14,058,393 q13 Loss 225,388 63.6 1.3
62.3 4.46E-13 3.02E-11 TRIM29
chr5:14,058,393-14,123,666 q13 Loss 65,273 63.6 2.6 61.0
4.45E-12 1.48E-10
chr5:14,123,666-14,157,781 q13 Loss
34,115 63.6 3.9 59.7 3.09E-11 6.77E-10 Iv
n
chr5:14,157,781-14,194,514 q13 Loss 36,733 63.6 5.3 58.4
1.67E-10 2.84E-09
chr5:14,194,514-14,268,931 q13 Loss 74,417 66.7
6.6 60.1 1.33E-10 2.43E-09 PVRL1 cp
tµ.)
o
chr5:14,268,931-14,301,979 q13 Loss 33,048 69.7 6.6 63.1
2.16E-11 5.35E-10 PVRL1
-4
o
chr5:14,301,979-14,350,047 q13 Loss 48,068 69.7 7.9 61.8
9.19E-11 1.85E-09 c,.)
.6.
-4
chr5:14,350,047-14,434,923 q13 Loss 84,876 69.7 6.6 63.1
2.16E-11 5.35E-10 L0C102152657
1-,
chr5:14,434,923-14,497,888 q13 Loss 62,965 63.6 2.6 61.0
4.45E-12 1.48E-10 L0C102152657
L0C102152657, THY1,
chr5:14,497,888-14,560,969 q13 Loss 63,081 60.6 2.6 58.0 2.72E-
11 6.21E-10 L0C102152850, USP2, MFRP
0
PDZD3, NLRX1, ABCG4,
tµ.)
o
HINFP, C2CD2L, DPAGT1,
-4
L0C489372, HMBS, VPS11,
k.)
1¨,
chr5:14,691,773-14,813,785 q13 Loss 122,012 54.5 2.6
51.9 8.40E-10 1.18E-08 L0C102154262, HYOU1
1¨,
1¨,
vi
L0C102152874, SLC37A4,
TRAPPC4, RPS25, CCDC84,
FOXR1, UPK2, BCL9L, CXCR5,
chr5:14,813,785-15,004,440 q13 Loss 190,655 57.6 2.6
54.9 1.56E-10 2.67E-09 DDX6
DDX6, LOC102155606,
L0C102155677, TREH, PHLDB1,
ARCN1, IFT46, TMEM25,
chr5:15,004,440-15,224,520 q13 Loss 220,080 60.6
2.6 58.0 2.72E-11 6.21E-10
TTC36, KMT2A P
chr5:15,517,999-15,590,459 q13 Loss 72,460 75.8 5.3 70.5 7.94E-
14 1.12E-11 SCN2B, SCN4B, TMPRSS4 .
2
u,
,
.6. ,
q13 -
chr5:15,590,459-15,629,393 q14.1 Loss 38,934 69.7 5.3 64.4 4.36E-
12 1.48E-10 TMPRSS4 ,
.3
,
,
,
chr5:15,629,393-15,725,600 q14.1 Loss 96,207 72.7 5.3 67.5 6.18E-13
3.91E-11 IL1ORA ,
TMPRSS13, FXYD6, FXYD2,
chr5:15,725,600-15,902,742 q14.1 Loss 177,142 72.7 7.9
64.8 1.43E-11 4.38E-10 DSCAML1
chr5:15,902,742-15,949,009 q14.1 Loss 46,267 72.7 10.5 62.2 2.01E-
10 3.28E-09 DSCAML1
chr5:15,949,009-16,029,118 q14.1 Loss 80,109 72.7 11.8 60.9 6.54E-
10 9.79E-09 DSCAML1 Iv
n
,-i
chr5:16,029,118-16,062,976 q14.1 Loss 33,858 69.7 11.8 57.9 3.69E-
09 4.71E-08 DSCAML1 cp
tµ.)
o
1¨,
-4
chr5:16,062,976-16,105,095 q14.1 Loss 42,119 69.7 10.5 59.2 1.18E-
09 1.59E-08 DSCAML1 o
.6.
-4
1¨,
chr5:16,105,095-16,139,973 q14.1 Loss 34,878 66.7 6.6 60.1 1.33E-
10 2.43E-09 DSCAML1 1¨,
chr5:16,139,973-16,160,653 q14.1 Loss
20,680 54.5 2.6 51.9 8.40E-10 1.18E-08 DSCAML1
0
tµ.)
chr5:16,384,444-16,411,973 q14.1 Loss 27,529 54.5 2.6
51.9 8.40E-10 1.18E-08 PCSK7, TAGLN, SIDT2
1-,
-4
tµ.)
1-,
chr5:16,452,934-16,698,305 q14.1 Loss
245,371 54.5 2.6 51.9 8.40E-10 1.18E-08 SIK3 '
1-,
1-,
SIK3, AP0A1, APOC3, AP0A4,
vi
chr5:16,698,305-16,809,673 q14.1 Loss 111,368 57.6 2.6
54.9 1.56E-10 2.67E-09 AP0A5, ZNF259, BUD13
chr5:16,809,673-16,821,033 q14.1 Loss 11,360 63.6
2.6 61.0 4.45E-12 1.48E-10 BUD13
chr5:16,821,033-16,834,415 q14.1 Loss 13,382 66.7
2.6 64.0 6.76E-13 3.91E-11 L0C479430
chr5:16,834,415-16,847,536 q14.1 Loss
13,121 69.7 2.6 67.1 9.50E-14 1.12E-11 L0C479430 p
2
2
chr5:16,847,536-16,879,661 q14.1 Loss
32,125 72.7 3.9 68.8 9.86E-14 1.12E-11 LOC610527 u,
.6.
..,..'
.6.
.
r.,
chr5:16,879,661-16,894,745 q14.1 Loss
15,084 72.7 5.3 67.5 6.18E-13 3.91E-11 L00610527 ,9
.3
,
,
chr5:16,894,745-16,911,794 q14.1 Loss
17,049 72.7 6.6 66.1 3.20E-12 1.22E-10
chr5:16,911,794-17,003,811 q14.1 Loss
92,017 72.7 7.9 64.8 1.43E-11 4.38E-10
chr5:17,003,811-17,271,198 q14.1 Loss 267,387 81.8
7.9 73.9 2.80E-14 7.01E-12
chr5:17,271,198-17,298,351 q14.1 Loss
27,153 75.8 3.9 71.8 1.21E-14 3.54E-12 Iv
n
,-i
q14.1
cp
tµ.)
o
1-,
-4
chr5:17,298,351-17,399,902 q14.2 Loss 101,551 72.7
3.9 68.8 9.86E-14 1.12E-11 L0C102153762 o
.6.
-4
1-,
chr5:17,399,902-17,524,675 q14.2 Loss 124,773 69.7
3.9 65.7 7.29E-13 4.00E-11 L0C102153762 1-,
L0C102153809, L0C102153862,
chr5:17,524,675-17,736,000 q14.2 Loss 211,325 66.7 3.9 62.7 4.94E-12
1.59E-10 L0C102153906
0
tµ.)
chr5:17,736,000-17,762,360 q14.2 Loss 26,360 66.7 2.6 64.0 6.76E-13
3.91E-11
1-,
-4
tµ.)
1-,
chr5:17,762,360-17,778,609 q14.2 Loss 16,249 57.6 2.6 54.9 1.56E-10
2.67E-09
1-,
1-,
vi
chr5:17,778,609-17,796,114 q14.2 Loss 17,505 54.5 2.6 51.9 8.40E-10
1.18E-08
chr5:18,030,450-18,175,274 q14.2 Loss 144,824 63.6 2.6 61.0 4.45E-12
1.48E-10 CADM1
chr5:18,175,274-18,276,940 q14.2 Loss 101,666 66.7 2.6 64.0 6.76E-13
3.91E-11 CADM1
chr5:18,276,940-18,351,440 q14.2 Loss
74,500 69.7 2.6 67.1 9.50E-14 1.12E-11 NXPE4 p
2
2
chr5:18,351,440-18,363,393 q14.2 Loss
11,953 69.7 3.9 65.7 7.29E-13 4.00E-11 NXPE4 u,
.6.
..,..'
r.,
chr5:18,363,393-18,596,946 q14.2 Loss
233,553 72.7 3.9 68.8 9.86E-14 1.12E-11 NXPE4, SCN2B
...'-9
,
,
q14.2
chr5:18,596,946-18,657,666 q14.3 Loss 60,720 54.5 3.9 50.6 4.94E-09
5.94E-08 NXPE4
chr5:18,657,666-18,880,390 q14.3 Loss 222,724 54.5 2.6 51.9 8.40E-10
1.18E-08 NXPE4, FAM55A
chr5:19,010,922-19,060,287 q14.3 Loss
49,365 54.5 2.6 51.9 8.40E-10 1.18E-08 NNMT Iv
n
,-i
chr5:19,060,287-19,074,393 q14.3 Loss
14,106 57.6 5.3 52.3 4.74E-09 5.74E-08 L0C489397 cp
tµ.)
o
1-,
-4
chr5:19,074,393-19,270,731 q14.3 Loss 196,338
69.7 10.5 59.2 1.18E-09 1.59E-08 ZBTB 16 =
.6.
-4
1-,
chr5:19,270,731-19,281,974 q14.3 Loss 11,243
75.8 10.5 65.2 3.08E-11 6.77E-10 ZBTB 16 1-,
ZBTB 16, L0C102155430,
chr5:19,281,974-19,336,090 q14.3 Loss
54,116 78.8 11.8 66.9 1.49E-11 4.38E-10 HTR3A
0
tµ.)
chr5:19,336,090-19,348,097 q14.3 Loss 12,007 75.8
7.9 67.9 2.01E-12 9.88E-11 HTR3A
1-,
-4
HTR3B, SIDT2, USP28, CLDN25,
tµ.)
1-,
chr5:19,348,097-19,522,336 q14.3 Loss 174,239 69.7
2.6 67.1 9.50E-14 1.12E-11 ZW10
1-,
1-,
ZW10, TMPRS S5,
vi
chr5:19,522,336-19,761,676 q14.3 Loss 239,340 66.7 2.6
64.0 6.76E-13 3.91E-11 L0C102155912, DRD2
chr5:19,761,676-19,772,292 q14.3 Loss 10,616 54.5
1.3 53.2 9.97E-11 1.85E-09 DRD2
chr5:19,772,292-19,798,108 q14.3 Loss 25,816 51.5
1.3 50.2 5.38E-10 8.10E-09 DRD2
chr5:19,870,693-19,882,469 q14.3 Loss 11,776 54.5
1.3 53.2 9.97E-11 1.85E-09 TTC12 p
.
2
chr5:19,882,469-19,890,567 q14.3 Loss 8,098 57.6
1.3 56.3 1.75E-11 4.38E-10 u,
,
.6.
,
r.,
chr5:19,890,567-19,914,466 q14.3 Loss 23,899 60.6
1.3 59.3 2.88E-12 1.11E-10 NCAM1 ,
.3
,
,
,
,
chr5:19,914,466-19,937,434 q14.3 Loss 22,968 63.6
1.3 62.3 4.46E-13 3.02E-11 NCAM1
chr5:19,937,434-19,990,331 q14.3 Loss 52,897 63.6
2.6 61.0 4.45E-12 1.48E-10 NCAM1
chr5:19,990,331-20,005,792 q14.3 Loss 15,461 66.7
2.6 64.0 6.76E-13 3.91E-11 NCAM1
chr5:20,005,792-20,095,665 q14.3 Loss 89,873 63.6
2.6 61.0 4.45E-12 1.48E-10 NCAM1 Iv
n
,-i
chr5:20,095,665-20,101,537 q14.3 Loss 5,872 57.6
2.6 54.9 1.56E-10 2.67E-09 NCAM1 cp
tµ.)
o
1-,
-4
chr5:20,101,537-20,117,741 q14.3 Loss 16,204 54.5
2.6 51.9 8.40E-10 1.18E-08 NCAM1 =
.6.
-4
1-,
chr5:20,530,275-20,593,191 q14.3 Loss 62,916 57.6
2.6 54.9 1.56E-10 2.67E-09 1-,
chr5:20,593,191-20,741,425 q14.3 Loss 148,234 60.6 2.6
58.0 2.72E-11 6.21E-10
0
tµ.)
chr5:20,741,425-20,763,660 q14.3 Loss 22,235 63.6 2.6
61.0 4.45E-12 1.48E-10
1-,
-4
tµ.)
1-,
chr5:20,763,660-20,903,254 q14.3 Loss 139,594 69.7 2.6
67.1 9.50E-14 1.12E-11 C5H11orf34
1-,
1-,
vi
chr5:20,903,254-20,930,927 q14.3 Loss 27,673 66.7 2.6
64.0 6.76E-13 3.91E-11 PTS, BCO2
chr5:20,930,927-20,965,652 q14.3 Loss 34,725 60.6 2.6
58.0 2.72E-11 6.21E-10 BCO2
TEX12, IL18, SDHD, TIMM8B,
C5H1 lorf57, PIH1D2, DLAT,
DIXDC1, C5H1 lorf52, HSPB2,
CRYAB, C5H1 lorfl, FDXACB1,
p
chr5:20,965,652-21,478,736 q14.3 Loss 513,084 57.6
2.6 54.9 1.56E-10 2.67E-09
ALG9, PPP2R1B, SIK2 2
2
u,
,
.6.
,
--4 chr5:21,478,736-21,531,994 q14.3 Loss
53,258 54.5 2.6 51.9 8.40E-
10 1.18E-08 SIK2, L0C102153351, LAYN .
r.,
,
.3
,
,
chr5:21,592,851-21,655,541 q14.3 Loss 62,690 54.5
2.6 51.9 8.40E-10 1.18E-08
L0C102153632 ,
,
chr5:21,655,541-21,691,724 q14.3 Loss 36,183 57.6 .. 2.6
54.9 1.56E-10 2.67E-09 POU2AF1
POU2AF1, L0C102153661,
chr5:21,691,724-21,842,858 q14.3 Loss 151,134 60.6 2.6
58.0 2.72E-11 6.21E-10 COLCA2, C5H1 lorf53
chr5:21,842,858-21,939,169 q14.3 Loss 96,311 57.6 2.6
54.9 1.56E-10 2.67E-09 L00611159
Iv
n
chr5:21,939,169-22,200,189 q14.3 Loss 261,020 54.5 2.6
51.9 8.40E-10 1.18E-08 L00611159, L0C100685611
ARHGAP20, L0C102154781,
cp
tµ.)
chr5:22,200,189-22,469,863 q14.3 Loss 269,674 57.6
2.6 54.9 1.56E-10 2.67E-09 FDX1
o
1-,
-4
o
chr5:22,469,863-22,525,617 q14.3 Loss 55,754 54.5
2.6 51.9 8.40E-10 1.18E-08 FDX1
.6.
-4
1-,
1-,
chr5:22,525,617-22,713,579 q14.3 Loss 187,962 57.6 2.6
54.9 1.56E-10 2.67E-09 RDX, ZC3H12C
chr5:22,713,579-22,756,080 q14.3 Loss 42,501 60.6 2.6
58.0 2.72E-11 6.21E-10 ZC3H12C, L0C102154417
0
t..)
chr5:22,756,080-22,882,299 q14.3 Loss 126,219 66.7 2.6
64.0 6.76E-13 3.91E-11
1-
--4
t..)
1-
chr5:22,882,299-22,956,725 q14.3 Loss 74,426 60.6 2.6
58.0 2.72E-11 6.21E-10
1-
1-
vi
chr5:22,956,725-23,730,600 q14.3 Loss 773,875 57.6 2.6
54.9 1.56E-10 2.67E-09 C5H11orf87, DDX10
chr5:23,730,600-24,006,504 q14.3 Loss 275,904 63.6 2.6
61.0 4.45E-12 1.48E-10 DDX10
EXPH5, KDELC2, C5H11orf65,
chr5:24,006,504-24,225,138 q14.3 Loss 218,634 60.6 2.6
58.0 2.72E-11 6.21E-10 ATM
ATM, NPAT, ACAT1,
L0C102156093, CUL5, RAB39,
P
chr5:24,225,138-24,750,152 q14.3 Loss 525,014 57.6
2.6 54.9 1.56E-10 2.67E-09
SLC35F2, SLN .
r.,
u,
_.]
.6.
_.]
oe chr5:25,055,292-25,232,639 q14.3 Loss
177,347 51.5 1.3 50.2 5.38E-
10 8.10E-09 CWF19L2, L0C102157218 .
r.,
,
.3
,
,
chr5:25,232,639-25,250,829 q14.3 Loss 18,190 54.5
1.3 53.2 9.97E-11 1.85E-09
,
,
r.,
_.]
chr5:25,250,829-25,684,529 q14.3 Loss 433,700 63.6 3.9
59.7 3.09E-11 6.77E-10 GUCY1A2
chr5:25,684,529-25,836,174 q14.3 Loss 151,645 60.6 3.9
56.7 1.79E-10 2.97E-09
chr5:25,836,174-26,006,165 q14.3 Loss 169,991 54.5 3.9
50.6 4.94E-09 5.94E-08
AASDHPPT, KBTBD3,
1-d
n
chr5:26,006,165-26,253,762 q14.3 Loss 247,597 57.6 3.9
53.6 9.72E-10 1.34E-08 MSANTD4
MSANTD4, L0C100688413,
cp
t..)
chr5:26,253,762-26,630,899 q14.3 Loss 377,137 57.6
2.6 54.9 1.56E-10 2.67E-09 GRIA4
o
1-
--4
o
chr5:26,630,899-26,803,690 q14.3 Loss 172,791 63.6
3.9 59.7 3.09E-11 6.77E-10 GRIA4
.6.
--4
1-
1-
chr5:26,803,690-26,813,706 q14.3 Loss 10,016 60.6 3.9
56.7 1.79E-10 2.97E-09
0
tµ.)
chr5:26,813,706-26,911,584 q14.3 Loss 97,878 54.5 2.6
51.9 8.40E-10 1.18E-08
1-,
-4
tµ.)
1-,
chr5:26,911,584-27,034,403 q14.3 Loss 122,819 54.5 1.3
53.2 9.97E-11 1.85E-09
1-,
1-,
vi
chr5:27,034,403-27,145,741 q14.3 Loss 111,338 60.6 1.3
59.3 2.88E-12 1.11E-10 CASP4
q14.3
chr5:27,145,741-27,306,771 - q21 Loss 161,030 60.6 2.6
58.0 2.72E-11 6.21E-10 CASP4, CASP12, L0C479459
chr5:27,306,771-27,464,906 q21 Loss 158,135 57.6 2.6 54.9 1.56E-10 2.67E-09
chr5:27,464,906-27,526,152 q21 Loss 61,246 60.6 2.6
58.0 2.72E-11 6.21E-10
chr5:27,526,152-27,671,544 q21 Loss 145,392 60.6 3.9 56.7 1.79E-10 2.97E-09
P
chr5:27,671,544-27,702,732 q21 Loss
31,188 54.5 2.6 51.9 8.40E-10 1.18E-08 2
u,
,
.6. chr5:27,919,757-27,934,987 q21 Loss
15,230 54.5 2.6 51.9 8.40E-10 1.18E-08 PDGFD ,
.
r.,
chr5:27,934,987-27,963,780 q21 Loss 28,793 57.6
3.9 53.6 9.72E-10 1.34E-08
PDGFD ,2
.3
,
chr5:27,963,780-27,990,233 q21 Loss 26,453 63.6
3.9 59.7 3.09E-11 6.77E-10
DDI1, PDGFD ,
,
chr5:27,990,233-28,106,271 q21 Loss 116,038 66.7
3.9 62.7 4.94E-12 1.59E-10
PDGFD ,
chr5:28,106,271-28,202,681 q21 Loss
96,410 57.6 2.6 54.9 1.56E-10 2.67E-09
chr5:28,202,681-28,394,367 q21 Loss 191,686 60.6 2.6
58.0 2.72E-11 6.21E-10 DYNC2H1
chr5:28,394,367-28,568,040 q21 Loss 173,673 63.6 2.6
61.0 4.45E-12 1.48E-10 DYNC2H1
chr5:28,568,040-28,652,646 q21 Loss 84,606 60.6 2.6
58.0 2.72E-11 6.21E-10 DYNC2H1
chr5:28,652,646-28,704,136 q21 Loss 51,490 57.6 2.6
54.9 1.56E-10 2.67E-09 DYNC2H1
Iv
chr5:28,704,136-28,805,065 q21 Loss 100,929 54.5
1.3 53.2 9.97E-11 1.85E-09
DYNC2H1, DCUN1D5, MMP13 n
,-i
chr5:28,805,065-28,959,058 q21 Loss 153,993 57.6 1.3
56.3 1.75E-11 4.38E-10 MMP13, MMP12, MMP3
cp
tµ.)
chr5:28,959,058-29,015,567 q21 Loss 56,509 60.6
1.3 59.3 2.88E-12 1.11E-10
L0C489428 o
1-,
-4
MMP8, MMP27, MMP20, MMP7,
o
chr5:29,015,567-29,261,694 q21 Loss 246,127 57.6
1.3 56.3 1.75E-11 4.38E-10
L0C100856041 .6.
-4
1-,
chr5:29,261,694-29,285,265 q21 Loss 23,571 54.5
1.3 53.2 9.97E-11 1.85E-09
L0C100856041 1-,
L0C102154369, BIRC2, BIRC3,
L0C102153712, YAP1,
L0C102153832, C5H1lorf70,
0
tµ.)
chr5:29,285,265-29,647,998 q21 Loss 362,733 51.5 1.3
50.2 5.38E-10 8.10E-09 K1AA1377
1-,
-4
chr5:29,647,998-29,926,991 q21 Loss 278,993 54.5
1.3 53.2 9.97E-11 1.85E-09
KIAA1377, ANGPTL5, TRPC6 k.)
1-,
o
chr5:29,926,991-29,943,628 q21 Loss 16,637 63.6 2.6 61.0 4.45E-
12 1.48E-10 TRPC6
1-,
vi
chr5:29,943,628-30,117,141 q21 Loss 173,513 66.7 2.6
64.0 6.76E-13 3.91E-11 TRPC6
chr5:30,117,141-30,292,482 q21 Loss 175,341 69.7 2.6
67.1 9.50E-14 1.12E-11 ZZEF1, CYB5D2, ANKFY1
chr5:30,292,482-30,412,787 q21 Loss 120,305 72.7 2.6
70.1 1.22E-14 3.54E-12 ANKFY1, UBE2G1
chr5:30,412,787-30,460,632 q21 Loss 47,845 66.7 2.6 64.0 6.76E-
13 3.91E-11
chr5:30,460,632-30,475,453 q21 Loss 14,821 69.7 9.2 60.5 3.47E-10
5.61E-09 SPNS3
chr5:30,475,453-30,505,927 q21 Loss 30,474 69.7 10.5 59.2
1.18E-09 1.59E-08 SPNS3, SPNS2
SPNS2, MYBBP1A, GGT6,
p
L0C102155027, SMTNL2,
2
chr5:30,505,927-30,624,645 q21 Loss 118,718 69.7 13.2
56.5 1.07E-08 1.25E-07 TEKT1, FBX039
,
vi
,
o chr5:30,624,645-30,629,434
q21 Loss 4,789 75.8 14.5 61.3 9.65E-
10 1.34E-08 XAF1 .
r.,
XAF1, SLC13A5, MED31,
,
TXNDC17, KIAA0753,
,
,
r.,
L0C102156039, PITPNM3,
,
chr5:30,629,434-30,839,322 q21 Loss 209,888 75.8 17.1
58.7 6.96E-09 8.23E-08 FAM64A, AIPL1
chr5:30,839,322-30,858,577 q21 Loss 19,255 78.8 18.4 60.4 3.01E-
09 3.86E-08
chr5:30,858,577-30,879,260 q21 Loss 20,683 78.8 19.7 59.1 1.06E-
08 1.24E-07
chr5:30,879,260-30,944,859 q21 Loss 65,599 81.8 21.1 60.8
3.71E-09 4.73E-08 L0C102156228, L0C102156296
chr5:30,944,859-30,994,655 q21 Loss 49,796 81.8 22.4 59.4
7.25E-09 8.55E-08 L0C102156392, L0C102156440
Iv
chr5:30,994,655-31,066,726 q21 Loss 72,071 81.8 23.7 58.1 2.51E-
08 2.75E-07 WSCD1 n
,-i
chr5:31,066,726-31,080,498 q21 Loss 13,772 81.8 25.0 56.8 3.93E-
08 4.27E-07
cp
chr5:31,096,931-31,168,215 q21 Loss 71,284 72.7 15.8 56.9 1.47E-
08 1.65E-07 tµ.)
o
1-,
chr5:31,168,215-31,189,337 q21 Loss 21,122 69.7 15.8 53.9 7.35E-
08 7.77E-07 -4
o
chr5:31,189,337-31,203,739 q21 Loss 14,402 72.7 15.8 56.9 1.47E-
08 1.65E-07 .6.
-4
1-,
chr5:31,203,739-31,220,304 q21 Loss 16,565 72.7 14.5 58.3 5.56E-
09 6.58E-08 1-,
chr5:31,220,304-31,307,195 q21 Loss 86,891 69.7 5.3 64.4 4.36E-12
1.48E-10 NLRP1
L0C100688504, MIS12, DERL2,
chr5:31,307,195-31,369,071 q21 Loss
61,876 69.7 3.9 65.7 7.29E-13 4.00E-11 DHX33, ClQBP, RPAIN,
NUP88 0
tµ.)
o
chr5:31,369,071-31,385,315 q21 Loss 16,244 72.7 3.9 68.8 9.86E-14 1.12E-11
NUP88
-4
chr5:31,385,315-31,404,096 q21 Loss
18,781 69.7 3.9 65.7 7.29E-13 4.00E-11 NUP88, RABEP1
tµ.)
1-,
o
chr5:31,404,096-31,417,175 q21 Loss 13,079 69.7 2.6 67.1 9.50E-14 1.12E-11
RABEP1
1-,
vi
chr5:31,417,175-31,430,511 q21 Loss 13,336 72.7 2.6 70.1 1.22E-14
3.54E-12 RABEP1
chr5:31,430,511-31,535,668 q21 Loss 105,157 69.7 1.3 68.4 8.56E-15
3.54E-12 RABEP1, SCIMP, ZFP3
chr5:31,535,668-31,580,505 q21 Loss 44,837 66.7 1.3 65.4 6.42E-14
9.66E-12 SCIMP, ZFP3
chr5:31,580,505-31,601,294 q21 Loss 20,789 60.6 1.3 59.3 2.88E-12
1.11E-10 ZFP3
chr5:31,601,294-31,622,778 q21 Loss 21,484 60.6 2.6 58.0 2.72E-11
6.21E-10 KIF1C
KIF1C, INCA1, CAMTA2,
SPAG7, EN03, PFN1, RNF167,
p
chr5:31,622,778-31,685,371 q21 Loss
62,593 57.6 2.6 54.9 1.56E-10 2.67E-09 SLC25A11, GP1BA
2
2
chr5:31,685,371-31,700,554 q21 Loss
15,183 60.6 2.6 58.0 2.72E-11 6.21E-10 u,
,
vi
,
chr5:31,700,554-31,712,954 q21 Loss 12,400 60.6 3.9 56.7 1.79E-10
2.97E-09 CHRNE, C5H17orf107, MINK1
,
chr5:31,712,954-31,739,657 q21 Loss
26,703 66.7 3.9 62.7 4.94E-12 1.59E-10 MINK1 .3
,
,
,
chr5:31,739,657-31,749,780 q21 Loss 10,123 66.7 2.6 64.0 6.76E-13 3.91E-
11 MINK1
,
MINK1, PLD2, PSMB6, GLTPD2,
VM01, TM4SF5, ZMYND15,
CXCL16, MED 1 1, ARRB 2,
chr5:31,749,780-31,910,093 q21 Loss 160,313 66.7 1.3 65.4 6.42E-14
9.66E-12 PELP1, ALOX15
L00607567, L0C102155409,
ALOX12, RNASEK, C5H17orf49,
Iv
BCL6B, SLC16A13, SLC16A11,
n
,-i
chr5:31,910,093-32,088,235 q21 Loss 178,142 66.7 2.6 64.0 6.76E-13
3.91E-11 L0C102156250
cp
chr5:32,088,235-32,106,863 q21 Loss
18,628 66.7 7.9 58.8 5.39E-10 8.10E-09 CLEC10A tµ.)
o
1-,
chr5:32,106,863-32,183,648 q21 Loss
76,785 69.7 11.8 57.9 3.69E-09 4.71E-08 ASGR2, ASGR1, DLG4
-4
o
chr5:32,411,753-32,430,833 q21 Loss
19,080 57.6 1.3 56.3 1.75E-11 4.38E-10 POLR2A c,.)
.6.
-4
1-,
1-,
L0C102153734, TNFSF12,
TNFSF13, SENP3, EIF4A1,
CD68, MPDU1, SOX15, FXR2,
0
t.)
chr5:32,430,833-32,545,540 q21 Loss 114,707 60.6 1.3 59.3 2.88E-12
1.11E-10 SAT2, SHBG
1-
-4
ATP1B2, TP53, WRAP53,
t.)
1¨
chr5:32,545,540-32,659,365 q21 Loss 113,825 60.6 2.6 58.0 2.72E-11
6.21E-10 EFNB3, DNAH2
1-
1¨
DNAH2, L0C102155246,
vi
chr5:32,659,365-32,708,735 q21 Loss 49,370 57.6 2.6 54.9
1.56E-10 2.67E-09 KDM6B
KDM6B, TMEM88, NAA38,
CYB5D1, L0C102155431, CHD3,
q21 -
L0C102155855, KCNAB3,
chr5:32,708,735-32,807,894 q22 Loss 99,159 57.6 1.3 56.3 1.75E-11
4.38E-10 TRAPPC1, CNTROB
chr5:32,807,894-32,866,241 q22 Loss 58,347 54.5 1.3 53.2 9.97E-11
1.85E-09 CNTROB, GUCY2D
chr5:32,866,241-32,905,477 q22 Loss
39,236 51.5 1.3 50.2 5.38E-10 8.10E-09 ALOX15B, ALOX12B
P
2
u,
,
vi
ALOX12B, ALOXE3, HES7, ,
t.)
.
PERI, VAMP2, L0C102157040,
,
TMEM107, C5H17orf59,
.3
,
,
AURKB, CTC1, PFAS, RANGRF,
,
,
r.,
,
chr5:32,905,477-33,112,862 q22 Loss 207,385 54.5 1.3 53.2 9.97E-11
1.85E-09 SLC25A35, ARHGEF15
ODF4, KRBA2, RPL26, RNF222,
chr5:33,112,862-33,421,296 q22 Loss 308,434 60.6 1.3 59.3 2.88E-12
1.11E-10 NDEL1, MYH10
CCDC42, MFSD6L, PIK3R6,
PIK3R5, L0C102155775,
chr5:33,421,296-33,693,288 q22 Loss 271,992 63.6 1.3 62.3 4.46E-13
3.02E-11 L0C102155856, NTN1
chr5:33,693,288-33,705,238 q22 Loss
11,950 66.7 1.3 65.4 6.42E-14 9.66E-12 NTN1 1-d
n
,-i
chr5:33,705,238-33,851,152 q22 Loss 145,914 69.7 3.9 65.7 7.29E-13 4.00E-
11 NTN1
cp
chr5:33,851,152-33,989,233 q22 Loss 138,081 72.7 3.9 68.8
9.86E-14 1.12E-11 STX8 t.)
o
1¨
chr5:33,989,233-34,071,975 q22 Loss
82,742 69.7 1.3 68.4 8.56E-15 3.54E-12 STX8 -4
o
chr5:34,071,975-34,105,056 q22 Loss
33,081 66.7 1.3 65.4 6.42E-14 9.66E-12 STX8, WDR16
c,.)
.6.
-4
chr5:34,105,056-34,123,099 q22 Loss 18,043 63.6
1.3 62.3 4.46E-13 3.02E-11 WDR16 1-
1¨
chr5:34,123,099-34,198,416 q22 Loss 75,317 60.6 1.3 59.3 2.88E-12
1.11E-10 WDR16, USP43
chr5:34,198,416-34,217,677 q22 Loss 19,261 60.6 0.0 60.6
1.59E-13 1.60E-11
chr5:34,217,677-34,270,966 q22 Loss 53,289 57.6 0.0 57.6 1.02E-12
5.07E-11 DHRS7C, GLP2R
0
chr5:34,270,966-34,285,525 q22 Loss 14,559 60.6
1.3 59.3 2.88E-12 1.11E-10 GLP2R t.)
o
GLP2R, RCVRN, L0C479467,
1-
-4
chr5:34,285,525-34,386,603 q22 Loss 101,078 63.6
2.6 61.0 4.45E-12 1.48E-10 GAS7 t.)
1-
o
chr5:34,386,603-34,530,246 q22 Loss
143,643 60.6 1.3 59.3 2.88E-12 1.11E-10 L0C479467, GAS7
1-
1-
vi
chr5:34,530,246-34,682,629 q22 Loss 152,383 69.7 1.3
68.4 8.56E-15 3.54E-12 MYH13
chr5:34,682,629-34,687,626 q22 Loss 4,997 72.7 2.6 70.1
1.22E-14 3.54E-12
chr5:34,687,626-34,700,809 q22 Loss 13,183 75.8 2.6 73.1
1.43E-15 2.15E-12 MYH8
chr5:34,700,809-34,733,618 q22 Loss 32,809 78.8 2.6 76.2
1.50E-16 1.13E-12 MYH8
chr5:34,733,618-34,739,360 q22 Loss 5,742 72.7 2.6 70.1
1.22E-14 3.54E-12
chr5:34,739,360-34,749,464 q22 Loss 10,104 66.7 2.6 64.0
6.76E-13 3.91E-11 MYH4
chr5:34,749,464-34,757,802 q22 Loss 8,338 66.7
1.3 65.4 6.42E-14 9.66E-12 MYH4 P
chr5:34,757,802-34,763,799 q22 Loss 5,997 63.6
1.3 62.3 4.46E-13 3.02E-11 MYH4 2
2
u,
vi chr5:34,763,799-34,888,925 q22 Loss
125,126 54.5 .. 1.3 53.2 9.97E-
11 1.85E-09 MYH4, MYH1, MYH2 .. ..,..'
.
chr5:34,888,925-34,900,363 q22 Loss 11,438 57.6 1.3 56.3
1.75E-11 4.38E-10
,2
.3
chr5:34,900,363-34,924,941 q22 Loss 24,578 60.6
1.3 59.3 2.88E-12 1.11E-10 MYH3 ,
MYH3, SC01, ADPRM,
,
chr5:34,924,941-34,997,381 q22 Loss 72,440 63.6 1.3 62.3
4.46E-13 3.02E-11 TMEM220
chr5:34,997,381-35,219,397 q22 Loss 222,016 63.6 2.6 61.0 4.45E-12
1.48E-10 PIRT
chr5:35,219,397-35,273,015 q22 Loss 53,618 69.7 2.6 67.1
9.50E-14 1.12E-11 GPS2
chr5:35,273,015-35,289,492 q22 Loss 16,477 72.7 2.6 70.1
1.22E-14 3.54E-12
chr5:35,289,492-35,344,382 q22 Loss 54,890 78.8 3.9 74.8
1.33E-15 2.15E-12
chr5:35,344,382-35,933,510 q22 Loss
589,128 78.8 5.3 73.5 9.14E-15 3.54E-12 SAT2, SHISA6, SHBG,
DNAH9 1-d
n
1-i
chr5:35,933,510-36,039,948 q22 Loss 106,438 75.8 3.9
71.8 1.21E-14 3.54E-12 DNAH9
cp
chr5:36,039,948-36,069,307 q22 Loss
29,359 63.6 1.3 62.3 4.46E-13 3.02E-11 DNAH9, ZNF18 t.)
o
1-
ZNF18, L0C100685794,
-4
o
MAP2K4, L0C102155074,
c,.)
.6.
chr5:36,069,307-36,339,529 q22 Loss 270,222 60.6
1.3 59.3 2.88E-12 1.11E-10 L0C102155028 -4
1-
1-
chr5:36,339,529-36,352,015 q22 Loss 12,486 57.6 1.3 56.3
1.75E-11 4.38E-10 L0C102155130
chr5:36,352,015-36,361,706 q22 Loss 9,691 54.5 1.3
53.2 9.97E-11 1.85E-09 L0C102155130
22
q -
chr5:36,361,706-36,635,379 q23 Loss 273,673 51.5
1.3 50.2 5.38E-10 8.10E-09
L0C102155130, L0C102155247 0
t..)
o
chr5:36,635,379-36,706,216 q23 Loss 70,837 57.6
1.3 56.3 1.75E-11 4.38E-10 MYOCD
1-
--4
chr5:36,706,216-36,723,188 q23 Loss 16,972 63.6
1.3 62.3 4.46E-13 3.02E-11 MYOCD
t..)
1-
o
chr5:36,723,188-36,935,181 q23 Loss 211,993 66.7
1.3 65.4 6.42E-14 9.66E-12 MYOCD,
ARHGAP44 1-
1-
vi
ARHGAP44, ELAC2,
chr5:36,935,181-36,991,263 q23 Loss 56,082 63.6 1.3
62.3 4.46E-13 3.02E-11 L0C102156372
chr5:36,991,263-37,077,985 q23 Loss 86,722 54.5 1.3
53.2 9.97E-11 1.85E-09 L0C102156372
L0C102156372, L0C102155885,
chr5:37,077,985-37,345,754 q23 Loss 267,769 51.5 1.3
50.2 5.38E-10 8.10E-09 L0C102155946, L0C102156000
chr5:37,345,754-37,378,710 q23 Loss 32,956 54.5 1.3
53.2 9.97E-11 1.85E-09
chr5:37,378,710-37,400,359 q23 Loss
21,649 57.6 1.3 56.3 1.75E-11 4.38E-10
P
chr5:37,400,359-37,418,572 q23 Loss 18,213 60.6
1.3 59.3 2.88E-12 1.11E-10
HS3ST3A1
chr5:37,418,572-37,430,842 q23 Loss 12,270 63.6
1.3 62.3 4.46E-13 3.02E-11
HS3ST3A1 u,
,
vi
,
.6.
.
chr5:37,430,842-37,475,789 q23 Loss 44,947 66.7 2.6
64.0 6.76E-13 3.91E-11 HS3ST3A1
HS3ST3A1, L00608351,
,
chr5:37,475,789-37,752,244 q23 Loss 276,455 69.7 2.6 67.1 9.50E-14 1.12E-11
L0C102156188 ,
,
r.,
,
chr5:37,752,244-37,788,552 q23 Loss
36,308 72.7 2.6 70.1 1.22E-14 3.54E-12
chr5:37,788,552-37,966,845 q23 Loss 178,293 75.8 2.6
73.1 1.43E-15 2.15E-12 COX10
chr5:37,966,845-37,978,756 q23 Loss 11,911 72.7 2.6
70.1 1.22E-14 3.54E-12 COX10
chr5:37,978,756-37,989,010 q23 Loss 10,254 72.7 1.3
71.4 1.05E-15 2.15E-12 COX10
chr5:37,989,010-38,005,708 q23 Loss 16,698 69.7 1.3
68.4 8.56E-15 3.54E-12
chr5:38,005,708-38,024,187 q23 Loss 18,479 66.7
1.3 65.4 6.42E-14 9.66E-12
HS3ST3B1 1-d
n
chr5:38,024,187-38,065,129 q23 Loss 40,942 60.6 1.3
59.3 2.88E-12 1.11E-10 HS3ST3B1
chr5:38,065,129-38,389,508 q23 Loss 324,379 57.6
1.3 56.3 1.75E-11 4.38E-10
HS3ST3B1 cp
t..)
o
chr5:38,389,508-38,483,690 q23 Loss 94,182 54.5
1.3 53.2 9.97E-11 1.85E-09 1-
--4
chr5:38,483,690-38,679,152 q23 Loss 195,462 51.5 1.3
50.2 5.38E-10 8.10E-09 L0C102156520
.6.
chr5:38,679,152-38,863,984 q23 Loss 184,832 54.5
1.3 53.2 9.97E-11 1.85E-09
L00608772, PMP22 --4
1-
1-
TEKT3, L0C102156927, CDRT4,
chr5:38,863,984-39,121,648 q23 Loss 257,664 51.5 1.3 50.2 5.38E-10
8.10E-09 TVP23B, FBXW10
0
FBXW10, L0C489518,
tµ.)
L0C102151571, L00608913,
o
1-,
-4
chr5:39,121,648-39,256,137 q23 Loss
134,489 54.5 1.3 53.2 9.97E-11 1.85E-09 ZNF286A tµ.)
1-,
o
ZNF624, ZNF287, FAM211A,
1-,
LOC100687347, TRPV2, UBB,
vi
CENPV, L0C100687735, PIGL,
chr5:39,256,137-39,810,518 q23 Loss 554,381 51.5 1.3 50.2 5.38E-10
8.10E-09 NCOR1
chr5:39,810,518-39,860,472 q23 Loss 49,954 57.6 1.3 56.3 1.75E-11
4.38E-10 NCOR1, TTC19
chr5:39,860,472-39,897,741 q23 Loss 37,269 54.5 1.3 53.2 9.97E-11
1.85E-09 TTC19, ZSWIM7, ADORA2B
chr5:39,897,741-39,943,405 q23 Loss 45,664 57.6 1.3 56.3 1.75E-11
4.38E-10 ADORA2B, SPECC1
chr5:39,943,405-39,953,861 q23 Loss 10,456 63.6 1.3 62.3 4.46E-13
3.02E-11 SPECC1
P
q23 -
.
chr5:39,953,861-40,463,632 q24 Loss
509,771 66.7 1.3 65.4 6.42E-14 9.66E-12 SPECC1, AKAP10,
ULK2
r.,
u,
,
vi chr5:40,463,632-40,474,878 q24 Loss 11,246 63.6
1.3 62.3 4.46E-13 3.02E-11
ALDH3A1 ,
vi
.
r.,
chr5:40,474,878-40,479,655 q24 Loss 4,777 60.6
1.3 59.3 2.88E-12 1.11E-10
,
.3
,
chr5:40,479,655-40,550,707 q24 Loss
71,052 57.6 1.3 56.3 1.75E-11 4.38E-10 SLC47A2, ALDH3A2
,
,
,
r.,
chr5:40,550,707-40,588,700 q24 Loss
37,993 60.6 1.3 59.3 2.88E-12 1.11E-10 L0C100688308
,
chr5:40,588,700-40,763,870 q24 Loss 175,170 63.6 1.3 62.3 4.46E-13
3.02E-11 L0C100688308, SLC47A1
chr5:40,763,870-40,829,794 q24 Loss 65,924 60.6 1.3 59.3 2.88E-12
1.11E-10 RNF112, MFAP4
MFAP4, MAPK7, B9D1, EPN2,
chr5:40,829,794-41,116,952 q24 Loss 287,158 57.6 1.3 56.3 1.75E-11
4.38E-10 GRAP, SLC5A10, FAM83G
chr5:41,116,952-41,198,148 q24 Loss 81,196 54.5 1.3 53.2 9.97E-11
1.85E-09 PRPSAP2
Iv
chr5:41,198,148-41,286,067 q24 Loss
87,919 57.6 1.3 56.3 1.75E-11 4.38E-10 SHMT1, SMCR8, TOP3A
n
1-i
TOP3A, SMCR7, FLIT, LLGL1,
chr5:41,286,067-41,401,440 q24 Loss
115,373 54.5 1.3 53.2 9.97E-11 1.85E-09 ALKBH5, MY015A
cp
tµ.)
o
chr5:41,401,440-41,429,338 q24 Loss 27,898 57.6 1.3 56.3 1.75E-11
4.38E-10 MY015A, DRG2
-4
o
.6.
-4
DRG2, GID4, ATPAF2, LRRC48,
1-,
chr5:41,429,338-41,749,755 q24 Loss 320,417 60.6 1.3 59.3 2.88E-12
1.11E-10 TOM1L2, SREBF1, RAI1
chr5:41,749,755-41,925,434 q24 Loss 175,679 63.6 1.3 62.3 4.46E-13
3.02E-11 RAIL PEMT
chr5:41,925,434-41,961,024 q24 Loss 35,590 60.6 1.3 59.3 2.88E-12
1.11E-10 PEMT
0
RASD1, MED9, NT5M, COPS3,
tµ.)
o
chr5:41,961,024-42,181,266 q24 Loss 220,242 63.6 1.3 62.3 4.46E-13 3.02E-
11 FLCN
-4
chr5:42,181,266-42,235,930 q24 Loss
54,664 66.7 1.3 65.4 6.42E-14 9.66E-12 FLCN, PLD6,
L0C479530 tµ.)
1-,
o
chr5:42,235,930-42,279,703 q24 Loss 43,773 63.6 1.3 62.3 4.46E-13 3.02E-
11 L0C479530
1-,
vi
L0C479530, L0C102153190,
chr5:42,279,703-42,604,639 q24 Loss 324,936 60.6 1.3 59.3 2.88E-12
1.11E-10 TNFRSF13B, USP22, DHRS7B
DHRS7B, TMEM11,
L0C102153833, C5H17orf103,
chr5:42,604,639-42,747,794 q24 Loss 143,155 54.5 1.3 53.2 9.97E-11
1.85E-09 L0C102154017, MAP2K3
MAP2K3, KCNJ12,
chr5:42,747,794-42,904,466 q24 Loss 156,672 57.6 1.3 56.3 1.75E-11
4.38E-10 L0C102157145
P
chr5:42,904,466-42,966,420 q24 Loss 61,954 57.6
3.9 53.6 9.72E-10 1.34E-08 L0C102154136 .
chr5:42,966,420-43,008,464 q24 Loss 42,044 63.6 3.9 59.7
3.09E-11 6.77E-10 2
u,
,
c: chr5:43,008,464-43,076,302 q24 Loss 67,838 60.6
3.9 56.7 1.79E-10 2.97E-09
L0C102154367 .
r.,
chr5:43,076,302-43,189,705 q24 Loss 113,403 54.5 2.6 51.9
8.40E-10 1.18E-08 SERBP1 ,
.3
,
,
chr5:43,189,705-43,361,590 q24 Loss
171,885 51.5 1.3 50.2 5.38E-10 8.10E-09 L0C102154658,
IL12RB2, IL23R ,
,
chr5:43,361,590-43,470,080 q24 Loss 108,490 54.5 1.3 53.2 9.97E-11
1.85E-09 IL23R, L00609111, C5Hlorf141
chr5:43,470,080-43,483,708 q24 Loss 13,628 51.5 1.3 50.2 5.38E-10
8.10E-09 L0C100685241
LEPR, L0C102156371,
chr5:44,768,774-45,069,038 q24 Loss 300,264 54.5 2.6 51.9 8.40E-10
1.18E-08 L00609115, DNAJC6, AK4
chr5:48,016,459-48,445,801 q24 Loss 429,342 54.5 2.6 51.9 8.40E-10
1.18E-08 INADL, L0C479551
chr5:49,551,942-50,021,095 q24 Loss 469,153 54.5 2.6 51.9 8.40E-10
1.18E-08 C5H1orf87, CYP2J2, HOOK1
Iv
chr5:50,047,157-50,091,376 q24 Loss 44,219 54.5 2.6 51.9
8.40E-10 1.18E-08 HOOK1 n
,-i
chr5:50,091,376-50,114,330 q24 Loss 22,954 54.5 1.3 53.2 9.97E-11
1.85E-09 FGGY
cp
tµ.)
chr5:50,114,330-50,436,698 q24 Loss
322,368 51.5 1.3 50.2 5.38E-10 8.10E-09 FGGY =
1-,
-4
chr5:50,436,698-50,448,468 q24 Loss
11,770 51.5 0.0 51.5 3.58E-11 7.73E-10 FGGY o
chr5:51,048,547-51,059,816 q31 Loss
11,269 57.6 1.3 56.3 1.75E-11 4.38E-10 MYSM1 .6.
-4
1-,
chr5:51,059,816-51,252,744 q31 Loss
192,928 60.6 1.3 59.3 2.88E-12 1.11E-10 MYSM1, TACSTD2,
OMA1 1-,
chr5:51,252,744-51,563,921 q31 Loss 311,177 57.6 1.3 56.3 1.75E-11
4.38E-10 DAB1
chr5:51,563,921-52,014,031 q31 Loss 450,110 54.5 1.3 53.2 9.97E-11
1.85E-09 L0C102156041, DAB1
0
chr5:52,014,031-52,106,690 q31 Loss
92,659 57.6 1.3 56.3 1.75E-11 4.38E-10 DAB1 t.)
o
chr5:52,106,690-52,139,816 q31 Loss
33,126 60.6 2.6 58.0 2.72E-11 6.21E-10 DAB1 1-
-4
t.)
chr5:52,139,816-52,284,795 q31 Loss
144,979 63.6 2.6 61.0 4.45E-12 1.48E-10 DAB1 1-
o
1-
chr5:52,284,795-52,533,879 q31 Loss
249,084 54.5 1.3 53.2 9.97E-11 1.85E-09 DAB1 1-
vi
chr5:54,303,571-54,320,419 q31 Loss 16,848 51.5 1.3 50.2 5.38E-10
8.10E-09 DHCR24
DHCR24, C5H1orf177, TTC22,
chr5:54,320,419-54,413,010 q31 Loss 92,591 54.5 1.3 53.2 9.97E-
11 1.85E-09 PARS2, TTC4
TTC4, HEATR8, FAM151A,
chr5:54,413,010-54,610,336 q31 Loss 197,326 57.6 1.3 56.3 1.75E-11
4.38E-10 ACOT11
L0C102151468, L0C102151517,
chr5:54,610,336-54,767,411 q31 Loss
157,075 60.6 2.6 58.0 2.72E-11 6.21E-10 SSBP3 P
chr5:55,243,189-55,254,977 q31 Loss
11,788 63.6 2.6 61.0 4.45E-12 1.48E-10 GLIS1
chr5:55,254,977-55,454,968 q31 Loss
199,991 63.6 3.9 59.7 3.09E-11 6.77E-10 GLIS1 u,
,
vi
,
--4
.
q31 -
chr5:55,454,968-55,654,428 q32 Loss
199,460 63.6 2.6 61.0 4.45E-12 1.48E-10 GLIS1, DMRTB1,
C8A, LRP8 ,
.3
,
,
LRP8, MAGOH, C5H1orf123,
,
,
r.,
chr5:55,654,428-55,724,923 q32 Loss
70,495 60.6 1.3 59.3 2.88E-12 1.11E-10 CPT2 ,
CPT2, L0C102153558, SLC1A7,
chr5:55,724,923-55,840,582 q32 Loss 115,659 63.6 1.3 62.3 4.46E-13 3.02E-
11 PODN
chr5:55,840,582-55,916,484 q32 Loss 75,902 60.6 1.3 59.3 2.88E-12
1.11E-10 PODN, L0C102153929, SCP2
chr5:55,916,484-55,992,635 q32 Loss 76,151 66.7 1.3 65.4 6.42E-14
9.66E-12 L0C102153929, SCP2, ECHDC2
chr5:55,992,635-56,081,540 q32 Loss 88,905 63.6 1.3 62.3 4.46E-13 3.02E-
11 ZYG11A
1-d
chr5:56,081,540-56,131,102 q32 Loss 49,562 60.6
1.3 59.3 2.88E-12 1.11E-10 SAMD11 n
,-i
chr5:56,533,402-56,539,243 q32 Loss 5,841 51.5 1.3 50.2 5.38E-10
8.10E-09
cp
t.)
AURKAIP1, CCNL2, MRPL20,
1-
ANKRD65, TMEM88B, VWAl,
-4
o
ATAD3B, TMEM240, SSU72,
c,.)
.6.
-4
C5H1orf233, MIB2, MMP23B,
1-
1-
chr5:56,539,243-56,713,902 q32 Loss 174,659 54.5 1.3 53.2 9.97E-11
1.85E-09 CDK11B
chr5:56,713,902-56,760,282 q32 Loss 46,380 51.5 1.3 50.2 5.38E-10
8.10E-09 CDK11B, SLC35E2B, NADK
chr5:56,800,229-56,812,468 q32 Loss 12,239 54.5 1.3 53.2
9.97E-11 1.85E-09 GNB1
0
chr5:56,812,468-56,835,624 q32 Loss 23,156 57.6
1.3 56.3 1.75E-11 4.38E-10 GNB1 tµ.)
o
chr5:56,835,624-56,859,924 q32 Loss 24,300 54.5 1.3 53.2
9.97E-11 1.85E-09 GNB1
-4
tµ.)
chr5:56,879,215-56,892,317 q32 Loss 13,102 51.5 1.3 50.2
5.38E-10 8.10E-09 GNB1
o
1-,
chr5:57,333,494-57,373,774 q32 Loss 40,280 54.5 3.9 50.6 4.94E-09
5.94E-08 PLCH2, PANK4
vi
chr5:57,373,774-57,397,914 q32 Loss 24,140 57.6 3.9 53.6 9.72E-10
1.34E-08 PANK4, HESS, L0C102155829
chr5:57,397,914-57,427,153 q32 Loss 29,239 60.6 3.9 56.7 1.79E-10
2.97E-09 L0C102155829, TNFRSF14
chr5:57,427,153-57,441,148 q32 Loss 13,995 60.6 6.6 54.0 3.94E-09
4.98E-08 FAM213B, MMEL1
chr5:57,441,148-57,473,452 q32 Loss 32,304 63.6 6.6 57.1 7.51E-10
1.12E-08 MMEL1, L0C479559
chr5:57,473,452-57,551,025 q32 Loss 77,573 63.6 7.9 55.7 2.91E-09
3.74E-08 L0C479559, TTC34
chr5:57,551,025-57,607,976 q32 Loss 56,951 63.6 9.2 54.4
1.00E-08 1.18E-07
chr5:57,607,976-57,621,918 q32 Loss 13,942 63.6 10.5 53.1
3.13E-08 3.41E-07 P
chr5:57,621,918-57,686,792 q32 Loss 64,874 69.7 10.5 59.2
1.18E-09 1.59E-08 ACTRT2 2
u,
,
oe chr5:57,686,792-57,792,964 q32 Loss
106,172 69.7 15.8 53.9 7.35E-08 7.77E-07 L0C102156624 .
r.,
chr5:57,792,964-57,810,561 q32 Loss
17,597 69.7 18.4 51.3 4.48E-07 4.42E-06 L0C102156763,
PRDM16 .
,
.3
,
chr5:57,835,337-57,844,842 q32 Loss
9,505 72.7 19.7 53.0 2.14E-07 2.19E-06 PRDM16 ,
,
chr5:57,844,842-57,946,330 q32 Loss 101,488 72.7 22.4 50.4
1.06E-06 1.04E-05 PRDM16 ,
MEGF6, TPRG1L, WRAP73,
chr5:58,119,121-58,237,076 q32 Loss 117,955
63.6 13.2 50.5 2.37E-07 2.43E-06 TP73
chr5:58,237,076-58,255,637 q32 Loss 18,561 63.6 3.9 59.7
3.09E-11 6.77E-10 TP73
CCDC27, SMIM1, LRRC47,
CEP104, DFFB, C5H1orf174,
chr5:58,255,637-58,708,022 q32 Loss 452,385 60.6
3.9 56.7 1.79E-10 2.97E-09 L0C102151771 Iv
n
chr5:58,708,022-58,727,983 q32 Loss 19,961 66.7 5.3 61.4 2.81E-
11 6.38E-10 LOC102151822, LOC102151862
chr5:58,727,983-58,911,333 q32 Loss 183,350 69.7
9.2 60.5 3.47E-10 5.61E-09 AJAP1 cp
tµ.)
o
chr5:58,911,333-59,057,612 q32 Loss 146,279 69.7 5.3
64.4 4.36E-12 1.48E-10 AJAP1
-4
o
chr5:59,057,612-59,113,878 q32 Loss 56,266 66.7
3.9 62.7 4.94E-12 1.59E-10 c,.)
.6.
-4
chr5:59,113,878-59,187,182 q32 Loss 73,304 63.6 3.9 59.7
3.09E-11 6.77E-10
1-,
chr5:59,187,182-59,326,374 q32 Loss 139,192 60.6 3.9
56.7 1.79E-10 2.97E-09 ISG15
chr5:59,326,374-59,781,603 q32 Loss 455,229 63.6 3.9 59.7 3.09E-11
6.77E-10 PUSL1, CPSF3L, GLTPD1, DVL1
chr5:59,781,603-59,794,743 q32 Loss 13,140 63.6 5.3 58.4
1.67E-10 2.84E-09 0
t..)
o
chr5:59,794,743-59,805,785 q32 Loss 11,042 63.6 6.6 57.1
7.51E-10 1.12E-08 1-
--4
chr5:59,805,785-59,836,239 q32 Loss
30,454 57.6 6.6 51.0 1.92E-08 2.15E-07 NPHP4 t..)
1-
o
chr5:60,170,663-60,180,879 q32 Loss
10,216 54.5 3.9 50.6 4.94E-09 5.94E-08 ACOT7 1-
1-
vi
ACOT7, HES2, PEX10, ESPN,
chr5:60,180,879-60,354,077 q32 Loss 173,198 57.6 3.9 53.6 9.72E-10
1.34E-08 TNFRSF25, PLEKHG5
NOL9, TAS1R1, ZBTB48,
chr5:60,354,077-60,427,986 q32 Loss 73,909 69.7 3.9 65.7 7.29E-13
4.00E-11 KLHL21
chr5:60,427,986-60,508,241 q32 Loss 80,255 69.7 1.3 68.4 8.56E-15
3.54E-12 PHF13, THAP3, DNAJC11
chr5:60,508,241-60,541,238 q32 Loss 32,997 66.7 1.3 65.4 6.42E-14
9.66E-12 DNAJC11, L0C102154443
chr5:60,541,238-60,684,920 q32 Loss
143,682 63.6 1.3 62.3 4.46E-13 3.02E-11 L0C102154443,
CAMTA1 P
chr5:60,684,920-60,852,161 q32 Loss 167,241 69.7 2.6 67.1
9.50E-14 1.12E-11 CAMTA1
r.,
chr5:60,852,161-61,036,261 q32 Loss
184,100 66.7 2.6 64.0 6.76E-13 3.91E-11 CAMTA1 u,
_.]
vi
_.]
o .
chr5:61,036,261-61,044,908 q32 Loss 8,647 66.7 3.9 62.7 4.94E-12
1.59E-10 CAMTA1
q32 -
,
chr5:61,044,908-61,141,116 q33 Loss
96,208 72.7 6.6 66.1 3.20E-12 1.22E-10 CAMTA1 ,
,
r.,
_.]
chr5:61,141,116-61,316,581 q33 Loss 175,465 75.8 11.8 63.9 1.05E-
10 1.93E-09 CAMTA1, L00607748
chr5:61,316,581-61,329,461 q33 Loss 12,880 66.7 6.6 60.1 1.33E-10
2.43E-09 CAMTA1
chr5:61,329,461-61,367,490 q33 Loss 38,029 63.6 6.6 57.1
7.51E-10 1.12E-08 CAMTA1
chr5:61,367,490-61,378,222 q33 Loss 10,732 57.6 6.6 51.0 1.92E-08 2.15E-
07 CAMTA1
chr5:61,378,222-61,394,755 q33 Loss 16,533 54.5 3.9 50.6 4.94E-09
5.94E-08 CAMTA1
chr5:61,394,755-61,402,826 q33 Loss
8,071 54.5 1.3 53.2 9.97E-11 1.85E-09 CAMTA1 1-d
n
chr5:61,812,024-61,901,869 q33 Loss 89,845 51.5 1.3 50.2 5.38E-10
8.10E-09 SLC45A1, RERE
chr5:62,305,554-62,381,943 q33 Loss
76,389 51.5 1.3 50.2 5.38E-10 8.10E-09 EN01, CA6 cp
t..)
o
chr5:62,381,943-62,555,678 q33 Loss
173,735 54.5 1.3 53.2 9.97E-11 1.85E-09 SLC2A5, GPR157,
H6PD 1-
--4
chr5:62,555,678-62,785,659 q33 Loss 229,981 57.6 1.3 56.3 1.75E-
11 4.38E-10 H6PD, SPSB1
.6.
SLC25A33, TMEM201, PIK3CD,
--4
1-
1-
chr5:62,785,659-63,063,012 q33 Loss 277,353 54.5 1.3 53.2 9.97E-11
1.85E-09 CLSTN1, CTNNBIP1
chr5:63,063,012-63,103,582 q33 Loss 40,570 57.6 1.3
56.3 1.75E-11 4.38E-10 CTNNBIP1
chr5:63,103,582-63,125,693 q33 Loss 22,111 60.6 1.3 59.3
2.88E-12 1.11E-10 LZIC, NMNAT1
0
chr5:63,125,693-63,258,956 q33 Loss 133,263 66.7
1.3 65.4 6.42E-14 9.66E-12 NMNAT1,
RBP7, UBE4B t..)
o
chr5:63,258,956-63,349,218 q33 Loss 90,262 63.6
1.3 62.3 4.46E-13 3.02E-11 UBE4B,
L0C102153284 1-
--4
t..)
chr5:63,349,218-63,514,128 q33 Loss 164,910 57.6
1.3 56.3 1.75E-11 4.38E-10 KIF1B
1-
o
1-
KIF1B, L0C100682843,
1-
vi
chr5:63,514,128-63,617,392 q33 Loss 103,264 63.6
1.3 62.3 4.46E-13 3.02E-11 L0C489647, GAS8, DBNDD1
DBNDD1, L0C102155075,
chr5:63,617,392-63,679,390 q33 Loss 61,998 60.6 1.3
59.3 2.88E-12 1.11E-10 CENPBD1, DEF8
chr5:63,679,390-63,712,820 q33 Loss 33,430 57.6 1.3
56.3 1.75E-11 4.38E-10 TUBB3, MC1R, TCF25
TCF25, SPIRE2, FANCA,
ZNF276, VPS9D1, SPATA2L,
chr5:63,712,820-63,882,807 q33 Loss 169,987 54.5
1.3 53.2 9.97E-11 1.85E-09
CDK10 P
CDK10, SPATA33, CHMP1A,
.
DPEP1, L0C102155777, CPNE7,
2
u,
,
o chr5:63,882,807-64,185,061 q33
Loss 302,254 57.6 1.3
56.3 1.75E-11 4.38E-10 RPL13, SPG7, ANKRD11 .
r.,
chr5:64,185,061-64,198,235 q33 Loss 13,174 57.6
2.6 54.9 1.56E-10 2.67E-09
ANKRD11 .
,
.3
,
chr5:64,198,235-64,262,537 q33 Loss 64,302 57.6
3.9 53.6 9.72E-10 1.34E-08
ANKRD11, SLC22A31, CDH15 ,
,
,
r.,
chr5:64,262,537-64,399,872 q33 Loss 137,335 60.6
3.9 56.7 1.79E-10 2.97E-09
CDH15, ACSF3, CAMTA1 ,
chr5:64,399,872-64,419,690 q33 Loss 19,818 57.6 3.9
53.6 9.72E-10 1.34E-08 CAMTA1
chr5:64,712,902-64,810,771 q33 Loss 97,869 60.6 6.6
54.0 3.94E-09 4.98E-08 ZC3H18
chr5:64,810,771-64,855,695 q33 Loss 44,924 60.6 5.3
55.3 9.21E-10 1.29E-08 ZFPM1
chr5:64,855,695-64,939,536 q33 Loss 83,841 63.6 6.6 57.1
7.51E-10 1.12E-08 ZFPM1, ZNF469
chr5:64,939,536-65,041,471 q33 Loss
101,935 66.7 7.9 58.8 5.39E-10 8.10E-09 1-d
chr5:65,041,471-65,142,070 q33 Loss 100,599 66.7 6.6 60.1 1.33E-10 2.43E-09
n
,-i
chr5:65,142,070-65,190,048 q33 Loss 47,978 63.6 2.6
61.0 4.45E-12 1.48E-10 BANP
cp
t..)
chr5:65,190,048-65,203,750 q33 Loss 13,702 60.6
2.6 58.0 2.72E-11 6.21E-10 BANP
=
1-
--4
BANP, CASA, SLC7A5,
o
chr5:65,203,750-65,420,725 q33 Loss
216,975 57.6 2.6 54.9 1.56E-10 2.67E-09 KLHDC4 .6.
--4
1-
chr5:65,420,725-65,513,651 q33 Loss 92,926 60.6
2.6 58.0 2.72E-11 6.21E-10 KLHDC4,
JPH3 1-
chr5:65,513,651-65,596,667 q33 Loss 83,016 60.6 1.3
59.3 2.88E-12 1.11E-10 JPH3
L0C102152720, ZCCHC14,
0
MAP1LC3B, FBX031,
t..)
chr5:65,596,667-65,928,870 q33 Loss 332,203 63.6
1.3 62.3 4.46E-13 3.02E-11
L00609239, L0C102153014 o
1-
--4
t..)
1-
o
L0C102153014, LZIC, NMNAT1,
1-
1-
vi
LOC102153168, L0C102153219,
FOXL1, FOXC2, L0C102153392,
MTHFSD, FOXF1,
chr5:65,928,870-66,430,556 q33 Loss 501,686 63.6
2.6 61.0 4.45E-12 1.48E-10 L0C102153633
chr5:66,430,556-66,532,101 q33 Loss 101,545 60.6
2.6 58.0 2.72E-11 6.21E-10
chr5:66,532,101-66,660,467 q33 Loss 128,366 57.6 2.6 54.9 1.56E-10 2.67E-09
TUBB3, SPIRE2, IRF8,
chr5:66,660,467-66,940,063 q33 Loss 279,596 57.6
1.3 56.3 1.75E-11 4.38E-10
L0C489654, COX4I1, EMC8 P
chr5:66,940,063-66,978,728 q33 Loss 38,665 54.5 1.3
53.2 9.97E-11 1.85E-09 C5H16orf74
o
r.,
u,
o chr5:66,978,728-67,024,605 q33
Loss 45,877 60.6 6.6
54.0 3.94E-09 4.98E-08 GINS2, KIAA0182 ,
,
1-
.
r.,
chr5:67,024,605-67,107,364 q33 Loss
82,759 60.6 7.9 52.7 1.46E-08 1.64E-07 KIAA0182 .. .
,
.3
,
chr5:67,107,364-67,134,097 q33 Loss
26,733 60.6 5.3 55.3 9.21E-10 1.29E-08 KIAA0182 ,
,
,
r.,
chr5:67,134,097-67,358,286 q33 Loss 224,189 54.5
3.9 50.6 4.94E-09 5.94E-08
KIAA0182 ,
chr5:67,358,286-67,376,754 q33 Loss
18,468 54.5 2.6 51.9 8.40E-10 1.18E-08
chr5:67,464,481-67,505,212 q33 Loss 40,731 57.6 2.6
54.9 1.56E-10 2.67E-09 FAM92B, KIAA0513
chr5:67,505,212-67,694,200 q33 Loss 188,988 60.6
2.6 58.0 2.72E-11 6.21E-10 KIAA0513, ZDHHC7, CRISPLD2
CRISPLD2, USP10, KLHL36,
1-d
COTL1, L0C102152359, TLDC1,
n
ATP2C2, L0C102152587,
WFDC1, KCNG4, ADAD2,
cp
t..)
chr5:67,694,200-68,175,856 q33 Loss 481,656 57.6
1.3 56.3 1.75E-11 4.38E-10 TAF1C
o
1-
--4
TAF1C, DNAAF1, HSDL1,
=
chr5:68,175,856-68,238,327 q33 Loss 62,471 60.6
1.3 59.3 2.88E-12 1.11E-10 MBTPS1
.6.
--4
1-
chr5:68,238,327-68,254,252 q33 Loss 15,925 63.6
1.3 62.3 4.46E-13 3.02E-11 MBTPS1
1-
chr5:68,254,252-68,321,004 q33 Loss 66,752 69.7 6.6 63.1 2.16E-11
5.35E-10 MBTPS1, SLC38A8, NECAB2
chr5:68,321,004-68,330,658 q33 Loss 9,654 66.7 3.9 62.7 4.94E-12
1.59E-10 NECAB2
0
chr5:68,330,658-68,354,363 q33 Loss
23,705 57.6 3.9 53.6 9.72E-10 1.34E-08 NECAB2, OSGIN1
t..)
o
chr5:68,354,363-68,452,845 q33 Loss
98,482 57.6 1.3 56.3 1.75E-11 4.38E-10 OSGIN1, MLYCD 1-
--4
t..)
chr5:68,452,845-68,492,076 q33 Loss
39,231 66.7 1.3 65.4 6.42E-14 9.66E-12 HSBP1 1-
o
1-
chr5:68,492,076-68,596,350 q33 Loss
104,274 69.7 1.3 68.4 8.56E-15 3.54E-12 CDH13 1-
vi
chr5:68,596,350-68,755,793 q33 Loss 159,443 60.6 1.3 59.3 2.88E-12
1.11E-10 CDH13
chr5:68,755,793-68,929,916 q33 Loss 174,123 57.6 1.3 56.3 1.75E-11
4.38E-10 CDH13
chr5:68,929,916-69,299,668 q33 Loss 369,752 54.5 1.3 53.2 9.97E-11
1.85E-09 CDH13, L0C102153763
q33 -
chr5:69,299,668-69,397,643 q34 Loss 97,975 57.6 1.3 56.3 1.75E-11
4.38E-10 CDH13
chr5:69,397,643-69,460,633 q34 Loss 62,990 60.6 1.3 59.3 2.88E-12
1.11E-10 CDH13
chr5:69,460,633-69,727,892 q34 Loss 267,259 63.6
1.3 62.3 4.46E-13 3.02E-11 CDH13 P
chr5:69,727,892-69,811,895 q34 Loss 84,003 60.6 1.3 59.3 2.88E-12
1.11E-10 L0C102153888
r.,
u,
o
LOC102153888, LOC100686562,
,
,
t..)
.
chr5:69,811,895-69,912,645 q34 Loss
100,750 63.6 1.3 62.3 4.46E-13 3.02E-11 L0C102154063,
MPHOSPH6 "
,
.3
chr5:69,912,645-69,976,616 q34 Loss
63,971 66.7 1.3 65.4 6.42E-14 9.66E-12 HSD17B2 '
,
,
,
chr5:69,976,616-70,048,532 q34 Loss
71,916 63.6 1.3 62.3 4.46E-13 3.02E-11 HSD17B2, SDR42E1
" ,
chr5:70,048,532-70,118,809 q34 Loss 70,277 60.6 1.3 59.3 2.88E-12
1.11E-10 PLCG2
chr5:70,118,809-70,256,802 q34 Loss 137,993 51.5 1.3 50.2 5.38E-10
8.10E-09 PLCG2, L0C102154738, CMIP
chr5:70,256,802-70,325,943 q34 Loss 69,141 57.6 1.3 56.3 1.75E-11
4.38E-10 CMIP
chr5:70,325,943-70,419,585 q34 Loss 93,642 54.5 1.3 53.2 9.97E-11
1.85E-09 CMIP
chr5:70,419,585-70,516,517 q34 Loss 96,932 51.5 1.3 50.2 5.38E-10
8.10E-09 L0C102154784
1-d
n
,-i
GAN, L0C102154971, BCM01,
PKD1L2, GCSH, C5H16orf46,
cp
t..)
chr5:70,561,384-71,093,340 q34 Loss
531,956 51.5 1.3 50.2 5.38E-10 8.10E-09 ATMIN, CENPN, CMC2,
CDYL2 o
1-
--4
CDYL2, DYNLRB2,
chr5:71,093,340-71,434,076 q34 Loss
340,736 54.5 1.3 53.2 9.97E-11 1.85E-09 L0C102156069 .6.
--4
1-
1-
L0C102156069, L0C102156020,
chr5:71,434,076-71,693,390 q34 Loss 259,314 51.5 1.3 50.2 5.38E-10 8.10E-
09 HSBP1
chr5:72,431,034-72,750,582 q34 Loss
319,548 54.5 1.3 53.2 9.97E-11 1.85E-09 WWOX 0
t..)
o
chr5:72,750,582-72,808,838 q34 Loss
58,256 51.5 1.3 50.2 5.38E-10 8.10E-09 WWOX 1-
--4
chr5:73,342,822-73,464,745 q34 Loss
121,923 54.5 1.3 53.2 9.97E-11 1.85E-09 VAT1L t..)
1-
o
chr5:73,464,745-73,541,058 q34 Loss
76,313 57.6 1.3 56.3 1.75E-11 4.38E-10 VAT1L, NUDT7 1-
1-
vi
chr5:73,541,058-73,686,949 q34 Loss 145,891 54.5 1.3 53.2 9.97E-11
1.85E-09
chr5:73,686,949-73,843,644 q34 Loss 156,695 57.6 1.3 56.3 1.75E-11
4.38E-10 ADAMTS18
chr5:73,843,644-73,896,791 q34 Loss 53,147 54.5 1.3 53.2 9.97E-11
1.85E-09 ADAMTS18
chr5:74,982,757-75,025,354 q34 Loss 42,597 54.5 1.3 53.2 9.97E-11
1.85E-09
TERF2IP, KARS, ADAT1,
chr5:75,025,354-75,234,343 q34 Loss 208,989 57.6 1.3 56.3 1.75E-11
4.38E-10 GABARAPL2
ADAT1, GAB ARAPL2,
P
chr5:75,234,343-75,248,653 q34 Loss
14,310 54.5 1.3 53.2 9.97E-11 1.85E-09 TMEM231
TMEM231, CHST6, TMEM170A,
u,
,
o ,
chr5:75,248,653-75,398,797 q34 Loss
150,144 51.5 1.3 50.2 5.38E-10 8.10E-09 CFDP1 .
r.,
CFDP1, BCAR1, LOC610373,
,
.3
,
chr5:75,398,797-75,540,382 q34 Loss
141,585 57.6 1.3 56.3 1.75E-11 4.38E-10 L0C479649,
CTRB2 ,
,
chr5:75,540,382-75,641,073 q34 Loss
100,691 51.5 1.3 50.2 5.38E-10 8.10E-09 ZFP1, LDHD,
ZNRF1 ,
chr5:75,641,073-75,717,063 q34 Loss 75,990 54.5 1.3 53.2 9.97E-11
1.85E-09 ZNRF1, WDR59
chr5:75,717,063-76,023,587 q34 Loss 306,524 63.6 1.3 62.3 4.46E-13
3.02E-11 WDR59, FA2H, RFWD3, GLG1
chr5:76,023,587-76,053,502 q34 Loss 29,915 60.6 1.3 59.3 2.88E-12 1.11E-
10 GLG1
chr5:76,053,502-76,096,004 q34 Loss 42,502 57.6 1.3 56.3 1.75E-11 4.38E-
10 GLG1
chr5:76,096,004-76,152,809 q34 Loss
56,805 54.5 1.3 53.2 9.97E-11 1.85E-09 GLG1 1-d
GLG1, L0C100688256, PDPR,
n
1-i
chr5:76,152,809-76,280,694 q34 Loss 127,885 57.6 1.3 56.3 1.75E-11
4.38E-10 CLEC18A, L00610465
cp
t..)
L00610465, EXOSC6, AARS,
o
1-
DDX19B, L0C102154605,
--4
o
chr5:76,280,694-76,401,056 q34 Loss
120,362 54.5 1.3 53.2 9.97E-11 1.85E-09 DDX19A, ST3GAL2
c,.)
.6.
--4
chr5:76,401,056-76,426,024 q34 Loss 24,968 60.6
1.3 59.3 2.88E-12 1.11E-10 ST3GAL2 1-
1-
chr5:76,426,024-76,480,400 q34 Loss 54,376 63.6 1.3 62.3 4.46E-13
3.02E-11 ST3GAL2, FUK, COG4
chr5:76,480,400-76,509,943 q34 Loss 29,543 66.7 1.3 65.4 6.42E-14
9.66E-12 COG4, SF3B3
chr5:76,509,943-76,722,201 q34 Loss 212,258 69.7 1.3 68.4 8.56E-15
3.54E-12 SF3B3, IL34, MTSS1L, VAC14
0
chr5:76,722,201-76,779,204 q34 Loss
57,003 66.7 1.3 65.4 6.42E-14 9.66E-12 VAC14, HYDIN t..)
o
chr5:76,779,204-76,903,015 q34 Loss 123,811 63.6
1.3 62.3 4.46E-13 3.02E-11 HYDIN 1-
--4
t..)
chr5:76,903,015-77,112,947 q34 Loss
209,932 57.6 1.3 56.3 1.75E-11 4.38E-10 HYDIN, L0C102156275
1-
o
1-
1-
vi
chr5:77,112,947-77,205,471 q34 Loss 92,524 60.6 1.3 59.3 2.88E-12
1.11E-10 CMTR2, L0C102156521, CALB2
chr5:77,205,471-77,241,951 q34 Loss 36,480 57.6 1.3 56.3 1.75E-11
4.38E-10 L0C479662
chr5:77,241,951-77,306,877 q34 Loss 64,926 51.5 1.3 50.2 5.38E-10
8.10E-09 L0C479662, ZNF23, ZNF19
chr5:77,520,487-77,574,687 q34 Loss 54,200 51.5 1.3 50.2 5.38E-10
8.10E-09 AP1G1
q34 -
chr5:77,574,687-77,619,106 q35 Loss 44,419 54.5 1.3 53.2 9.97E-11
1.85E-09 AP1G1, ATXN1L
ATXN1L, ZNF821, IST1,
p
PKD1L3, DHODH, L00612963,
2
chr5:77,619,106-77,799,802 q35 Loss
180,696 57.6 1.3 56.3 1.75E-11 4.38E-10 L0C479668 2
u,
_.]
o _.]
.6.
.
r.,
chr5:77,799,802-77,820,747 q35 Loss
20,945 54.5 1.3 53.2 9.97E-11 1.85E-09 L00612963,
L0C479668, DHX38 ,
.3
,
,
chr5:77,820,747-78,019,912 q35 Loss
199,165 51.5 1.3 50.2 5.38E-10 8.10E-09 DHX38, PMFBP1
,
_.]
chr5:78,019,912-78,134,883 q35 Loss 114,971 54.5 1.3 53.2 9.97E-11
1.85E-09
chr5:78,459,732-78,473,806 q35 Loss 14,074 63.6 1.3 62.3 4.46E-13 3.02E-
11 ZFHX3
chr5:78,473,806-78,600,625 q35 Loss 126,819 66.7 1.3 65.4 6.42E-14
9.66E-12 ZFHX3
chr5:78,600,625-78,710,020 q35 Loss 109,395 63.6 1.3 62.3 4.46E-13 3.02E-
11 ZFHX3
chr5:78,710,020-78,909,765 q35 Loss 199,745 57.6 1.3 56.3 1.75E-11
4.38E-10 ZFHX3, L0C102153471
chr5:78,909,765-79,145,756 q35 Loss
235,991 54.5 1.3 53.2 9.97E-11 1.85E-09 L0C102153471 1-d
n
chr5:79,145,756-79,179,389 q35 Loss 33,633 51.5 1.3 50.2 5.38E-10
8.10E-09
chr5:80,595,921-80,616,230 q35 Loss 20,309 51.5 0.0 51.5 3.58E-11
7.73E-10 TANG06
cp
t..)
chr5:80,616,230-80,765,577 q35 Loss
149,347 51.5 1.3 50.2 5.38E-10 8.10E-09 TANG06, CDH1 o
1-
--4
chr5:80,765,577-80,799,104 q35 Loss
33,527 54.5 1.3 53.2 9.97E-11 1.85E-09 CDH1 =
.6.
chr5:80,799,104-80,804,686 q35 Loss
5,582 57.6 1.3 56.3 1.75E-11 4.38E-10 CDH1 --4
1-
1-
chr5:80,804,686-80,914,064 q35 Loss 109,378 66.7 1.3 65.4 6.42E-14
9.66E-12 CDH1, CDH3, ZFP90
chr5:80,914,064-81,187,351 q35 Loss 273,287 63.6 1.3 62.3 4.46E-13
3.02E-11 ZFP90, SMPD3, PRMT7
chr5:81,187,351-81,255,412 q35 Loss 68,061 57.6 1.3 56.3 1.75E-11
4.38E-10 PRMT7, SLC7A60S, SLC7A6
0
chr5:81,569,146-81,577,803 q35 Loss
8,657 51.5 1.3 50.2 5.38E-10 8.10E-09 PSKH1 tµ.)
o
chr5:81,577,803-81,609,089 q35 Loss
31,286 54.5 1.3 53.2 9.97E-11 1.85E-09 PSKH1, NRN1L, EDC4
1-
-4
tµ.)
EDC4, NUTF2, THAP11, CENPT,
1¨
o
chr5:81,609,089-81,680,133 q35 Loss
71,044 57.6 1.3 56.3 1.75E-11 4.38E-10 TSNAXIP1, RANBP10
1-
1¨
vi
RANBP10, GFOD2, C5H16orf86,
ENKD1, PARD6A, ACD, RLTPR,
chr5:81,680,133-81,863,442 q35 Loss 183,309 60.6 1.3 59.3 2.88E-12
1.11E-10 CTCF
CTCF, FAM65A, AGRP,
ATP6V0D1, HSD11B 2, ZDHHC1 ,
chr5:81,863,442-82,011,077 q35 Loss 147,635 57.6 1.3 56.3 1.75E-11
4.38E-10 TPPP3, LRRC36
TPPP3, LRRC36, KCTD19,
P
PLEKHG4, SLC9A5, FHOD1,
o
TMEM208, LRRC29,
,
o ,
vi
L0C102155969, ELM03, E2F4, .
EXOC3L1, KIAA0895L, NOL3,
o
,
.3
HSF4, FBXL8, TRADD,
'
,
,
chr5:82,011,077-82,282,553 q35 Loss 271,476 54.5 1.3 53.2 9.97E-11
1.85E-09 B3GNT9, C5H16orf70, CBFB
,
CBFB, CES2, FAM96B, RRAD,
CDH16, PDP2, CA7, NAE1,
chr5:82,282,553-82,519,611 q35 Loss 237,058 57.6 1.3 56.3 1.75E-11
4.38E-10 CCDC79
chr5:82,519,611-82,616,288 q35 Loss 96,677 54.5 1.3 53.2 9.97E-11
1.85E-09 CCDC79, DYNC1LI2
CMTM4, CMTM3, L0C479694,
chr5:82,616,288-82,766,028 q35 Loss 149,740 57.6 1.3 56.3 1.75E-11
4.38E-10 CMTM1, CKLF, TK2
1-d
chr5:82,766,028-82,782,187 q35 Loss 16,159 57.6 5.3 52.3
4.74E-09 5.74E-08 BEAN1 n
,-i
chr5:82,782,187-82,798,102 q35 Loss 15,915 60.6 5.3 55.3
9.21E-10 1.29E-08 BEAN1
cp
tµ.)
chr5:82,798,102-82,836,281 q35 Loss
38,179 66.7 .. 9.2 57.5 1.95E-09 2.61E-08 BEAN1, CDH5 .. o
1-
-4
chr5:82,836,281-82,845,474 q35 Loss 9,193 69.7
9.2 60.5 3.47E-10 5.61E-09 CDH5 o
chr5:82,845,474-83,012,607 q35 Loss
167,133 72.7 9.2 63.5 5.64E-11 1.21E-09 CDH5 .6.
-4
1¨
chr5:83,012,607-83,027,347 q35 Loss 14,740 69.7 9.2 60.5
3.47E-10 5.61E-09 1¨
,
chr5:83,027,347-83,075,902 q35 Loss
48,555 63.6 3.9 59.7 3.09E-11 6.77E-10
chr5:83,075,902-83,178,724 q35 Loss 102,822 63.6
2.6 61.0 4.45E-12 1.48E-10
0
chr5:83,178,724-83,387,764 q35 Loss 209,040 60.6
1.3 59.3 2.88E-12 1.11E-10 t..)
o
chr5:83,387,764-83,589,799 q35 Loss 202,035 63.6
1.3 62.3 4.46E-13 3.02E-11 1-
--4
t..)
chr5:83,589,799-83,599,745 q35 Loss 9,946 60.6
1.3 59.3 2.88E-12 1.11E-10 1-
o
1-
chr5:83,599,745-83,708,089 q35 Loss 108,344 54.5
1.3 53.2 9.97E-11 1.85E-09 1-
vi
q35 -
chr5:83,708,089-84,025,109 q36 Loss 317,020 51.5
1.3 50.2 5.38E-10 8.10E-09 L0C102152798, CDH11
chr5:84,849,361-85,134,032 q36 Loss 284,671 51.5
1.3 50.2 5.38E-10 8.10E-09
chr5:85,324,982-85,369,946 q36 Loss
44,964 54.5 2.6 51.9 8.40E-10 1.18E-08
chr5:86,316,203-86,469,234 q36 Loss 153,031 54.5
2.6 51.9 8.40E-10 1.18E-08 L0C102153075, CDH8
chr5:87,498,411-87,778,294 q36 Loss 279,883 54.5 2.6 51.9 8.40E-10 1.18E-08
chr5:87,778,294-87,872,957 q36 Loss 94,663 60.6
2.6 58.0 2.72E-11 6.21E-10 L0C479698 P
chr5:87,872,957-88,011,870 q36 Loss 138,913 63.6
2.6 61.0 4.45E-12 1.48E-10 L0C479698
2
u,
o chr5:88,011,870-88,125,949 q36 Loss
114,079 60.6 2.6 58.0 2.72E-
11 6.21E-10 ,
,
o .
chr5:88,125,949-88,139,142 q36 Loss
13,193 57.6 2.6 54.9 1.56E-10 2.67E-09
o
,
.3
chr5:88,139,142-88,428,223 q36 Loss 289,081 54.5 2.6 51.9 8.40E-10 1.18E-08
,
,
,
chr5:88,428,223-88,692,989 q36 Loss 264,766 57.6 2.6 54.9 1.56E-10 2.67E-09
,
chr5:88,692,989-88,915,250 q36 Loss 222,261 63.6 5.3 58.4 1.67E-10 2.84E-09
chr31:3,574,978-3,606,485 q11 Gain 31,507 54.5
3.9 50.6 4.94E-09 4.90E-07
chr31:3,606,485-3,713,760 ql 1 Gain 107,275 57.6
3.9 53.6 9.72E-10 2.43E-07
chr31:3,713,760-3,927,488
q11 Gain 213,728 57.6 5.3 52.3 4.74E-09 4.90E-07
L0C102152860, RPL6P,
chr31:4,494,597-6,181,347 q12 Gain 1,686,750
57.6 5.3 52.3 4.74E-09 4.90E-07 L0C478380 1-d
n
1-i
ROB01, L0C102153268,
chr31:6,742,546-8,389,449 q12 Gain 1,646,903
57.6 5.3 52.3 4.74E-09 4.90E-07 L0C102153225 cp
t..)
o
chr31:8,389,449-8,517,658 q12 Gain 128,209 57.6
6.6 51.0 1.92E-08 1.26E-06 ROB01 1-
--4
o
chr31:8,517,658-8,645,671 q12 Gain 128,013 60.6
6.6 54.0 3.94E-09 4.90E-07 ROB01 c,.)
.6.
--4
chr31:8,645,671-8,751,964 q12 Gain
106,293 60.6 5.3 55.3 9.21E-10 2.43E-07 1-
1-
chr31:8,751,964-9,390,589
q12 Gain 638,625 57.6 5.3 52.3 4.74E-09 4.90E-07
chr31:9,390,589-9,821,887 q12 Gain 431,298 60.6 5.3 55.3 9.21E-
10 2.43E-07 L0C487691
chr31:9,821,887-9,909,162 q12 Gain 87,275 63.6 5.3 58.4 1.67E-
10 2.43E-07 L0C487691
0
chr31:9,909,162-9,996,577 q12 Gain 87,415 60.6 5.3 55.3 9.21E-
10 2.43E-07 L0C478381, L0C487691 t..)
o
chr31:9,996,577-10,721,940 q12 Gain 725,363 57.6 5.3 52.3
4.74E-09 4.90E-07 L0C487691, L0C102153311 1-
--4
t..)
chr31:10,721,940-10,990,663 q12 Gain 268,723 60.6 5.3 55.3 9.21E-
10 2.43E-07 L0C102153814 1-
o
1-
LIPI, RBM11, L0C102154069,
1-
vi
L0C478384, L0C102153846,
12
q -
HSPA13, L0C102154431,
chr31:10,990,663-11,662,746 q13 Gain 672,083 60.6 6.6 54.0 3.94E-
09 4.90E-07 SAMSN1
chr31:11,662,746-11,814,984 q13 Gain 152,238 60.6 5.3 55.3
9.21E-10 2.43E-07 SAMSN1, L0C100684485
chr31:11,814,984-12,217,908 q13 Gain 402,924 63.6 6.6 57.1 7.51E-
10 2.43E-07 NRIP1
chr31:12,217,908-12,526,736 q13 Gain 308,828 60.6 6.6 54.0
3.94E-09 4.90E-07 L0C102155616, L0C102154762
chr31:12,526,736-12,876,407 q13 Gain 349,671 60.6 5.3 55.3 9.21E-
10 2.43E-07 USP25 P
chr31:12,876,407-12,941,599 q13 Gain 65,192 57.6 5.3 52.3 4.74E-09
4.90E-07 .
2
o chr31:12,941,599-13,157,803
q13 Gain 216,204 57.6 6.6 51.0
1.92E-08 1.26E-06 L0C102154980 u,
_.]
_.]
--4
.
chr31:13,157,803-13,956,866 q13 Gain 799,063 57.6 5.3 52.3
4.74E-09 4.90E-07 L0C102154980, L0C102155084
,
.3
CXADR, L0C487695,
,
,
,
chr31:13,956,866-14,419,403 q13 Gain 462,537 57.6 6.6 51.0
1.92E-08 1.26E-06 L0C102155790, C31H21orf91
_.]
chr31:14,419,403-14,964,747 q13 Gain 545,344 57.6 5.3 52.3
4.74E-09 4.90E-07 CHODL, TMPRSS15
chr31:14,964,747-15,776,949 q13 Gain 812,202 60.6 5.3 55.3 9.21E-10
2.43E-07
chr31:15,776,949-16,031,595 q13 Gain 254,646 57.6 3.9 53.6 9.72E-
10 2.43E-07
chr31:16,031,595-16,147,594 q13 Gain 115,999 60.6 3.9 56.7 1.79E-10 2.43E-07
q13 -
chr31:16,147,594-16,653,042 q14 Gain 505,448 60.6 5.3 55.3 9.21E-
10 2.43E-07 L0C102156052 1-d
n
chr31:16,653,042-16,851,394 q14 Gain 198,352 63.6 5.3 58.4 1.67E-10 2.43E-07
chr31:16,851,394-17,451,755 q14 Gain 600,361 60.6 5.3 55.3
9.21E-10 2.43E-07 EEF1A1, NCAM2 cp
t..)
chr31:17,451,755-17,748,133 q14 Gain 296,378 60.6 6.6 54.0 3.94E-
09 4.90E-07 o
1-
--4
chr31:17,748,133-17,766,239 q14 Gain 18,106 57.6 6.6 51.0 1.92E-08
1.26E-06
.6.
chr31:17,766,239-18,277,334 q14 Gain 511,095 57.6 5.3 52.3 4.74E-09 4.90E-07
--4
1-
1-
chr31:19,317,125-19,482,884 q14 Gain 165,759 57.6 5.3 52.3 4.74E-09
4.90E-07
chr31:19,889,449-19,909,607 q14 Gain
20,158 57.6 6.6 51.0 1.92E-08 1.26E-06
chr31:19,909,607-20,085,761 q14 Gain 176,154 60.6 6.6
54.0 3.94E-09 4.90E-07 L0C102156356, LOC102156405
0
chr31:20,085,761-20,166,178 q14 Gain
80,417 60.6 5.3 55.3 9.21E-10 2.43E-07 tµ.)
o
chr31:20,166,178-20,180,593 q14 Gain
14,415 57.6 5.3 52.3 4.74E-09 4.90E-07
-4
tµ.)
chr31:20,869,268-21,005,369 q14 Gain
136,101 57.6 5.3 52.3 4.74E-09 4.90E-07
o
1-,
chr31:21,005,369-21,031,105 q14 Gain
25,736 57.6 6.6 51.0 1.92E-08 1.26E-06
vi
MRPL39, JAM2, ATP5J, GABPA,
chr31:21,031,105-21,257,672 q14 Gain 226,567 60.6
6.6 54.0 3.94E-09 4.90E-07 L0C102156977
chr31:21,257,672-21,441,947 q14 Gain 184,275 57.6
6.6 51.0 1.92E-08 1.26E-06 APP
chr31:21,441,947-21,622,269 q14 Gain 180,322 60.6 6.6
54.0 3.94E-09 4.90E-07 APP, LOC102151217
14
q -
chr31:21,622,269-21,749,206 q15.1 Gain 126,937 57.6
6.6 51.0 1.92E-08 1.26E-06 L0C102151217 P
LOC102151217, CYYR1,
2
chr31:21,749,206-22,049,143 q15.1 Gain 299,937 57.6
5.3 52.3 4.74E-09 4.90E-07 L0C487711 2
u,
,
c:
,
oe
L0C102151271, ADAMTS1, .
r.,
chr31:22,049,143-22,759,280 q15.1 Gain 710,137 60.6
6.6 54.0 3.94E-09 4.90E-07
ADAMTS5, L0C102151422 ,
.3
,
,
,
chr31:22,759,280-23,102,209 q15.1 Gain 342,929 63.6 6.6 57.1 7.51E-10 2.43E-07
,
chr31:23,102,209-23,622,081 q15.1 Gain 519,872 60.6
6.6 54.0 3.94E-09 4.90E-07
LOC102151634, L0C487715,
chr31:23,622,081-23,967,926 q15.1 Gain 345,845 57.6
6.6 51.0 1.92E-08 1.26E-06 LTN1
LTN1, RWDD2B, USP16, CCT8,
chr31:23,967,926-24,163,030 q15.1 Gain 195,104 60.6
6.6 54.0 3.94E-09 4.90E-07 C31H21orf7 Iv
n
,-i
chr31:24,163,030-24,505,719 q15.1 Gain 342,689 60.6 5.3
55.3 9.21E-10 2.43E-07 C31H21orf7, BACH1, GRIK1
cp
tµ.)
o
1-,
-4
chr31:24,505,719-24,642,006 q15.1 Gain 136,287 60.6
6.6 54.0 3.94E-09 4.90E-07 GRIK1 o
.6.
-4
1-,
1-,
GRIK1, CLDN17,
L0C102153451, CLDN8,
0
KRTAP24-1, L0C102153645,
t..)
o
KRTAP26-1, KRTAP27-1,
1-
--4
KRTAP23-1, KRTAP13-2,
t..)
1-
LOC100686187, LOC100686265,
o
1-
1-
LOC100686358, LOC100686441,
vi
chr31:24,642,006-25,422,064 q15.1 Gain 780,058 60.6 5.3
55.3 9.21E-10 2.43E-07 L0C100686522, KRTAP19-4
L0C102151701, L0C102151782,
L0C100686828, LOC102151849,
KRTAP8-1, KRTAP7-1,
chr31:25,422,064-26,015,104 q15.1 Gain 593,040 60.6 6.6
54.0 3.94E-09 4.90E-07 KRTAP11-1
chr31:26,015,104-26,207,846 q15.1 Gain 192,742 57.6
6.6 51.0 1.92E-08 1.26E-06
TIAM1 P
chr31:26,366,005-26,510,397 q15.1 Gain 144,392 57.6 6.6
51.0 1.92E-08 1.26E-06 TIAM1
u,
_.]
o _.]
o .
r.,
chr31:26,510,397-26,548,528 q15.1 Gain 38,131 63.6 7.9 55.7
2.91E-09 4.90E-07 SOD1, SCAF4 ,
.3
,
,
,
,
r.,
chr31:26,548,528-26,617,285 q15.1 Gain 68,757 63.6 6.6
57.1 7.51E-10 2.43E-07 SCAF4, L0C102155229
chr31:26,617,285-26,647,666 q15.1 Gain 30,381 60.6 6.6
54.0 3.94E-09 4.90E-07 L0C102155229
chr31:27,306,560-27,479,144 q15.1 Gain 172,584 60.6 6.6
54.0 3.94E-09 4.90E-07 SYNJ1, PAXBP1, C31H21orf62
chr31:27,479,144-27,563,388 q15.1 Gain 84,244 57.6
6.6 51.0 1.92E-08 1.26E-06
C31H21orf62 1-d
n
L0C102151345, L0C100856276,
chr31:27,993,323-28,087,673 q15.1 Gain 94,350 66.7 14.5 52.2 1.36E-
07 4.48E-06 L0C100856546
cp
t..)
L0C100856546, L0C100856290,
o
1-
--4
chr31:28,087,673-28,150,222 q15.1 Gain 62,549 69.7 14.5 55.2 2.89E-
08 1.48E-06 L0C100856570 o
.6.
--4
1-
1-
L0C100856570, L0C100856585,
DONSON, L0C100856647,
L0C100856635, L0C102153983,
0
t..)
chr31:28,150,222-28,597,951 q15.1 Gain 447,729 66.7 6.6
60.1 1.33E-10 2.43E-07 ATP50, L0C102152930
1-
--4
t..)
1-
chr31:28,597,951-28,648,317 q15.1 Gain 50,366 63.6
6.6 57.1 7.51E-10 2.43E-07 L0C100856716
1-
1-
vi
IFNAR2, ILlORB ,
L0C102153360, L00609830,
L0C102153793, L0C487739,
L0C478405, DNAJC28,
L0C487740, SON, L0C478407,
CRYZL1, ITSN1,
LOC100688175, LOC100688250,
L0C100855541, LOC102155085,
p
SLC5A3, MRPS6, KCNE2,
2
chr31:28,648,317-29,782,326 q15.1 Gain 1,134,009 60.6
6.6 54.0 3.94E-09 4.90E-07 FAM165B
,
--4
,
o
FAM165B, LOC102155325, .
r.,
L0C102155418, L0C487743,
,
.3
,
chr31:29,782,326-29,925,895 q15.1 Gain
143,569 66.7 10.5 56.1 6.34E-09 6.02E-07 RCAN1 ,
,
,
chr31:29,925,895-29,968,341 q15.1 Gain
42,446 63.6 10.5 53.1 3.13E-08 1.59E-06 RCAN1
chr31:29,985,712-29,999,819 q15.1 Gain 14,107 60.6
9.2 51.4 4.78E-08 2.39E-06 RCAN1
chr31:29,999,819-30,295,496 q15.1 Gain 295,677 60.6 6.6
54.0 3.94E-09 4.90E-07 RCAN1, CLIC6, RUNX1
1-d
n
chr31:30,295,496-30,328,439 q15.1 Gain 32,943 63.6
6.6 57.1 7.51E-10 2.43E-07 RUNX1
cp
t..)
chr31:30,328,439-30,530,533 q15.1 Gain 202,094 60.6
6.6 54.0 3.94E-09 4.90E-07 RUNX1 =
1-
--4
o
chr31:30,530,533-30,596,729 q15.1 Gain
66,196 63.6 6.6 57.1 7.51E-10 2.43E-07 .6.
--4
1-
1-
chr31:30,596,729-30,782,046 q15.1 Gain 185,317 66.7
6.6 60.1 1.33E-10 2.43E-07 L0C102156175
chr31:30,782,046-30,975,922 q15.1 Gain 193,876 63.6 6.6 57.1 7.51E-10 2.43E-07
0
t..)
chr31:30,975,922-31,201,087 q15.1 Gain 225,165 63.6
5.3 58.4 1.67E-10 2.43E-07
L00609892 o
1-
--4
t..)
1-
chr31:31,201,087-31,227,785 q15.1 Gain
26,698 60.6 5.3 55.3 9.21E-10 2.43E-07
1-
1-
vi
chr31:31,227,785-31,294,473 q15.1 Gain
66,688 57.6 5.3 52.3 4.74E-09 4.90E-07 SETD4
chr31:31,889,542-32,205,283 q15.1 Gain 315,741 60.6 6.6
54.0 3.94E-09 4.90E-07 SIM2, HLCS, DSCR6
q15.1
PIGP, TTC3, LOC102151700,
chr31:32,205,283-32,543,860 q15.2 Gain 338,577 63.6
6.6 57.1 7.51E-10 2.43E-07
DSCR3, DYRK1A P
DYRK1A, L0C102152474,
.
r.,
chr31:32,543,860-32,733,279 q15.2 Gain 189,419 57.6
6.6 51.0 1.92E-08 1.26E-06
L0C102151965 u,
_.]
--4
_.]
r.,
chr31:34,066,143-34,101,861 q15.2 Gain 35,718 60.6
9.2 51.4 4.78E-08 2.39E-06
,
.3
,
,
,
,
r.,
chr31:34,101,861-34,121,248 q15.2 Gain 19,387 63.6 9.2
54.4 1.00E-08 9.41E-07
chr31:34,121,248-34,151,499 q15.2 Gain 30,251 66.7 9.2
57.5 1.95E-09 4.59E-07 BRWD1
BRWD1, L0C100685290,
chr31:34,151,499-34,325,320 q15.2 Gain 173,821 63.6 6.6
57.1 7.51E-10 2.43E-07 HMGN1
q15.2
1-d
n
B3GALT5, IGSF5, PCP4,
chr31:34,325,320-34,968,541 q15.3 Gain 643,221 60.6
6.6 54.0 3.94E-09 4.90E-07 DSCAM
cp
t..)
o
1-
--4
chr31:34,968,541-35,026,069 q15.3 Gain 57,528 57.6
6.6 51.0 1.92E-08 1.26E-06 DSCAM
o
.6.
--4
1-
chr31:35,212,014-35,436,330 q15.3 Gain 224,316 57.6
5.3 52.3 4.74E-09 4.90E-07 DSCAM
1-
chr31:35,436,330-35,611,912 q15.3 Gain
175,582 57.6 6.6 51.0 1.92E-08 1.26E-06
PRDM15, L0C102154225,
0
t..)
chr31:36,240,655-36,347,617 q15.3 Gain 106,962 54.5 3.9
50.6 4.94E-09 4.90E-07 C2CD2
1-
--4
t..)
1-
chr31:39,613,234-39,674,420 q15.3 Gain 61,186 57.6 6.6
51.0 1.92E-08 1.26E-06 PCNT
1-
1-
vi
chr31:39,674,420-39,702,857 q15.3 Gain 28,437 60.6 6.6
54.0 3.94E-09 4.90E-07 PCNT, DIP2A
chr31:39,702,857-39,895,921 q15.3 Gain 193,064 60.6 7.9
52.7 1.46E-08 1.19E-06 DIP2A, S100B, PRMT2
chr36:21,365,605-21,435,803 q14 Gain 70,198 54.5 2.6
51.9 8.40E-10 2.43E-07 L0C102152241, PDEllA
chr36:21,435,803-21,571,604 q14 Gain 135,801 54.5 3.9
50.6 4.94E-09 4.90E-07 PDEllA
chr36:22,206,259-22,262,382 q14 Gain 56,123 54.5 3.9
50.6 4.94E-09 4.90E-07 TTN
chr36:22,262,382-22,880,297 q14 Gain 617,915 54.5
2.6 51.9 8.40E-10 2.43E-07
TTN, CCDC141, SESTD1 P
chr36:28,200,299-28,282,448 q15 Gain 82,149 60.6
9.2 51.4 4.78E-08 2.39E-06
FSIP2 .
r.,
u,
_.]
t..) chr36:28,282,448-28,298,114 q15 Gain
15,666 57.6 6.6 51.0 1.92E-08 1.26E-06 .
r.,
chr36:28,298,114-28,473,376 q15 Gain
175,262 54.5 2.6 51.9 8.40E-10 2.43E-07 .
,
.3
,
,
,
,
r.,
_.]
1-d
n
,-i
cp
t..)
=
-4
=
.6.
-4
CA 03025776 2018-11-27
WO 2017/210115 PCT/US2017/034711
TABLE 4
Significant CNAs in wt-KIT tumors identified by GISTIC analysis
G-
No Typ Scor
. Region (CanFam3) Extended Region e Q-Bound e
20.0
1 chrl :63,742,997-63,803,385 chrl :63,742,997-63,803,385
Loss 9.40E-09 3
2 chrl :98,513,040-98,728,698 chrl :98,500,725-
107,055,454 Gain 1.19E-02 4.09
10.0
3 chrl :111,745,837-111,764,765 chrl :111,745,837-
111,773,264 Loss 1.15E-05 2
4 chrl :117,108,373-117,174,987 chrl :117,091,834-
117,539,044 Gain 6.73E-08 8.39
5 chr2:19,854,075-19,889,268 chr2:19,854,075-19,897,270 Gain 3.42E-02
3.68
6 chr2:23,201,419-23,241,899 chr2:23,201,419-23,241,899 Loss 2.37E-05
9.32
7 chr2:35,996,135-36,003,432 chr2:35,921,044-36,003,432 Gain 1.16E-02
4.10
14.7
8 chr2:84,126,143-84,151,550 chr2:83,970,260-84,151,550 Gain 2.01E-10
4
9 chr2:84,151,550-84,179,101 chr2:84,151,550-84,179,101 Loss 3.72E-04
7.30
10 chr3:59,944,361-60,185,123 chr3:59,753,458-60,185,123 Gain 7.96E-05
6.04
11 chr3:60,423,519-60,515,009 chr3:60,423,519-60,585,098 Loss 7.40E-04
6.93
12 chr3:91,351,987-91,448,431 chr3:91,351,987-91,681,975 Loss 2.24E-02
5.09
13 chr3:91,781,169-91,786,770 chr3:91,681,975-91,786,770 Gain 8.21E-03
4.27
14 chr4:14,010,773-14,124,513 chr4:14,001,344-14,124,513 Gain 6.28E-03
4.36
15 chr4:34,760,329-35,027,498 chr4:34,745,245-35,056,833 Loss 9.70E-04
6.78
15.5
16 chr4:35,861,977-36,002,900 chr4:35,851,080-36,002,900 Gain 2.01E-10
5
17 chr5:1-133,326 chr5:1-133,326 Loss 6.97E-04 6.96
18 chr5:19,772,292-19,870,693 chr5:1,333,535-19,870,693 Gain 4.77E-03
4.48
17.7
19 chr5:32,224,217-32,261,183 chr5:32,224,217-32,312,981 Gain 2.01E-10
5
20 chr5:56,349,012-56,415,940 chr5:56,331,351-56,526,415 Gain 2.47E-03
4.78
25.1
21 chr5:78,183,082-78,251,390 chr5:78,150,222-78,399,717 Loss 9.40E-09
6
13.7
22 chr5:78,251,390-78,342,207 chr5:78,183,082-78,399,717 Gain 2.01E-10
4
23 chr5:81,265,802-81,360,136 chr5:81,265,802-81,360,136 Gain 2.35E-02
3.83
24 chr6:9,019,278-9,130,821 chr6:7,538,713-9,671,493 Gain 1.63E-07 8.11
73
CA 03025776 2018-11-27
WO 2017/210115 PCT/US2017/034711
13.4
25 chr6: 38,821,209-38,890,486 chr6: 38,821,209-
38,967,548 Gain 2.01E-10 5
12.1
26 chr6: 40,670,034-40,690,650 chr6: 40,670,034-
40,720,194 Loss 2.02E-07 4
27 chr6: 45,833,720-46,090,567 chr6: 45,426,941 -
46,481,846 Loss 1.82E-03 6.48
28 chr6: 47,044,166-47,111,711 chr6: 46,993,224-
47,132,538 Gain 1.02E-04 5.96
29 chr7: 1-48,912 chr7: 1-74,145 Gain 3.10E-05
6.36
14.0
30 chr7:41,776,035-41,851,194 chr7:41,772,322-41,851,194 Gain
2.01E-10 9
19.8
31 chr7:71,181,689-71,239,464 chr7:71,181,689-71,239,464 Loss
9.40E-09 6
10.7
32 chr8: 2,739,349-2,765,393 chr8: 2,677,487-
2,792,410 Gain 2.11E-10 9
33 chr8:72,704,964-72,826,938 chr8:72,677,095 -
73,022,906 Gain 1.31E-07 8.17
39.1
34 chr8:73,379,979-73,400,408 chr8:73,379,979-73,757,566 Loss
9.40E-09 2
35 chr9: 1-48,674 chr9: 1-48,674 Loss 1.33E-03
6.61
36 chr9:503,870-532,310 chr9: 225,593-537,724 Gain 6.28E-05 6.14
13.3
37 chr9: 17,312,039-17,732,745 chr9: 17,312,039-
17,969,293 Loss 2.93E-08 0
38 chr9: 17,969,293-18,092,618 chr9: 17,969,293-
18,092,618 Gain 8.22E-08 8.33
35.5
39 chr9: 38,984,357-38,998,563 chr9: 38,972,929-
38,998,563 Loss 9.40E-09 2
13.9
40 chr9: 38,998,563-39,010,776 chr9: 38,998,563-
39,010,776 Gain 2.01E-10 0
41 chr9:57,683,444-57,748,629 chr9:57,683,444-61,074,082 Loss 2.81E-02
4.94
42 chr10:1,728,923-1,848,374 chr10:96,774-1,848,374 Gain 2.89E-06 7.18
11.9
43 chr10:17,020,231-17,066,756 chr10:17,020,231-17,066,756 Gain
2.01E-10 4
44 chr10:17,775,058-17,872,494 chr10:17,365,609-19,611,483 Loss 1.17E-03
6.69
45 chrl 0:45,716,711-45,751,320 chrl 0:45,691,620-
45,803,956 Gain 9.85E-07 7.54
19.3
46 chrl 1:52,587,841-52,683,204 chrl 1:52,587,841-
52,722,960 Gain 2.01E-10 8
47 chrl 1:68,433,695-68,603,240 chrl 1:68,433,695-
68,603,240 Loss 1.53E-03 6.54
48 chr12:1,529,469-1,583,900 chr12:1,300,212-1,583,900 Gain 2.26E-04
5.68
17.5
49 chr12:2,604,766-2,661,228 chr12:2,604,766-2,664,169 Gain
2.01E-10 9
50 chr12:72,079,628-72,251,175 chr12:72,079,628-72,272,418 Loss 4.57E-05
8.64
74
CA 03025776 2018-11-27
WO 2017/210115 PCT/US2017/034711
15.4
51 chr13:2,443,805-2,490,453 chr13:2,443,805-2,490,453 Loss
9.40E-09 1
52 chr13:35,964,725-36,122,185 chr13:35,964,725-36,149,644 Loss 9.17E-05
8.15
12.9
53 chr13:37,377,311-37,700,001 chr13:37,364,026-37,746,957 Gain
2.01E-10 3
17.2
54 chr14:2,808,378-2,842,648 chr14:2,113,422-2,861,174 Loss
9.40E-09 1
55 chr14:4,972,455-5,338,685 chr14:4,938,913-5,338,685 Gain 2.81E-03
4.73
14.7
56 chr14:43,551,303-43,621,522 chr14:43,537,923-43,629,021 Gain
2.01E-10 4
57 chr15:1,346,848-1,499,163 chr15:1,346,848-1,499,163 Gain 5.96E-10
9.91
58 chr15:7,819,131-7,934,777 chr15:5,036,356-7,980,691 Loss 6.24E-03
5.85
59 chr15:63,811,147-63,982,204 chr15:63,811,147-63,982,204 Loss 1.05E-04
8.05
60 chr16:1-309,348 chr16:1-407,916 Loss 2.09E-03 6.39
61 chr16:9,149,776-9,181,393 chr16:8,551,949-9,217,088 Gain 1.32E-02
4.04
62 chr16:54,356,690-54,473,666 chr16:54,297,462-56,683,206 Loss 1.46E-05
9.80
63 chr17:403,827-620,898 chr17:1-689,496 Loss 4.31E-05 8.68
64 chr17:56,665,179-56,686,048 chr17:56,665,179-56,686,048 Gain 5.96E-09
9.13
65 chr17:64,159,048-64,289,059 chr17:64,159,048-64,289,059 Loss 6.44E-03
5.82
66 chr18:1,976,678-2,065,321 chr18:1-2,065,321 Loss 1.67E-02 5.28
67 chr18:11,339,197-11,416,499 chr18:11,339,197-11,416,499 Gain 2.94E-05
6.39
68 chr18:38,683,599-38,800,287 chr18:38,683,599-38,800,287 Loss 1.55E-03
6.53
12.9
69 chr18:46,318,953-46,383,384 chr18:46,318,953-46,510,748 Gain
2.01E-10 6
70 chr19:2,901,106-2,979,475 chr19:2,901,106-2,979,475 Gain 6.67E-05
6.11
71 chr19:20,036,378-20,295,719 chr19:19,933,994-20,329,284 Loss 2.84E-04
7.45
72 chr20:15,968,550-16,176,199 chr20:15,198,750-16,176,199 Loss 2.18E-04
7.63
11.9
73 chr20:38,713,828-38,743,160 chr20:38,311,784-38,774,596 Loss
3.78E-07 5
74 chr20:40,469,449-40,547,257 chr20:40,469,449-40,551,201 Gain 1.51E-02
4.00
19.4
75 chr20:46,131,350-46,186,781 chr20:45,703,872-46,356,123 Gain
2.01E-10 3
45.3
76 chr20:53,267,512-53,327,296 chr20:53,267,512-53,327,296 Loss
9.40E-09 8
CA 03025776 2018-11-27
WO 2017/210115 PCT/US2017/034711
77 chr20:53,267,512-53,341,759 chr20:53,267,512-53,341,759 Gain
2.74E-03 4.73
78 chr20:54,212,601-54,231,471 chr20:54,201,255-54,231,471 Gain
1.53E-08 8.84
79 chr20:57,137,484-57,189,778 chr20:54,861,893-58,134,056 Loss
2.00E-02 5.16
13.6
80 chr21:21,566,631-21,679,745 chr21:21,566,631-21,695,604 Gain
2.01E-10 1
81 chr22:780,737-924,571 chr22:242,796-924,571 Loss
1.61E-03 6.52
82 chr22:60,344,869-60,562,889 chr22:60,297,547-60,633,852 Loss
3.82E-02 4.71
83 chr23:8,242,315-8,331,657 chr23:8,224,915-8,331,657 Gain
3.30E-03 4.66
25.2
84 chr23:20,504,112-20,514,633 chr23:20,504,112-20,514,633 Loss
9.40E-09 7
14.2
85 chr23:20,538,312-20,710,885 chr23:20,514,633-20,710,885 Gain
2.01E-10 0
86 chr23:52,151,945-52,294,480 chr23:52,151,945-52,294,480 Loss
2.33E-04 7.57
13.3
87 chr24:21,138,869-21,154,133 chr24:21,138,869-21,213,663 Gain
2.01E-10 2
88 chr24:47,449,078-47,698,779 chr24:47,449,078-47,698,779 Loss
5.03E-03 5.95
89 chr25:50,413,480-51,073,874 chr25:50,413,480-51,184,426 Gain
1.99E-05 6.53
90 chr25:51,475,875-51,628,933 chr25:51,465,331-51,628,933 Loss
1.50E-04 7.82
91 chr26:20,263,200-20,298,649 chr26:20,209,073-20,298,649 Gain
7.21E-08 8.37
92 chr26:25,221,909-25,467,475 chr26:24,951,165-25,676,067 Loss
1.13E-03 6.71
31.3
93 chr26:27,167,936-27,174,566 chr26:27,167,936-27,174,566 Gain
2.01E-10 8
66.1
94 chr26:27,174,566-27,207,467 chr26:27,174,566-27,240,032 Loss
9.40E-09 5
95 chr26:27,289,594-27,333,602 chr26:27,289,594-27,373,928 Gain
3.56E-02 3.62
96 chr26:27,462,452-27,483,067 chr26:27,462,452-27,569,156 Loss
2.50E-03 6.30
97 chr26:28,340,781-28,398,606 chr26:28,324,491-28,456,230 Gain
8.04E-09 9.06
98 chr27:1,114,154-1,303,187 chr27:1-1,314,884 Loss
7.25E-05 8.35
99 chr27:2,901,529-3,020,954 chr27:2,876,411-3,020,954 Gain
1.39E-02 4.03
18.0
0 chr27:6,978,563-7,023,641 chr27:6,954,304-7,041,668 Gain
2.01E-10 6
10 15.8
1 chr27:25,750,959-25,860,828 chr27:25,732,852-25,860,828 Loss
9.40E-09 9
2 chr27:31,853,354-31,912,150 chr27:25,889,191-38,183,454 Loss
6.24E-03 5.85
76
CA 03025776 2018-11-27
WO 2017/210115 PCT/US2017/034711
3 chr27:38,183,454-38,208,381 chr27:38,183,454-42,266,862 Gain
9.02E-03 4.23
4 chr28:29,626,077-29,713,479 chr28:29,626,077-29,713,479 Gain
2.87E-02 3.75
5 chr28:40,520,701-40,593,303 chr28:40,520,701-40,950,687 Gain
1.70E-09 9.52
10 11.3
6 chr28:41,109,678-41,137,968 chr28:41,109,678-41,182,112 Loss
8.95E-07 4
7 chr29:41,021,811-41,067,224 chr29:41,021,811-41,845,238 Loss
7.67E-03 5.72
8 chr30:37,840,545-37,864,405 chr30:37,810,533-37,864,405 Gain
1.83E-05 6.55
9 chr30:38,521,916-38,804,831 chr30:38,521,916-38,816,298 Loss
9.95E-03 5.58
11
0 chr31:35,871,715-35,887,990 chr31:35,781,416-36,613,542 Loss
4.20E-03 6.04
11
1 chr31:37,299,916-37,327,631 chr31:36,664,322-38,941,533 Gain
6.60E-10 9.86
11
2 chr33:30,728,795-30,797,016 chr33:30,659,185-31,185,184 Gain
1.90E-02 3.90
11 10.2
3 chr34:11,275,814-11,298,924 chr34:11,275,814-11,315,700 Gain
3.28E-10 0
11
4 chr34:11,470,898-11,501,692 chr34:11,338,716-11,552,092 Loss
1.58E-03 6.53
11
5 chr35:16,974,084-16,984,185 chr35:16,912,748-17,010,530 Gain
1.39E-02 4.03
11
6 chr36:28,176,666-28,282,448 chr36:28,176,666-28,282,448 Gain
3.63E-02 3.58
11
7 chr37:1-177,983 chr37:1-177,983 Loss
2.77E-05 9.15
11
8 chr37:177,983-248,456 chr37:177,983-266,890 Gain
2.81E-03 4.72
11 12.2
9 chr37:24,943,587-25,049,058 chr37:24,943,587-25,049,058 Gain
2.01E-10 6
12
0 chr37:30,389,938-30,452,090 chr37:30,312,057-30,837,612 Loss
2.70E-04 7.47
12
1 chr37:30,893,538-30,902,991 chr37:30,893,538-30,902,991 Gain
5.00E-03 4.46
12
2 chr38:724,265-752,803 chr38:717,842-752,803 Gain
4.17E-02 3.53
12
3 chr38:22,131,188-22,290,537 chr38:22,131,188-23,707,309 Gain
1.94E-05 6.53
12
4 chr38:23,762,444-23,914,537 chr38:23,762,444-23,914,537 Loss
4.09E-02 4.66
12
5 chrX:1-93,751 chrX:1-93,751 Gain
5.57E-10 9.95
12 19.9
6 chrX:32,269,966-32,297,891 chrX:32,269,966-32,297,891 Loss
9.40E-09 4
12
7 chrX:53,176,671-53,453,526 chrX:53,139,071-53,453,526 Gain
3.05E-04 5.56
12 68.7
8 chrX:71,803,071-71,951,577 chrX:71,744,008-72,049,231 Loss
9.40E-09 6
77
CA 03025776 2018-11-27
WO 2017/210115
PCT/US2017/034711
12 16.1
9 chrX:72,228,723-72,239,538 chrX:72,228,723-72,239,538 Gain 2.01E-10
5
13
0 chrX:120,981,052-121,071,550 chrX:120,943,561-121,071,550 Loss 1.68E-05 9.64
13
1 chrX:121,545,250-121,743,104 chrX:121,545,250-122,322,644 Gain 1.98E-07 8.06
TABLE 5
Significant CNAs in mut-KIT tumors identified by GISTIC analysis
G-
No. Region Extended Region Type Q-
Bound Score
1 chrl :111,745,837-111,773,264 chrl :108,222,732-
111,971,009 .. Gain .. 6.26E-03 .. 5.11
2 chrl :111,745,837-111,773,264 chrl :111,745,837-
111,773,264 Loss 6.27E-03 5.47
3 chr2:23,201,419-23,241,899 chr2:23,201,419-23,241,899
Loss 1.22E-03 6.32
4 chr2:35,921,044-35,970,446 chr2: 35,903,106-35,996,135
Gain 6.62E-04 6.45
chr2:84,151,550-84,179,101 chr2: 84,151,550-84,179,101 Loss 1.68E-02
4.64
6 chr4:35,861,977-35,979,387 chr4: 35,842,040-36,002,900
Gain 1.94E-05 7.72
7 chr5:17,003,811-17,271,198 chr5:9,062,538-20,133,725
Loss 2.99E-04 6.95
8 chr5 :78,150,222-78,183,082 chr5:78,150,222-78,415,957
Loss 1.34E-09 21.52
9 chr5 :78,415,957-78,459,732 chr5:78,415,957-78,459,732
Gain 4.49E-03 5.46
chr5 :82,845,474-83,027,347 chr5: 81,360,136-88,915,250 Loss 6.36E-03
5.46
11 chr6:40,670,034-40,712,665 chr6: 40,656,427-40,712,665
Loss 2.70E-06 9.90
12 chr6:47,044,166-47,111,711 chr6: 47,025,866-47,111,711 ..
Gain .. 1.02E-03 .. 6.25
13 chr7:41,818,563-41,843,764 chr7:41,591,428-41,851,194
Gain 3.40E-03 5.63
14 chr7 :71,181,689-71,239,464 chr7:42,534,961-80,974,532
Loss 1.58E-02 4.70
chr8 :73,379,979-73,391,779 chr8:73,379,979-74,008,358 Loss 1.34E-09
19.31
16 chr9:0-40,344 chr9: 1-212,867 Loss
5.87E-03 5.50
17 chr9:17,297,936-17,312,039 chr9: 17,259,902-17,312,039
Gain 9.13E-06 7.95
18 chr9:38,972,929-38,998,563 chr9: 38,972,929-38,998,563
Loss 1.34E-09 26.83
19 chr9:38,998,563-39,010,776 chr9: 38,998,563-39,010,776
Gain 1.22E-03 6.16
78
CA 03025776 2018-11-27
WO 2017/210115
PCT/US2017/034711
20 chrl 0:17,365,609-17,503,037 chrl 0:17,365,609-
18,606,267 Loss 3.17E-02 4.17
21 chrl 1:52,587,841-52,700,545 chrl 1:52,587,841-
52,722,960 Gain 6.01E-03 5.18
22 chrl 1:68,461,968-68,603,240 chrl 1:68,433,695-
68,612,918 Loss 1.24E-03 6.31
23 chr12:2,604,766-2,643,750 chr12:2,604,766-2,661,228 Gain
1.14E-02 4.48
24 chr12:72,079,628-72,251,175
chr12:72,017,711-72,328,821 Loss 1.63E-02 4.67
25 chr13: 2,443,805-2,490,453 chr13:2,443,805-2,490,453
Loss 2.01E-05 8.25
26 chr13: 46,940,621-47,030,653 chr13:43,553,562-
62,751,630 Gain 2.51E-05 7.64
27 chr14:2,522,789-2,842,648 chr14:2,322,259-2,861,174 Loss
1.68E-06 10.43
28 chr14: 18,158,442-18,470,051 chr14:16,268,322-
18,687,430 Gain 6.54E-07 8.71
29 chr15:7,644,414-7,992,325 chr15:7,042,368-7,992,325 Loss
4.00E-02 4.01
30 chr15:63,811,147-63,951,198
chr15:63,773,273-63,982,204 Loss 2.79E-03 5.94
31 chr16:54,356,690-54,473,666 chr16:54,356,690-54,530,683 Loss 2.70E-06 9.90
32 chr17: 403,827-620,898 chr17:1-1,194,858 Loss 1.57E-02 4.71
33 chr17:56,787,475-56,820,514 chr17:56,665,179-56,855,694 Gain 3.27E-03 5.66
34 chr17:64,174,093-64,289,059 chr17:64,159,048-64,289,059 Loss 4.10E-03 5.72
35 chr18: 38,726,595-38,789,728 chr18:38,655,067-
38,800,287 Loss 9.03E-05 7.46
36 chr19:20,036,378-20,295,719 chr19:19,933,994-20,329,284 Loss 4.10E-03 5.72
37 chr20: 48,403,168-48,458,171 chr20:48,053,474-
48,512,348 Gain 1.78E-04 6.97
38 chr20:53,267,512-53,327,296 chr20:53,267,512-53,327,296 Loss 8.57E-07 11.07
39 chr21: 45,003,472-45,130,560 chr21:43,197,918-
50,858,623 Gain 4.69E-02 3.56
40 chr22: 60,297,547-60,513,761 chr22:60,297,547-
61,439,934 Loss 1.03E-03 6.41
41 chr23: 20,504,112-20,669,834 chr23:20,504,112-
20,710,885 Loss 1.34E-09 15.18
42 chr23:52,151,945-52,294,480 chr23:52,151,945-52,294,480 Loss 6.51E-03 5.43
43 chr24: 47,470,936-47,698,779 chr24:44,594,747-
47,698,779 Loss 1.07E-02 5.02
44 chr25:49,654,288-49,893,248 chr25:49,161,012-51,246,100 Loss 2.73E-02 4.27
45 chr26:5,372,761-5,454,082 chr26:5,021,666-8,071,151 Gain
1.47E-03 6.08
79
CA 03025776 2018-11-27
WO 2017/210115
PCT/US2017/034711
46 chr26:27,167,936-27,174,566 chr26:27,167,936-27,174,566 Gain 4.29E-15 16.35
47 chr26:27,174,566-27,207,467 chr26:27,174,566-27,240,032 Loss 1.34E-09 38.88
48 chr27:6,978,563-7,041,668 chr27:6,954,304-7,041,668 Gain
1.04E-02 4.58
49 chr28:39,142,525-39,236,726 chr28:36,947,617-40,499,923 Loss 3.96E-06 9.32
50 chr29:40,988,530-41,067,224
chr29:40,654,989-41,845,238 Loss 3.12E-02 4.17
51 chr31:28,109,184-28,150,222 chr31:20,869,268-35,611,912 Gain 4.29E-15 13.43
52 chr32: 1,665,965-2,024,718 chr32:1-2,989,645 Loss
5.58E-03 5.54
53 chr33: 14,686,038-14,789,970 chr33:1,117,447-23,505,256
Loss 9.49E-04 6.45
54 chr36: 19,878,982-19,955,258 chr36:6,988,336-23,357,555
Gain 2.17E-06 8.36
55 chr37:24,954,721-24,972,543 chr37:24,943,587-25,049,058 Gain 2.08E-02 4.01
56 chr37:30,312,057-30,452,090 chr37:30,312,057-30,902,991 Loss
5.22E-03 5.59
57 chr38: 1,056,312-1,123,624 chr38:697,930-1,163,327
Gain 4.64E-04 6.60
58 chrX:407,553-427,889 chrX: 1-427,889 Loss 4.07E-02 3.99
59 chrX:32,269,966-32,297,891
chrX:32,202,589-32,328,959 Loss 9.28E-04 6.46
60 chrX:71,762,610-71,780,002
chrX:71,744,008-72,105,721 Gain 8.83E-06 7.95
61 chrX:71,780,002-72,216,345
chrX:71,744,008-72,228,723 Loss 1.34E-09 27.09
62 chrX:120,981,052-121,071,550 chrX: 120,908,381-121,071,550 Loss 7.22E-
03 5.38
CA 03025776 2018-11-27
WO 2017/210115 PCT/US2017/034711
TABLE 6
CNV to differentiate wt-KIT high-grade tumors vs wt-KIT low-grade tumors
wt-KIT high freq wt-KIT low freq
Region Event Length (%) (%) Gene
Symbols
chr20:31,578,505- CN LOC100685571,
31,734,123 Loss 155,618 77.3 5.6 C20H3orf67
OR10A11,
chr20:46,389,048- CN 0R18C09,
46,464,109 Gain 75,061 81.8 9.3 L0C102155605
CNV to differentiate Mut-KIT tumors vs wt-KIT low-grade tumors
Region Mut-KIT freq wt-KIT low freq
Region Event Length (%) (%) Gene
Symbols
chr5:37,788,552- CN
37,966,845 Loss 178,293 75.8 0 COX10
chr31:16,653,042- CN
16,851,394 Gain 198,352 63.6 0
8. SEQUENCE LISTING
[00170] INCORPORATION-BY-REFERENCE OF MATERIAL SUBMITTED
ELECTRONICALLY
This application contains a sequence listing. It has been submitted
electronically via EFS-
Web as an ASCII text file entitled "127-97-PCT_2017-05-26_SEQ _5T25.txt". The
sequence
listing is 5322 bytes in size, and was created on May 26, 2017. It is hereby
incorporated by reference
in its entirety.
[00171] It should be understood that the above description is only
representative of illustrative
embodiments and examples. For the convenience of the reader, the above
description has focused
on a limited number of representative examples of all possible embodiments,
examples that teach
the principles of the disclosure. The description has not attempted to
exhaustively enumerate all
possible variations or even combinations of those variations described. That
alternate embodiments
may not have been presented for a specific portion of the disclosure, or that
further undescribed
alternate embodiments may be available for a portion, is not to be considered
a disclaimer of those
alternate embodiments. One of ordinary skill will appreciate that many of
those undescribed
embodiments, involve differences in technology and materials rather than
differences in the
application of the principles of the disclosure. Accordingly, the disclosure
is not intended to be
limited to less than the scope set forth in the following claims and
equivalents.
[00172] INCORPORATION BY REFERENCE
81
CA 03025776 2018-11-27
WO 2017/210115 PCT/US2017/034711
[00173] All references, articles, publications, patents, patent publications,
and patent
applications cited herein are incorporated by reference in their entireties
for all purposes. However,
mention of any reference, article, publication, patent, patent publication,
and patent application
cited herein is not, and should not be taken as an acknowledgment or any form
of suggestion that
they constitute valid prior art or form part of the common general knowledge
in any country in the
world. It is to be understood that, while the disclosure has been described in
conjunction with the
detailed description, thereof, the foregoing description is intended to
illustrate and not limit the
scope. Other aspects, advantages, and modifications are within the scope of
the claims set forth
below. All publications, patents, and patent applications cited in this
specification are herein
incorporated by reference as if each individual publication or patent
application were specifically
and individually indicated to be incorporated by reference.
82