Note: Descriptions are shown in the official language in which they were submitted.
CA 03036790 2019-03-13
WO 2017/049114
PCT/US2016/052178
MEASURING CONCENTRATION OF ANALYTES IN LIQUID SAMPLES USING
SURFACE-ENHANCED RAMAN SPECTROSCOPY
.. RELATED APPLICATIONS:
[0001] This Application claims the benefit of US application
62/219,553, filed on
September 16, 2015, which is incorporated herein by reference.
STATEMENT REGARDING FEDERALLY-SPONSORED RESEARCH OR DEVELOPMENT:
[0002] Parts of this specification relate to research funder under a
National Science
Foundation - SBIR grant, number II P-1058590, called "Hand-Held Device for PPB-
level
Water Analysis."
FIELD OF THE INVENTION
[0003] The present invention relates to measuring the concentration of
analytes in a
fluid, for example by using surface-enhanced Raman spectroscopy to measure the
composition of a trace analyte in an industrial or environmental water sample.
BACKGROUND
[0004] Currently, the detection and measurement of many analytes at trace
levels
within a water sample requires complex laboratory equipment and a skilled
technician. A
variety of laboratory techniques exist. The EPA provides a list of available
and approved
techniques for compounds of concern. The American Public Health Association,
American
Water Works Association, and Water Environmental Federation publish Standard
Methods
for the Examination of Water and Wastewater¨an extensive treatise on water
analysis
methodology. Although a variety of analytical detection methods can be used in
water
analysis, most trace-level analysis falls upon widely-used and popular, yet
complex and
expensive, mass spectrometry methods.
[0005] Raman spectroscopy is a potential alternative for trace
analyte detection.
Raman spectroscopy provides a chemical signature for a compound (in the form
of a unique
configuration of peaks in the reflected spectrum), but the Raman signal is
typically too weak
for part-per-billion detection. However, the Raman signal can be enhanced by
the presence
- 1 -
CA 03036790 2019-03-13
WO 2017/049114
PCT/US2016/052178
of an active surface or marker (typically a metal), creating surface-enhanced
Raman
spectroscopy (SERS). VVith an adequate interaction between the analyte and the
surface,
signal enhancement creates opportunities to detect very small concentrations.
Some
compounds, such as pyridine, naturally interact strongly with gold and silver
surfaces. In
some other cases a binding compound may bring the analyte and metal molecules
into
sufficiently close contact. For example, treatments with octadecylthiol have
been used
successfully for SERS on planar substrates with some analytes.
[0006] In some SERS techniques, the surface is provided by metal
nanoparticles.
When a metallic nanoparticle smaller than the wavelength of light is
introduced into the
sample, the illuminating electric field will create surface resonances if
there are free electrons
in the nanoparticle. The nanoparticles can be gold, silver, or copper beads,
for example.
These oscillating charges create an enhanced local electric field along
certain directions,
which results in a much stronger Raman response. "Hot spot" regions can be
created where
the SERS signal is greatly enhanced. These regions are most likely due to
nanoparticle
alignments or aggregates that create even larger electric field enhancements.
[0007] US Patent 8,070,956, Hand-Held Microfluidic Testing Device,
describes a
testing device with a cartridge receiving port for receiving a cartridge. An
optical detection
system in the housing is disposed to analyze a sample in channel of the
cartridge. In some
embodiments, markers such as gold nanoparticles are present in the channel and
the optical
detection system is a Raman spectroscopy system. In some embodiments, the
channel
includes narrow sections along a microfluidic separation channel that trap
gold nanoparticles
at a high density. This encourages the creation of "hot spots" through
nanoparticle density at
a predetermined detection location.
[0008] Although some researchers have achieved remarkable detection
limits using
SERS, the use of SERS to measure the concentration of a trace analyte is less
developed.
In general, Raman signal strength is proportional to the amount of analyte per
unit area.
However, one issue is that the generation of random nanoparticle hot spots
leads to random
signal enhancements, which interferes with correlating signal strength to
analyte
concentration. Another issue is that aqueous sample conditions other than
analyte
concentration, for example pH, can alter the analyte signal strength.
- 2 -
CA 03036790 2019-03-13
WO 2017/049114
PCT/US2016/052178
INTRODUCTION
[0009] This specification describes the use of surface-enhanced Raman
spectroscopy (SERS) to measure the concentration of various analytes, for
example in an
industrial or environmental water sample. In at least some cases, the
composition of trace
compounds is measured to within 10% accuracy. A measurement method uses an
internal
standard in the form of a known quantity of a reference compound added to a
known volume
of an aqueous mixture containing the analyte. The reference compound reacts
similarly to
the analyte under investigation with the surface but produces a different
Raman spectrum.
The reference compound may be, for example, an isotopologue, isomer, or
enantiomer of the
analyte or of a compound similar to the analyte. The reference compound is
added to the
mixture in an amount similar to the expected amount of the analyte.
[0010] A portable testing device is described having reusable and
consumable
components. The reusable components include a Raman spectroscopy instrument
having a
cartridge holder and software for operating the Raman spectroscopy instrument,
optionally
stored in a general-purpose computer. The consumable components include a
cartridge, a
dispersion of Raman-scattering nanoparticles and one or more reagents for the
analyte
under investigation. The one or more reagents, typically provided in solution,
include a
reference compound for the analyte and, optionally, one or more chemical
compounds
capable of increasing interaction between the analyte and the Raman-scattering
nanoparticles. The cartridge has a cavity adapted to hold a mixture of the
analyte,
nanoparticles and one or more reagents in a suitable location in the Raman
spectroscopy
instrument. In some embodiments, the device may also include a solid-phase
extraction
column or other pretreatment devices or chemicals.
[0011] In use, a mixture is prepared of a water sample containing the
analyte under
investigation, the nanoparticles and the one or more reagents. At least some
of the mixture
is placed on the cartridge. The cartridge is loaded into the Raman
spectroscopy instrument.
The computer controls the Raman spectroscopy instrument to produce a Raman
spectrum of
the mixture. The produced spectrum includes individual spectra for the analyte
and the
reference compound. A ratiometric analysis of the individual spectra,
typically performed by
the software, is used to calculate the concentration of the analyte.
[0012] In some cases, the reference standard is an isotopologue of
the analyte, or an
isotopologue of a compound chemically similar to the analyte. When using the
word
- 3 -
CA 03036790 2019-03-13
WO 2017/049114
PCT/US2016/052178
"isotopologue" we mean to refer (unless clear from the context otherwise) to a
form of a
compound that differs in number of neutrons from the most common naturally
occurring form
of that compound. The word "isotope" may also be used for brevity or
convenience with the
same meaning even though, strictly speaking, the word isotope should be used
with
elements rather than molecules. lsotopologues of a compound have Raman spectra
that are
different from the commonly occurring form of the compound. The substitution
of deuterium
for hydrogen in a pyridine molecule, for example, results in a SERS spectrum
with essentially
the same intensity but with shifted peaks.
[0013] In the case of an analyte that is a molecular ion, a
chemically similar
compound may be another molecular ion having the same type and number of
electron
acceptors attached by the same type of bonds but to a different electron
donor. In the case
of an analyte with a functional group that is naturally SERS active under at
least some
conditions, such as an amine, a chemically similar compound may be a compound
with the
same functional group.
[0014] The Raman spectrum generated by the reference standard is produced
and
recorded simultaneously with the spectrum generated by the analyte in a
composite
spectrum. The Raman intensity of one or more bands corresponding to a known
amount (i.e.
concentration) of the reference standard is used as a reference against which
the Raman
intensity of one or more bands corresponding to the analyte is converted into
a measurement
of the amount (i.e. concentration) of the analyte. In some cases, optional
adjustments may
be made to accommodate factors such as the natural occurrence of the isotope
or impurity of
the added isotope. The reference standard preferably interacts with a SERS
substrate
(such as a gold nanoparticle) similarly to the analyte of interest. Thus both
the reference
standard and analyte show similar changes in signal strength due to "hot
spots" or variations
.. in sample composition. Therefore, when the Raman spectrum for the analyte
(i.e the
intensity of one or more of its characteristic bands) is scaled with reference
to the Raman
spectrum for the reference standard (i.e the intensity of one or more of its
characteristic
bands), an accurate quantification is achieved.
[0015] In some cases, an isotopologue used as a reference standard
may be made
by synthesizing a compound with, for example, a hydrogen isotope (i.e.
deuterium) or an
oxygen isotope (i.e. 180). Replacing some or all of the hydrogen with
deuterium causes a
shift in the peaks of the Raman spectrum for many compounds, including amines
like
monoethanolamine, methylamine, diethanolamine, cyclohexylamine, morpholine and
- 4 -
CA 03036790 2019-03-13
WO 2017/049114
PCT/US2016/052178
methyldiethanolamine, and hydrocarbons like benzene, toluene, ethylbenzene,
and xylene.
Replacing at least some, but preferably all, of the oxygen with heavy oxygen
(typically 180)
causes a shift in the peaks of the Raman spectrum for many molecular ions,
perchlorate,
sulfate and selenate ions, for example.
[0016] Some analytes may be inherently SERS active¨i.e., they interact
naturally
with a SERS substrate to produce a strong signal. In other cases, analytes may
be made to
interact with a SERS substrate by the addition of a binding reagent or
adjustment of the
general sample conditions such as pH or ionic strength. In yet other cases, a
reaction
involving the analyte is used to produce or consume a more SERS active
compound. The
more SERS active compound could be a more inherently active compound or a
compound
that can be more easily made to interact with a SERS substrate by way of a
binding agent.
The amount of the more SERS active compound after the reaction can be measured
and
compared to a known amount of the more SERS active compound, if any, that was
present
before the reaction started. An internal standard for the more SERS active
compound can
be used to increase the accuracy of the measurement. The amount of the more
SERS
active compound that is consumed or created in the reaction can then be used
to calculate
the concentration of the analyte using a formula for the reaction.
BRIEF DESCRIPTION OF THE FIGURES
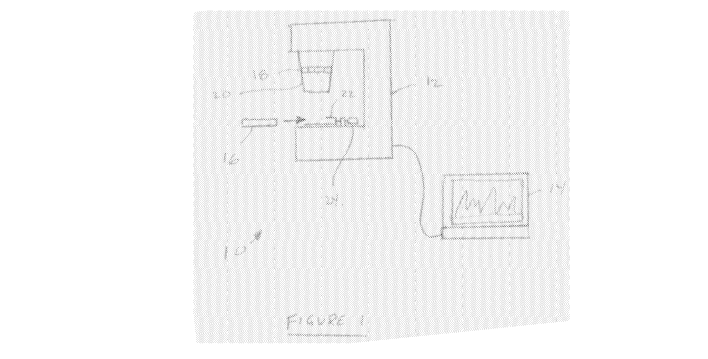
[0017] Figure 1 is a schematic drawing of a portable SERS analysis system
[0018] Figure 2 is a top view of a cartridge for use with the system
of Figure 1.
[0019] Figure 3 shows an example optical system contained within the
analysis
instrument according to the present invention.
[0020] Figure 4 is a calibration curve for diethanolamine showing the
accuracy,
linearity, and detection range.
[0021] Figure 5 is a calibration curve for perchlorate showing the
accuracy, linearity,
and detection range.
[0022] Figure 6 is a calibration curve for selenate showing the
accuracy, linearity, and
detection range.
[0023] Figure 7 shows a method for sample preparation in the analysis of
amines in
sour water.
- 5 -
CA 03036790 2019-03-13
WO 2017/049114
PCT/US2016/052178
DETAILED DESCRIPTION
[0024] An exemplary water analysis system described herein can be
used to provide
on-site or in-field analysis of aqueous samples. In general, a technician
collects a water
sample, processes that sample for analysis, and then introduces the sample to
a cartridge.
.. The cartridge is inserted into a Raman spectroscopy device, which may be
operated through
an interface provided by a general-purpose computer. Optics and electronics
within the
Raman spectroscopy device produce a Raman spectrum for the sample which is
analyzed,
for example with software in the general-purpose computer, to determine the
concentration
of an analyte under investigation in the water sample.
[0025] Raman spectroscopy allows analytes to be detected by their specific
"fingerprint", or pattern of peaks in the Raman spectrum. Preferably, a known
amount of a
reference compound is present in the sample with the analyte when the Raman
spectrum is
produced and provides an internal calibration standard against which signal
intensity of the
analyte may be compared to provide accurate quantitative results. The
intensity of a Raman
signal scales with (i.e. is proportional to) the number of molecules present
per unit area.
When a known amount of calibration standard is introduced to a sample aqueous
solution of
known volume containing the analyte, the quantity of analyte may be determined
by
comparing the signal intensity of the calibration standard and the analyte,
for example
through ratiometric methods.
[0026] The specific ratiometric method used is not critical. For example,
the
concentration of the reference compound in the sample can be divided by the
intensity of the
highest peak in the spectrum for the reference compound to provide a
correlation factor.
Multiplying this correlation factor by the intensity of the highest peak in
the spectrum for the
analyte produces the concentration of the analyte. Alternatively, the signal
intensity of the
analyte (i.e the intensity within one or more bands characteristic of the
analyte) can be
divided by the signal intensity within corresponding bands of the reference
compound to
provide a scaling factor. Multiplying this scaling factor by the known
concentration of the
reference compound in the sample produces the concentration of the analyte.
Optionally
adjustments may be made for various factors such as the purity of the
calibration standard,
.. or natural occurrence of the calibration standard in the analyte. Other
ordinary adjustments,
such as smoothing the spectrum curve or subtracting background signals before
measuring
intensity, may also be made.
[0027] The reference compound may be added to the cartridge during
manufacturing
- 6 -
CA 03036790 2019-03-13
WO 2017/049114
PCT/US2016/052178
or added to a sample containing the analyte before the analyte is added to the
cartridge.
Similarly, SERS active metallic nanoparticles (i.e. markers) may be added to
the cartridge
during manufacturing or added to a sample containing the analyte before the
analyte is
added to the cartridge. Optionally, mixing a solution of the reference
compound with an
aqueous sample containing the analyte as a first step, or at least before
loading the sample
to the cartridge, allows a mixture of analyte and reference compound to be
made using
volumes larger than would fit in the cartridge. This can help with making an
accurate
calculation of the concentration of the reference compound in the mixture,
particularly when
making measurements in the field where high precision liquid handling devices
are not
available. Once the reference compound and analyte sample are mixed together,
later
errors such as spilling some of the mixture do not typically affect the
accuracy of the analyte
concentration measurement.
[0028] The reference compound is added to the mixture in an amount
similar to the
expected amount of the analyte. For example, if the analyte is expected to
have a
concentration in the range of 0-100 ppm, the analyte sample may be mixed with
a solution of
equal volume containing 25-75 ppm of reference compound. Similarly, if the
analyte is
expected to have a concentration in the range of 0-100 ppb, the analyte sample
may be
mixed with a solution of equal volume containing 25-75 ppb of reference
compound. The
amount of reference compound in the mixture is preferably within 0.1 to 10
times the amount
of anylate in the mixture.
[0029] Optionally, the reference compound may be an isotopologue of
the analyte
under investigation. An isotopologue provides a powerful internal calibration
standard as it
differs from the analyte only in the number of neutrons. The chemical response
and reaction
of the reference compound will be nearly identical to the analyte. However,
under Raman
spectroscopy, the isotopologue has a different spectrum. Therefore, one can
record the
analyte and isotopologue spectra simultaneously, using ratiometric analysis of
the composite
spectrum to quantify the unknown analyte.
[0030] In another option, the calibration standard may be an isotope
of a compound
that is chemically similar to the analyte under study. For example, selenium
and sulfur are
chemically quite similar. A measurement of selenate may rely upon the
measurement of
sulfate, of a selenate isotope, or of a sulfate isotope as a calibration
standard. In cases
where an unknown amount of sulfate may exist in the sample, for example when
testing flue
gas desulfurization blowdown water, the use of a selenate isotope or sulfate
isotope is
- 7 -
CA 03036790 2019-03-13
WO 2017/049114
PCT/US2016/052178
preferred. Sulfate isotopes are typically easier to produce. When either a
selenate or sulfate
isotope is used, the concentration of sulfate in the sample can be measured
simultaneously
with a measurement of the selenate concentration.
[0031] Optionally, one or more additional compounds may be mixed with
the sample
to enhance interaction between the nanoparticles and both of the analyte and
the reference
compound. In some cases, the additional compound modifies the SERS marker,
i.e. the
nanoparticles. Optionally, the modification can be chosen for analyte
specificity using
compounds designed to interact preferentially or only with the analyte under
investigation
and the reference compound. This approach reduces interferences while
increasing signal
strength.
[0032] Optionally, an additional compound can include one or more
compounds
selected from: thiols, amines, silanes, polymeric particles, metallic
particles, crown esters,
cysteamine, cystamine, diethylaminethanethiol, mercaptopropionic acid, 1-
propanethiol,
octanethiol, octyldecanethiol, polystyrene, iron, or silica. In other options,
the additional
compound can be a compound effective to modify the pH or ionic strength of a
mixture
including the analyte and the nanoparticles. Some analytes interact with a
SERS substrate
more at a certain pH or in the presence of ions. Optionally, one or more
additional
compounds can be provided premixed with the reference compound in a reagent
solution.
[0033] Figure 1 shows an analysis system 10. The analysis system 10
includes a
Raman spectroscopy unit 12, a computer 14 and a cartridge 16. The computer 14
may be a
separate computer as shown or alternatively could be incorporated into the
Raman
spectroscopy unit 12. The computer 14 is preferably a portable general-purpose
computer,
for example a laptop, tablet or smart-phone.
[0034] The Raman spectroscopy unit 12 includes an optical detection
system in a
housing. The optical detection system is capable of providing an illuminating
electric field,
where the illuminating electric field is capable of being used for Raman
spectroscopy, for
example with Raman-scattering nanoparticles and the calibration solution, to
analyze a
sample under test input on or the cartridge 16. The Raman spectroscopy unit 12
further
includes a lens 20 with a focus ring 18. The focus ring 18 allows the lens 20
to be focused
on a sample contained in the cartridge 16. The Raman spectroscopy unit 12
includes a
cartridge holder 22 adapted to receive the cartridge 16. The cartridge holder
22 can be
translated relative to lens 20 by turning a screw 24. A second screw (not
shown) is
- 8 -
CA 03036790 2019-03-13
WO 2017/049114
PCT/US2016/052178
preferably provided orthogonal to screw 24 to allow a portion of the cartridge
16 at which a
sample to be tested is visible to be aligned with the lens 20.
[0035] The cartridge 16 receives an aqueous mixture including the
analyte. The
cartridge 16 has a cavity 26, which receives the sample. The cartridge 16 may
be plastic.
However, if the mixture is expected to be transparent such that the Raman
laser would
penetrate through to the bottom of the cavity 26, the bottom of the cavity may
be lined with a
reflective surface such as stainless steel. The cartridge 16 may alternatively
be a glass or
plastic bag or vial or other suitable container. When the cartridge 16 is
mounted in the
cartridge holder 22, the cavity 26 is aligned with the lens 20.
[0036] In another option, the cartridge 16 can include one or more of
nanoparticles, a
reference compound, one or more additional compounds, microfluidic channels
configured to
provide an area with an increased density of nanoparticles, or microfluidic
separation
channels, for example as described in US Patent 8,070,956.
[0037] Figure 3 shows an example optical system 1400, contained
within the Raman
spectroscopy unit 12. Shown is a light source 1402, such as a laser,
projecting a light beam
1406 passing through a series of optics 1408 arranged as a beam expander that
is reflected
into a dichroic optic 1410 to direct the reference light beam 1411 into a
spectrometer 1412
for analysis in a monochrometer 1414 and recordation in a CCD array 1416. The
dichroic
1410 simultaneously directs the signal light beam 1413 to the cartridge 1418
to gather a
signal from a sample in the cartridge 1418 and reflect the signal along the
beam path into the
spectrometer 1412 and CCD 1416 array for analysis.
Quantification of Amines
[0038] One important analyte category is the monitoring of amines,
for example in
industrial processes. Organic amines are used as corrosion control agents that
increase pH
and scavenge corrosive contaminants. Monoethanolamine (MEA), for example, is a
widely
used corrosion inhibitor that reduces dissolved CO2 and helps control pH in
industrial boilers
and nuclear power plants. Amines are also effective as hydrogen sulfide
scavengers in oil
and gas production and processing. For example, MEA-triazine is frequently
used as a
hydrogen sulfide scavenger at the well-head. MEA or other compounds can also
exist as
tramp amines that affect refinery operations. On-site monitoring for amines,
for example at a
refinery, pipeline, or well-head, can help maintain appropriate corrosion
protection while
extending system lifetime and avoiding costly corrosion-induced shutdowns and
failures.
- 9 -
CA 03036790 2019-03-13
WO 2017/049114
PCT/US2016/052178
[0039] The analysis system 10 described above may be operated to
measure the
concentration of an amine. Amines interact naturally with gold and silver
substrates. Under
basic pH conditions, the amine group will adhere to the nanoparticles,
resulting in a strong
Raman response. In some cases, the analysis method takes under five minutes,
and may
be performed in the field. In some cases, measurement of an amine in the ppb
range is
possible. However, in industrial process management, measurement of amines in
the ppm
range is more often required. In general, the concentration of an amine can be
measured
using an isotopologue of an amine as a reference compound, preferably an
isotopologue of
the same amine or an amine of similar molecular weight and structure. An
anylate,
isotopologue and nanoparticles mixture is preferably adjusted to a basic pH,
for example a
pH of at least 1 or preferably at least 2 higher than the pKa of the anylate
amine, before
measuring its Raman spectrum.
[0040] In one embodiment, a method provides part-per-million
concentration
measurement of methylamine in refinery process waters. Methylamine is a tramp
amine that
negatively impacts the refining process. The detection limit for methylamine
in aqueous
solutions is 20-ppb or better.
[0041] In another embodiment, the concentration of monoethanolamine
(MEA) is
determined. Rapid measurement of monoethanolamine is useful in controlling
refinery
operations. A preferred isotopologue for MEA is monoethanolamine-d4. pH of the
MEA,
isotopologue and nanoparticles mixture is preferably raised to 12.6 to 12.9.
The mixture of
MEA, isotopologue and nanoparticles is added to the cartridge and its Raman
spectrum
determined.
[0042] In a method described herein, a reference compound is added to
an amine
compound analyte sample. The reference compound is an isotopologue of the same
or
another amine compound. In one example, a known volume of methylamine-d3
solution at
25- to 75-ppm is added to a sample of known volume (preferably the same or
within 50% of
the volume of methylamine-d3 solution) having an unknown quantity of
methylamine-do. The
methylamine-d3 creates a reference spectrum (within a composite spectrum)
against which
the methylamine-do spectrum may be quantified. This approach can result in
10%
measurement accuracy over a 0- to 100-ppm range of methylamine-do. Accuracy
can be
improved at the low end with a lower concentration methylamine-d3 solution. pH
of the
mixture is preferably adjusted to 12.6 to 13.0 before taking its Raman
spectrum.
- 10-
CA 03036790 2019-03-13
WO 2017/049114
PCT/US2016/052178
[0043] In another example, diethanolamine-d8 is used as an internal
standard when
measuring the concentration of diethanolamine. Figure 4 shows a calibration
curve prepared
by measuring the concentration of samples of diethanolamine prepared at
different
concentrations with diethanolamine-d8 used as an internal standard. The
response is linear
over 0- to 100-ppm, and the accuracy of the measured concentration is within
10%. pH of the
mixture is preferably adjusted to 12.6 to 13Ø
[0044] In other examples, the approach described above is applied to
triazine-based
compounds. For example, accurate, ppm-level measurements of MEA-triazine or
dithiazine
can be achieved using an ethanolamine-d4 or an MEA-triazine-d12 isotopologue
as a
reference compound.
[0045] In further examples, the process for measuring one amine can
be extended to
measuring multiple amines. The internal standard can be a mixture of
materials, for example
ethanolamine-d4 and methylamine-d3. These two compounds individually are
excellent
internal standards for ethanolamine and methylamine individually. By including
both
isotopologues in a mixture, one can determine the concentration of
ethanolamine and
methylamine in a sample. First, the spectrum is scaled to the ethanolamine-d4
peak at 870-
cm-1, and the ethanolamine concentration is determined. The same spectrum is
then scaled
to the 950-cm-1 methylamine-d3 peak, and the methylamine concentration is
determined.
Furthermore, the spectrum for a first amine may be subtracted from the overall
spectrum
sequentially before analyzing the spectrum of a second amine to improve signal-
to-noise
ratio. For example, an ethanolamine spectrum is stronger than a methylamine
signal. By
subtracting the ethanolamine spectrum, one can improve the accuracy of
methylamine
analysis.
Use of an Intermediate Reaction
[0046] In yet other examples, a reaction involving the analyte is
used to produce or
consume a more SERS active compound. The amount of the more SERS active
compound
in the reaction product is measured to determine if SERS active compound was
created or
consumed. A reference compound for the more SERS active compound can be used
to
increase the accuracy of the measurement. The amount of the more SERS active
compound that is consumed or created in the reaction can then be used to
calculate the
concentration of the analyte using a formula for the reaction.
-11 -
CA 03036790 2019-03-13
WO 2017/049114
PCT/US2016/052178
[0047] In one example, the consumption of pyridine is used to
determine the
concentration of a gem-halogenated compound. The amount of gem-halogenated
compound required to consume a certain amount of pyridine can be determined
according
the Fujiwara reaction, normally used in a colorimetric method for the
detection of gem-
.. halogenated compounds using pyridine. The gem-halogenated compound may be,
for
example, trichloroethylene, a trihalomethane, chloroform, or a haloacetic acid
[0048] In one example, the concentration of a gem-halogenated
compound, in
particular trichloroethylene (TOE), is measured. A sample is taken of water
suspected of
containing TOE in the ppb range. The pH of the sample is adjusted to 12-13,
for example by
adding caustic, as needed for the Fujiwara reaction. Dilute pyridine solution,
for example at
about 100-150 ppb, is added in a 1:1 or similar volume ratio to the alkaline
sample. The
reaction of pyridine with TOE will progress, resulting in complete consumption
of the TOE
and a decrease in the pyridine concentration. We then add an internal
standard, for example
a solution of pyridine-d5 of known concentration and volume, to the reaction
product solution.
When mixed with a SERS substrate such as gold nanoparticles, the resulting
SERS signal
will be a combination of pyridine-do and pyridine-d5 signals. We then scale
the signal to the
main pyridine-d5 peak, which is spectrally shifted from the main do peak, to
determine the
amount of pyridine-do remaining. Subtracting this value from the initial
amount of pyridine
gives the amount of pyridine consumed. This value can be used to calculate the
amount of
TOE that was present in the original sample. If there is no pyridine left
after reaction then the
test is inconclusive and must be repeated with a larger initial amount of
pyridine.
[0049] Alternatively, a pyridine derivative such as nicotinamide may
be used to
determine the concentration of a gem-halogenated compound. Nicotinamide may
offer
benefits such as selectivity, usability, or safety. Pyrdine-d5 may be used as
an internal
standard with a pyridine derivative, as may an isotopologue of the pyridine
derivative.
[0050] In another example, the concentration of formaldehyde is
measured by way of
a reaction between an amine and formaldehyde. Cysteamine reacts with
formaldehyde to
create a thiazolidine. Cysteamine is also a thiol that interacts strongly with
a gold substrate.
A sample of formaldehyde is mixed with a known amount of cysteamine. The
reaction
completely consumes the formaldehyde and some of the cysteamine. This reacted
product
solution may then be mixed with a cysteamine isotopologue and gold
nanoparticles. The ratio
of cysteamine isotopologue to cysteamine provides a measure of cysteamine
remaining,
which can be used to determine the initial formaldehyde concentration.
Alternatively, a
- 12 -
CA 03036790 2019-03-13
WO 2017/049114
PCT/US2016/052178
thiazolidine isotopologue can be added to the reacted product solution to
provide a measure
of cysteamine remaining, which can be used to determine the initial
formaldehyde
concentration. In either case, the lack of any remaining cysteamine indicates
a failure and
that the method should be repeated starting with a larger amount of
cysteamine. In these
examples, cystamine may be used in place of cysteamine.
Quantification of ions
[0051] The methods and equipment described above may also be adopted
to
measure the concentration of ions, for example molecular anions, in water. The
concentration may be in the ppb range. In addition to a reference compound, a
binding
compound is used to increase interaction between the ion and the
nanoparticles. The
binding compound may be an amine, preferably with no more than 3 carbon atoms
between
a nitrogen atom and a sulfur atom, for example a thiol. A mixture of anylate,
isotopologue,
binding compound and nanoparticles is adjusted to an acidic pH, for example
5.0 or less.
The preferred pH can be determined by trial and error, but varies with the pKa
of the binding
compound and can be estimated from the examples below adjusted to reflect the
pKa of a
different amine if used.
[0052] In one example, the concentration of perchlorate ions is
measured.
Perchlorate is a hydrophobic anion. By first modifying the surface of the SERS
nanoparticles,
i.e. gold nanoparticles, with a hydrophobic cationic species, we create a
surface interaction
between perchlorate and the nanoparticle. Under acidic conditions, amines
become
protonated, acting as a cationic treatment to draw anionic species to the
nanoparticle. Thiol-
based amine compounds like dimethylaminoethanethiol or diethylaminoethanethiol
create
such a surface. Other anions like sulfate or selenate that are not hydrophobic
interact with
SERS nanoparticles, i.e. gold nanoparticles, under the influence of less
hydrophobic
compounds such as cysteamine. The addition of an anionic isotopologue as an
internal
standard enables repeatable, accurate measurements.
[0053] In a particular example of perchlorate measurement, the user
starts with at
100-pl sample of water expected to contain perchlorate. To this sample, 10- pl
of a 550-ppb
perchlorate 18O4 solution is added, resulting in a final concentration of 50-
ppb 011804 in the
sample. This sample is then adjusted to pH 1.8-3.0, preferably about 2.5 using
hydrochloric
acid. Next, a small quantity of methanol (10-pl) and a preferred thiol
compound
(dimethylaminoethanethiol) is added to the sample vial, followed by 5-ul of
concentrated gold
- 13-
CA 03036790 2019-03-13
WO 2017/049114
PCT/US2016/052178
nanoparticles. This combined sample is allowed to dry on a clean, steel
substrate, and then
analyzed via Raman spectroscopy. The heavy perchlorate provides an internal
standard
against which the intensity of the perchlorate spectrum is compared. The
resulting calibration
curve is presented in Figure 5. Measurement accuracies of 10% with 4-ppb
detection limits
are possible. A similar approach works for the detection and quantification of
chromate, using
the heavy-oxygen isotopologue of chromate as an internal standard.
[0054] In cases where creation of the isotopologue would be unduly
expensive or
complicated, a similar anion can be used as a reference material. A similar
anion preferably
has the same number and kind of electron acceptors attached to an electron
donor with the
same type of bonds. For example, selenium and sulfur have very similar
structures. The
detection of selenate may be achieved by using sulfate or a selenate
isotopologue
(preferably with 4 180) as an internal standard, with cysteamine or cystamine
as a
nanoparticle surface treatment compound. The pH of the mixture of selenate,
isotopologue,
cysteamine or cystamine and SERS substrate (for example gold nanoparticles) is
preferably
adjust to about 3.5, for example by adding HCI. However, sulfate is a commonly
occurring
material, making a sulfate isotopologue (S1804) a convenient internal
standard. Furthermore,
by using a sulfate isotopologue, both sulfate and selenate can by quantified
simultaneously.
A calibration curve of selenate measured using a sulfate isotopologue as an
internal
standard is presented in Figure 6.
[0055] In preparing an isotopologue of a molecular anion, it is preferably
to replace all
of the 0 atoms with 180. This requires a reaction driven to completion, which
more easily
creates a substantially pure isotopologue than a partial substitution of
oxygen ions. The
natural occurrence of such isotopologues is also rare and so adjustments are
generally not
required for isotopologue purity or naturally occurring isotopologues.
However, the
isotopologue should not be exposed to conditions that would cause it to revert
to the
naturally occurring form. For example, a selenate isotopologue with 180 should
not be stored
in highly acidic water (i.e. pH of 1.0 or less) for an extended period of time
since this will
cause it to swap its heavy oxygen with oxygen in the water.
[0056] Although the nanoparticles may be pre-treated with an
additional compound
such as a thiol before adding the sample, it is preferable that the additional
compound be
mixed with the nanoparticles at about the same time the sample. This process
increases
response while improving product lifetime.
- 14 -
CA 03036790 2019-03-13
WO 2017/049114
PCT/US2016/052178
[0057] In other examples, addition of anionic compound, such as 3-
mercaptopropionic acid, to nanoparticles enable the measurement of cationic
ions in water.
As discussed above, an internal reference standard for the cationic ions is
preferably also
added.
Quantification in complex matrices
[0058] In some cases, a measurement method as described above may be
applied to
analyte measurement in complex sample matrices. For example, refinery process
waters
may contain ppm-level amines in the presence of many salts and hydrocarbons.
Pre-
treatment methods can prepare the sample for analysis; however, pre-treatment
can be
challenging as it may affect the level of the analyte of interest. In these
cases, adding the
reference compound before treatment reduces errors caused by pre-treatment.
The pre-
treatment may be, for example, solid-liquid separation, ion exchange, strong
anion exchange
or ion extraction.
[0059] For example, the measurement of amines in refinery sour water
presents a
significant challenge. Sour water is defined by the presence of sulfide, which
leads to the
distinctive odor. These water samples, however, can also contain an array of
other
contaminants: ionic species, metals, organic acids, hydrocarbons, and amines,
to name a
few. Water collected from desalter operations, for example, may have high ion
and amines
levels (potentially more than 1000-ppm). Overhead water, in contrast,
typically has
contaminants levels below 100-ppm.
[0060] To analyze complex samples, the user first introduces the
internal standard,
such as an isotopologue, to the sample before sample pre-treatment. The sample
pre-
treatment will remove the analyte and the internal standard generally equally,
enabling a
precise concentration measurement after the pre-treatment. The pre-treatment
is preferably
a process to remove anions, for example an anion exchange or anion extraction
process.
The pH of the mixture of analyte and isotopologue is preferably reduced as
required to keep
the analyte and isotopologue in solution while undesirable anions are removed
in the
pretreatment process. Alternatively, the analyte and isotopologue maybe
captured by
passing the mixture through a cation extraction unit, discarding the remainder
of the sample,
and then eluting the analyte and isotopologue from the cation extraction unit.
[0061] For sour water analysis, an exemplary sample preparation
method is
presented in FIG 7. A solid-phase extraction (SPE) column designed for the
removal of
- 15-
CA 03036790 2019-03-13
WO 2017/049114
PCT/US2016/052178
anions is first cleaned with 5-mL of 0.01 M HCI. The 500-pL sample is mixed
1:1 with a
reagent solution containing the isotopologue. 10 pL of 1 M HCI is added to
this mixture and
then the mixture is introduced to the SPE column. The first 500-pL is
discarded, and the
remaining sample is collected. The pH of the remaining sample is adjusted
upwards and
then its Raman spectrum is measured.
[0062] US application 14/198,163 filed on March 5, 2014 is
incorporated herein by
reference.
[0063] The present invention has now been described in accordance
with several
exemplary embodiments, which are intended to be illustrative in all aspects,
rather than
restrictive. Thus, the present invention is capable of many variations in
detailed
implementation, which may be derived from the description contained herein by
a person of
ordinary skill in the art. For example, many additional amines may be detected
using a
similar approach. These amines include methylamine, diethanolamine,
methyldiethanolamine, dimethylethanolamine, diisopropylamine, cyclohexylamine,
morpholine, and methoxypropylamine. Other anions including nitrate, chromate,
thiosulfate,
phosphate, and carbonate may be detected using similar approaches to the
method
presented for perchlorate analysis.
[0064] All such variations are considered to be within the scope and
spirit of the
present invention as defined by the following claims and their legal
equivalents.
- 16 -