Note: Descriptions are shown in the official language in which they were submitted.
CA 03046702 2019-06-10
WO 2018/102573
PCT/US2017/063993
SYSTEM AND METHOD FOR SOLAR VAPOR EVAPORATION AND
CONDENSATION
Cross-Reference to Related Applications
[0001] This application claims priority to U.S. Provisional
Application No. 62/428,138,
.. filed on November 30, 2016, now pending, and U.S. Provisional Application
No. 62/517,604,
filed on June 9, 2017, now pending, the disclosures of which are incorporated
herein by
reference.
Background of the Disclosure
[0002] The advent of the steam engine was one of the key developments
that led to the
first Industrial Revolution. Since then, the use of steam has influenced many
aspects of modern
life. For instance, thermal steam generation and condensation was one of the
dominant
technologies for seawater desalination before the introduction of reverse
osmosis technologies.
Although membrane-based technologies became the dominant solution to
desalination, they are
usually energetically demanding with serious environmental impacts arising
from cleaning and
maintenance. As a result, there is emerging global interest in developing
alternative desalination
technologies to address these issues. Solar vapor generation with no
electrical input is proving to
be a promising and environmentally benign solution, especially in resource
limited areas.
However, conventional techniques for generating solar vapor typically rely on
costly and
cumbersome optical concentration systems to enable bulk heating of a liquid,
resulting in
relatively low efficiencies (e.g., 30%-40%) due to heat absorption throughout
the entire liquid
volume that is not directly translated into vapor production. Recently,
various advanced and
expensive metallic plasmonic and carbon-based nanomaterials have been explored
for use in
solar vapor/steam generation. However, the vaporization efficiencies of these
reported structures
are still relatively low under 1 sun illumination (e.g., 48% (10) ¨ 83%).
[0003] For practical outdoor solar still applications, stable and
continuous solar
illumination is not achievable in most areas of this planet due to varying
weather conditions.
Even with inexpensive moderate solar concentrators, a stable incident power
higher than AM 1.5
solar light still cannot be guaranteed. Additionally, since most solar stills
are covered by glass or
other similar collection material, condensation can lead to optical scattering
and a decrease in the
incident solar power. Therefore, vapor generation under < 1 solar illumination
condition is an
important, long-felt need, despite being neglected in most previously reported
work.
1
CA 03046702 2019-06-10
WO 2018/102573
PCT/US2017/063993
Brief Summary of the Disclosure
[0004] The present disclosure provides an alternative approach to
solar vapor generation
using a supported substrate. In an extremely cost-efficient and effective
embodiment, the
substrate is a carbon black-dyed cellulose-polyester blend (CCP) and the
support is expanded
polystyrene foam (EPS). A system according to some embodiments of the
disclosed technology
achieved a record thermal conversion efficiency of ¨88% under non-concentrated
solar
illumination of 1 kW/m2. This corresponds to an optimized vapor generation
rate that is ¨3 times
greater than that of natural evaporation. Stable and repeated seawater
desalination tests were
performed in a portable prototype both in the laboratory and an outdoor
environment, and
achieved a water generation rate that was 2.4 times that of a commercial
product. Also,
desalination systems according to some embodiments of the present disclosure
largely avoid the
costs for seawater intake and pretreatment that are generally required for
conventional reverse
osmosis processes. Compared with previously reported advanced nanostructures,
this CP-EPS
system is extremely low-cost in terms of both materials and fabrication,
environmentally benign,
and safe to handle during production. These attributes enable such a system to
be easily
expanded to a large scale system. Furthermore, embodiments of the present
system may be used
for simultaneous fresh water generation and treatment from heavily
contaminated source water.
Membrane filters and photocatalysts may also be incorporated to purify
contaminated source
water. Considering the challenges in contaminated/waste water treatment and
reuse, the
development of low cost, electricity-free, and multi-functional technologies
represents a
significant advance in the field.
[0005] In some embodiments, the approach further utilizes cold vapor
below room
temperature, and provides a near unity conversion efficiency of absorbed solar
energy. Due to
the energy contribution from the surroundings, the measured total vapor
generation is higher
than the upper limit that can be produced by a given incident solar energy.
Importantly, this
breakthrough technique was realized using the extremely low cost CCP-foam
system under 1 sun
illumination, with no need for advanced and expensive nanomaterials. In
addition, features for
optically absorbing and evaporative materials for solar still systems are
shown: i.e., under a
given environment, a stronger natural evaporation capability will result in a
lower surface
temperature. This provides applications in solar still technology, evaporative
cooling and solar
evaporated mining applications, evaporation-driven generators and recently
reported water-
evaporation-induced electricity.
2
CA 03046702 2019-06-10
WO 2018/102573
PCT/US2017/063993
Description of the Drawings
[0006] For a fuller understanding of the nature and objects of the
disclosure, reference
should be made to the following detailed description taken in conjunction with
the
accompanying drawings, in which:
Figure 1 depicts the physical mechanism of vapor generation. (A) Energy
balance and heat
transfer diagram of the CCP-foam under strong solar illumination. The surface
temperature, Tz, is higher than the room (ambient) temperature, Ti. (B) A
photograph of
CCP-foam floating on top of water surface and its corresponding thermal image
under
dark environment¨the surface temperature is below room temperature. (C) Energy
balance and heat transfer diagram of the CCP-foam under dark environment or
low
intensity illumination. (D) A photograph of a CCP-air gap-foam structure
floating on top
of water and its corresponding thermal image under dark environment¨the
surface
temperature is even lower than the CCP-foam structure.
Figure 2 shows vapor generation under low density light illumination. (A)
Photographs of a
CCP-foam (upper panel) and a CCP-air gap-foam (lower panel) under 0.6 sun
illumination. (B) Thermal images of the CCP-foam (upper panel) and the CCP-air
gap-
foam (lower panel) under 0.6 sun illumination. (C) Comparison of measured
water
weight change versus time of CCP-foam and CCP-air gap-foam. The upper limit
that can
be produced by 0.6 sun input solar energy is plotted by the solid curve. (D)
Thermal
images of the CCP-foam (upper panel) and the CCP-air gap-foam (lower panel)
under 0.2
sun illumination. (E) Comparison of measured water weight change versus time
of CCP-
foam and CCP-air gap-foam. The upper limit that can be produced by 0.2 sun
input solar
energy is plotted by the solid curve.
Figure 3 shows the physical interpretation of energy balance of solar vapor
generation
systems. (A) Energy flow diagram under dark conditions: the input energy from
the
environment is in balance with the evaporation energy. (B) Energy flow diagram
of a
below-room-temperature system with a weak light input: the output evaporation
energy is
the sum of the light input and the environment input. (C) Energy flow diagram
of a room-
temperature system: the output evaporation energy is in balance with the
surrounding and
light input. (D) Energy flow diagram of a hot system: the input solar energy
is the sum of
the evaporation energy and the loss to the environment.
3
CA 03046702 2019-06-10
WO 2018/102573
PCT/US2017/063993
Figure 4A and 4B show the increased surface area under 1 sun illumination.
(4A(A))
Exemplary schematic diagram to reduce the light density by introducing larger
surface
area structures. (4A(B), 4A(D)-4A(E)) Thermal distribution images and
corresponding
photographs of three exemplary samples (4A(B)) a flat CCP-foam, (4A(D)) a
triangle
structure with 0 of 37.8', (4A(E)) a triangle structure with 0 of 22.9'.
(4B(C)) Comparison
of measured water weight change versus time of the three exemplary CCP-foam
samples
(spheres)¨wherein the calculated upper limits that can be produced by 1 sun
input solar
energy are plotted by solid curves. (4A(F)-4A(G)) The thermal distribution
images and
corresponding photographs of CCP-air gap-foam structures with (4A(F)) 0 =37.4'
and
(4A(G)) 0=22.4 . (4B(H)) Comparison of measured water weight change versus
time of
these two CCP-air gap-foam samples (spheres)¨wherein the calculated upper
limits that
can be produced by 1 sun input solar energy are plotted by solid curves.
Figure 5A shows the configuration of a water diffusion height experiment for
three sample
substrates: white substrate (left); CCP (center); sodium alginate treated CCP
(right).
Figure 5B is a thermal image of the three sample substrates of Figure 5A
showing the
resulting water diffusion heights.
Figure 6 shows the optical absorption spectrum of the CCP and the transmission
spectrum of
the diffuser. The absorption is ¨96.9% by weighting absorption spectrum
(topmost curve)
with the AM 1.5 solar irradiance, which contributes to a high efficiency. The
shaded area
shows the solar irradiation spectrum as a reference. The transmission spectrum
(middle
curve) indicates that the transmitted light by the diffuser will basically
keep the energy
distribution of AM 1.5 at different wavelengths.
Figure 7 shows an experimental setup for solar vapor generation. CCP-foam is
illuminated
using the solar simulator.
Figure 8 shows an apparatus used to characterize dark evaporation in
controlled environment
(a commercial glove box is 61 cm x 46 cm x 38 cm with controlled relative
humidity and
temperature inside the box).
Figure 9 is an illustration of an embodiment of a solar evaporator module
floating on top of
water surface, wherein each module contains an electricity/solar-driven fan to
accelerate
the convection.
Figure 10 shows an embodiment of the presently-disclosed carbon substrate in a
NaCl brine
under 1 sun illumination with a picture being recorded every 30 minutes. One
can see the
salt crystal accumulated on top of the black substrate surface, which will
decrease the
4
CA 03046702 2019-06-10
WO 2018/102573
PCT/US2017/063993
vapor evaporation rate. Intriguingly, the salt crystals tended to accumulate
on the
substrate surface (up to image 10), which may simplify the collection of salt
in practice.
Figure 11 shows the mass change over time of the sample under 1 sun
illumination. Notice
that as salt builds up on our material, only a slight decrease in performance
is observed
(up to image 10). Therefore, the performance of the salt collector should be
very stable
and can be replaced easily. Moreover, when the solar simulator is turned off
after 8-hour
illumination, the salt will be dissolved from the CCP surface back into the
bulk water,
demonstrating the minimum maintenance requirements.
Figures 12A and 12B show a preliminary experiment in an outdoor environment.
Each
container has 450 ml water with 40 gram salt. After 10 hour test (Figure 12B),
obvious
salt can be obtained from the carbon substrate surface (left container) while
the control
sample did not have any output (right container). Therefore, the presently-
disclosed
strategy can be used for a solar mining using low concentration solution. At
least 8 grams
of salt were obtained from the carbon substrate surface in the experiment.
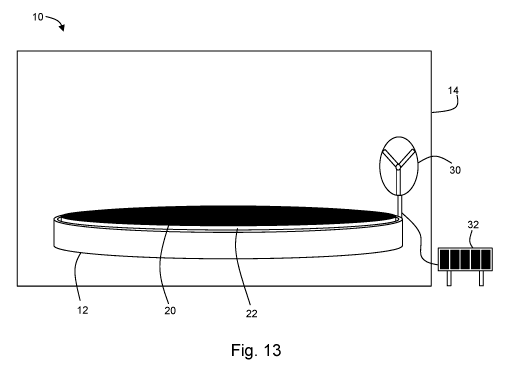
Figure 13 depicts a system according to another embodiment of the present
disclosure.
Figure 14 (A) Scanning Electron Microscope (SEM) image of uncoated fiber-rich
paper.
(B) SEM image of CCP under low and high magnifications (inset). (C) Top line:
Absorption spectra of uncoated white paper; Bottom line: Absorption spectra of
CCP.
Absorption spectra were measured by an integration sphere; Inset: Photograph
of these
two pieces of paper. (D) Comparison of water weight change versus time under
four
different conditions: i) water in dark environment; ii) water under 1 kW/m2
illumination;
iii) floating white paper under 1 kW/m2 illumination and iv) floating CCP
under 1 kW/m2
illumination. (E) The surface temperature distribution of the four samples
measured in
Figure 14(D) measured using a thermal imager: the upper left panel corresponds
to i) of
Figure 14(D); the upper right panel corresponds to ii) of Figure 14(D); the
lower left
panel corresponds to iii) of Figure 14(D) and the lower right panel
corresponds to iv) of
Figure 14(D).
Figure 15A Photographs of a CCP with (upper panel) and without the insulating
EPS foam
(lower panel) floating on top of water.
Figure 15B Photograph of the CCP-foam structure with cover foam to eliminate
evaporation
from the water surface surrounding the CCP-foam structure.
5
CA 03046702 2019-06-10
WO 2018/102573
PCT/US2017/063993
Figure 15C Comparison of water mass change due to evaporation versus time
under four
different conditions: water under 1 kW/m2, exfoliated graphite on foam from
previous
work, CCP without insulating foam, and CCP with insulating foam.
Figure 15D Surface temperature distribution of an exemplary CCP with (upper
panel) and
without the insulating EPS foam (lower panel) floating on the water.
Figure 16 (A) The water mass change as a function of time under 1, 3, 5, 7 and
10 times
concentrated solar illumination, respectively. (B) The temperature change as a
function of
time under 1, 3, 5, 7 and 10 times concentrated solar illumination,
respectively. The solid
lines represent vapor temperatures measured by a thermometer installed above
the CCP-
foam. The dashed lines represent bulk water temperatures measured under the
foam,
while the lines are as for Figure 16(A). (C) The solar thermal conversion
efficiency (light
gray dots) and corresponding evaporation rate (black dots) as a function of
solar
intensity. (D) Direct comparison of solar thermal conversion efficiencies
obtained by
previously reported structures and an exemplary CCP-foam according to an
embodiment
of the present disclosure.
Figure 17 (A) Energy balance and heat transfer diagram in an exemplary CCP-
foam
architecture during the vapor generation process. (B) Diagram of the detail
near the
surface of the CCP structure during the vapor generation process.
Figure 18 (A) Evaporation rate of exemplary CCP-foam samples on salt water and
pure
water as the function of cycle number. The two solid lines are reference lines
to show the
stable performance. (B) An SEM image of an exemplary CCP sample after 1 hour
evaporation in salt water. (C) Evaporation rate of CCP sample in salt water
over an 8-
hour evaporation period as a function of illumination time. (D) Photographs
and (E)
thermal images of an exemplary CCP-foam on salt water at times corresponding
to the
evaporation rate of salt water in Figure 17(C).
Figure 19A (A) Schematic illustration of a conventional desalination solar
still. (B)
Photograph of a 5 x5 CCP array with a total area of 100 cm2 according to an
embodiment
of the present disclosure. (C) and (D) are thermal images of the CCP array
before (C) and
after (D) solar illumination. (E-G) Photographs of experimental systems with
(E) a CCP-
foam array on salt water, (F) bare salt water with a layer of black aluminum
foil placed at
the bottom, and (G) bare salt water with no CCP-foam. (I) The photograph of a
prototype
system placed outdoors on a lake. (J) The photograph of a control experiment
with a
6
CA 03046702 2019-06-10
WO 2018/102573
PCT/US2017/063993
commercial product (left) and the exemplary system (right) during the
experiment.
Condensation can be seen at the inner surfaces of the covers.
Figure 19B (H) Hourly water weight change with the exemplary CCP-foam array on
the
water surface (dots), black aluminum foil at the bottom (triangles), and salt
water
(squares) as a function of illumination time; the top dashed line is the
hourly bulk water
temperature under CCP foam; middle dashed line is the hourly bulk water
temperature
with the black aluminum foil at the bottom of the container; bottom dashed
line is the
hourly water weight change of salt water. (K) The solar intensity (upper
panel) and
outdoor temperature curves (lower panel) from 8:00 am to 6:00 pm on May 6,
2016.
Figure 20 (A) Comparison of the water solution used to ultrasonically clean a
CCP sample
after different amounts of time. (B) Photographs of the CCP sample after
different
amounts of ultrasonic cleaning time. (C) Optical absorption spectra of the CCP
sample
after ultrasonic cleaning.
Figure 21(A) Surface temperature distribution of a black Al foil (left) and a
CCP sample
(right) placed on top of a heat plate set at 40 C. (B) Direct measurement of
the
temperature at three positions using a thermal couple sensor probe.
Figure 22 Photographs of an experimental setup to measure the temperature of
(A) vapor and
(B) bulk water.
Figure 23 Optical absorption spectrum of a black Al foil measured by an
integration sphere.
Inset: the photograph of a black Al foil.
Figure 24 is a diagram depicting another embodiment of the present disclosure.
Figure 25 is a diagram depicting another embodiment of the present disclosure.
Figure 26A is a side view of an exemplary solar still according to an
embodiment of the
present disclosure.
Figure 26B is a top view diagram of the solar still of Figure 26A.
Figure 26C is a photograph of the exemplary solar still constructed according
to Figures 26A
and 26B.
Figure 27 is a diagram of an exemplary floating CCP-foam with air gap for
thermal isolation
(side view).
Figure 28 is a chart depicting another embodiment of the present disclosure.
7
CA 03046702 2019-06-10
WO 2018/102573
PCT/US2017/063993
Detailed Description of the Disclosure
[0007] Unless defined otherwise herein, all technical and scientific
terms used in this
disclosure have the same meaning as commonly understood by one of ordinary
skill in the art to
which this disclosure pertains. The disclosure includes all combinations of
all components and
steps described herein. Throughout this application, the singular form
includes the plural form
and vice versa.
[0008] By utilizing extremely low-cost materials in this invention,
economically viable
large-area systems are now possible with no energy input required for
operation. This prospect is
particularly attractive for addressing global freshwater shortages, especially
for individuals to
purify water for personal needs (i.e., ¨2 liter/day) in developing regions.
Because embodiments
of the present disclosure do require special micro/nanofabrication processes
and do not require
solar concentrators, the disclosed technology is extremely low-cost and
amenable to scaling up
over large or huge areas for real applications.
[0009] Without being bound by any theory, due to the superior
absorption, heat
conversion, and insulating properties of the presently-disclosed CCP-foam
structure, most of the
absorbed energy can be used to evaporate surface water with significantly
reduced thermal
dissipation compared with previously reported architectures. Without being
bound by any theory,
due to the thermal insulation between the surface liquid and the bulk volume
of the water and the
suppressed radiative and convective losses from the absorber surface to the
adjacent heated
vapor, a record solar thermal conversion efficiency of > 88% under
illumination of 1 kW/m2
(corresponding to the evaporation rate of 1.28 kg/(m2.h)) was realized using
an embodiment of
the disclosure having no solar concentration. When scaled up to a 100 cm2
array in a portable
solar water still system, the outdoor fresh water generation rate was 2.4
times of that of a leading
commercial product. Furthermore, seawater desalination was also demonstrated
with reusable
stable performance.
[0010] To enhance the vapor generation rate, typically the approach
is to increase the
operation temperature for a given solar illumination. However, this will
inevitably increase the
thermal loss to the surroundings mainly via conduction, convection and
radiation losses.
Therefore, high temperature solar vapor generation (e.g., with solar
concentration) inherently
suffers from limits in energy conversion efficiencies.
8
CA 03046702 2019-06-10
WO 2018/102573
PCT/US2017/063993
[0011] In some embodiments, present disclosure provides techniques
which take an
opposite approach, using solar energy to generate cold vapor below room
temperature, to provide
surprising results. This is a breakthrough pathway for efficient solar vapor
generation since
under illumination at low power densities, the absorbed-light-to-vapor energy
conversion
efficiency can reach ¨100% when the evaporation temperature is lower than the
room
temperature. Under this condition, the environment will provide additional
energy for vapor
generation, resulting in a total vaporization rate that is higher than the
upper limit that can be
produced using the input solar energy alone. This cold vapor generation
technique was
experimentally validated and demonstrated limit-breaking vaporization rates
using an extremely
low cost CCP-foam system.
[0012] With reference to Figure 13, in a first aspect, the present
disclosure may be
embodied as a solar vapor generation system 10 having an open-topped vessel 12
for holding a
solution, for example, a water-based solution. A substrate 20 is configured to
be placed in the
open-topped vessel 20. The substrate 20 is configured to wick solution from
the vessel 12. The
substrate 20 may be supported near an exposed surface of the solution (i.e.,
near the top of the
open-topped vessel 12) by a support 22. The support may have a density less
than water. The
support 22 may be thermally insulative and/or thermally stable. The support 22
may be a foam.
The support 22 may be configured to not absorb water. The support 22 may
comprise expanded
polystyrene foam (EPS), polyurethane foam, polyvinyl chloride foam,
polyethylene form, a
phenol formaldehyde resin foam, or other foam materials or combinations of one
or more
materials. The support 22 may include an air gap, to separate at least a
portion of the substrate 20
from the support 22 allowing air to pass between a portion of the support 22
and the substrate 20
(see, e.g., Figure 27).
[0013] The system 10 may further comprise a housing 14. The substrate
20 and the
support 22 may be located within the housing 14. In some embodiments, at least
a portion of the
vessel 12 may be located within the housing 14. The housing 14 may be
configured so as to
admit solar energy. For example, the housing 14 may have a transparent top.
For example, the
housing 14, or a portion thereof, may be made from a transparent plastic, a
transparent glass, a
transparent polymer membrane (e.g., microwave membrane), etc. In some
embodiments, an
interior surface of the cover is coated with a non-toxic, anti-mist super-
hydrophobic surface
treatment.
9
CA 03046702 2019-06-10
WO 2018/102573
PCT/US2017/063993
[0014] The system 10 may further comprise an air mover 30 configured
to cause air (e.g.,
ambient air) to move adjacent to the substrate 20. The air mover 30 may be an
electrically-
powered fan 30, which may be powered by way of, for example, a solar cell 32.
[0015] In some embodiments, a temperature of the substrate 20 is
maintained
substantially at or below an ambient temperature. For example, in embodiments
having a
housing 14, the housing may be a temperature-controlled housing 14 for
maintaining an ambient
temperature above the temperature of the substrate 20. By maintaining a
temperature
substantially at an ambient temperature, it is intended that the temperature
of the substrate be
maintained to within 5 C of the ambient temperature. In some embodiments,
substantially at the
.. ambient temperature means to maintain the temperature to within 1, 2, 3, or
4 C or any other
value therebetween to within a decimal position. In some embodiments, the
substrate is
maintained at a temperature below the ambient temperature.
[0016] In some embodiments, the system 10 is used as a solar still.
For example, in such
embodiments, the system 10 may be used to desalinate water for use as drinking
water. In such
.. embodiments, the system 10 may further comprise a condenser for condensing
the generated
vapor. For example, the housing 14 may be configured such that vapor condenses
on the
housing 14 (i.e., an inner surface of the housing) for recovery of the
condensate. In other
embodiments, a condenser, such as a condensation trap, may be located within
the housing or
outside of the housing.
[0017] As will be further described below under the heading "Further
Discussion," the
substrate 20 may be configured as a planar sheet generally parallel to a top
surface of the
solution. In another embodiment, the substrate is tent-shaped, comprising two
planar sheets
connected to one another along an adjoining edge. The two planar sheets of a
tent-shaped
substrate may connect at any angle, for example, at an angle of between 1.0
and 180.0 degrees,
all values and ranges therebetween to the first decimal place (tenths). In
some embodiments, the
two planar sheets connect at an angle of between 20.0 and 45.0 degrees,
inclusive and all values
and ranges therebetween to the first decimal place (tenths).
[0018] The substrate may be a porous material, such as, for example,
a fabric. The
substrate may comprise paper and/or plastic, for example, a porous fabric
material comprising
.. paper and/or plastic. In some embodiments, the substrate is a
hydroentangled, non-woven 55%
cellulose / 45% polyester blend, such as TechniClothTm Wiper TX609, available
from Texwipe.
CA 03046702 2019-06-10
WO 2018/102573
PCT/US2017/063993
The word "paper" does not signify, expressly or implicitly, any equivalence
between the "paper"
used in some embodiments of the subject disclosure and alternative paper
material including any
prior substrate which may have been called "paper," but which may have a
different or unknown
composition or arrangement of fibers. The material may comprise material or
material(s) suitable
for the purposes of the present substrate as will be apparent in light of the
present disclosure.
[0019] In some embodiments, the substrate comprises a
cellulose/polyester blend. The
blend may comprise about 35% to about 75% cellulose, including all integers
and ranges
therebetween, and about 45% to about 65% polyester, including all integers and
ranges
therebetween. In an embodiment, the blend may comprise about 55% cellulose and
about 45%
polyester. In another embodiment, the substrate may consist essentially of
cellulose, while in a
different embodiments, the substrate does not consist essentially of
cellulose.
[0020] In some embodiments, the substrate is made from non-woven
fibers. In other
embodiments, the substrate is made from woven fibers (e.g., yarns). In other
embodiments, the
substrate is a composite material. For example, the substrate may be made from
one or more
non-woven layers and/or one or more woven layers. In another example of a
composite, the
substrate may be made from more than one layer, each layer made from the same
or different
materials. Plastic or paper filter (virgin kraft paper) may also be used as
the substrate. In a further
embodiment, the substrate does not consist essentially of any one of the
following: coral fleece
fabric, cotton, wool, nylon, jute cloth, coir mate or polystyrene sponge.
[0021] In some embodiments, the substrate has a dark hue au naturale. In
some
embodiments, the substrate is coated, dyed, or otherwise colored to attain a
dark hue. In some
embodiments, the substrate is black or substantially black. For example, the
substrate may be
coated, dyed, or otherwise colored with carbon black. In some embodiments, the
carbon black
comprises nanoporous carbon black, microporous carbon black, or a mixture
thereof. In another
.. embodiment, the carbon black consists essentially of nanoporous carbon
black. Selecting carbon
black of a particular sized porosity may be helpful in cleaning contaminated
water. However, it
is not necessary for the distillation of water, in which general purpose black
carbon may be used.
Other black or dark pigments may also be used to dye or coat the substrate.
[0022] In some embodiments, the substrate may have a length of about
8 cm to about 14
cm and all integers and ranges therebetween. The length was determined by the
water
transportation capability of the substrate. The exemplary length of about 10
cm to about 14 cm
11
CA 03046702 2019-06-10
WO 2018/102573
PCT/US2017/063993
was used in an exemplary embodiment for a hydroentangled (non-woven) substrate
consisting of
about 55% cellulose and about 45% polyester. The width may be greater for more
substrates
with greater liquid transport potential. The length may be less than 10 cm or
greater than 14 cm
according to the application at hand.
[0023] In some embodiments, the substrate may have a width of about 8 cm to
about 14
cm and all integers and ranges therebetween. The width was determined by the
water
transportation capability of the substrate. The exemplary width of about 8 cm
to about 14 cm was
used with a hydroentangled (non-woven) substrate consisting of about 55%
cellulose and about
45% polyester. The width may be greater for more substrates with greater
liquid transport
potential. The width may be less than 8 cm or greater than 14 cm according to
the application at
hand.
[0024] In some embodiments, the substrate has the shape of a cross.
In some
embodiments, the substrate has the shape of a square or rectangle. The
substrate may be any
shape suitable to the application.
[0025] In some embodiments, the substrate is corrugated, in whole or in
part (see, e.g.,
Figure 27). For the corrugation, smaller angles with straight and sharp angle
tips may be
advantageous. Considering the moving sun light, using corrugation having a
smaller depth may
be better because using a large depth may cause a shadow effect whereby some
substrate will be
shielded from light. An upper limit of the corrugation depth may be selected
such that the
solution can be transported to the entire surface of the substrate.
Corrugation not only
significantly increases the surface area, but also maintains the evaporated
vapor at a relatively
low temperature so that energy loss to heat the water and vapor can be
suppressed, without being
bound by any theory.
[0026] In some embodiments, the substrate and its support float at
the surface of the
solution. For example, the solution may be source water to be distilled. In
such embodiments,
where the substrate and its support float on the source water, the dimensions
of the support and
of the substrate may be selected so that the ends of the substrate overlap the
edges of the support
and contact the source water as shown in Figure 2A.
[0027] In some embodiments, the support has a length of about 8 to
about 10 cm. In
some embodiments, the support has a width of about 8 to about 10 cm. The
support has a height
12
CA 03046702 2019-06-10
WO 2018/102573
PCT/US2017/063993
of about 8 to about 14 cm. The height can be greater for more absorbent
substrates or substrates
with enhanced liquid transport (wicking) capability. As before, these
dimensions were optimized
for a hydroentangled (non-woven) substrate consisting of about 55% cellulose
and about 45%
polyester. The dimensions of the support and of the substrate may be selected
so that the ends of
the substrate overlap the edges of the support as shown in Figure 2A. Other
support sizes may be
used and the above are merely exemplary dimensions used to illustrate the
present disclosure.
[0028] Figure 24 depicts a solar vapor evaporation and condensation
system 100
according to another embodiment of the present disclosure. A water source 104
is configured to
provide a supply of water to an open-topped vessel 112. For example, the water
source 104 may
be higher than the vessel 112 such that water flows by gravity. In some
embodiments, the water
source 104 may be a dark in color¨for example, black¨so that the contained
water may be
heated via solar heating. The system 100 may include a valve 106 configured to
regulate the flow
of water from the water source 104. The valve 106 may be any suitable type of
valve, such as a
manually-controlled valve. In some embodiments, the valve 106 may be
controlled
automatically, for example, based on a water level in the vessel 112. The
vessel 112 may be
thermally isolative. For example, the vessel 112 may have a double-walled
construction. Other
thermally isolative configurations will be apparent to the skilled person in
light of the present
disclosure.
[0029] A support 122 is disposed within the vessel 112, and a
substrate 120 is disposed
on the support 122. As described above, the support 122 may be made from any
suitable
material, such as, for example, EPS foam. Also as described above, the
substrate 120 may be
made from a suitable wicking material, such as, for example, CCP. Other
materials may be used
for the support 122 and/or the substrate 120. The some embodiments, the
support 122 is
configured to float on water contained within the vessel 112. The substrate
120 may be
configured to wick water contained within the vessel 112. The system 100 may
include a solar
concentrator 130¨such as, for example, a Fresnel lens¨for increasing the solar
energy directed
towards the substrate 120.
[0030] The system 100 further includes a housing 140, which may be in
the shape of a
cone, a dome, a pyramid, or any other shape suitable to the purpose as is
described herein. The
housing 140 is arranged to contain the vessel 112 within. In this way, water
vapor evaporating
from the water in the vessel 112 will condense on an inner surface of the
housing 140 and run
13
CA 03046702 2019-06-10
WO 2018/102573
PCT/US2017/063993
down the inner surface for collection in a collection container 150. The
collection container 150
may be constructed so as to encourage condensation. For example, the
collection container 150
may be constructed using a single-layer of material, such as a plastic or
metal material. The
system 100 may further include an outlet 152 whereby condensate (distillate)
may be accessed
for further use/storage.
[0031] In another embodiment, a system 200 is configured to be used
in a body of
water 290 (see, e.g., Figure 25). For example, the system 200 may be designed
to float in a body
of water 290, such as, for example, a lake, pond, river, man-made pools, etc.
A substrate 220 is
disposed on a support 222, and configured to wick water from the body of water
290 (e.g., the
substrate 220 may overlap the support 222 and contact the water). The
substrate 220 and
support 222 may be CCP-EPS foam, or other suitable materials as further
described in this
disclosure. A housing 240 is configured to contain the substrate 220 and
support 222. The
housing 240 is arranged such that water vapor evaporated from the substrate
220 is contained
within the housing 240 and caused to condense on an inner surface of the
housing 240. The
housing 240 includes a collection channel 242 arranged to collect condensate
which forms on the
inner surface of the housing 240. In this way, the condensate will run down
the inner surface of
the housing 240 into the collection channel 242 where it is collected for
use/storage. In some
embodiments, the collection channel 242 or a portion thereof is advantageously
arranged to be
disposed within the bulk water 290 such that the bulk water cools the
collection channel 242.
[0032] In some embodiments, the support includes an air gap 323 between a
portion of
the substrate 320 and a portion of the support 322 (see, e.g., Figure 27).
Such an air gap may
serve as a thermal isolator to minimize thermal dissipation into the bulk
water.
[0033] In another aspect, the present disclosure may be embodied as a
method 400 for
solar vapor generation including placing a solution, such as a water-based
solution in an open-
topped vessel (see, e.g., Figure 28). A substrate may be disposed 403 in
and/or on the solution.
The substrate may be configured in any way described herein. The substrate may
be disposed
403 on the solution using a support, such as a foam support, to float the
substrate at or near a top
surface of the solution. The substrate is exposed 406 to solar energy thereby
causing evaporation
of the solvent (e.g., water), or increasing the rate of evaporation of the
solvent over the rate at
which evaporation would occur without a substrate and/or exposure to solar
energy. The method
400 includes maintaining 409 the substrate at a temperature which is below the
ambient
14
CA 03046702 2019-06-10
WO 2018/102573
PCT/US2017/063993
temperature. The method may include moving air adjacent to the substrate to
further increase the
rate of evaporation and/or cool the substrate.
[0034] Some embodiments include chemically treating the substrate
and/or the carbon to
be more hydrophilic. In some embodiments, the substrate and/or the carbon is
treated with
sodium alginate.
[0035] As previously mentioned, in some embodiments, the subject
invention provides
methods and systems for solar distillation of water comprising a substrate on
a support. The
substrate may be referred to herein as a wick.
[0036] The sides, base, distillate channel, and collection container
may each
independently comprise metal, plastic or wood. The plastic may be acrylic. For
the base, plastic
or metal are preferred.
[0037] Optionally, foam or other material less dense than water may
be added to ensure
that the system floats (see, e.g., Figure 19A(I)). For example, a foam ring or
open square may be
attached to the lower sides of the system.
[0038] In an alternative embodiment, at least an interior surface of the
base may angled
so that the substrate and its support are angled to face the sun.
[0039] Some embodiments of the presently-disclosed techniques are
particularly
advantageous for use in mining applications, and more particularly, in salt
mining applications.
Solar salt mining is a common practice to obtain a plethora of different salts
ranging from table
salt, NaCl, to Lithium-based salts (e.g., Lithium Carbonate, Lithium
Hydroxide, Lithium
Chloride, etc.), and Sodium/Potassium/Iodine salts for battery, food, and
medical applications.
While salt processing plants have the ability to process large amounts of raw
salt product every
year, these plants rarely run at full capacity due to bottlenecks in the
production of raw salts from
solar evaporation of salt brine. Using embodiments of the present disclosure,
the solar
evaporation of salt brines can be increased by 3-5x times the natural rate. A
low cost carbon
nanomaterial based substrate was developed and shown to be >88% efficient at
converting solar
light into heat (see below under the heading "CCP Discussion and Experimental
Details"). This
carbon substrate can easily be applied using a roll-to-roll process for
extremely feasible
scalability and modular systems, allowing the continued use of the existing
infrastructure for
CA 03046702 2019-06-10
WO 2018/102573
PCT/US2017/063993
solar evaporation ponds while providing greatly improved solutions to enhance
salt production.
To further maintain current infrastructure, the material used may be
mechanically stable, thereby
allowing the continued use of current collection vehicles to drive over and
scoop up the raw
salts. In addition to being low cost and scalable, the present carbon-based
substrate is chemically
inert as to prevent contamination and preserve purity of salt products.
[0040] In another aspect suitable for use in mining applications, the
present disclosure
may be embodied as an apparatus for improved salt separation in an evaporation
pond. The
apparatus is similar to the above-described system where the open-topped
vessel is a pre-existing
evaporation pond. As such, the apparatus includes a substrate configured to
wick solution from
the evaporation pond. The apparatus may include a support, configured to
support the substrate
at a position near the surface of the solution. A temperature of the substrate
is maintained below
an ambient temperature. The substrate of such an apparatus may be of any type
described herein
and may be configured as a planar sheet or a tent-shaped configuration as
described herein.
[0041] In some embodiments, the substrate is configured in a
geometric shape¨i.e.,
having a geometric circumferential shape. In a particular example (illustrated
in Figure 8), the
substrate is hexagonally shaped such that a plurality of substrates may be
arrayed to cover a large
area. Other shapes and array configurations will be apparent in light of the
present disclosure and
are within the scope of the disclosure.
[0042] The substrate may configured for mechanical separation of the
salt. For example,
the substrate may be a durable material capable of withstanding mechanical
separation (scraping,
beating, etc.) As such, the substrate may be reusable, such that once the
salts have been removed
(substantially removed), the substrate may be used to obtain salts again. In
some embodiments,
the substrate is washable. Here again, such ability to be washed allows for re-
use of the substrate.
[0043] While solar salt mining focuses on the evaporation of brine
water to collect the
salts left behind, embodiments of the present system will also enable
reclamation of the
evaporated water in a condenser unit. In this way, miners and staff may be
provided with a fresh
supply of drinking water. This means for no additional energy input, other
than the natural solar
radiation, raw salt production can be enhanced 3-5x while saving time, money,
and other
resources associated with providing these often remote mining locations with
clean drinking
.. water.
16
CA 03046702 2019-06-10
WO 2018/102573
PCT/US2017/063993
[0044] In addition, the CCP structure can also be applied to
evaporation enhancement for
water having only a low concentration of salt. In such applications,
accumulated salt can re-
dissolve into the water solution, providing a "self-cleaning" feature and
reducing the
maintenance required for operation. Additionally, Figure 10 shows a test
embodiment wherein
.. salt tended to accumulate on the surface of the substrate. This tendency
may provide an
advantage in collecting the accumulated salt. For example, mechanical
separation of the salt
from the substrate may be easier if the majority of accumulated salt is on a
surface of the
substrate.
[0045] Additionally, the presently-disclosed process includes the
geometric assembly of
the substrate. Based on geometry, the carbon substrate can be arranged to
induce higher airflow
speed which increases evaporation rates, prevents adsorption of salts onto the
surface of the
substrate and easily transfers salts to different collection containers, which
aids in overall
collection and ease of use/maintenance. As such, the apparatus for salt
separation may include
one or more air movers (for example, as shown in Figure 8).
[0046] In contrast to water purification applications, solar mining may
utilize extra
components/devices to accelerate the vapor generation rate. For instance,
electricity driven or
solar driven fans can be employed in the solar vapor generation for salt
mining. According to
preliminary experiment results, an air flow from 0.4 to 2 m/s can enhance the
vapor generation
rate by 1000% (dark environment) ¨ 15% (under 3X sun illumination). In
particular, solar driven
fans can be included in each solar evaporator model (Figure 8). In addition,
large scale fans can
also be installed at the edge of the pond.
Further Discussion
Loss channels in solar vapor generation systems and the strategy to realize
the perfect efficiency
[0047] As illustrated in Figure 1A, major loss channels include net
radiation, convection
and conduction losses. Therefore, the power flux exchanged with the
environment in the solar
vapor generation process can be described as:
P = aCoptqi ¨ ¨ ¨ h(T2 ¨ T1) ¨ qwater
(1)
[0048] Here, a is the optical absorption coefficient, Copt is the
optical concentration, qi
the normal direct solar irradiation (i.e., 1 kW/m2 for 1 sun at AM 1.5), e the
optical emission, a
17
CA 03046702 2019-06-10
WO 2018/102573
PCT/US2017/063993
the Stefan-Boltzmann constant (i.e., 5.67x10⁻⁸W/(m2.1(4)), T2 the temperature
at the surface of
the evaporative material, Ti the temperature of the adjacent environment, h
the convection heat
transfer coefficient, and qwater the heat flux to the bulk water. This
equation describes most major
processes (if not all) involved in the evaporation process, i.e., the
absorption of light, aCoptqi, the
net radiative loss to the surroundings, eo-(r2 - pi), the convective loss to
the ambient, h(T2 ¨
and the radiative and conductive loss to the bulk water, qwater. By
manipulating the energy
distribution among these channels, unique solar vapor generation mechanisms
can be realized.
For instance, a selective absorber and a bubble wrap cover can be introduced
to decrease the
infrared thermal radiation (e) and the convective loss (h) to the
surroundings, respectively, to
produce 100 C steam under one sun illumination. However, for high temperature
solar vapor
generation systems, these losses can only be reduced but not eliminated
completely. An
important question is what happens when T2 T1? In this steady case (with a
stable surface
temperature), the system will actually take energy from the environment and
the absorbed solar
energy can only be consumed in the liquid-to-vapor phase transition,
corresponding to near
perfect solar energy conversion. Next, a thermally isolated CCP on foam was
employed as a low-
cost test bed to analyze the energy balance and heat transfers under both dark
and illuminated
conditions.
Experimental embodiments and results
Materials
[0049] In an exemplary embodiment, a substrate of carbon-coated cellulose
and polyester
blend (CCP) was fabricated using commercially available materials: paper
(TexwipeTm TX609)
and carbon powder (Sid Richardson Carbon & Energy Company). In some
embodiments,
evaporation performance can be further manipulated by engineering features of
carbon
nanomaterials. For example, the light-absorbing substrate can be enhanced with
hydrophilic
features. In particular, it may be advantageous to provide a substrate that
comprises a black
material able to absorb water and sunlight simultaneously and evaporate
moisture at a higher
rate. To improve these characteristics, the porosity of a carbon nanomaterial
may be manipulated
in some embodiments. In some embodiments, the substrate and/or the carbon may
be chemically
treated to increase hydrophilicity. In some embodiments, the substrate and/or
the carbon may be
treated with sodium alginate.
18
CA 03046702 2019-06-10
WO 2018/102573
PCT/US2017/063993
[0050] In an experiment to demonstrate such features, water diffusion
height was
employed as the figure of merit to evaluate the absorptivity of materials
under test (Figure 5A).
In the experiment, water diffusion height was measured in substrates made from
three sample
materials: a first sample comprising a white substrate (left sample); a second
sample comprising
.. a substrate coated with a carbon nanomaterial (center sample); and a third
sample comprising a
carbon-coated substrate similar to the second sample and further treated with
sodium alginate
(right sample). As shown by the infrared imaging in Figure 5B, the water
diffusion height of the
first sample was approximately 23 cm. In the second sample, water diffusion
height was
approximately 37 cm, demonstrating improved water absorptivity in the CCP
material. In the
third sample, the hydrophilicity of the sample was improved by the sodium
alginate, resulting in
a water diffusion height of approximately 43 cm.
Methods
Sample fabrication
[0051] 2 g carbon powder was dispersed into 400 mL water. 8 mL acetic
acid was added
to make carbon powder easier to attach to fibers. The solution was mixed in a
1000 ml beaker
and blended well using an ultrasonic cleaner (Branson Ultrasonics Bransonic
B200) for
5 minutes. Subsequently, the prepared white substrate was put into the mixed
solution to vibrate
and stir for 3 minutes so that carbon powders can dye the substrate uniformly.
After that, the
CCP was dried at 80 C on a heating stage. This procedure was repeated three
to four times to
.. realize a desired dark color.
Sample characterization
[0052] The absorption spectrum using an integration sphere
spectroscopy (Thorlabs
IS200-4 integrated with Ocean Optics USB2000+, Ocean Optics Jaz, and Avantes
AvaSpec-
NIR256-1.7TEC for ultraviolet, visible and infrared wavelength range,
respectively). By
.. weighting optical absorption spectrum of CCP (the topmost curve in Figure
6) with the AM 1.5
solar irradiance, the optical absorption was ¨96.9%.
Solar vapor generation
[0053] To measure the water evaporation rate, a 150 mL beaker with an
inner diameter of
5 cm filled with ¨140 g water was placed under an intensity-tunable solar
simulator (Newport
19
CA 03046702 2019-06-10
WO 2018/102573
PCT/US2017/063993
69920), as shown in Figure 7. Three pieces of diffuser (10 inch x 8 inch x
0.050 inch
polystyrene sheet, Plaskolite) were used to generate a uniform light
distribution. As shown by
the middle curve in Figure 6, the overall transmission spectrum was almost
wavelength-
independent. Therefore the diffuser will not change the spectral feature of
the incident light. The
solar light intensity was measured using a power meter (PM100D, Thorlabs Inc.)
equipped with
a thermal sensor (S305C, Thorlabs Inc.) at the same height of the CCP. The CCP
was first
illuminated for approximately 30 minutes for stabilization. Then the
evaporation weight change
was measured by an electronic scale (U.S. Solid, with the resolution of 1 mg)
every 10 minutes.
The surface temperature of CCP was characterized using a portable thermal
imager (FUR
ONE ). To calibrate the temperature, a piece of white substrate without
illumination was
adopted as a reference for room temperature in the same thermal imaging. Its
temperature shown
in the thermal distribution image was calibrated by a thermometer (GoerTek).
In this case, the
error in the temperature characterization due to distance from the sample to
the thermal imager
can be minimized.
Dark evaporation
[0054] Water evaporation is a natural process which occurs under any
conditions
regardless of solar illumination. As shown in Figure 1B, a 19.6 cm2 CCP was
attached to a foam
substrate floating on top of water. Its surface thermal distribution was then
characterized using a
portable thermal imager (FLIR ONE ). The dark evaporation rate of bare water
surface was
characterized in a glove box with controlled relative humidity and temperature
(ETS Model
5501-11, electro-tech system, Inc., Figure 8). In this experiment, two sets of
measurements were
performed by fixing the relative humidity and temperature inside the box,
respectively. Each
condition was stabilized for 1 hour before the characterization.
[0055] One can see that the surface temperature of the CCP is ¨14.3
0.2 C (T2), which
is lower than that of the room temperature (i.e., Ti = 22.3-23.3 C). This was
characterized in a
laboratory environment (with the humidity of 16-25% in winter time at Buffalo,
New York)
showing that the average evaporation rate in the dark environment was 0.275
kg/(m2.h). Due to
natural evaporation, this process will consume 6.78x10⁵ J/(m2.h) energy from
the environment
(considering the enthalpy of vaporization at 14.3 C). Therefore, the energy
balance and heat
transfer diagram under dark environment (or low intensity illumination
condition) is different
from that in a previously reported solar heating situation. As shown in Figure
1C, the heat
CA 03046702 2019-06-10
WO 2018/102573
PCT/US2017/063993
transfer is actually from the environment to the CCP surface due to the lower
temperature of the
sample. According to equation (1), the convective input power, P. = -h(T2¨
Ti), is
approximately 2.88x10⁵ J/(m2.h) (h was assumed to be 10 W/(m2=K)) under dark
conditions.
This heat transfer direction is valid as long as the CCP surface temperature
is lower than the
surrounding temperature. In addition, the system has no net radiation loss
when T2 Ti. Instead,
according to the equation Prad = -eo-(r2 - pi) (e is 0.969 for the CCP, Figure
6), the radiative
input power can be calculated to be 1.56x10⁵ J/(m2.h). The remaining input is
contributed by
qwater from the substrate dipped in the water and the foam substrate (although
it is suppressed
significantly). Therefore, the CCP foam system actually takes energy from the
environment
rather than losing it. From this standpoint, an advantageous
material/structure for solar vapor
generation should have a higher evaporation rate under dark conditions in oder
to achieve a
lower equilibrium temperature. As a result of this insight, the foam under the
CCP was removed
so as to introduce an air gap (CCP-air-foam), the evaporation rate was then
enhanced to 0.340
kg/(m2.h), resulting in a lower temperature of ¨13.6 C at the CCP surface as
shown in Figure
1D. To examine how this arrangement influences solar vapor generation, light
illumination was
used to accelerate the vapor generation.
Low intensity illumination
[0056] In this experiment, a solar simulator (Newport) was employed
to illuminate the
CCP samples (Figures 2A and 7). The light beam was filtered by an optical
diffuser (Figure 6) to
get a more uniform beam spot with the power density of ¨0.6 kW/m2 (i.e.,
equivalent to the
power of 0.6 Sun at AM 1.5). However, the temperature distribution was not
uniform even under
uniform solar illumination. One can see that the surface temperature of the
central part of the
CCP-foam sample (upper panel in Figure 2B) increased up to 35.3 C, while the
CCP-air-foam
(lower panel in Figure 2B) surface temperature increased up to 29.7 C. They
are both higher
than the room temperature. Therefore, the loss channels highlighted in Figure
1A will result in
lower solar energy conversion efficiency in these areas. One can see from
Figure 2C that these
measured average evaporation rates (i.e., 0.68 kg/(m2.h) and 0.80 kg/(m2.h))
are both below the
upper limit that can be produced by the input solar energy (i.e., 0.90
kg/(m2.h), the solid curve).
It should be noted that the CCP-air-foam sample realized a better vapor
generation rate under the
same illumination, confirmed by its lower surface temperature.
21
CA 03046702 2019-06-10
WO 2018/102573
PCT/US2017/063993
[0057] To minimize these loss channels, the incident power was
reduced to ¨0.2 kW/m2.
As shown by the upper panel in Figure 2D, the central area temperature of the
CCP-foam
structure was reduced to 22.9 C. Other areas on this sample are all below
room temperature. In
addition, the highest temperature of the CCP-air-foam structure was 20.1 C
(lower panel in
Figure 2D), all below room temperature. Under this situation (i.e., Figure
1C), a total vapor
generation rate of 0.39 kg/(m2.h) was obtained for the CCP-foam sample and
0.48 kg/(m2.h) for
the CCP-air-foam sample, respectively, as shown by spheres in Figure 2E.
Remarkably, they are
all beyond the theoretical upper limit of the vapor generation rate that can
be produced by the
input solar energy (i.e., ¨0.30 kg/(m2.h), the solid curve in Figure 2E). It
should be noted that the
dark evaporation "background" was not subtracted for the reasons discussed
below.
The background evaporation
[0058] In previously reported solar vapor generation literature, the
dark evaporation was
usually considered as a background which was subtracted from the total vapor
generation to
obtain the net solar-induced vapor generation. However, by simply comparing
Figures 1A and
1C, one can see that the energy balance and heat flow direction under dark
conditions were
different from those under illuminated conditions. To test this argument, one
can simply turn off
the solar light and characterize the remaining evaporation rate immediately.
Since the surface
temperature cannot return to the sub-room-temperature operation immediately,
the dark
evaporation is not the "background" of the solar vapor generation. Then the
question is: What is
the "background"? Or, is there any "background" for solar evaporation?
[0059] To interpret this intriguing problem, here the energy balance
was analyzed using a
"water container" model, as illustrated in Figure 3. Under dark conditions
(Figure 3A), the
system took energy from the environment. The energy lost to natural
evaporation, Pout, was in
balance with the input energy (Pin) from convection, conduction, radiation and
others (if any).
The system temperature T2 was lower than the room temperature Ti, and was
dependent on the
intrinsic evaporation capability of the system under this environment
(including temperature,
humidity, pressure, system architecture, etc., Figure 8 and Table 1 below).
When a solar energy
input was introduced as shown in Figure 3B, the system temperature increased.
During this
unsteady process, the system held more energy from the solar input due to its
thermal capacity.
When the system temperature increased up to the room temperature (Figure 3C),
the input
energy channel from the environment closed. Ultimately, the output energy
consumed by the
22
CA 03046702 2019-06-10
WO 2018/102573
PCT/US2017/063993
evaporation was in balance with the input solar energy with 100% conversion
efficiency under
the new steady state. When the input solar energy was increased further
(Figure 3D), the system
temperature T2 was higher than Ti. Then the energy was lost through
conduction, convection and
radiation channels. In this case, the evaporation energy was always smaller
than the input energy.
Therefore, the absorbed solar energy conversion efficiency was definitely
smaller than 100% and
the obtained vapor generation rate could not surpass the theoretical upper
limit. In particular,
when the light was turned off, the evaporation rate did not change immediately
due to the stored
thermal energy in the system. One can see that in this process, no dark
"background" should be
considered since there was no energy flow from the environment to the system
(as illustrated in
Figure 3A). Importantly, this physical picture pointed out a strategy to
realize the vapor
generation rate beyond the solar upper limit, as will be discussed in the next
section.
TABLE 1: Measured dark evaporation rates of a bare water
surface in controlled environment.
Relative humidity at the Rate Temperature ( C) at the
Rate
temperature of ¨23.6 C (kg/(m2*h)) relative humility of ¨26%
(kg/(m2.h))
26% + 1% 0.0955 23 0.8
0.1009
46% + 1% 0.0787 27+0.8
0.1070
66% + 1% 0.0465 31 + 0.8
0.1315
Surpassing the solar upper limit: Reducing the power density using larger
surface areas
[0060] As illustrated in Figure 3B, below-room-temperature operation
allows for
obtaining total vapor generation rates that surpass the solar input limit
(Figure 2E). However,
due to the weak solar illumination, the total vapor generation rate was still
relatively low. A first
embodiment for realizing this below-room-temperature strategy under a
practical 1 sun
illumination is to increase the actual surface area within a given projection
area, for example, as
illustrated in Figure 4A(A). To demonstrate this strategy, a set of triangle
structures was
fabricated with different apex angles (0) and their surface temperature
distributions was
compared with a flat sample. As shown in Figure 4A(B), the highest temperature
on the flat CCP
sample was 42.6 C. The measured mass change and the theoretical upper limit
data were plotted
in Figure 4B(C). Since the surface temperature of the flat CCP sample was
higher than the room
23
CA 03046702 2019-06-10
WO 2018/102573
PCT/US2017/063993
temperature, corresponding to the lossy system in Figure 3D, the measured
vapor generation rate
(-1.21 kg/(m2.h), see top set of spheres) was lower than that of the
theoretical limit
(-1.58 kg/(m2.h), the top curve).
[0061] When the same light was employed to illuminate the triangle
samples with larger
surface areas (Figures 4A(D)-4A(E)), the temperature decreased significantly
compared with the
flat sample shown in Figure 4A(B). Here four temperature points are indicated
at different areas
along the side walls. One can see that a major area of the sample in Figure
4A(D) (0=39) was
still higher than the room temperature. As a result, a total evaporation rate
of ¨1.50 kg/(m2.h)
was observed, which was ¨88.9% of the input solar energy (see middle set of
spheres and the
bottom curve in Figure 4B(C)). This efficiency was improved compared with the
flat CCP
sample in Figure 4A(B). More intriguingly, for the sample with larger surface
areas (0=23) as
shown in Figure 4A(E), the surface temperature was decreased further with
major areas below-
room-temperature. In this case, a total vapor generation rate of ¨2.02
kg/(m2.h) was observed
(bottom set of spheres in Figure 4B(C)), which was higher than the theoretical
upper limit
(-1.65 kg/(m2.h), see the bottom curve in Figure 4B(C) and Table 2 below).
Ultimately, the
foam under these two triangle samples was removed to get CCP-air triangle
samples to further
enhance the convection contribution from the surroundings and accelerate the
evaporation rate.
As shown by Figures 4A(F)-4A(G), the surface temperatures can be reduced
further under the
same illumination conditions, indicating the improved vapor generation rates.
As shown in
Figure 4B(H), total vapor generation rates of 1.58 kg/(m2.h) were obtained for
the sample in
Figure 4A(F) and 2.20 kg/(m2.h) for the sample in Figure 4A(G), respectively.
In particular, the
best result of 2.20 kg/(m2.h) was even faster than those reported by other
systems under 1-2 sun
illumination (e.g., ¨1.09 kg/(m2.h) under 1 sun and ¨1.93 kg/(m2.h) under 2
sun reported by
others, see dashed lines in Figure 4B(H)). This encouraging result indicates
the potential to
realize ultra-efficient and high performance solar stills based on extremely
low cost materials.
TABLE 2: The values of solar intensity and the enthalpy of
evaporation used in the calculation.
Solar intensity Enthalpy of
(kW/m2) evaporation (J/g)
Upper panel of Fig. 2B 0.609 2419.5
Lower panel of Fig. 2B 0.600 2435.7
Upper panel of Fig. 2D 0.203 2448.2
Lower panel of Fig. 2D 0.203 2453.6
Left panels of Fig. 4A(B) 1.001 2399.9
Left panels of Fig. 4A(D) 1.136 2433.9
24
CA 03046702 2019-06-10
WO 2018/102573
PCT/US2017/063993
Left panels of Fig. 4A(E) 1.146 2439.1
Left panels of Fig. 4A(F) 1.127 2437.1
Left panels of Fig. 4A(G) 1.181 2444.2
Calculation of the solar vapor generation rate
[0062] In describing the present techniques for limit-breaking solar
vapor generation rate
beyond the input solar energy limit, the theoretical upper limit was estimated
as described below.
[0063] In this calculation, the solar energy was assumed to transfer solely
to the liquid-
vapor transition without any other losses. Therefore, the obtained solar vapor
generation rate was
equal to the solar intensity (J/(m2.h)) divided by the enthalpy of evaporation
(J/kg).
[0064] The solar intensity was measured by placing the aforementioned
S305C thermal
sensor perpendicular to the light beam. For triangle structures shown in
Figures 4A and 4B, the
solar intensity at different height was slightly different due to the
diffraction of the beam. In this
case, the highest value at the top position was employed to calculate the
theoretical upper limit
so that the limit-breaking experiment result is unambiguous. For instance, in
the left panel of
Figure 4A(G), the strongest illumination at the top of the triangle sample,
1.181 sun as the solar
intensity (i.e., 1.181 kW/m2 = 4.2516x10⁶ J/(m2.h)) was employed.
[0065] The enthalpy of evaporation is temperature dependent. Therefore, an
analysis was
performed of the temperature distribution on the CCP surface, which was non-
uniform
(Figures 2 and 4). The energy flow condition varied on the same CCP sample due
to the non-
uniform temperature distribution. Since the enthalpy of evaporation is smaller
at higher
temperature, the enthalpy of evaporation corresponding to the highest
temperature on the CCP
surface was selected to calculate the theoretical upper limit. For example, in
the left panel of
Figure 4A(G), the enthalpy of evaporation of 2444.2 J/g (i.e., 2.4442x10⁶
J/kg) at 25.6 C was
adopted (i.e., the highest temperature on the CCP surface). Under the 1.181
sun solar
illumination, the theoretical upper limit of the vapor generation rate was
1.739 kg/(m2.h).
Considering the actual optical absorption of ¨96.9%, the theoretical upper
limit was 1.685
kg/(m2.h). All values used in the calculation are listed in Table 2 above.
CA 03046702 2019-06-10
WO 2018/102573
PCT/US2017/063993
CCP Discussion and Experimental Details
CCP for solar vapor generation
[0066] A hydrophilic porous material, a fiber-rich nonwoven 55%
cellulose / 45%
polyester blend (TechniClothTm Wiper TX609, available from TexwipeTm) was
selected for use
in a test embodiment. This substrate was chosen for its extremely low cost
(i.e., retail price of
¨$1.05/m2), chemical-binder-free make up, and has excellent water transport
properties. Its
microstructure is shown in Figure 14A, having 10-20-pm-wide fiber bundles. The
substrate was
dyed using low cost carbon black powders (e.g., SidRichardson Carbon & Energy
Co., retail
price of $2.26/1b).
[0067] Sample preparation: 0.8 g carbon powder (Sid Richardson Carbon &
Energy Co.)
was dispersed into a 160 mL water. 3 mL acetic acid was added to make carbon
powder easier to
attach to fibers. The mixed solution was blended well using an ultrasonic
cleaner (Branson
Ultrasonics BransonicTM B200) for 5 minutes. Subsequently, the 2 cm x 2 cm
white paper
(TechniClothTm Wiper TX609, available from TexwipeTm) was put into the mixed
solution to
vibrate for 3 minutes so that carbon powders can dye the paper uniformly.
After that, the CCP
was dried at 80 C on a heating stage. This procedure was repeated three to
four times to realize
a dark shade (see Figure 14C).
[0068] As a result of the dying process, the fibers were coated with
carbon nanoparticles,
as shown in Figure 14B. The direct comparison between the white paper and the
carbon-coated
paper is shown in the inset of Figure 14C. The optical absorption of the CCP
was very strong
with the average absorption of ¨98% throughout the visible to near IR domain
(from 250 nm to
2.5 jim, measured by a spectrophotometer equipped with an integration sphere,
Shimadzu UV-
3150). This strong broadband optical absorption is particularly useful for low-
cost solar-to-heat
conversion.
[0069] Stability/durability test: To demonstrate the stability/durability
of carbon powder
attached on the paper fibers, a CCP sample was cleaned ultrasonically in clean
water. The water
solution was changed every 30 minutes to visualize the effect of the
ultrasonic cleaning. As
shown in Figure 20A, the amount of carbon powder washed from the CCP decreased
gradually.
After 4 hours, no obvious carbon powder was visible in the water. It was noted
that there was no
apparent change in the shade of the CCP sample (Figure 20B). To evaluate the
cleaning effect of
26
CA 03046702 2019-06-10
WO 2018/102573
PCT/US2017/063993
the ultrasonic vibration process, the absorption spectrum was characterized
using an integration
sphere spectroscopy (Thorlabs IS200-4 integrated with Ocean Optics Jaz) and
the optical
performance was confirmed as was almost unchanged (Figure 20C). This test
provided strong
evidence to demonstrate the great durability of the CCP sample.
[0070] To demonstrate the baseline for solar vapor generation performance,
a direct
comparison was performed under several different conditions as shown in Figure
14D.
[0071] To measure the water evaporation rate, a 250 mL beaker (open
area of the beaker
was 35.3 cm2) filled with ¨165 g water was placed under a solar simulator
(Newport 69920). The
CCP floated on the water surface with or without the EPS foam. The residual
water surface was
covered by EPS foam to eliminate natural evaporation. Two pieces of Fresnel
lens (26 cm x
17.8 cm, focal length: 300 mm, OpticLens) were used to concentrate solar
light. 1-10 times
concentrated solar light was calibrated using a powermeter (PM100D, Thorlabs
Inc.) equipped
with a thermal sensor (S305C, Thorlabs Inc.) The evaporation weight change was
measured by
an electronic scale every 10 minutes.
[0072] In a dark environment (i.e., at room temperature of 21 C and
humidity of 10%),
the water weight loss was 0.44 g/h. Therefore, the average evaporation rate in
the dark
environment was 0.125 kg/(m2.h), which was subtracted from all subsequent
measured
evaporation rates to eliminate the effect of natural water evaporation. Under
solar illumination
using a solar simulator (Newport 69920 with the solar intensity of 1 kW/m2,
i.e., AM1.5), the
weight loss increased to 1.11 g/h. After that, a 4x4 cm2 white paper and a 4x4
cm2 CCP were
placed on top of the water surface, and the weight change increased to 1.16
g/h and 1.48 g/h,
respectively. To interpret the weight change difference, a portable thermal
imager (FLIR ONE )
was used to characterize the temperature of these samples. The thermal imaging
characterization
was confirmed by a direct measurement using a thermocouple sensor probe,
indicating a
reasonable accuracy (i.e., < 0.4 C in the 33-35 C range).
[0073] To demonstrate the accuracy of the thermal imaging used in the
experiment, two
samples (i.e., black Al foil and CCP sample) were placed on a heat plate
(Super-NuovaTM,
HP131725). Figure 21A shows the thermal image when the temperature of the heat
plate was set
to 40 C. The temperature was then measured at three different positions using
a thermal couple
sensor probe (Signstek 6802 II, see Figure 21B), demonstrating the reasonable
accuracy of the
thermal imaging (i.e., < 0.4 C). Therefore, the temperature change over 5-10
C observed in the
27
CA 03046702 2019-06-10
WO 2018/102573
PCT/US2017/063993
subsequent characterization is reliable based on the thermal imaging data. It
is noted that
accurate measurement of the surface temperature is a technical challenge since
it is dependent on
many factors, especially the emissivity of the object being observed and the
distance to the
object. Therefore, thermal imager estimation of the temperature in the
literature is usually not
accurate.
[0074] To interpret the evaporation rate difference, the IR thermal
imager (FUR ONE,
FUR system) was used to measure the surface temperature of different samples.
The vapor and
liquid temperatures were also measured by a thermometer equipped with two K-
Type
thermocouple sensor probes (Signstek 6802 II). One of the probes was placed
above the CCP
.. sample and covered by a small piece of white cardboard to eliminate the
heating effect of direct
illumination (Figure 22A). The other one was placed under the CCP sample to
measure the
temperature of bulk water (Fig 22B).
[0075] As shown in Figure 14E, the CCP surface temperature increased
to the highest
degree of 35.4 C due to the enhanced solar-to-heat conversion.
[0076] However, this heating effect was not well isolated from the bulk
water (i.e., the
bulk water was heated to 31.7 C), resulting in less efficient vapor
generation effect. One can see
that the water evaporation speed with the CCP was 1.33 times higher than that
of pure water
under the 1 kW/m2 solar illumination.
Efficient vapor generation using thermally isolated CCP
[0077] A thermal-isolating strategy was employed to confine the heating
effect at the top
surface for more efficient vapor generation. The finite thickness, large
contact area and fluid
transport of previously studied porous substrates led to relatively poor
thermal insulation
performance (e.g., in two previous studies, the thermal conductivities were
0.49 W/(m.K) and
0.426 W/(m.K)). Without being bound by any theory, a strategy was utilized for
the test
embodiment to make full use of the capillary force of the porous paper to draw
fluid up around
the support rather than through it, thus minimizing the thermal loss to the
bulk fluid below. As
shown by the upper panel in Figure 15A, a 6-mm-thick EPS foam slab was
inserted under the
CCP to thermally isolate the porous paper from the bulk water. The thermal
conductivity of this
EPS foam was 0.034-0.04 W/(m.K), one of the lowest thermal conductivities
available among
extremely low cost materials. In this configuration, the only contact area
between the water and
28
CA 03046702 2019-06-10
WO 2018/102573
PCT/US2017/063993
CCP was at the edges of the porous paper (i.e., a line contact). This
significantly reduced the
region of fluid transport compared to placing the substrate directly on the
water surface (see the
lower panel in Figure 15A). In this case, the paper contacting the water along
the sides of the
EPS foam transported the water droplets to the upper surface to facilitate
evaporation. It should
be noted that during testing, the upper surface of the CCP was always wet,
indicating that this
reduction in transport area did not limit the evaporation rate of the system.
[0078] To eliminate water evaporation from other open areas, the
surrounding exposed
water surface was covered with EPS foam with a square hole for the CCP (Figure
15B). To
demonstrate the thermal isolation effect, the surface temperature was
characterized with and
without the EPS foam under the CCP, as shown in Figure 2C. Under solar light
illumination
having an intensity of 1 kW/m2 , the upper surface temperature of the CCP
increased from 32.9
C (lower panel) to 44.2 C with the EPS foam insulation (upper panel). The
vapor generation
performance is shown in Figure 15C. One can see that the water mass change
improved to 1.28
kg/(m2.h), which was 3.0 times greater than that of the pure water case and
2.0 times greater than
that of CCP without EPS foam isolation. This evaporation rate was better than
the best reported
data under 1 sun illumination with no solar concentration using exfoliated
graphite (i.e., circles
of Figure 15C). In principle, one would only need a ¨0.2 m2 structure to
produce 2 liters of fresh
water to meet an individual's daily needs assuming 8-hours of non-concentrated
solar
illumination. Solar concentration enhances this generation rate further.
Characterization of the liquid transportation rate of the CCP
[0079] A potential concern for reduced liquid flow cross section
would decrease the
liquid flow rate to the CCP surface. To characterize this practical upper
limit, the liquid
transportation capability of the CCP was characterized. The original weight of
a CCP sample
was measured, and then an edge of the sample was placed into water and the IR
imager was used
to monitor water flow as the function of time. The 4-cm-long sample was
saturated by water in
¨25 seconds after which the weight of the wet-CCP was measured. It was noted
that the flow rate
was not a constant when the paper was saturated. By considering the small
cross-sectional area
of the CCP-layer (i.e., ¨0 .2 mm x 2 cm), the practical upper limit of the CCP
sample was well
over 1,500 kg/m2/h, which is higher than the theoretical upper limit under
1,000x solar
concentration. Therefore, the reduced liquid flow rate was not a limitation in
the test system
under small to moderate solar concentration.
29
CA 03046702 2019-06-10
WO 2018/102573
PCT/US2017/063993
High solar thermal conversion efficiency
[0080] In most previously reported work, the sample surface was
always wet, indicating
that the performance was limited by surface temperature only. Therefore, the
ultimate
performance can be improved by introducing concentrated solar illumination.
Thus, the vapor
generation performance was analyzed under moderate solar concentration
conditions to better
compare with previously reported nanostructures. In this experiment, an
inexpensive planar PVC
Fresnel lens (e.g., OpticLens , $2.39/piece with the area of 26 cm x 17.8 cm)
was employed to
focus the incident light from the solar simulator. As shown in Figure 16A,
when the solar light
was concentrated by 3, 5, 7 and 10 times, the water mass change was increased
to 3.66, 6.24,
9.34, and 13.30 kg/(m2.h), respectively. To characterize the enhanced surface
heating effect
more accurately, two thermocouple sensor probes were used to measure the
temperature of vapor
and bulk water (see Figure 22). As shown by solid curves in Figure 16B, the
vapor temperature
increased sharply within the first 3 minutes and reached a steady state after
10 minutes. In
contrast, the temperature of bulk water increased slowly and continuously as
shown by dashed
lines in Figure 16B. Higher concentration of light led to higher vapor and
bulk water
temperatures. Using Equation (2) below, a solar conversion thermal efficiency,
77 th, of 88.6%
was obtained under 1 sun illumination, and 94.8% under 10 times solar
concentration, as shown
in Figure 16C. Compared with previous reports, this CCP-foam structure
realized a very high
solar thermal conversion efficiency, especially under low optical
concentration condition.
However, the test system shows that there is no need to employ large area
solar concentrating
systems, in contrast to other, more expensive systems.
[0081] To evaluate the solar-vapor generation performance
quantitatively, the solar
conversion thermal efficiency, rith, was calculated, using Equation (2):
lñhLv
(2)
111th.¨
Loptuli
where in is the mass flux, lin, is the total enthalpy of liquid-vapor phase
change, Copt is the
optical concentration, and qi is the normal direct solar irradiation (i.e., 1
kW/m2). Particularly,
the calculation of the total enthalpy of liquid-vapor phase change, liLv,
should consider both the
sensible heat and the temperature-dependent enthalpy of vaporization.
CA 03046702 2019-06-10
WO 2018/102573
PCT/US2017/063993
[0082] The thermal conversion efficiency, rith, is widely employed in
the literature as an
important figure of merit in evaluating the performance of solar vapor
generation. However, the
detailed values for parameters employed in those literature are slightly
different. Therefore, it is
necessary to explain the calculation in detail to demonstrate that the
presently-obtained rith was
unambiguously higher than previously reported results.
[0083] The most frequently used equation for thermal conversion
efficiency is
71th. = ¨rithLv (Eq. (2)). The variable parameter employed in different
calculation was the total
Coptqi
enthalpy of liquid-vapor phase change, liLv, containing two parts: i.e., the
sensible heat and the
enthalpy of vaporization (i.e., hi,v = C x (T ¨ To) + Ahvap). In the present
experiments, To was
the initial temperature of water, i.e., 21 C. T was the vapor temperature
measured by the
thermometer, which was in the range of 40 C to 90 C (see data listed in
Table 3 below). In this
temperature range, the specific heat capacity of water, C, was a constant,
i.e., 4.18 J/g.K.
However, the enthalpy of vaporization, Ahcap, was highly dependent on the
temperature, which
was larger at lower temperature. Recent literature employed different values
of hi,v in their
calculation, resulting in certain inaccuracies in the resulting calculated
rith.
[0084] For instance, a first paper directly employed a constant Ahvap
at 100 C (2260
kJ/kg) as hi,v to calculate rith. Another paper employed a temperature-
dependent enthalpy of
vaporization Ahvap as hLv to calculate rith. These sources did not consider
the sensible heat (i.e.,
C x (T ¨ T0)). In contrast, another paper considered the sensible heat but
employed a constant
Ahvap at 100 C (2260 kJ/kg). By considering these two terms more accurately,
the solar thermal
conversion efficiencies of the presently-disclosed structure under 1, 3, 5, 7,
10 times
concentrated solar illumination were calculated in Table 3. Fortunately, the
sensible heat (i.e.,
C x (T ¨ T0)) was much smaller than Ahvap, especially under small solar
concentration
conditions, as shown by the data listed in Table 3. Therefore, previously
reported values under 1
sun illumination are still reliable but may contain up to > 10% difference
under 10x solar
concentration.
[0085] Thus, for energy conversion efficiency estimation, the
sensible heat should be
considered since this energy is actually consumed by the vapor. But if one
focuses on vapor
generation performance, this term can be neglected since it just results in
higher temperature
vapor rather than generates more vapor.
31
CA 03046702 2019-06-10
WO 2018/102573
PCT/US2017/063993
TABLE 3: Accurate calculation of the solar thermal conversion efficiency.
Copt in (kg/m2.h) Vapor temperature T C x (T ¨ T0) Ahvap (kJ/kg) rith (%)
( C) (kJ/kg)
1 1.28 41.6 86.1 2403.3
88.6
3 3.66 60.4 164.7 2357.6
85.5
6.24 69.9 204.4 2333.1 88.0
7 9.34 76.0 229.9 2320.7
94.5
13.30 88.9 283.8 2282.7 94.8
[0086] In addition, this rith actually describes the energy
consumption in the vapor and
5 has two major components: the energy used for water-to-vapor phase change
and the energy
used to heat the water/vapor. A larger rith does not necessarily correspond to
a higher vapor
generation rate. For a given value of rith, a higher temperature of the
generated vapor will
actually result in a lower generation rate since more energy is used to heat
the water. Therefore,
in terms of solar vapor generation rate, it was beneficial to analyze the
theoretical upper limit and
10 thermal loss channels in order to estimate the opportunity available for
improvement.
Loss channels
[0087] Recently, a strategy was reported to demonstrate the close to
100 C steam
generation under one sun enabled by a floating structure with "thermal
concentration." A
detailed thermal loss analysis was performed, revealing that radiative loss
and convective loss
were two major thermal loss channels in the solar vapor generation systems.
The radiative and
the convective losses per area are expressed by Equations (3) and (4),
respectively:
Prad = Ea (T (721 71)
(3)
Pcon = h(T2 ¨ T1)
(4)
where is the emissivity of the CCP (i.e., 0.98), a is the Stefan-Boltzmann
constant (i.e.,
5.67x10 W/(m2.K4)), T2 is the temperature at the surface of the CCP, T1 is the
temperature of
the adjacent environment, and h is the convection heat transfer coefficient
(assumed to be
10 W/(m2.K)). Using these two equations, it was estimated that the radiative
loss from the
100 C blackbody absorber surface to the ambient environment (20 C) was ¨680
W/m2 and the
convective loss was ¨800 W/m2. Following this theoretical estimation, when the
absorber surface
was 44.2 C (via experimental observation), the radiative loss to ambient was
¨147 W/m2 and
32
CA 03046702 2019-06-10
WO 2018/102573
PCT/US2017/063993
the convective loss was ¨232 W/m2 , corresponding to a total of 37.9% energy
loss (i.e.,
14.7%+23.2%). In this case, it seems that an efficiency ¨90% is impossible. An
immediate
question is why one can observe a record high vapor generation rate under 1
sun.
[0088] To interpret the unique features and physics of the proposed
CCP-foam
architecture, the thermal environment and heat transfer diagram was analyzed
(Figure 17A).
First, the downwards thermal radiation was suppressed. According to the
previously reported
experimental characterization, the reflection of a 3-mm-thick EPS foam slice
was in the range of
40%-60% over the spectral region of thermal emission with ¨10% thermal
radiation absorption.
Therefore, under thermal equilibrium condition, the temperature of the EPS-
foam surface was
very close to the bottom surface of the CCP layer so that the downwards
radiative loss from the
CCP layer was significantly suppressed. Without being bound by any theory, it
appeared that the
EPS foam employed in some embodiments of the present system served as a
thermal radiation
shield (in addition to its excellent thermal insulation characteristics),
which was superior over
previously reported double-sided black systems.
[0089] In further analysis of the microscopic thermal environment (Figure
17B), one can
recognize that the CCP surface was covered by a sheet of water and surrounded
by heated vapor.
Without being bound by any theory, it is believed that the absorbed solar
energy of the CCP
layer first exchanges thermal energy with water sheet and vapor in this small
region rather than
directly emitting thermal radiation and exchanging heat with the surroundings
through the
convection. In many reported experiments to identify the vapor temperature, a
thermocouple was
usually placed on top of the absorber surface, further demonstrating that the
top surface of the
absorber was surrounded by heated vapor. Since the temperature of the adjacent
environment on
top of CCP absorber was very close to the temperature of CCP surface, the
radiative and
convective loss should be very small. For instance, according to Eqs. (3) and
(4), the radiative
loss from the 44.2 C surface under 1 sun to the ¨41.6 C vapor environment
was ¨1.8% and the
convective loss was only ¨2.6%. Most absorbed solar energy was still used to
evaporate the
water sheet on top of the absorber surface rather than lost through these two
channels. Without
being bound by any theory, it is believed that this is a major physical
mechanism for the
observed high vapor generation rate. This physical mechanism was not detailed
in previous
reports.
33
CA 03046702 2019-06-10
WO 2018/102573
PCT/US2017/063993
[0090] More importantly, in a real enclosed solar steam system, the
vapor cannot be
released immediately and the environment inside the system is thermally
isolated from the cooler
surrounding environment. Furthermore, typical acrylic or glass slabs are
opaque to mid-infrared
radiation. Consequently, thermal radiation cannot be emitted to the
environment. Additionally,
convective energy transfers are also largely suppressed when the internal
environment is heated
under near-thermal equilibrium conditions. In this case, the radiative and
convective losses in a
real system should be even more negligible. Intriguingly, in a recent report,
the highest
temperature of the generated steam was observed in a vapor chamber,
demonstrating the
accuracy of our physical picture.
Performance for solar desalination and the effect of the bulk water
temperature
[0091] Conventional desalination technologies are usually energy
demanding (e.g.,
reverse osmosis membrane technology consumes ¨2 kW.h/m3) with serious
environment costs.
It was estimated that a minimum energy consumption for active seawater
desalination is
¨1 kWh/m3, excluding prefiltering and intake/outfall pumping. Passive solar
desalination
technologies, such as that of the present disclosure, are particularly
attractive due to the
electricity-free operation with minimum negative impacts on the environment.
[0092] To characterize the evaporation performance and reusability of
our CCP-foam for
desalination, salt water was prepared with 3.5 wt% NaCl and the solar water
evaporation
experiment was performed repeatedly. For each cycle, two CCP-foam samples were
put on the
.. surfaces of salt water and pure water, respectively, and illuminated under
1 kW/m2 for one hour.
After that, the CCP samples were dried completely and reused for the next
cycle. As shown in
Figure 18A, the evaporation rates of 10 cycles in pure water and salt water
(see the arrows) are
both stable (i.e., 1.2-1.3 kg/(m2.h)), demonstrating the reliability of the
proposed CCP-foam.
Considering the excellent wet and dry strength and autoclavable features of
the fiber-rich
nonwoven paper (e.g., TechniClothTm Wiper TX609, available from TexwipeTm), it
is
particularly useful for long term solar desalination application.
[0093] After the 1-hour recycling test, a millimeter sized salt
crystal was observed on the
sample surface (see the first panel in Figure 18D). Without being bound by any
theory, it appears
that these white salt particles introduce scattering (see Figure 18B for SEM
image of salt crystal
plates on the CCP surface), which should reduce the optical absorption of the
CCP sample. An
34
CA 03046702 2019-06-10
WO 2018/102573
PCT/US2017/063993
immediate question is whether this salt crystallization will significantly
degrade the performance
of the vapor generation in practice, which was not mentioned in previous
reports.
[0094] To investigate this issue, an 8-hour continuous experiment was
performed in pure
water and salt water in a beaker, respectively. Intriguingly, one can see that
the evaporation
speeds increased continuously and saturated at the 4th-5th hour at ¨1.32
kg/(m2.h) and
¨1.42 kg/(m2.h) for salt water and pure water, respectively, as shown by the
dots connected by
the solid lines in Figure 18C. Since the CCP surface was always wet during the
8-hour test
(indicating sufficient water transportation contributed by capillary forces),
the salt crystal did not
grow further to cover the entire surface. Instead, the salt crystal area even
shrank surprisingly, as
shown by the photographs of the CCP surface at different time spots (see
Figure 18D). When this
experiment was repeated (usually on the next day), this evaporation rate
increase was still
observed under identical experimental conditions starting from the lower rate,
indicating the
stable and reusable performance for longer term seawater desalination. As
shown by thermal
images in Figure 18E, the average surface temperature of the CCP sample
increased from
44-45 C gradually and saturated at 53-54 C at the 4th-5th hour. Therefore,
the next question is
what introduced this surface temperature change.
[0095] According to the experimental data shown in Figures 14-16, the
only observed
gradual change is the bulk water temperature, as shown by dashed curves in
Figure 16B. To
identify this correlation, the bulk temperature was monitored over 8 hours, as
shown by the
dashed curves in Figure 18C (see the arrows). One can see that the bulk water
temperature
(from 22 C to 32-33 C) and the evaporation rate changed coincidentally. This
observation
demonstrated that the surface temperature of the CCP-foam is still related to
the bulk liquid
temperature. The temperature of the bulk water in this experiment reached the
thermal
equilibrium after ¨5 hours. This may be due to the excellent thermal
insulation of the EPS foam
support employed in the presently-disclosed structure. Also, it was observed
that the salt crystal
shrank as the bulk and surface temperature increased (i.e., Figure 18D). This
may be due to the
higher solubility of salt in warmer water. This vapor generation performance
should improve if
better thermal insulation materials are used in the water container for small
volume test. On the
other hand, if the bulk water temperature change is negligible in larger scale
vapor generation
applications, one should not expect this obvious evaporation rate change, as
is validated in the
prototype system demonstration below.
CA 03046702 2019-06-10
WO 2018/102573
PCT/US2017/063993
A prototype solar still system
[0096] An exemplary desalination solar still system is illustrated in
Figure 19A(A): A
box made by thermal insulating materials is filled by seawater or salty water.
A tilted transparent
glass covers the box to collect solar light. For conventional solar vapor
generation technology,
light absorbing materials were usually placed at the bottom of the basin to
heat the entire liquid
volume with fairly low thermal efficiency (i.e., 30%-40%).
[0097] To overcome this weakness, a 5 x 5 CCP array (Figure 19A(B))
was developed
wherein the array included a 2 x 2 cm2 for each CCP unit with the total area
of 100 cm2. The array
was placed in a polypropylene box (15 cm in diameter with 1500 g water).
However, thermal
isolating walls were not incorporated in this experiment. According to the
thermal distribution
measurement, the temperature of CCP surface increased from 18.2 C (Figure
19A(C) under
dark condition) to 44.6 C (Figure 19A(D) under 1 sun illumination). Without
being bound by
any theory, it is believed that the slight nonuniformity of the temperature
distribution (39.5 C at
the comer) in Figure 19A(D) was introduced by the intensity distribution of
the finite size of the
light beam. To evaluate its performance, the solar desalination experiment was
repeated using
this large area sample (Figure 19A(E)). Meanwhile, two control samples were
characterized: (1)
a layer of black aluminum foil placed at the bottom of the box (Figure 19A(F),
its optical
absorption spectrum is shown in Figure 23) and (2) salty water with no CCP-
foam
(Figure 19A(G)). As shown in Figure 19B(H), the mass change rate for the CCP-
foam array was
¨1.275 kg/(m2.h) (with the estimated thermal efficiency 77 th of 88.2%), which
is obviously better
than those for control samples (i.e., ¨0.408 kg/(m2.h) with rith of 28.2% for
the bulk heating
strategy, and ¨0.242 kg/(m2.h) with rith of 16.7% for the bare salt water
evaporation). It was
noted that the evaporation rate in this large scale CCP array experiment did
not appear to
increase. Its bulk water temperature change was also relatively small (20-25
C, as shown by the
bottom dashed curve in Figure 19B(H)). It is believed that this is due to the
much larger amount
of bulk water, without being bound by any theory. In contrast, the evaporation
rates of the two
control samples increased slightly, corresponding to their bulk temperature
changes, as shown by
their respective dashed curves in Figure 19B(H) (see Description of the
Drawings). The net
water mass change produced by this 100 cm2 CCP-foam structure was 14.5 g after
the 5-hour
operation, which was ¨25 times of that produced by a single unit (i.e., 0.58
g/h, see Figure 3). In
this case, it was unnecessary to introduce a solar concentrator to enhance the
water evaporation
rate, which is different from the case for commercial concentrated
photovoltaic systems. Due to
36
CA 03046702 2019-06-10
WO 2018/102573
PCT/US2017/063993
the extremely low manufacturing cost of the CCP-foam, large area products can
easily be
realized using commercial paper printing technologies at a price much lower
than those for
conventional solar concentrators.
[0098] As shown in Figure 19A(I), a complete portable solar still
system was
demonstrated using an open bottom box (with the 0.01 m2 5x5 CCP-foam array
directly in
contact with the open water below with buoyancy ensured by foam (represented
by dark square
visible along the exterior)), shown in the inset of Figure 19A(I)). The clean
water was collected
by the distillate channel and guided into a collection bag. This system was
then placed on a lake
together with a commercial solar still product with an effective area of 0.342
m2 (Aquamate
Solar Still (NATO stock no. 4610-99-553-9955) at the retail price of $225),
as shown in
Figure 19A(J). It should be noted that the exemplary CCP-array can take the
lake water directly
while the Aquamate Solar Still needs to be actively fed. It is believed that
the Aquamate Solar
Still uses the conventional solar still principle of heating bulk water. The
Aquamate Solar
Still does not use the presently-disclosed CCP-foam arrangement. It is likely
that there are
other differences between the systems, but the Aquamate Solar Still is a
closed system, so its
contents cannot be readily ascertained. After a 10-hour operation in the
outdoor environment on
a sunny-cloudy day with varying sun light illumination conditions (see Figure
19B(K) for
temperature and sun light intensity distribution), generation productivities
of 0.832 kg/(m2.day)
and 0.344 kg/(m2 day) were obtained for these two systems, respectively. The
performance of
the CCP-foam system is ¨2.4 times of the Aquamate Solar Still . In addition,
due to a scattering
of mist formed on the cover (Figure 19A(J)), the input light decreased
significantly. Performance
may be improved by the use of a non-toxic, super-hydrophobic surface treatment
on the
transparent glass cover of embodiments of the present disclosure. The
prototype did not include
corrugation or an air gap between the substrate and the support.
Cost estimation and comparison
[0099] Considering the key components for solar-to-heat conversion
employed in
previously-reported literature (e.g., metal nanoparticles or nanorods
dispersed in water, metal
nanoparticles on nanoporous anodic alumina, exfoliated graphite on porous
carbon foam, a
selective absorber inserted between a polystyrene foam disk and a bubble
wrap), the cost of
embodiments of the presently-disclosed structure is the low. In Figure 19, a
complete system was
demonstrated using low cost plastic plates. It is well-known that the cost for
plastic products are
37
CA 03046702 2019-06-10
WO 2018/102573
PCT/US2017/063993
extremely low. However, the cost for condensate collection and other
components are required
by all solar still systems, which was not discussed in recent literature.
According to a review
article published in 2007, the net cost of materials for conventional solar
still is ¨$185.2/m2. In
contrast, the system shown in Figure 19 is only $76.45/m2 based on the small
scale retail price
for all materials/components (see Table 4 below). It is noted that the major
cost was for the
acrylic slabs, and that these slabs can be replaced by lower cost plastic
boxes to reduce costs
even further. The net cost for mass production will be significantly lower.
TABLE 4: Cost of a prototype solar still system (Im2)
Unit price Amount Cost
Carbon black $2.26/1b 100 g $0.50
Fiber-rich paper $1.05/m2 1.5 m2 $1.58
EPS foam $0.59/m3 0.5 m3 $0.30
Acrylic slab $31.20/m2 2.31 m2 $72.07
Collection bag $2/each 1 $2.00
Total $76.45
[0100] Although the present disclosure has been described with respect to
one or more
particular embodiments, it will be understood that other embodiments of the
present disclosure
may be made without departing from the spirit and scope of the present
disclosure. Hence, the
present disclosure is deemed limited only by the appended claims and the
reasonable
interpretation thereof.
38