Note: Descriptions are shown in the official language in which they were submitted.
- 1 -
BINDING ASSAY FOR DETERMINING MHC CLASS II BINDING ACTIVITY
CROSS REFERENCE TO RELATED APPLICATION
This application claims priority to Chinese Patent Application
No.201611180971.4, titled
"Binding Assay", filed with China Patent Office on December 19, 2016.
FIELD
This invention relates to methods for determining MHC class II binding
activity of
preparations of lymphocyte activation gene-3 (LAG-3) protein, or fragments,
derivatives, or
analogues thereof, and to probes and kits for use in the methods.
BACKGROUND
LAG-3 protein is a CD4 homolog type I membrane protein with four extracellular
immunoglobulin superfamily domains. Similar to CD4, LAG-3 oligomerizes at the
surfaces
of T cells and binds to MHC class II molecules on antigen-presenting cells
(APCs) but with
significantly higher affinity than CD4. LAG-3 is expressed on activated CD4 +
and CD8+ T
lymphocytes where it associates with the CD3/T cell receptor complex at the
cell surface
and negatively regulates signal transduction. As a consequence, it negatively
regulates T
cell proliferation, function, and homeostasis. LAG-3 is upregulated on
exhausted T cells
compared with effector or memory T cells. LAG-3 is also upregulated on tumor
infiltrating
lymphocytes (TILs), and blockade of LAG-3 using anti-LAG-3 antibody can
enhance anti-
tumour T cell responses.
IMP321 is a recombinant soluble LAG-31g fusion protein that binds to MHC class
II with
high avidity. It is a first-in-class immunopotentiator targeting MHC class II-
positive
antigen-presenting cells (APCs) (Fougeray et al.: A soluble LAG-3 protein as
an
immunopotentiator for therapeutic vaccines: Preclinical evaluation of IMP321.
Vaccine
2006, 24:5426-5433; Brignone et al.: IMP321 (sLAG-3) safety and T cell
response
potentiation using an influenza vaccine as a model antigen: A single-blind
phase I study.
Vaccine 2007, 25:4641-4650; Brignone et al.: IMP321 (sLAG-3), an
immunopotentiator for
T cell responses against a HBsAg antigen in healthy adults: a single blind
randomised
controlled phase I study. J Immune Based Ther Vaccines 2007, 5:5; Brignone et
al.: A
soluble form of lymphocyte activation gene-3 (IMP321) induces activation of a
large range
of human effector cytotoxic cells. J Immunol 2007, 179:4202-4211). IMP321 has
been
Date regue/Date received 2023-05-19
CA 03046720 2019-06-11
WO 2018/113621
PCT/CN2017/116889
-2-
tested in previously-treated advanced renal cell carcinoma patients known to
be
immunosuppressed and shown to induce an increase in the percentage of
circulating
activated CD8 T cells and of long-lived effector-memory CD8 T cells in all
patients treated
by repeated injections over 3 months, without any detectable toxicity
(Brignone et al.: A
phase I pharmacokinetic and biological correlative study of IMP321, a novel
MHC class II
agonist in patients with advanced renal cell carcinoma. Clin Cancer Res 2009,
15:6225-
6231). A concentration of only a few ng/mL IMP321 has been shown to be active
in vitro
on APC, showing the great potency of IMP321 as an agonist of the immune system
(Brignone, et al., 2009, supra).
In a study in metastatic breast carcinoma (MBC) patients, Brignone et al.
(First-line
chemoimmunotherapy in metastatic breast carcinoma: combination of paclitaxel
and
IMP321 (LAG-31g) enhances immune responses and antitumor activity. Journal of
Translational Medicine 2010, 8:71) demonstrated that IMP321 expanded and
activated for
several months both the primary target cells (MHC class II-positive
monocytes/dendritic
cells) to which IMP321 binds, and the secondary target cells (NK/CD8+ effector
memory T
cells) which are activated subsequently. By pooling results from all 30
patients and
comparing tumor regression with an appropriate historical control group, they
saw a
doubling of the objective response rate which suggests that IMP321 is a potent
agonist of
effective anti-cancer cellular immune responses in this clinical setting.
WO 99/04810 describes use of LAG-3 protein, or fragments or derivatives
thereof, as an
adjuvant for vaccination, and in cancer treatment. Use of LAG-3 protein, or
fragments or
derivatives thereof, for the treatment of cancer and infectious disease is
described in WO
2009/044273.
In view of the medical uses of LAG-3, and fragments or derivatives thereof,
there is a need
to provide preparations of such compounds that comply with good manufacturing
practices
(GMP). Such practices are required in order to confonn to the guidelines
recommended by
agencies that control authorization and licensing for manufacture and sale of
active
pharmaceutical products. These guidelines provide minimum requirements that a
pharmaceutical manufacturer must meet to assure that the products are of high
quality and
do not pose any risk to the consumer or public. As part of the quality control
procedure in
CA 03046720 2019-06-11
WO 2018/113621
PCT/CN2017/116889
-3-
GMP-grade manufacture of proteins, it is necessary to determine whether
preparations of
such compounds retain a high level of bioactivity.
We have found, however, that several conventional methods for determining
protein-protein
interactions are not suitable for determining specific binding of the LAG-3
derivative
IMP321 to MHC class II molecules expressed on the surface of immune cells. In
particular,
fluorescence-activated cell sorting (PACS) was not suitable for distinguishing
IMP321
preparations with differing abilities to bind to MHC class II-expressing
cells. No upper
plateaus were observed at increasing concentrations of IMP321 for the binding
curves
obtained using FACS. This prevents calculation of the relative potencies of
different
preparations, which requires converged plateaus (parallelism).
We have also found that IMP321 binds non-specifically to plates used for
MesoScale
Discovery (MSD) electrochemiluminescent (ECL) assays, and Enzyme-Linked
Immunosorbent Assays (ELISAs). Whilst non-specific binding of IMP321 to plates
used for
ELISA and MSD assays was dramatically reduced by use of casein as a blocking
reagent,
this lowered the absolute signal in the MSD assay. No upper plateaus were
observed for
binding curves obtained using assays in which cells expressing MHC class II
molecules
were immobilised to the MSD plates. A different ELISA technique was also
tested, in which
cells expressing MHC class II molecules were transferred to another plate
after binding of
IMP321, in order to minimise the effect of non-specific binding of IMP321 to
the plates.
However, the well-to-well signal variation was found to be unacceptable. In
view of this, it
was concluded that neither MSD ECL assays nor ELISA assays could be used to
determine
specific binding of IMP321 to the immobilised cells in a quality control assay
to test GMP-
grade product.
There is a need, therefore, to provide a method for determining MHC class II
binding
activity of preparations of LAG-3 protein, or fragments, derivatives, or
analogues thereof,
which is suitable for use as a quality control assay in GMP-grade production
of such
compounds.
SUMMARY
According to the invention, there is provided a method for determining MHC
class II
binding activity of a preparation comprising lymphocyte activation gene-3 (LAG-
3) protein,
or a fragment, derivative, or analogue thereof, wherein the method comprises
determining
CA 03046720 2019-06-11
WO 2018/113621
PCT/CN2017/116889
-4-
binding of the LAG-3 protein, fragment, derivative, or analogue to MHC class
II molecules
using bio-layer interferometry (BLI).
The term "bio-layer interferometry (BLI)" is used herein to refer to a fibre-
optic assay based
on phase-shift interferometry, for example as described in US Patent No.
5,804,453 (Chen).
Developments to the BLI technique, including developments aimed at enhancing
the
sensitivity and accuracy of analyte detection, are described in WO 2005/047854
and WO
2006/138294 of ForteBio, Inc.
US 5,804,453 describes a probe, method, and system for detecting analyte
binding to a
fibre-optic end surface. Analyte detection is based on a change in the
thickness at the end
surface of the optical fibre resulting from the binding of analyte molecules
to the surface,
with greater amount of analyte producing a greater thickness-related change in
the
interference signal. The change in interference signal is due to a phase shift
between light
.. reflected from the end of the fibre and from the binding layer carried on
the fibre end, as
illustrated particularly in Figures 7a and 7b of US 5,804,453.
The probe described in US 5,804,453 includes a fibre optic section having a
proximal end
tip and a distal end tip and a reagent layer disposed on the distal end tip.
The reagent layer
reacts (or bonds) with the substance (analyte) being detected. The fibre optic
section has a
first index of refraction and the reagent layer has a second index of
refraction. When any of
the substance bonds to the reagent layer, a resulting layer including the
reagent layer and the
substance is formed. The resulting layer can be treated as having a
homogeneous index of
refraction.
The method permits the concentration of a substance in a sample solution to be
determined
using the fibre optic probe. The method includes steps of (i) immersing the
distal end of the
fibre optic probe into the sample solution, (ii) optically coupling a light
source with the
proximal end of the fibre optic probe, (iii) detecting at least a first light
beam reflected from
an interface between the distal end surface of the fibre optic section and the
reagent layer,
and a second light beam reflected from an interface between the reagent layer
and the
sample solution, reflected from the distal end of the fibre optic probe, (iv)
detecting an
interference pattern formed by the first and second light beams at a first
time, (v) detecting
an interference pattern formed by the first and second light beams at a second
time, and (vi)
CA 03046720 2019-06-11
WO 2018/113621
PCT/CN2017/116889
-5-
determining whether the substance is present in the sample solution based on
whether a shift
occurs in the interference patterns. The concentration of the substance may be
determined
based on a shift in the interference patterns and based on a differential
between the first and
second times.
The system for detecting the concentration of a substance in a sample solution
has a light
source for providing a light beam, a fibre optic probe, a detector, a fibre
optic coupler, a
fibre optic connector, and a processor. The fibre optic coupler includes a
first fibre optic
section having a proximal end for receiving an incident light beam, a second
fibre optic
section having a proximal end for delivering the reflected interference light
beam to the
detector, and a third fibre optic section having a distal end for connecting
to the fibre optic
probe. The fibre optic probe includes a proximal end for connecting to the
fibre optic
coupler, and a distal end tip with a reagent layer disposed thereon. The fibre
optic probe
produces at least a first reflected beam and a second reflected beam from the
incident light
beam. The detector detects an interference pattern formed by the first and
second reflected
beams. The coupler optically couples the light source with the fibre optic
probe and
optically couples the fibre optic probe with the detector. The processor
determines a phase
associated with an interference pattern detected by the detector at a first
time, determines a
phase associated with an interference pattern detected by the detector at a
second time, and
determines the concentration of the substance based on a shift in the phases
associated with
the interference patterns detected by the detector at the first and second
times.
We have appreciated that the BLI technique can be used to determine the MHC
class II
binding activity of preparations of LAG-3 protein, or fragments, derivatives,
or analogues
thereof, and that such methods are particularly useful as a quality control
assay in GMP-
grade production of such compounds.
In particular embodiments, methods of the invention comprise determining
binding of the
LAG-3 protein, fragment, derivative, or analogue, to MHC class II molecules
present on
MHC class II-expressing cells. In such embodiments, the LAG-3 protein,
fragment,
derivative, or analogue may be immobilised to a reagent layer of a BLI probe,
and the MHC
class II-expressing cells are in solution.
- 6 -
The probe, method, and system described in US 5,804,453 may be used in
accordance with
the present invention for determining the MHC class II binding activity of a
preparation of
LAG-3 protein, or a fragment, derivative, or analogue thereof, as exemplified
below by
binding of the recombinant LAG-3 protein derivative IMP321 to MHC class II-
expressing
Raji cells.
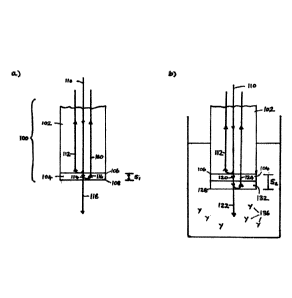
Referring to Figure la below, a biosensor probe 100 includes an optical fibre
102, and a
reagent layer 104, comprising a blocking reagent (e.g. BSA) and IMP321, at a
distal tip of
the optical fibre 102. The blocking reagent and IMP321 may be bound to the tip
of the
optical fibre 102 by soaking the tip in a solution having a predetermined
concentration of
IMP321, or the blocking reagent, for a predetermined period.
An incident light beam 110 is sent through the optical fibre 102 toward its
distal end. At the
interface 106 defined between the optical fibre 102, which has a first index
of refraction,
and the reagent layer 104, which has a second index of refraction, a first
portion 112 of the
incident light beam 110 will be reflected, while a second portion 114 of the
incident light
beam 110 will continue through the reagent layer 104. Typically, the blocking
reagent and
IMP321 will be small relative to the wavelength of the incident light beam
110, from an
optical perspective, so the blocking reagent and the IMP321 can be treated as
forming a
single reagent layer 104. At an interface 108 defined at the exposed surface
of the reagent
layer 104, of the second portion 114 of the incident beam 110, a first portion
116 will be
reflected, while a second portion 118 will pass into the adjacent medium. Of
the first portion
116 of the second portion 114 of the incident beam 110, a first portion 160
will be
transmitted back through the optical fibre 102, while a second portion (not
shown) will be
reflected at the interface 106 back into the reagent layer 104.
At a proximal end of the optical fibre 102, the reflected beams 112 and 160
are detected and
analysed. At any given point along the optical fibre 102, including its
proximal end, the
reflected beams 112 and 160 will exhibit a phase difference. Based on this
phase difference,
the thickness Si of the reagent layer 104 can be determined.
Referring to Figure lb below, the probe 100 is immersed in a solution
containing Raji cells
136 to determine binding of the cells to the immobilised IMP321. The cells 136
will bind to
the immobilised IMP321 in the reagent layer 104, thereby forming a cell layer
132
Date regue/Date received 2023-05-19
- 7 -
over a period of time. The thickness S2 of the layer will be a function of the
time of
immersion of the probe 100 in the sample fluid, as well as the concentration
of the cells
136 in the sample fluid. Other molecules (not shown) in the sample solution
will
not bind to the reagent layer 104.
The total thickness S2 of this combined layer will be greater than the
thickness Si of the
reagent layer 104 alone. Thus, similar to the probe 100 of Figure la, when an
incident beam
110 is directed towards the distal tip of the optical fibre 102, at the
interface 106 between
the optical fibre 102 and the combined layer, a first portion 112 of the
incident beam 110 is
reflected, while a second portion 120 of the incident beam 110 continues
through the
combined layer. When the second portion 120 reaches the cells of the cell
layer 132, a first
portion of it (not shown) will be reflected when it meets the cellular
membrane and
cytoskeletal structures of the cells.
At a second interface 128 between the combined layer and the sample solution,
a
second portion 124 of the second portion 120 of the incident beam 110 is
reflected, while a
third portion 122 of the second portion 120 of the incident beam 110 continues
through the
sample solution. Of the second portion 124 of the second portion 120 of the
incident
beam 110, a first portion continues back through the optical fibre 102, while
a second
portion (not shown) is reflected back into the combined layer at the interface
106.
At a proximal end of the optical fibre 102, the reflected beams 112 are
detected and
analysed. At any given point along the optical fibre 102, including its
proximal end, the
reflected beams 112 will exhibit a phase difference. Based on this phase
difference,
the thickness S2 of the combined layer can be determined.
By determining the difference between the thickness S2 of the combined layer
and the
thickness Si of the reagent layer 104, the thickness of the cell layer 132 can
be determined.
The thickness S2 of the combined layer is deteimined (or "sampled") at
discrete points in
time. In this way, the rate of increase of the difference between the
thickness S2 of the
combined layer and the thickness Si of the reagent layer 104 (i.e., the rate
of increase in
thickness of the cell layer 132) can be determined. Based on this rate, the
rate of binding of
the immobilised IMP321 to MHC class II molecules on the Raji cells can be
determined
within a very short incubation period.
Date regue/Date received 2023-05-19
CA 03046720 2019-06-11
WO 2018/113621
PCT/CN2017/116889
-8-
The diameter of Raji cells is approximately 5-7 M, 1000 times the wavelength
of light, so
might be expected to affect the results obtained. However, the signal readout
is around 1-
2nM, indicating that light is reflected near the surface of the cells. We have
found that the
signal change is repeatable, correlated with cell binding, and that the
binding rate change is
within the measurement range, so can be used to determine binding of Raji
cells to IMP321
immobilised at the tip of the optical fibre.
The MHC class II binding activity of the preparation may be determined as the
rate of
binding of the LAG-3 protein, fragment, derivative, or analogue to the MHC
class II
molecules.
We have found that the binding rate obtained using the BLI assay depends on
the density of
MHC class II-expressing cells in the solution, whereas the binding rate is low
and relatively
flat when the density of non-MHC class II-expressing cells is increased. A
higher rate, as
well as a higher upper plateau of the binding curve, are obtained if the MHC
class II-
expressing cells are present at a density of at least 4E6/mL, preferably at
least 6E6/mL or
8E6/mL.
We have found that the specificity of the BLI assay is improved when the
reagent layer of
the BLI probe has been pre-treated with a blocking reagent to minimise non-
specific binding
of the MHC class II-expressing cells to the reagent layer. Any suitable
blocking reagent can
be used, for example blocking reagents comprising inert protein such as
albumin, for
example bovine serum albumin (BSA).
The MHC class II-expressing cells may be immune cells expressing MHC class II
molecules. Suitable examples include antigen-presenting cells, or cells of
cell lines derived
from immune cells. In particular embodiments, the MHC class II-expressing
cells are B
cells or cells of a B cell line, for example Raji cells.
.. We have found that MHC class II-expressing cells used for methods of the
invention may be
thawed, ready-to-use cells obtained from a frozen stock solution. Use of such
cells
eliminates the requirement to culture cells immediately before a method of the
invention is
carried out, can help to ensure reliability and reproducibility of results
obtained by methods
of the invention, and can also allow results obtained at different times to be
compared.
CA 03046720 2019-06-11
WO 2018/113621
PCT/CN2017/116889
-9-
Methods of the invention may comprise determining a rate of binding of the LAG-
3 protein,
fragment, derivative, or analogue, to the MHC class II molecules for a
plurality of different
concentrations of the LAG-3 protein, fragment, derivative, or analogue, and
generating a
dose-response curve for the rates of binding, for example as described in
Example 6 below.
Methods of the invention may further comprise determining MHC class II binding
activity
of a reference sample of LAG-3 protein, or a fragment, derivative, or analogue
thereof, by
determining binding of the LAG-3 protein, fragment, derivative, or analogue of
the
.. reference sample to MHC class II molecules using BLI, under the same
conditions used for
determining binding of the LAG-3 protein, fragment, derivative, or analogue of
the
preparation, and comparing the MHC class II binding activity determined for
the reference
sample with the MHC class II binding activity determined for the preparation.
The MHC class II binding activity of the reference sample, at a predetermined
concentration,
may be set as 100% and diluted to various desired concentrations, for example
to allow
qualification or validation of measurements of MHC class II binding activity
of a
preparation comprising LAG-3 protein, or a fragment, derivative or analogue
thereof, made
using a method of the invention.
In some embodiments, the reference sample comprises a LAG-3 protein, or a
fragment,
derivative, or analogue thereof, that has been treated to reduce its MHC class
II binding
activity. Suitable treatments include, for example, deglycosylation (for
example by
treatment with a PNGase), storage at 37 C for at least 12 days, oxidation (for
example by
treatment with 1% or 0.1% hydrogen peroxide), treatment with acid or alkali,
or exposure to
light for at least 5 days.
Example 6 below describes in detail a BLI assay for determining the MHC class
II binding
activity of immobilised IMP321 to Raji cells in solution.
There is also provided according to the invention a BLI probe for determining
MHC class II
binding activity of LAG-3 protein, or a fragment, derivative, or analogue
thereof, which
comprises a reagent layer to which the LAG-3 protein, or fragment, derivative,
or analogue
thereof, is immobilised.
CA 03046720 2019-06-11
WO 2018/113621
PCT/CN2017/116889
-10-
There is further provided a kit for determining MHC class II binding activity
of LAG-3
protein, or a fragment, derivative, or analogue thereof, which comprises a BLI
probe having
a reagent layer to which the LAG-3 protein, or fragment, derivative, or
analogue thereof, is
immobilised, and MHC class II-expressing cells.
In some embodiments, the reagent layer of the BLI probe has been pre-treated
with a
blocking reagent to minimise non-specific binding of the MHC class II-
expressing cells to
the reagent layer. Any suitable blocking reagent may be used, for example a
blocking
reagent comprising inert protein such as albumin, for example bovine serum
albumin (BSA).
In some embodiments the MHC class II-expressing cells are frozen cells.
In some embodiments the MHC class II-expressing cells are Raji cells.
The MHC class II-expressing cells may be present at a density of at least
1E6/mL,
preferably at least 4E6/mL, or 8E6/mL.
A kit of the invention may further include a reference sample, for example as
described
above, comprising LAG-3 protein, or a fragment, derivative, or analogue
thereof Preferably
the MHC class II binding activity of the reference sample is known (for
example as
determined by a CCL4 release assay, described below).
Probes and kits of the invention may be used in methods of the invention.
The LAG-3 protein may be an isolated natural or recombinant LAG-3 protein. The
LAG-3
protein may comprise an amino sequence of LAG-3 protein from any suitable
species, such
as a primate or murine LAG-3 protein, but preferably a human LAG-3 protein.
The amino
acid sequence of human and murine LAG-3 protein is provided in Figure 1 of
Huard et al
(Proc. Natl. Acad. ScL USA, 11: 5744-5749, 1997). The sequence of human LAG-3
protein
is repeated in Figure 25 below (SEQ ID NO: 1). The amino acid sequences of the
four
extracellular Ig superfamily domains (D1, D2, D3, and D4) of human LAG-3 are
also
identified in Figure 1 of Huard et al., at amino acid residues: 1-149 (D1);
150-239 (D2);
240-330 (D3); and 331-412 (D4).
CA 03046720 2019-06-11
WO 2018/113621
PCT/CN2017/116889
-11-
Derivatives of LAG-3 protein include soluble fragments, variants, or mutants
of LAG-3
protein that are able to bind MHC class II molecules. Several derivatives of
LAG-3 protein
are known that are able to bind to MHC class II molecules. Many examples of
such
derivatives are described in Huard et al (Proc. Natl. Acad. Sci. USA, 11: 5744-
5749, 1997).
This document describes characterization of the MHC class II binding site on
LAG-3
protein. Methods for making mutants of LAG-3 are described, as well as a
quantitative
cellular adhesion assay for determining the ability of LAG-3 mutants to bind
class II-
positive Daudi cells. Binding of several different mutants of LAG-3 to MHC
class II
molecules was detennined. Some mutations were able to reduce class II binding,
while other
mutations increased the affinity of LAG-3 for class II molecules. Many of the
residues
essential for binding MHC class II proteins are clustered at the base of a
large 30 amino acid
extra-loop structure in the LAG-3 D1 domain. The amino acid sequence of the
extra-loop
structure of the D1 domain of human LAG-3 protein is
GPPAAAPGHPLAPGPHPAAPSSWGPRPRRY (SEQ ID NO: 2), the underlined sequence
in Figure 25.
The LAG-3 protein derivative may comprise the 30 amino acid extra-loop
sequence of the
human LAG-3 D1 domain, or a variant of such sequence with one or more
conservative
amino acid substitutions. The variant may comprise amino acid sequence that
has at least
70%, 80%, 90%, or 95% amino acid identity with the 30 amino acid extra-loop
sequence of
the human LAG-3 D1 domain.
The derivative of LAG-3 protein may comprise an amino acid sequence of domain
D1, and
optionally domain D2, of LAG-3 protein, preferably human LAG-3 protein.
The derivative of LAG-3 protein may comprise an amino acid sequence that has
at least
70%, 80%, 90%, or 95% amino acid identity with domain D1, or with domain D1
and D2,
of LAG-3 protein, preferably human LAG-3 protein.
The derivative of LAG-3 protein may comprise an amino acid sequence of domains
D1, D2,
D3, and optionally D4, of LAG-3 protein, preferably human LAG-3 protein.
The derivative of LAG-3 protein may comprise an amino acid sequence that has
at least
70%, 80%, 90%, or 95% amino acid identity with domain D1, D2, and D3, or with
domain
D1, D2, D3, and D4, of LAG-3 protein, preferably human LAG-3.
CA 03046720 2019-06-11
WO 2018/113621
PCT/CN2017/116889
-12-
Sequence identity between amino acid sequences can be determined by comparing
an
alignment of the sequences. When an equivalent position in the compared
sequences is
occupied by the same amino acid, then the molecules are identical at that
position. Scoring
an alignment as a percentage of identity is a function of the number of
identical amino acids
at positions shared by the compared sequences. When comparing sequences,
optimal
alignments may require gaps to be introduced into one or more of the sequences
to take into
consideration possible insertions and deletions in the sequences. Sequence
comparison
methods may employ gap penalties so that, for the same number of identical
molecules in
sequences being compared, a sequence alignment with as few gaps as possible,
reflecting
higher relatedness between the two compared sequences, will achieve a higher
score than
one with many gaps. Calculation of maximum percent identity involves the
production of an
optimal alignment, taking into consideration gap penalties.
Suitable computer programs for carrying out sequence comparisons are widely
available in
the commercial and public sector. Examples include MatGat (Campanella et al.,
2003, BMC
Bioinformatics 4: 29; program available from
http://bitincka.com/ledion/matgat), Gap
(Needleman & Wunsch, 1970, J. Mol. Biol. 48: 443-453), FASTA (Altschul et al.,
1990, J.
Mol. Biol. 215: 403-410; program available from http://www.ebi.ac.uldfasta),
Clustal W 2.0
and X 2.0 (Larkin et al., 2007, Bioinformatics 23: 2947-2948; program
available from
http://www.ebi.ac.uk/tools/c1usta1w2) and EMBOSS Pairwise Alignment Algorithms
(Needleman & Wunsch, 1970, supra; Kruskal, 1983, In: Time warps, string edits
and
macromolecules: the theory and practice of sequence comparison, Sankoff &
Kruskal (eds),
pp 1-44, Addison Wesley; programs available
from
http://www.ebi.ac.uk/tools/emboss/align). All programs may be run using
default
parameters.
For example, sequence comparisons may be undertaken using the "needle" method
of the
EMBOSS Pairwise Alignment Algorithms, which determines an optimum alignment
(including gaps) of two sequences when considered over their entire length and
provides a
percentage identity score. Default parameters for amino acid sequence
comparisons
("Protein Molecule" option) may be Gap Extend penalty: 0.5, Gap Open penalty:
10.0,
Matrix: Blosum 62.
The sequence comparison may be performed over the full length of the reference
sequence.
CA 03046720 2019-06-11
WO 2018/113621
PCT/CN2017/116889
-13-
The LAG-3 protein derivative may be fused to Immunoglobulin Fc amino acid
sequence,
preferably human IgG1 Fc amino acid sequence, optionally by a linker amino
acid sequence.
The ability of a derivative of LAG-3 protein to bind to MHC class II molecules
may be
determined using a quantitative cellular adhesion assay as described in Huard
et al (supra).
The affinity of a derivative of LAG-3 protein for MHC class II molecules may
be at least
20%, 30%, 40%, 50%, 60%, 70%, 80%, 90%, or 100% of the affinity of human LAG-3
protein for class II molecules. Preferably the affinity of a derivative of LAG-
3 protein for
MHC class II molecules is at least 50% of the affinity of human LAG-3 protein
for class II
molecules.
Examples of suitable derivatives of LAG-3 protein that are able to bind MHC
class
II molecules include derivatives comprising:
amino acid residues 23 to 448 of the human LAG-3 sequence;
amino acid sequence of domains D1 and D2 of LAG-3;
amino acid sequence of domains D1 and D2 of LAG-3 with an amino acid
substitution at one or more of the following positions: position 73 where ARG
is substituted
with GLU; position 75 where ARG is substituted with ALA or GLU; position 76
where
ARG is substituted with GLU; position 30 where ASP is substituted with ALA;
position 56
where HIS is substituted with ALA; position 77 where TYR is substituted with
PHE;
position 88 where ARG is substituted with ALA; position 103 where ARG is
substituted
with ALA; position 109 where ASP is substituted with GLU; position 115 where
ARG is
substituted with ALA;
amino acid sequence of domain D1 of LAG-3 with a deletion of amino acid
residues
54 to 66;
a recombinant soluble human LAG-31g fusion protein (IMP321) - a 200-kDa dimer
produced in Chinese hamster ovary cells transfected with a plasmid encoding
for the
extracellular domain of hLAG-3 fused to the human IgG1 Fc. The sequence of
IMP321 is
given in SEQ ID NO: 17 of US 2011/0008331.
BRIEF DESCRIPTION OF DRAWINGS
CA 03046720 2019-06-11
WO 2018/113621
PCT/CN2017/116889
-14-
Embodiments of the invention are described below, by way of example only, with
reference
to the following drawings in which:
Figure 1 shows operation of the probe used to determine MHC class II binding
activity of
LAG-3 protein, or fragments, derivatives, or analogues thereof, according to
an embodiment
of the invention (Figure taken from US Patent No. 5,804,453);
Figure 2 shows the results of a FACS assay to determine binding of IMP321 to
Raji cells;
Figure 3 shows schematically a MesoScale Discovery (MSD)
electrochemiluminescent
(ECL) assay to determine binding of IMP321 to Raji cells;
Figure 4(a) shows a plot of the ECL signal obtained for an MSD assay at
different
concentrations of IMP321 in the presence and absence of Raji cells; Figure
4(b) shows a
plot of the ECL signal obtained for an MSD assay at different concentrations
of Rituxan in
the presence and absence of Raji cells;
Figure 5(a) shows a plot of the OD signal obtained for an ELISA at different
concentrations
of IMP321 following blocking of the ELISA plate with 5% BSA or 10% FBS; Figure
5(b)
shows a plot of the OD signal obtained for an ELISA at different
concentrations of IMP321
or Rituxan following blocking of the ELISA plate with 30% FBS in PBS; Figure
5(c) shows
a plot of the OD signal obtained for an ELISA at different concentrations of
IMP321 or
Rituxan following blocking of the ELISA plate with 5% BSA in RPIM1640;
Figure 6(a) shows a plot of the OD signal obtained for an ELISA at different
concentrations
of IMP321 or Rituxan following blocking of the ELISA plate with different
blocking
reagents (1% nonfat milk, 3% nonfat milk, Casein); Figure 6(b) shows a plot of
the OD
signal obtained for an ELISA at different concentrations of IMP321 or Rituxan
following
blocking of the ELISA plate with different blocking reagents (1% gelatin, 3%
gelatin, or
PBS);
.. Figure 7(a) shows a plot of the raw ECL signal obtained for an MSD assay at
different
concentrations of IMP321 for different seeding densities of Raji cells; Figure
7(b) shows a
plot of the specific ECL signal obtained for an MSD assay at different
concentrations of
IMP321 for different seeding densities of Raji cells;
Figure 8 shows a plot of the ECL signal obtained for an MSD assay for binding
of different
concentrations of IMP321 to Raji cells or HLA-DRdin' L929 cells following
bocking of the
MSD plate with casein;
Figure 9 shows schematically, on the left, a BLI probe with a protein A-
conjugated sensor
and IMP321 immobilised to the distal tip of the optical fibre of the sensor,
with the tip of the
CA 03046720 2019-06-11
WO 2018/113621
PCT/CN2017/116889
-15-
sensor immersed in a sample solution containing Raji cells. The basic steps of
the method
are set out on the right of the figure;
Figure 10(a) shows a plot of the binding signal obtained in a BLI assay for
dose-dependent
binding of immobilised IMP321 to Raji cells in solution in the association
step; Figure 10(b)
shows a standard curve of IMP321 dose-dependent binding to Raji cells in the
BLI assay;
Figure 11(a) shows the association and dissociation curves for binding of
immobilised
IMP321 to different concentrations of Raji cells (which are MHC class II-
expressing) or
Jurkat cells (which are not MHC class II-expressing) in solution in a BLI
assay; Figure 11(b)
shows a graph of the binding signal obtained for the different Raji cell
concentrations;
Figure 12(a) shows the association and dissociation curves for binding of
immobilised
IMP321, Hurnira, or Avastin, to Raji cells in solution in a BLI assay; Figure
12(b) shows a
graph of the binding signal obtained for the different immobilised proteins;
Figure 13 shows a plot of the percentage binding potency, measured by BLI
assay, for
binding of different immobilised preparations of IMP321 to Raji cells in
solution versus
their expected potency;
Figure 14(a) shows a plot of the binding signal obtained by BLI assay for
binding of
different concentrations of immobilised IMP321 to previously cultured Raji
cells in solution;
Figure 14(b) shows a plot of the binding signal obtained by BLI assay for
binding of
different concentrations of immobilised IMP321 to previously frozen Raji cells
in solution;
Figure 15(a) shows a plot of the downstream CCL4 release obtained by cell-
based assay for
binding of different concentrations of immobilised IMP321, or deglycosylated
IMP321, to
Raji cells;
Figure 15(b) shows a plot of the binding signal obtained by BLI assay for
binding of
different concentrations of immobilised IMP321, or deglycosylated IMP321, to
Raji cells;
Figure 16 shows plots of the signal for binding of different concentrations of
immobilised
IMP321, or IMP321 stored inappropriately (at 37 C for 12 days) to Raji cells.
The results
shown in Figure 16(a) were obtained by cell-based assay measuring CCL4
release, and the
results shown in Figure 16(b) were obtained by BLI assay;
Figure 17 shows plots of the signal for binding of different concentrations of
immobilised
IMP321, or IMP321 stored inappropriately (at 37 C for lmonth) to Raji cells.
The results
shown in Figure 17(a) were obtained by cell-based assay measuring CCL4
release, and the
results shown in Figure 17(b) were obtained by BLI assay;
Figure 18 shows plots of the signal obtained by cell-based assay measuring
CCL4 release
(Figure 18a), or by BLI assay (Figure 18b), for binding of different
concentrations of
CA 03046720 2019-06-11
WO 2018/113621
PCT/CN2017/116889
-16-
immobilised IMP321 untreated, or oxidised IMP321 (with 1% hydrogen peroxide),
to Raji
cells;
Figure 19 shows plots of the signal obtained by cell-based assay measuring
CCL4 release
(Figure 19a), or by BLI assay (Figure 19b), for binding of different
concentrations of
immobilised IMP321 untreated, or oxidised IMP321 (with 0.1% hydrogen
peroxide), to Raji
cells;
Figure 20 shows plots of the signal obtained by cell-based assay measuring
CCL4 release
(Figure 20a), or by BLI assay (Figure 20b), for binding of different
concentrations of
immobilised IMP321 untreated, or acid-treated (at pH 3.0), to Raji cells;
Figure 21 shows plots of the signal obtained by cell-based assay measuring
CCL4 release
(Figure 21a), or by BLI assay (Figure 21b), for binding of different
concentrations of
immobilised IMP321 untreated, or acid-treated (at pH 3.1, or pH 3.6), to Raji
cells;
Figure 22 shows plots of the signal obtained by cell-based assay measuring
CCL4 release
(Figure 22a), or by BLI assay (Figure 22b), for binding of different
concentrations of
immobilised IMP321 untreated, or base-treated (at pH 9.2 or pH 9.75), to Raji
cells;
Figure 23 shows plots of the signal obtained by cell-based assay measuring
CCL4 release
(Figure 23a), or by BLI assay (Figure 23b), for binding of different
concentrations of
immobilised IMP321 untreated, or light-exposed (at 25 C for 5 days), to Raji
cells;
Figure 24 shows plots of the signal obtained by cell-based assay measuring
CCL4 release
(Figure 24a), or by BLI assay (Figure 24b), for binding of different
concentrations of
immobilised IMP321 untreated, or light-exposed (at 25 C for 10 days); and
Figure 25 shows amino acid sequence of mature human LAG-3 protein. The four
extracellular Ig superfamily domains are at amino acid residues: 1-149 (D1);
150-239 (D2);
240-330 (D3); and 331-412 (D4). The amino acid sequence of the extra-loop
structure of the
D1 domain of human LAG-3 protein is shown underlined in bold.
DETAILED DESCRIPTION
Examples 1 to 5 below describe evaluation of various different binding assays
to determine
whether they are suitable for use as quality control assays for GMP grade
production of the
recombinant LAG-3 protein derivative IMP321. None of the assays were found to
be
suitable. Examples 6 to 11 describe cell-based BLI methods, and demonstration
of their
suitability for determining MHC class II binding activity of preparations of
IMP321.
Example 1
CA 03046720 2019-06-11
WO 2018/113621
PCT/CN2017/116889
-17-
Evaluation of use of a Fluorescence-Activated Cell Sorting (FACS) assay to
determine
binding of IMP321 to Raji cells
A FACS assay was carried out to determine binding of IMP321 to Raji cells.
IMP321
samples with 100%, 75%, and 50% MHC class II binding activity were tested. The
sample
with 100% activity was a reference sample with known MHC class II binding
activity at a
predetermined concentration. The samples with 75% and 50% activity were
prepared by
dilution of the reference sample.
The binding curves obtained are shown in Figure 2. They show that no upper
plateaus were
reached, so there was no parallelism between the binding curve of the
reference sample with
100% activity and the other samples. This prevented calculation of the
relative potency of
the different samples.
Example 2
Evaluation of use of a Meso Scale Discovery (MSD) assay to determine binding
of IMP321
to Raji cells
This example describes evaluation of a Meso Scale Discovery (MSD) assay to
determine
binding of IMP321 to Raji cells.
The Meso Scale Discovery platform (MSD-ECL) uses electrochemiluminescent
labels that
are conjugated to detection antibodies. These labels generate light when
stimulated by
electricity in the appropriate chemical environment, which can then be used to
measure key
proteins and molecules.
Electricity is applied to the plate electrodes by the Meso Scale Discovery
platform(MSD-
ECL), leading to light emission by the labels. Light intensity is then
measured to quantify
analytes in the sample.
The detection process is initiated at electrodes located in the bottom of the
Meso Scale
Discovery (MSD-ECL)'s microplates, and only labels near the electrode are
excited and
detected. The system employs buffers with high concentrations of
Tripropylamine as a
catalyst for a dual redux reaction with Ruthenium, emitting light at 620 urn.
CA 03046720 2019-06-11
WO 2018/113621
PCT/CN2017/116889
-18-
The MSD assay used is shown schematically in Figure 3. Briefly, approximately
2 x 10⁴
cells per well of Raji cells in PBS were seeded into a Single-SPOT 96-well MSD
plate
(Meso Scale Discovery, Gaithersburg, MD) at 25uL/well. The plate was incubated
at room
temperature for 1-1.5 hours before being blocked with blocking buffer
(25uL/well). Then
serial dilutions of IMP321 reference standard, or samples, were loaded into
duplicate wells
at 50uL/well. After about 1 hour of incubation at room temperature, bound
IMP321 was
detected using ruthenium-conjugated anti-human Fc at 50uL/well.
Electrochemiluminescence signal was acquired using MSD read buffer without
surfactant.
ECL counts should be proportional to IMP321 binding onto the cell surface
within the assay
range.
High binding carbon electrodes in the bottom of microplates allow for easy
attachment of
Raji cells. The assay uses electrochemiluminescent labels that are conjugated
to anti-
IMP321 antibodies. Electricity is applied to the plate electrodes by an MSD
instrument
leading to light emission by the labels. Light intensity is then measured to
quantify the
presence of IMP321 bound to MHC class molecules on the surface of the
immobilised Raji
cells.
The results obtained for samples containing IMP321 with and without Raji cells
are shown
in Figure 4(a), and for samples containing Rituxan with and without Raji
cells, is shown in
Figure 4(b).
The results show that non-specific binding of IMP321 to MSD plates was
observed in the
absence of Raji cells. By comparison, specific binding of Rituxan to Raji
cells was observed.
Raji cells are cells of a cell line derived from the B-lymphocyte of an 11-
year-old Nigerian
Burkitt's lymphoma male patient in 1963. Rittman (Rituximab) is a chimeric
monoclonal
antibody against the protein CD20, which is primarily found on the surface of
B cells.
Example 3
Evaluation of non-specific binding of IMP321 to ELISA plates
This example describes evaluation of non-specific binding of IMP321 and
Rituxan to plates
used for Enzyme-Linked Immunosorbent Assays (ELISAs) using different blocking
reagents.
CA 03046720 2019-06-11
WO 2018/113621
PCT/CN2017/116889
-19-
Briefly, microplates were blocked with blocking reagent at 25 C for 2 hours.
Samples and
rituxan control were diluted with dilution buffer to 2 pg/ml then further
diluted by two-fold
serial dilution. Microplates were washed and well-drained before and after
adding the
diluted samples and incubation. After incubation with secondary antibody, the
signal was
measured by a spectrometry assay using SpectraMax M2 (450-650nm).
Condition
Plate ELISA plate (Costar)
Coating reagent None
5% BSA in RPIM 1640 Medium
Blocking reagent/dilution buffer
30% FBS in PBS/10% FBS in PBS
IMP321 or Rituxan concentration 0-2 g/m1
The results are shown in Figure 5. Figure 5(a) shows the results of ELISA
using increasing
concentrations of IMP321 and ELISA plates blocked with 5% BSA or 10% FBS.
Figure 5(b)
shows the results of ELISA using increasing concentrations of IMP321 or
Rituxan and
ELISA plates blocked with 30% FBS in PBS. Figure 5(c) shows the results of
ELISA using
increasing concentrations of IMP321 or Rituxan and ELISA plates blocked with
5% BSA in
RPIM 1640.
The results show that there was severe non-specific binding of IMP321, but not
Rituxan, to
ELISA plates when using BSA or FBS as blocking reagents.
Various different types of blocking agents were then tested with IMP321 or
Rituxan to see if
the non-specific binding of IMP321 to ELISA plates could be eliminated.
Condition
Plate ELISA high bind plate
Coating reagent None
1% non-fat milk in PBS
Blocking reagent/dilution buffer 3% non-fat milk in PBS
Blocker Casein Blocking Buffers (Thermo)
CA 03046720 2019-06-11
WO 2018/113621
PCT/CN2017/116889
-20-
1% gelatin (from bovine skin)
3% gelatin (from bovine skin)
PBS (control)
IMP321 or Rituxan concentration 0-8 g/ml
The results are shown in Figure 6. Figure 6(a) shows the results for IMP321 or
Rituxan
using 1% non-fat milk, 3% non-fat milk, or Blocker Casein Blocking Buffers
(Thermo) as
blocking reagent. Figure 6(b) shows the results for IMP321 or Rituxan using 1%
gelatin, 3%
gelatin, or PBS as blocking reagent.
The results show that Casein was the best blocking reagent to reduce non-
specific binding
of IMP321 to ELISA plates.
Example 4
Evaluation of use of Meso Scale Discovery (MSD) assay, with casein blocking
buffer, to
determine binding of IMP321 to Raji cells
This example describes evaluation of an MSD assay to determine binding of
IMP321 to Raji
cells at different seeding densities using casein blocking buffer.
An MSD assay was carried out, similar to that described in Example 2, to
evaluate whether
the non-specific binding of IMP321 to the MSD plate observed in that example
could be
minimized using Casein blocking buffer.
Condition
Plate MSD high bind plate
Cell density 5E4/well, 2.5E4/well, 5E3/well,
1E3/well
Blocking reagent/dilution buffer Blocker Casein Blocking Buffers
(Thermo)
IMP321 concentration 0-8 g/ml in casein blocking buffer
Goat anti-human antibody, SULFO-TAG 500 ng/ml in casein blocking buffer
labelled
The results are shown in Figure 7. Figure 7(a) shows the results of binding of
IMP321 to
different seeding densities of Raji cells (0-5x10⁴ cells/well) at different
concentrations of
IMP321. The results show a cell density-dependent increase of maximal IMP321
binding.
CA 03046720 2019-06-11
WO 2018/113621
PCT/CN2017/116889
-21-
Figure 7(b) shows the results of specific binding of IMP321 to different
seeding densities of
Raji cells (1x10³-5x10⁴ cells/well). The results show a cell density-dependent
increase of
specific IMP321 binding.
Binding of IMP321 to Raji cells was compared with binding of IMP321 to HLA-
DRdin'
L929 cells (these cells do not express MHC class II), at different
concentrations of IMP321,
using the MSD assay with casein blocking buffer. L929 is a fibroblast-like
cell line cloned
from strain L. The results are shown in Figure 8. The results show that non-
specific binding
of IMP321 to MSD plates was significantly reduced in the presence of casein
blocker.
However, the specific binding signal was low, and no upper plateau of the
IMP321 dose-
binding curve was observed.
It was concluded that the MSD assay using casein blocking buffer cannot be
used to
demonstrate specific binding of IMP321 to plate-immobilised Raji cells.
Example 5
Evaluation of use of ELISA assays to determine binding of IMP321 to Raji cells
This example describes an evaluation of the ability of cell-based direct ELISA
and cell-
based transfer ELISA to determine binding of IMP321 to Raji cells.
Direct ELISA (similar to the assay described in Example 3) was carried out in
the presence
of different blocking reagents (5% BSA, 10% PBS, 0.5% Casein, or 3% gelatin)
with
different amounts of plate-immobilised Raji cells (10,000, 5,000, or 2,500
cells), and
different concentrations of IMP321 or IMP321 treated with Peptide-N-
Glycosidase F
(PNGase F, an amidase that cleaves between the innermost GlcNAc and asparagine
residues
of high marmose, hybrid, and complex oligosaccharides from N-linked
glycoproteins). The
conditions used for the direct ELISA assay are summarised in the tables below:
Culture plate wells Conditions
1 A-G 5% BSA, PNGase IMP321, 10,000 cells
2 A-G 10% PBS, PNGase IMP321, 10,000 cells
3 A-G 5% BSA, PNGase IMP321, 5,000 cells
4 A-G 10% PBS, PNGase IMP321, 5,000 cells
5 A-G 5% BSA, PNGase IMP321, 2,500 cells
CA. 03046720 2019-06-11
WO 2018/113621
PCT/CN2017/116889
-22-
6 A-G 10% FBS, PNGase IMP321, 2,500 cells
7 A-G 0.5% Casein, IMP321, 10,000 cells
8 A-G 3% gelatin, IMP321, 10,000 cells
9 A-G 0.5% Casein, IMP321, 5,000 cells
A-G 3% gelatin, IMP321, 5,000 cells
11 A-G 0.5% Casein, IMP321, 2,500 cells
12 A-G 3% gelatin, IMP321, 2,500 cells
H 1-12 No blocking reagent (NSB)
Culture plate wells IMP321 concentration (ng/m1)
A 1-12 1000
B 1-12 500
C 1-12 250
D 1-12 125
E 1-12 62.5
F 1-12 31.25
G1-12 15.625
Hl-12
The results are shown in the table below.
I 2 4 S 1 11 12
..:14..=t:f 0.1:12
" " = = = = = = = =
==== ===:== = ====: = . =". ....= ===== =
= = ',...=*::,',#KA.":**:iiiik,,A=st
1-357 i:.1:410;414161WWW = =
tiW 0.:3033i1 267:1424.1::::i .1,39Z
kg44-vi.
0.4713
" = =
E ' 30.1',, 02a0TO2Ortitka*SiatilKZ
" ==== ======..,
ft' 0.Ã$ 3S $$A
H =.`k " " ="1.,* .es 0.0:4 =`..":;.,A
,3 AV:fl 0.230 :0197 0 .2m:
.......... . ............ : 3 3 A.v
5
The results show dose-dependent IMP321 binding to plate-immobilised Raji
cells.
CA 03046720 2019-06-11
WO 2018/113621
PCT/CN2017/116889
-23-
To check whether IMP321 binds non-specifically to the ELISA plates, a direct
ELISA was
carried out in the absence of Raji cells, under the conditions summarised in
the table below:
Culture plate wells Conditions
1 A-G 5% BSA, PNGase IMP321
2 A-G 10% FBS, PNGase IMP321
3 A-G 0.5% Casein, IMP321
4 A-G 3% gelatin, IMP321
H 1-4 No blocking reaegent (NSB)
The results are shown in the table below:
.A
-
C ................................................. 2 44-a MI,M 2..4o
13 13a.10
:0210.7
F &WW1 0µ.
G 9.IW1 0.24
:9 2/1) Ø . ..
The results show strong non-specific binding of IMP321 to the ELISA plate in
the absence
of plate-immobilised Raji cells. Neither casein nor gelatin blocking reagents,
nor PNGase
treatment of IMP321, removed the non-specific binding.
It was concluded that a direct cell-based ELISA cannot be used to demonstrate
specific
binding of IMP321 to plate-immobilised Raji cells.
A transfer cell ELISA was carried out to determine binding of different
concentrations of
IMP321, or IMP321 treated with PNGase, to immobilised Raji cells. Raji cells
were
transferred to another plate after binding to IMP321 or treated IMP321. The
conditions used
for the assay are summarised in the tables below.
Culture plate wells Conditions
B 1-12 Raji cells and WT IMP321
C 1-12 Raji cells and treated IMP321
D 1-12 Raji cells and treated IMP321
CA 03046720 2019-06-11
WO 2018/113621 PCT/CN2017/116889
-24-
F 1-12 No cells and WT IMP321
G 1-12 No cells and treated IMP321
H 1-12 No cells and treated IMP321
Culture plate wells WT or treated IMP321 concentration
(ng/ml)
1 B-D, F-H 1000
,
2 B-D, F-H 500
3 B-D, F-H 250
4 B-D, F-H 125
B-D, F-H 62.5
6 B-D, F-H 31.25
7 B-D, F-H 15.63
8 B-D, F-H 7.813
9 B-D, F-H 3.906
B-D, F-H 1.953
11 B-D, F-H 0.977
12 B-D, F-H 0
The results are shown in the table below:
1 =.9 a t, 4. 5 . 8 7 '',-1
,k, 10 11 12
$
.:
A
,, õ. õ,,......,,,,,m4mmemPimmt2P4aZialaiiiiiii$10;0,1$0.4124M*11
a :1,,,M,4,..49113,51.111,114,4,141.476. iirt
EMAIMiiii.Oftiitet,tinitif.!,:.eftltMVPOZPOli 1
:ti..rIttittiltatiiiii4M.i00ii-:-
Eiiitttlt101112M711:tiVgAiii.iiiiViiiiiii..ii.iitilintli48,01:01;iliiP.Mliti
R-42'''''.4.2tettlftdiVil,,,,,Mtiit134..iN,..kmit
CI labliiiiiiik,:AitipmaRiim-m-k4µ:i4mkei,Kreviogiaote;iiiNõ,...:,õ:i,,õ,,
i"4"-Wi04-R4iiiMattMiiftnii:,,,i.:4,,õ:µ,õõõ,,õõrõõ.,,õ,....õ....._
1 .
- =r :::4L*t't'".44''-6::(:49't' 'OMA,,,*Yaitt1,':.6 -
E 1. : *,
.. . .
. ..
.,..00t .1 0.00:: i :0 : . ,',,:v74.:'
.;'!:,...::õ:.4,:,.5.:.0:...f.'fr,..1.,,C1Ø,...,.:. :;.::::::=00.. .00:88, .-
:.
HG: = - : = .
.. .:. .i.,,,. :::.;,:.1...,,.:::ii..: .4: 4hti! .:,.,:..M.,18. ,:
0.:07A..0!,-0:P..i'l.: i.P..i.i...$..:..?..-...'-',.30:.! ',..'..-.r.'s,.=
l!i:. - :. .:!:: ..:!
:=0:.:i.)1:1..:. . 0,..01 O. [41.:64, i....:k.?..,:,,,.,.., ...
=,.,.,,. .s.-... : .. - ... ...i. ..;.... ....:, ... . . , .,:.. ,
,,,,., =i 4:4õ..,,,,,. . ..,, thz ... 0. cosõ
.. .... ....= ===:;.. ===:=.. :..:.. .:...::==
.::. :. ., i.: ,.,. ,==,. 1 .,s, .6.nts: .:6 . CCM i:
..C:OCk.filØ-0.'Ø .,..:,õ:.....:',.:.:?:.:-.. k,,,N's+,''?.=: ''''.'
. . i . . . ..
. :: 0:'<61TV:: 0,:' :::::0'..0p. i?6,1,0.,...:. :...4N.,...
.. ... . ... ... .. ... ... -
5
The results show that the well-to-well signal variation is not acceptable for
a quality control
method. The method is also labour-intensive. It was concluded that a cell-
based transfer
CA 03046720 2019-06-11
WO 2018/113621
PCT/CN2017/116889
-25-
ELISA cannot be used to demonstrate specific binding of IMP321 to plate-
immobilised Raji
cells.
Example 6
A cell-based assay to measure the binding activity of a preparation of the LAG-
3 protein
derivative IMP321 using bio-layer interferometry (BLI)
IMP321 is a soluble recombinant derivative of LAG-3 protein with high affinity
to MEC
class II molecules. This example describes a cell-based assay to measure the
binding
activity of IMP321 to MHC class II-expressing Raji cells using BLI. The assay
is simple
and quick, and allows comparison between reference standards and samples.
Figure 9 shows schematically, on the left, a BLI probe with a protein A-
conjugated sensor
and IMP321 immobilised to the distal tip of the optical fibre of the sensor,
with the tip of the
sensor immersed in a sample solution containing Raji cells. The basic steps of
the method
are set out on the right of the figure. The assay is described in more detail
below.
Materials:
1) Raji cells: ATCC / CCL-86
2) RPM! 1640: Invitrogen / 22400-089
3) HI-FBS: Invitrogen / 10100147
4) DPBS: Hyclone / SH30028.01B
5) BSA: Sigma / A3032
6) IMP321 Reference Material
7) Raji Cell Growth Medium: RPM! 1640, 10% HI-FBS
8) Binding Assay Diluent: DPBS, 0.5% BSA
9) Protein A Tray (ForteBio-18-5010)
10) 96-flat-bottom-well black plate (Greiner-655209)
11) Single- and multi-channel pipettes: Sartorius and Eppendorf / various
12) Cell counter: Roche / Cedex HiRes and Beckman/ViCell
13) Bio-Layer Interferometer: Fortebio / Octet Red with software version 7.0
or later
Methods:
1. Preparation of ready-to-use Raji cells
CA 03046720 2019-06-11
WO 2018/113621
PCT/CN2017/116889
-26-
1) Remove N vial(s) of Raji cells from the liquid nitrogen freezer and quickly
thaw in a
37 C water bath.
2) Aseptically transfer the vial contents to a sterile centrifuge tube
containing
approximately N X 9 mL of Raji Cell Growth Media. Mix well by gently
pipetting.
3) Centrifuge the cells 5 mm at 300x g. Resuspend cells in Binding Assay
Diluent and
count them with a cell counter or a hemacytometer.
4) Add the volume of cell stock suspension to a sufficient volume of Binding
Assay
Diluent to adjust cell densities to 4.0E6-8.0E6 cells per mL and keep on ice
for use.
2. Preparation of IMP321 reference standard, control and samples
NOTE: 1) Use reverse pipetting to ensure accuracy.
2) Vortex gently to avoid or minimize creating foam and bubbles
1) Reference standard preparation:
1.1) Thaw a vial of IMP321 Reference Material as needed. Store at 2-8 C.
Expiration is 7 days from date of thaw
1.2) Dilute IMP321 Reference Material to approximately 1.0 mg/mL in
Formulation
Buffer. Prepare fresh and use fresh. Determine the protein concentration
spectrophotometrically using Formulation Buffer as a blank.
1.3) Based on measured protein concentration, dilute RM to prepare standard
curve
to the appropriate concentrations as described below. Mix dilutions by
votexing.
Tube IMP321 Volume of IMP321 Volume of Assay
concentration Dilution Diluent
A ¨30 mg/mL
¨1.0 mg/mL 40 gL of A 1160 ptL
62.5 pg/mL 40pt of B XXX mL
12.5 ptg/mL 4004 of C 1600pt
3125 ng/mL 4004 of D 1200pL
1562.5 ng/mL 2004 of D 14001.tt
781.25 ng/mL 1004 of D 1500 L
390.625 ng/mL 504 of D 15504
78.125 ng/mL 4004 of H 16004
0 10004
CA 03046720 2019-06-11
WO 2018/113621
PCT/CN2017/116889
-27-
1.4) Use dilutions C-J for the standard curve. Additional concentrations may
be used
if needed, to include the linear portion of the curve and the upper and lower
plateaus.
2) Preparation of Control
2.1) The control is an independent dilution of Reference Material from Tube C
prepared in Step 1.3 above. Further dilute as described in the Table above.
Mix
dilutions by votexing.
2.2) Use dilutions C-J for the Control.
3) Preparation of Samples
3.1) Based on protein concentration, dilute IMP321 Samples to approximately
1.0
mg/mL in Assay Diluent. Prepare fresh and use fresh.
3.2) Further dilute to prepare standard curve to the appropriate
concentrations as
described in the Table above. Mix dilutions by votexing.
3.3) Use dilutions C-J for the Samples. Additional concentrations may be used
if
needed, to include the linear portion of the curve and the upper and lower
plateaus.
3. Detection steps in the Octet system
1) Hydrate the biosensors in PBS for at least 10 min
2) Prepare the assay plate. In a black polypropylene microplate, transfer 200
tut per well of
PBS, Assay Diluent, titrations of IMP321 in AD, or Raji cells respectively
into the
appropriate wells according to the Sample Plate Map below:
Sample Plate Map
1 2 3 4 5 6 7 8 9 10 11 12
ABL BL BS BEEE E E
BBL BL BS BEEE E E
CBL BL BS BEEE E E
DBL BL BS BE'EE E E
EBL BL BS BEEE E E
F BL BL BS BEEE E E
GBL BL BS BEEE E E
HBL BB BS BEEE E E
1 2 3 4 5 6 7
B = Buffer
DPBS DA DA Sample DA Cell DA
S = Sample
CA 03046720 2019-06-11
WO 2018/113621
PCT/CN2017/116889
-28-
L= Loading
E = Empty
3) Set up a kinetic assay with the parameter settings described below.
4) Enter location and file name for saving the data.
5) Click GO to run the assay.
Assay Step Step Data Sample Step Type Assay
Number Name Column Time(s)
1 Equilibration 1 Custom 60
2 Loading 2 Loading 120
3 Baseline 3 Baseline 60
4 Loading2 4 Loading 500
5 Baseline 5 Baseline 60
6 Association 6 Association 500
7 Dissociation 7 Dissociation 120
4. Analyze data
1) In the Octet Data Analysis software, load the data folder to be analyzed.
2) In the Processing tab, select Association step. Then click on the
"quantitate the Selected
Step".
3) Input Concentration information accordingly.
4) In the Results tab, select R equilibrium (Req) as the binding rate
equation. This equation
will fit the binding curve generated during the experiment and calculate a
response at
equilibrium as the output signal.
5) Click on Calculate Binding Rate. Results will be displayed automatically in
the table.
6) Click the Save Report button to generate a MS Excel report file.
7) Use SoftMax Pro, a 4-parameter logistic curve-fitting program, to generate
a standard
curve or sample curve by Binding rate (nm) against the IMP321 concentration
expressed
ug/mL. An example is shown in Figure 10.
8) Calculate relative binding potency of the sample using EC50 ratio of the
Reference
Standard and the Sample.
5. System suitability and assay acceptance criteria.
CA 03046720 2019-06-11
WO 2018/113621
PCT/CN2017/116889
-29-
An assay is valid if it meets ALL following criteria:
1) Ready to use Raji cell viability >= 60%
2) Relative activity of the control is within 80%-120%
3) Signal to Background ratio of the control (Parameter D/Parameter A) >=2.
4) Parallelism (comparability): slope ratio with the Standard is between 0.8
and 1.4.
5) If the result for the assay control does not meet the criteria listed
above, the assay is
considered invalid.
6. Reportable value:
1) For a clinical sample, the reportable value for a sample is defined as the
mean of two or
three valid and independent assay results as detailed below:
% Difference is calculated as follows:
Absolute value (Assay 1 Result - Assay 2 Result) / Mean value (Assay 1 Result,
Assay 2 Result) x 100%
2) If the %Difference of the two assay results <= 20%, report mean results of
the two assays.
3) If the % Difference of the two assay results >20%, perform 1 additional
valid assay.
4) If the CV of the three sample assay results <=25%, report mean results of
the three assays.
5) If the CV of the three sample assay results > 25%, there is no reportable
value. Initiate a
discrepancy with a re-test plan.
6) If the reportable value for a sample does not meet specifications listed in
the COA,
initiate a discrepancy with a retest plan.
7. Retest Plan
Perform the retest of a sample as follows:
1) Retest the sample with three valid and independent assays
2) If the CV of the three sample assay results <=25%, report mean results of
the three assays.
3) If the CV of the three sample assay results > 25%, there is no reportable
value.
4) If the retest result is out of specification (00S) listed in the COA, the
conclusion is fail.
Example 7
Determination of specific binding of immobilised IMP321 to Raji cells in
solution in a BLI
assay
A BLI assay as described in Example 6 was used to determine binding of
immobilised
IMP321 to different concentrations of Raji cells in solution (8E6/mL, 4E6/mL,
2E6/mL,
1E6/m1). Jurket cells were used as a negative control. The association and
dissociation
CA 03046720 2019-06-11
WO 2018/113621
PCT/CN2017/116889
-30-
curves obtained are shown in Figure 11(a). Figure 11(b) shows a graph of the
binding signal
obtained for the different Raji cell concentrations. The results show that the
binding signal
was dependent on the concentration of Raji cells, i.e. the higher the
concentration of Raji
cells, the higher the binding rate and upper plateau obtained. No specific
binding of Jurket
cells was observed in the same assay.
A further BLI assay was performed as described in Example 6, but to compare
binding of
immobilised IMP321 to Raji cells with binding of immobilised Humira or
Avastin. The
association and dissociation curves obtained are shown in Figure 12(a). Figure
12(b) shows
a graph of the binding signal obtained for the different immobilised proteins.
The results
show that IMP321, but not Humira or Avastin, binds to Raji cells.
It was concluded from these results that the BLI assay is able to determine
specific binding
of immobilised IMP321 to Raji cells in solution.
Example 8
Correlation of IMP321 binding activity measured by BLI assay with known
binding potency
Samples of IMP321 diluted from reference standard with different levels of
Raji cell
binding potency were used in a BLI assay to determine whether the binding
activity
measured by the assay correlated with the known binding potency of the
samples. The
results are shown in the table below. Figure 13 shows a plot of the percentage
binding
potency, measured by BLI assay, versus their expected potency;
Sample binding Potency determined Percentage recovery
potency by BLI assay
50% 55% 110%
75% 80% 107%
100% 98% 98%
125% 135% 108%
150% 150% 100%
The results show a good correlation between the binding potency measured by
BLI assay,
and the expected binding potency. Mean recoveries of each sample were from 90%
to 110%,
with good parallelism of binding curves (i.e. acceptable slope ratio and
converged plateaus).
CA 03046720 2019-06-11
WO 2018/113621
PCT/CN2017/116889
-31-
Example 9
Use of frozen cells in a BLI assay to determine MHC class II binding activity
A BLI assay as described in Example 6 was carried out to compare binding of
immobilised
IMP321 to Raji cells in solution obtained from culture or from a frozen stock
solution. A
plot of the binding signal obtained for binding of different concentrations of
immobilised
IMP321 to cultured Raji cells in solution is shown in Figure 14(a). A plot of
the binding
signal obtained for binding of different concentrations of immobilised IMP321
to previously
frozen Raji cells in solution is shown in Figure 14(b).
The results show that the frozen Raji cells behave very similarly to the
cultured Raji cells,
and so the frozen stock solution can be used in place of a fresh culture
solution, thereby
providing improved assay robustness and transferability.
Example 10
In-process sample testing
BLI assays as described in Example 6 were carried out to determine the MHC
class II
binding activity of various different preparations of IMP321, and to compare
the bioactivity
of the preparations as determined by CCL4 release assay.
THP-1 is a human single nuclear leukaemia cell line. When induced with LAG-3
protein, or
stressed samples, THP-1 cells secrete cytokine CCL4 which can be quantified
with a CCL4
ELISA kit. The level of CCL4 release can be used to measure the bioactivity of
a
preparation of LAG-3 protein, or a fragment, derivative, or analogue thereof
IMP321 Sample Bioactivity Bioactivity
(CCL4 release) (binding)
SD140817K01 102% 92%
20140801-TO 101% 89%
20140802-TO 102% 91%
20140801-TO-PC 98% 102%
20140802-TO-PC 97% 91%
20140801-D-25-5D 104% 93%
CA 03046720 2019-06-11
WO 2018/113621
PCT/CN2017/116889
-32-
20140802-D-25-5D 96% 87%
20140803-TO 110% 86%
20140804-TO 104% 100%
It was concluded that the bioactivity of the different IMP321 samples
correlated with the
bioactivity as determined by CCL4 release assay.
Example 11
BLI assay testing of stressed IMP321 samples and correlation to a cell-based
CCL4 release
assay
BLI assays as described in Example 6 were used to determine MHC class II
binding activity
of IMP321 samples that have been exposed to different treatments
(deglycosylation by
treatment with PNGase, storage at 37 C, oxidation by treatment with 1% or 0.1%
hydrogen
peroxide, treatment with acid at pH 3.0, 3.6, or 3.1, treatment with alkali at
pH 9.2, 9.75, or
exposure to light). The results are shown in Figures 15-24.
Figure 15(a) shows a plot of the downstream CCL4 release obtained by cell-
based assay for
binding of different concentrations of immobilised IMP321, or deglycosylated
IMP321, to
Raji cells;
Figure 15(b) shows a plot of the binding signal obtained by BLI assay for
binding of
different concentrations of immobilised IMP321, or deglycosylated IMP321, to
Raji cells;
Figure 16 shows plots of the signal for binding of different concentrations of
immobilised
IMP321, or IMP321 stored inappropriately (at 37 C for 12 days) to Raji cells.
The results
shown in Figure 16(a) were obtained by cell-based assay measuring CCL4
release, and the
results shown in Figure 16(b) were obtained by BLI assay;
Figure 17 shows plots of the signal for binding of different concentrations of
immobilised
IMP321, or IMP321 stored inappropriately (at 37 C for lmonth) to Raji cells.
The results
shown in Figure 17(a) were obtained by cell-based assay measuring CCL4
release, and the
results shown in Figure 17(b) were obtained by BLI assay;
Figure 18 shows plots of the signal obtained by cell-based assay measuring
CCL4 release
(Figure 18a), or by BLI assay (Figure 18b), for binding of different
concentrations of
immobilised IMP321 untreated, or oxidised IMP321 (with 1% hydrogen peroxide),
to Raji
cells;
CA 03046720 2019-06-11
WO 2018/113621
PCT/CN2017/116889
-33-
Figure 19 shows plots of the signal obtained by cell-based assay measuring
CCL4 release
(Figure 19a), or by BLI assay (Figure 19b), for binding of different
concentrations of
immobilised IMP321 untreated, or oxidised IMP321 (with 0.1% hydrogen
peroxide), to Raji
cells;
Figure 20 shows plots of the signal obtained by cell-based assay measuring
CCL4 release
(Figure 20a), or by BLI assay (Figure 20b), for binding of different
concentrations of
immobilised IMP321 untreated, or acid-treated (at pH 3.0), to Raji cells;
Figure 21 shows plots of the signal obtained by cell-based assay measuring
CCL4 release
(Figure 21a), or by BLI assay (Figure 21b), for binding of different
concentrations of
immobilised IMP321 untreated, or acid-treated (at pH 3.1, or pH 3.6), to Raji
cells;
Figure 22 shows plots of the signal obtained by cell-based assay measuring
CCL4 release
(Figure 22a), or by BLI assay (Figure 22b), for binding of different
concentrations of
immobilised IMP321 untreated, or base-treated (at pH 9.2 or pH 9.75), to Raji
cells;
Figure 23 shows plots of the signal obtained by cell-based assay measuring
CCL4 release
(Figure 23a), or by BLI assay (Figure 23b), for binding of different
concentrations of
immobilised IMP321 untreated, or light-exposed (at 25 C for 5 days), to Raji
cells; and
Figure 24 shows plots of the signal obtained by cell-based assay measuring
CCL4 release
(Figure 24a), or by BLI assay (Figure 24b), for binding of different
concentrations of
immobilised IMP321 untreated, or light-exposed (at 25 C for 10 days).
The bioactivity (as determined by CCL4 release of the different IMP321
samples, compared
with their MHC class II binding activity (determined by a method as described
in Example 6)
is shown in the table below:
Figure Sample Bioactivity Bio activity
No. (CCL4 release) (binding)
15 IMP321 PNGase treated None NRR
IMP321 stored at 37 C (12D NRR NRR
16
= 12 days)
IMP321 stored at 37C (1M = None None
17
1 month)
IMP321 stored at 37 C (1D = 84% 77%
18 1 day) Control
IMP321 Oxidation, 1% 11202 10% None
CA 03046720 2019-06-11
WO 2018/113621 PCT/CN2017/116889
-34-
at 37 C (1D = 1 day)
IMP321 stored at 37 C (1D = 84% 85%
19 1 day) Control
IMP321 Oxidation, 0.1% 21% NRR
H202at 37 C (1D = 1 day)
IMP321, pH 7.0 at RT (1D = 87% 126%
20 1 day)
IMP321, Acid pH 3.0 at RT 7% None
(1D = 1 day)
IMP321, pH 7.0 at RT (1D = NA 95%
1 day)
IMP321, Acid pH 3.6 at RT 29% NRR
21
(1D = 1 day)
IMP321, Acid pH 3.1 at RT 15% NRR
(1D = 1 day)
IMP321, pH 7.0 at 37 C (1D 79% 94%
= 1 day)
IMP321, Alkali pH 9.2 at 17% NRR
22
37 C (1D = 1 day)
IMP321, Alkali pH 9.75 at None None
37 C (1D = 1 day)
IMP321, Dark, 5D = 5 days 100% 100%
23
IMP321, Light, 5D = 5 days 87% 74%
IMP321, Dark, 10D = 10 100% 100%
days
24
IMP321, Light, 10D = 10 73% 75%
days
The results show a good correlation between the bioactivity of each treated
IMP321 sample,
as determined by CCL4 release, and its MHC class II binding activity, as
determined by BLI
assay according to the invention. It was concluded that determination of MHC
class II
binding activity by BLI assay can be used to determine the bioactivity of
IMP321
preparations.