Note: Descriptions are shown in the official language in which they were submitted.
CA 03049461 2019-07-04
WO 2018/132518 PCT/US2018/013227
EPIGENETIC ANALYSIS OF CELL THERAPY AND RELATED METHODS
Cross-Reference to Related Applications
[0001] This application claims priority from U.S. provisional application No.
62/444,802,
filed January 10, 2017, entitled "EPIGENETIC ANALYSIS OF CELL THERAPY AND
RELATED METHODS," U.S. provisional application No. 62/551,752, filed August
29, 2017,
entitled "EPIGENETIC ANALYSIS OF CELL THERAPY AND RELATED METHODS," and
U.S. provisional application No. 62/596,662, filed December 8, 2017, entitled
"EPIGENETIC
ANALYSIS OF CELL THERAPY AND RELATED METHODS," the contents of which are
incorporated by reference in their entirety.
Incorporation by Reference of Sequence Listing
[0002] The present application is being filed along with a Sequence Listing in
electronic
format. The Sequence Listing is provided as a file entitled
735042009440SeqList.TXT, created
January 10, 2018 which is 35,537 bytes in size. The information in the
electronic format of the
Sequence Listing is incorporated by reference in its entirety.
Field
[0003] The present disclosure relates in some aspects to a method of
identifying genomic
region(s) predictive of an outcome of treatment with a cell therapy and/or of
a phenotype of
function of the cells. In some embodiments, the methods include epigenetic
and/or epigenomic
analyses of the cells in connection with methods for preparing engineered
cells for cell therapy
and/or predicting response to a cell therapy, e.g., engineered cells for cell
therapy. In some
embodiments, the methods include steps to assess, characterize and analyze
changes or
modifications in an epigenetic property of gene region or regions, such as
chromatin
accessibility, nucleosome occupancy, histone modification, spatial chromosomal
conformation,
transcription factor occupancy and/or DNA methylation. In some embodiments,
the epigenetic
and/or epigenomic analysis includes determining the epigenetic properties of a
cell, e.g., an
engineered cell for cell therapy.
Background
1
CA 03049461 2019-07-04
WO 2018/132518 PCT/US2018/013227
[0004] Various strategies are available for preparing and administering cells
used in
connection with adoptive cell therapy, including methods for preparing
genetically engineered T
cells or involving administering genetically engineered T cells, such as
engineered with antigen
receptors, such as CARs. In some aspects, available methods may not be
entirely satisfactory.
There is a need for additional strategies for preparing cells and for
administering cells in
connection with adoptive cell therapy. Provided are methods that meet such
needs.
Summary
[0005] Provided herein are methods of identifying one or more genomic
region(s) predictive
of an outcome of treatment with a cell therapy, the method that includes: (a)
analyzing or
determining an epigenetic property of one or more genomic regions of a cell or
a population of
cells, said cell or population comprised in (i) a first composition of cells
to be genetically
engineered with a recombinant receptor to produce a second composition that
includes the
recombinant receptor, or (ii) a second composition of cells that includes the
recombinant
receptor; and (b) identifying one or more of said one or more genomic regions,
of which the
epigenetic property, overall across the one or more genomic regions, predicts,
indicates or
correlates with an outcome of a cell therapy, said cell therapy that includes
administering the
second composition of cells that includes the recombinant receptor. In some
embodiments, the
outcome is optionally a complete response, a partial response, progressive
disease, a molecularly
detectable disease, relapse, durability of response, outcome associated with
or indicative of
efficacy, or outcome associated with or indicative of toxicity.
[0006] Provided herein are methods of identifying one or more genomic
region(s) associated
with an outcome of treatment with a cell therapy, the method comprising: (a)
analyzing or
determining an epigenetic property of one or more genomic regions of a cell or
a population of
cells, said cell or population comprised in (i) a first composition of cells
to be genetically
engineered with a recombinant receptor to produce a second composition
comprising the
recombinant receptor, or (ii) a second composition of cells comprising the
recombinant receptor;
and (b) identifying one or more of the one or more genomic regions, of which
the epigenetic
property, overall across the one or more genomic regions, predicts, indicates
or correlates with
an outcome of a cell therapy, said cell therapy comprising administering to a
subject or a group
of subjects the second composition of cells comprising the recombinant
receptor.
2
CA 03049461 2019-07-04
WO 2018/132518 PCT/US2018/013227
[0007] In some embodiments, the outcome is an outcome associated with or
indicative of
efficacy, a response, persistence, a toxicity, or immunogenicity.
[0008] Also provided are methods for determining one or more properties or
features of a
cell composition, the method comprising analyzing or determining an epigenetic
property of one
or more genomic regions of a T cell composition, said T cell composition
enriched for CD4+
primary human T cells and/or CD8+ primary human T cells.
[0009] In some embodiments, the cell composition is (i) a first T cell
composition of cells to
be genetically engineered with a recombinant receptor to produce a second T
cell composition
comprising the recombinant receptor, or (ii) a second T cell composition of
cells comprising the
recombinant receptor.
[0010] In some embodiments, the method further comprises comparing the
epigenetic
property for each of the one or more genomic region, individually, to the
corresponding
epigenetic property of cells from a different cell composition and/or to a
reference profile,
optionally a reference profile known to indicate or correlate with an
attribute or feature of a cell
composition.
[0011] In some embodiments, the comparison indicates or correlates with the
state,
phenotype or function of the cells within the cell composition, optionally an
activation, effector
or memory state; consistency or uniformity of the cells within the cell
composition; whether the
composition of cells is or is likely to exhibit or produce an outcome when
administered to a
subject or a group of subjects; , the location, abundance or frequency of
integration of
exogenous nucleic acids; clonality of cells within the cell composition;
and/or the proportion or
frequency of engineered cells in the cell composition.
[0012] Provided herein are methods for determining or identifying an
epigenetic property
associated with an attribute or feature of a cell composition, the method
comprising: (a)
determining or measuring a level or degree or relative level or degree of an
epigenetic property
of one or more genomic regions for a cell or a population of cells comprised
in a first cell
composition;(b) determining or measuring a level or degree or relative level
or degree of said
epigenetic property of the one or more genomic regions for a cell or a
population of cells
comprised in a second cell composition; and (c) comparing the level or degree
in (a) and the
level or degree in (b), wherein a difference, optionally a significant
difference, in the level or
degree of the epigenetic property of the one or more of the genomic regions
identifies or
determines the presence of an epigenetic property indicative of or that
correlates with an
attribute or feature present in cells of one but not the other of the first
and second composition.
3
CA 03049461 2019-07-04
WO 2018/132518 PCT/US2018/013227
[0013] In some embodiments, one of the first composition and second
composition
comprises cells to be genetically engineered with a recombinant receptor and
the other of the
first composition and second composition comprises the cells engineered to
express the
recombinant receptor; the first composition and second composition comprise
primary cells
from different donors, optionally donors that differ based on disease state,
severity of disease, or
type of disease; the first composition and second composition comprise cells
at different stages
or steps of a manufacturing process for engineering cells; one of the first
composition and
second composition comprises cells contacted with an agent to modulate the
activity, phenotype
or function of the cells and the other of the first and second composition
comprises similar cells
not so contacted; or one of the first composition and second composition
comprises a sample of
a cell composition associated with an outcome that occurs or has occurred with
the one but not
the other of the first and second composition following administration to a
subject. In some
embodiments, the agent is a polypeptide or protein, a peptide, an antibody, a
nucleic acid, a viral
vector or viral preparation, or a small molecule compound. In some
embodiments, the agent is a
stimulatory reagent, optionally anti-CD3/anti-CD28; an immunomodulatory agent,
an anti-
idiotype antibody or antigen-binding fragment thereof specific to the CAR, an
immune
checkpoint inhibitor, a modulator of a metabolic pathway, an adenosine
receptor antagonist, a
kinase inhibitor, an anti-TGFP antibody or an anti-TGUR antibody or a
cytokine.
[0014] In some embodiments, the attribute or feature of the first composition
is indicative of
a state, phenotype of function, optionally an activation, effector or memory
state, phenotype or
function; the location, abundance or frequency of integration of exogenous
nucleic acids;
clonality of cells within the cell composition; the proportion or frequency of
engineered cells in
the cell composition; and/or whether the composition of cells is or is likely
to exhibit or produce
an outcome when administered to a subject or a group of subjects.
[0015] Provided herein are methodsof assessing an attribute or feature of a
cell composition,
comprising: (a) analyzing an epigenetic property of one or more genomic
regions of a cell or
population of cells comprised in a cell composition comprising cells
engineered with a
recombinant receptor and/or cells to be genetically engineered with a
recombinant receptor; and
(b) comparing the epigenetic property of the one or more genomic region,
individually, to a
reference profile, wherein the comparison indicates whether the composition of
cells is or is
likely to exhibit the attribute or feature.
[0016] In some embodiments, the attribute or feature is indicative of a state,
phenotype of
function, optionally an activation, effector or memory state, phenotype or
function; the location,
4
CA 03049461 2019-07-04
WO 2018/132518 PCT/US2018/013227
abundance or frequency of integration of exogenous nucleic acids; clonality of
cells within the
cell composition; the proportion or frequency of engineered cells in the cell
composition; and/or
whether the composition of cells is or is likely to exhibit or produce an
outcome when
administered to a subject or a group of subjects. In some embodiments, the
attribute or feature is
whether the composition of cells is or is likely to exhibit or produce an
outcome when
administered to a subject or a group of subjects and the method is for
assessing the cell
composition for administration to a subject.
[0017] Also provided herein are methods of identifying one or more genomic
region(s)
predictive of an outcome of treatment with a cell therapy, the method that
includes: (a)
determining or measuring a level or degree or relative level or degree of an
epigenetic property
of one or more genomic regions for a cell or a population of cells comprised
in a first therapeutic
composition; (b) determining or measuring a level or degree or relative level
or degree of said
epigenetic property of said one or more genomic regions for a cell or a
population of cells
comprised in second therapeutic composition; (c) comparing the level or degree
in (a) and the
level or degree in (b) for one or more of the genomic regions.
[0018] In some embodiments, the method further includes identifying one or
more of the
one or more genomic regions in which the level or degree determined or
measured in (a) is
different, optionally significantly different, as compared to the level or
degree determined or
measured in (b).
[0019] In some embodiments, for each of the plurality of genomic regions, a
difference or
significant difference between the level or degree detected or measured in (a)
and the level or
degree detected or measured in (b) indicates that the epigenetic property or
degree or level
thereof correlates with, predicts, predicts the likelihood or risk of, an
outcome that occurs or has
occurred with one but not the other of, the first and second therapeutic
compositions, wherein
the outcome is optionally a complete response, a partial response, progressive
disease, a
molecularly detectable disease, relapse, durability of response, outcome
associated with or
indicative of efficacy, or outcome associated with or indicative of toxicity.
[0020] In some embodiments, the genomic region includes a genomic locus or
gene. In some
embodiments, the genomic region includes an open reading frame of a gene. In
some
embodiments, the epigenetic property is selected from among chromatin
accessibility,
nucleosome occupancy, histone modification, spatial chromosomal conformation,
transcription
factor occupancy and DNA methylation. In some embodiments, the epigenetic
property is
chromatin accessibility. In some embodiments, said epigenetic property
includes chromatin
CA 03049461 2019-07-04
WO 2018/132518 PCT/US2018/013227
accessibility, a level or degree of chromatin accessibility, a relative level
or degree of chromatin
accessibility, and/or said epigenetic property includes a degree or level of,
relative degree or
level of, or profile or map of, chromatin accessibility across the genomic
region.
[0021] In some embodiments, chromatin accessibility is determined by Assay for
Transposase Accessible Chromatin with high-throughput sequencing (ATAC-seq) or
chromatin
immunoprecipitation coupled to high-throughput sequencing (ChIP-seq). In some
embodiments,
chromatin accessibility is determined by ATAC-seq.
[0022] In some embodiments, analyzing the epigenetic property includes
generating an
epigenetic map showing a profile of sequence reads associated with or
indicative of the
epigenetic property, optionally sequence reads associated with or indicative
of chromatin
accessibility, along each of the one or more genomic regions or a subset
thereof and/or includes,
for each of a plurality of sites or portions along the length of the genomic
region, generating one
or more sequence reads indicative of an epigenetic readout, optionally
chromatin accessibility, at
said site or portion, wherein the quantity of said one or more sequence reads
indicates a degree
or level of said epigenetic property, optionally said chromatin accessibility,
at said site or
portion.
[0023] In some embodiments, said analyzing optionally further includes
determining an
overall degree or level of said epigenetic readout, optionally determining an
overall degree or
level of accessibility, over the genomic region. In some embodiments,
analyzing the epigenetic
property includes determining, measuring or quantitating a value or level of
chromatin
accessibility across the one or more genomic regions. In some embodiments,
analyzing the
epigenetic property includes determining, measuring or quantitating a value or
level associated
with or indicative of the epigenetic property, optionally chromatin
accessibility, across the one
or more genomic regions or a subset thereof.
[0024] In some embodiments, the value or level is or includes determining the
fragments per
kilobase per million of mapped reads (FPKM) value within each of the one or
more genomic
regions or a subset thereof. In some embodiments, the value or level is or
includes totaling or
summing the fragments per kilobase per million of mapped reads (FPKM) value
within each of
the one or more genomic regions or a subset thereof.
[0025] In some embodiments, the step (a) and (b) are performed for a plurality
of subjects
having each been independently administered a second composition of cells that
includes cells
engineered with a recombinant receptor.
6
CA 03049461 2019-07-04
WO 2018/132518 PCT/US2018/013227
[0026] In some embodiments, for each genomic region or subset thereof,
preparing a display
that includes the value or level of the sequence reads for each genomic locus
mapped to the
outcome of the cell therapy for each of the plurality of subjects.
[0027] In some embodiments, the display includes a heat map, a scatter plot, a
hierarchical
clustering and/or a constellation plot. In some embodiments, said identifying
said one or more
genomic regions includes performing cluster analysis based on outcome of the
cell therapy. In
some embodiments, said identifying said one or more genomic regions that
indicate or correlate
with an outcome of the cell therapy includes determining if at least a
majority of subjects with
the same or similar outcome cluster together in the display. In some
embodiments, a genomic
region is identified if at least 55%, 60%, 70%, 80%, 90%, 95% or more of the
subjects with the
same or similar outcome cluster together in the display.
[0028] In some embodiments, the whole genome of the cell is analyzed. In some
embodiments, a portion of the genome of the cell is analyzed. In some
embodiments, the portion
of the genome includes one or more genomic regions, optionally one or more
genomic loci,
associated with or indicative of or likely to be associated with or indicative
of the phenotype, the
activation state, the strength of an activation signal or the effector
function of a cell.
[0029] In some embodiments, the outcome of the cell therapy is a response, a
toxicity,
immunogenicity or a phenotype or function of the cell therapy, a complete
response, a partial
response, progressive disease, a molecularly detectable disease, relapse,
durability of response,
outcome associated with or indicative of efficacy, or outcome associated with
or indicative of
toxicity.
[0030] In some embodiments, the response is a complete response, partial
response,
progressive disease or a molecularly detectable disease.
[0031] In some embodiments, the toxicity is cytokine release syndrome (CRS),
severe CRS,
grade 3 or higher CRS, neurotoxicity, severe neurotoxicity, grade 3 or higher
neurotoxicity
and/or a cerebral edema. In some embodiments, the toxicity is a dose limiting
toxicity (DLT).
[0032] In some embodiments, the epigenetic property of from or from about 2 to
50, 2 to 20,
2 to 10, 2 to 5, 5 to 50, 5 to 20, 5 to 10, 10 to 50, 10 to 20 or 20 to 50
genomic regions are
analyzed. In some embodiments, a panel that includes two or more of the
genomic regions are
identified.
[0033] In some embodiments, the first composition of cells and second
composition of cells
comprise primary cells selected or isolated from a subject. In some
embodiments, the cell is an
7
CA 03049461 2019-07-04
WO 2018/132518 PCT/US2018/013227
immune cell. In some embodiments, the immune cell is a T cell or an NK cell.
In some
embodiments, the T cells is a CD4+ and/or CD8+ T cells.
[0034] In some embodiments, the second composition of cells is analyzed. In
some
embodiments, the second composition of cells includes a nucleic acid encoding
the recombinant
receptor.
[0035] In some embodiments, the nucleic acid molecule is contained in a viral
vector. In
some embodiments, the viral vector is an adenovirus, lentivirus, retrovirus,
herpesvirus or
adeno-associated virus vector.
[0036] In some embodiments, the first composition of cells and/or second
composition of
cells is produced by culturing an input composition in the presence of one or
more conditions or
agents. In some embodiments, the one or more genomic regions comprise genes
involved in or
likely to be involved in the activation state or effector state of the cell.
[0037] Also provided herein are methods of assessing a cell composition for
administration
to a subject, that includes:(a) analyzing an epigenetic profile of one or more
genomic regions of
a cell comprised in a cell composition that includes cells engineered with a
recombinant
receptor; and (b) comparing the epigenetic profile for each genomic region,
individually, to a
reference profile, wherein the comparison indicates whether the population of
cells is or is likely
to exhibit or produce an outcome when administered to a subject.
[0038] In some embodiments, the outcome of the cell therapy is a response, a
toxicity,
immunogenicity or a phenotype or function of the cell therapy, a complete
response, a partial
response, progressive disease, a molecularly detectable disease, relapse,
durability of response,
outcome associated with or indicative of efficacy, or outcome associated with
or indicative of
toxicity. In some embodiments, the response is a complete response or a
partial response.
[0039] In some embodiments, if the comparison indicates that the cell
composition is or is
likely to exhibit the outcome, administering the cell composition to the
subject.
[0040] In some embodiments, if the comparison indicates that the cell
composition is not or
is not likely to exhibit the outcome, either: (i) administering a cell
composition in which the cell
composition is altered; (ii) administering the cell composition in which the
dose of cells is
altered; (iii) administering the cell composition in which the dosage regimen
of cells
administered to the subject is altered; (iv) administering the cell
composition in combination
with one or more other therapeutic agents; or (v) not administering the cell
composition to the
subject.
8
CA 03049461 2019-07-04
WO 2018/132518 PCT/US2018/013227
[0041] In some embodimentsõ prior to administering an altered cell
composition, repeating
steps (a) and (b) on a cell comprised in the altered cell composition.
[0042] In some embodiments, altering the dosing regimen of cells includes
administering a
second dose of cells to the subject subsequent to administering a first dose
of cells to the subject.
In some embodiments, the subsequent dose of cells is administered at least 1
week, 2 weeks, 3
weeks, 4 weeks, 2 months, 3 months, 4 months, 5 months, 6 months, 9 months or
12 months
after administering the first dose of cells.
[0043] In some embodiments, the one or more genomic regions are associated
with or
indicative of a response to the cell therapy.
[0044] In some embodiments, the reference profile includes a threshold value
for the
epigenetic property for each of the one or more genomic regions or for the
overall epigenetic
property within the one or more genomic regions.
[0045] In some embodiments, the threshold value: is a value or level of the
epigenetic
property, optionally chromatin accessibility, in the one or more genomic
regions in a cell of a
cell composition shown to exhibit the outcome when administered to a subject
having the same
or similar disease or condition; or is an average, median or mean value or
level of the epigenetic
property, optionally chromatin accessibility, in the one or more genomic
regions from a cell of
each of a plurality of cell compositions, shown to exhibit the outcome when
administered to the
subject. In some embodiments, the threshold value includes is the value or
level of the
epigenetic property in a cell from a normal or healthy subject. In some
embodiments, the
threshold value includes the value or level of the epigenetic property in a
cell that exhibits a
naïve or a long-lived memory phenotype.
[0046] In some embodiments, the threshold value: is a value or level
associated with or
indicative of the epigenetic property, optionally chromatin accessibility, in
the one or more
genomic regions in a cell of a cell composition shown to exhibit the desired
outcome when
administered to a subject having the same or similar disease or condition; or
is an average,
median or mean value or level, or is within a standard deviation of the
average, median or mean
value or level, associated with or indicative of the epigenetic property,
optionally chromatin
accessibility, in the one or more genomic regions from a cell of each of a
plurality of cell
compositions that had been individually administered to a group of subjects,
wherein each of the
subjects of the group went on to shown to exhibit the desired outcome when
administered
following administration to the subject; or is the value or level associated
with or indicative of
the epigenetic property in a similar cell composition from a normal or healthy
subject. .
9
CA 03049461 2019-07-04
WO 2018/132518 PCT/US2018/013227
[0047] Also provided herein are methods of assessing a cell culture, that
includes: (a)
analyzing an epigenetic profile of one or more genomic regions of a cell
comprised in an output
cell composition, said output composition produced by culturing an input
composition in the
presence of one or more test agents or conditions; and (b) comparing the
epigenetic profile for
each genomic region, individually, to a reference profile, wherein the
comparison indicates
whether the cell is or is likely to exhibit a predetermined phenotype or
function.
[0048] In some embodiments, the predetermined phenotype or function indicates
the effector
function or activation state of the cell and/or indicates that the cells
exhibit a naïve phenotype or
a long-lived memory phenotype.
[0049] In some embodiments, the one or more test agents or conditions includes
presence or
concentration of serum; time in culture; presence or amount of a stimulating
agent; the type or
extent of a stimulating agent; presence or amount of amino acids; temperature;
the source or cell
types of the input composition; the ratio or percentage of cell types in the
input composition,
optionally the CD4+/CD8+ cell ratio; the presence or amount of beads; cell
density; static
culture; rocking culture; perfusion; the type of viral vector; the vector copy
number; the
presence of a transduction adjuvant; cell density of the input composition in
cryopreservation;
the extent of expression of the recombinant receptor; or the presence of a
compound to modulate
cell phenotype. In some embodiments, the one or more test agents or conditions
includes one or
more compounds from a library of test compounds.
[0050] In some embodiments, the method includes if the comparison indicates
that the cell
composition is or is likely to have the phenotype or function, selecting the
one or more test agent
or condition for culturing the cells. In some embodiments, the method includes
if the
comparison indicates that the cell composition is or is likely not to have the
phenotype or
function, repeating steps (a) and (b) with one or more further test agent or
condition.
[0051] In some embodiments, the reference profile includes a threshold value
for the
epigenetic property for each of the one or more genomic regions or for the
overall epigenetic
property within the one or more genomic regions.
[0052] In some embodiments, the threshold value: is a value or level of the
epigenetic
property, optionally chromatin accessibility, in the one or more genomic
regions in a cell of a
reference cell composition shown to exhibit the phenotype or function; or is
an average, median
or mean value or level of the epigenetic property, optionally chromatin
accessibility, in the one
or more genomic regions from a cell of each of a plurality of reference cell
compositions, shown
to exhibit the phenotype or function.
CA 03049461 2019-07-04
WO 2018/132518 PCT/US2018/013227
[0053] In some embodiments, the reference cell composition has a phenotype
indicative of a
naïve T cell, a long-lived memory T cell, a central memory T cell (Tcm) or a
stem-like memory
T cell (Tcsm).
[0054] In some embodiments, analyzing the epigenetic property includes
determining,
measuring or quantitating a value or level of chromatin accessibility across
the one or more
genomic regions. In some embodiments, analyzing the epigenetic property
includes determining,
measuring or quantitating a value or level of the sequence reads associated
with or indicative of
the epigenetic property, optionally chromatin accessibility, in the one or
more genomic regions
or a subset thereof. In some embodiments, determining, measuring or
quantitating a value or
level includes determining the fragments per kilobase per million of mapped
reads (FPKM)
value within each of the one or more genomic regions or a subset thereof. In
some
embodiments, determining, measuring or quantitating a value or level includes
totaling or
summing the fragments per kilobase per million of mapped reads (FPKM) value
within each of
the one or more genomic regions or a subset thereof.
[0055] In some embodiments, the one or more genomic regions includes a panel
that
includes at least 2 to 50, 2 to 20, 2 to 10, 2 to 5, 5 to 50, 5 to 20, 5 to
10, 10 to 50, 10 to 20 or 20
to 50 genomic regions.
[0056] In some embodiments, the one or more genomic regions comprise one or
more
genomic loci associated with or indicative of the effector-like function or
activation state of the
cell.
[0057] In some embodiments, the one or more genomic regions includes a genetic
locus
selected from the group consisting of Nr4a1, Cblb, Irf4, Tbx21, Eomes, Ifng,
Il2ra, 112, Csf2,
Gzmb, Tnfsf10, Gata3, Mir155, Sox21, Ctla4, Lag3, and Pdcdl. In some
embodiments, the one
or more genomic regions includes a genomic locus selected from the group
consisting of Ctla4,
Il2ra, 112, Ifng and Gzmb.
[0058] In some embodiments, the genomic region includes a genomic locus or
gene. In some
embodiments, the genomic region includes an open reading frame of a gene. In
some
embodiments, the genomic region comprises an intergenic region or a regulatory
element. In
some embodiments, the genomic region comprises an intron, an exon, a cis-
regulatory element,
a promoter, an enhancer, an upstream activating sequence (UAS), a 3'
untranslated region
(UTR), a 5' UTR, a non-coding RNA producing region, a non-coding RNA (ncRNA)
gene, a
miRNA gene, an siRNA gene, a piRNA gene, a snoRNA gene, a lncRNA gene, a
ribosomal
RNA (rRNA) gene, a small RNA binding site, a non-coding RNA binding site, a
pseudogene, a
11
CA 03049461 2019-07-04
WO 2018/132518 PCT/US2018/013227
transcription termination site (TTS), a repeat, a telomeric region, accessible
chromatin region,
non-accessible chromatin region, open chromatin region and/or heterochromatin
region.
[0059] In some embodiments, the epigenetic property is selected from among
chromatin
accessibility, nucleosome occupancy, histone modification, spatial chromosomal
conformation,
transcription factor occupancy and DNA methylation. In some embodiments, the
epigenetic
property is chromatin accessibility. In some embodiments, chromatin
accessibility is determined
by Assay for Transposase Accessible Chromatin with high-throughput sequencing
(ATAC-seq)
or chromatin immunoprecipitation coupled to high-throughput sequencing (ChIP-
seq). In some
embodiments, chromatin accessibility is determined by ATAC-seq.
[0060] In some embodiments, the assessing the epigenetic property comprises:
(1) isolating
chromatin from the cells or the population of cells, (2) treating the
chromatin with an insertional
enzyme complex to generate tagged fragments of genomic DNA, (3) sequencing all
or a portion
of the tagged fragments to produce a plurality of sequence reads; (4)
aligning, filtering and
mapping the sequence reads to genomic regions of a genome; and (5) determining
or identifying
peaks of sequence reads in a plurality of genomic regions for each cell or
population of cells. In
some embodiments, the analyzing or assessing the epigenetic property further
comprises
comparing peaks of sequence reads and, optionally identifying peaks of
sequence reads that are
different between samples from two or more cells or cell compositions. In some
embodiments,
peaks of sequence reads comprise sequence reads having a peak signal, level or
value that is
enriched, is above background, and/or is higher compared to sequence reads of
a surrounding
regions. In some embodiments, the analyzing or assessing the epigenetic
property further
comprises performing motif analysis, transcription factor occupancy analysis
and/or biological
pathway analysis of genomic regions identified as containing peaks of sequence
reads that are
different between samples from two or more cell populations. In some
embodiments, the
analyzing or assessing the epigenetic property further comprises determining
positions of
nucleosomes within genomic regions containing peaks of sequence reads.
[0061] In some embodiments, the analysis comprises steps for removal of
mitochondrial
reads and/or additional contaminating sequences based on sequence identity,
quality, mapping
location, or other sequencing properties of said reads. In some embodiments,
the analysis
comprises steps for removal of duplicate reads to improve quantitative
accuracy. In some
embodiments, the analysis comprises steps for separation of sequence reads
into subsets
representing a specific epigenetic property, optionally chromatin
accessibility or chromatin
12
CA 03049461 2019-07-04
WO 2018/132518 PCT/US2018/013227
occupancy, wherein the size of the sequenced fragment is used to determine the
degree or level
to which it represents said epigenetic property.
[0062] In some embodiments, analyzing further comprises performing principle
component
analysis (PCA), biological pathway analysis, gene ontology (GO) analysis
and/or motif analysis.
[0063] In some embodiments, the cell is obtained from a sample from a subject.
In some
embodiments, the cell is an immune cell, optionally a T cell, optionally a
CD4+ and/or CD8+ T
cell.
[0064] In some embodiments, the recombinant receptor binds to, recognizes or
targets an
antigen associated with the disease or condition; and/or the recombinant
receptor is a T cell
receptor or a functional non-T cell receptor; and/or the recombinant receptor
is a chimeric
antigen receptor (CAR). In some embodiments, the CAR includes an extracellular
antigen-
recognition domain that specifically binds to the antigen and an intracellular
signaling domain
that includes an ITAM, wherein optionally, the intracellular signaling domain
includes an
intracellular domain of a CD3-zeta (CD3) chain; and/or wherein the CAR further
includes a
costimulatory signaling region, which optionally includes a signaling domain
of CD28 or 4-
1BB .
[0065] Also provided herein are cell compositions that include a plurality of
cells, wherein
the level or value of an epigenetic property for one or more genes in a panel
is above or below a
threshold value in at least 50% of the cells in the composition.
[0066] In some embodiments, the level or value is above or below the threshold
value in at
least 60%, 70%, 75%, 80%, 85%, 90%, 95% or more of the cells in the
composition. In some
embodiments, the threshold value: is a value or level of the epigenetic
property, optionally
chromatin accessibility, in the one or more genomic regions in a cell of a
reference cell
composition shown to exhibit the phenotype or function; or is an average,
median or mean value
or level of the epigenetic property, optionally chromatin accessibility, in
the one or more
genomic regions from a cell of each of a plurality of reference cell
compositions, shown to
exhibit the phenotype or function.
[0067] In some embodiments, the reference cell composition has a phenotype
indicative of a
naïve T cell, a long-lived memory T cell, a central memory T cell (Tcm) or a
stem-like memory
T cell (Tcsm).
[0068] In some embodiments, the panel includes from or from about 2 to 50, 2
to 20, 2 to
10, 2 to 5, 5 to 50, 5 to 20, 5 to 10, 10 to 50, 10 to 20 or 20 to 50 genomic
regions.
13
CA 03049461 2019-07-04
WO 2018/132518 PCT/US2018/013227
[0069] Also provided herein are methods of assessing transgene integration,
the method
comprising: determining an epigenetic property of one or more genomic regions
comprising a
nucleic acid sequence of a transgene, in a cell or a cell composition
genetically engineered with
a recombinant receptor. In some embodiments, the genetic engineering is
carried out by
introduction, into one or more cells of a cell composition, of a nucleic acid
encoding the
recombinant receptor.
[0070] In some embodiments, the introduction is by transduction with a viral
vector
comprising the nucleic acid. In some embodiments, the epigenetic property is
chromatin
accessibility. In some embodiments, the epigenetic property comprises
chromatin accessibility, a
level or degree of chromatin accessibility, a relative level or degree of
chromatin accessibility,
and/or the epigenetic property comprises a degree or level of, relative degree
or level of, or
profile or map of, chromatin accessibility of the genomic region.
[0071] In some embodiments, chromatin accessibility is determined by Assay for
Transposase Accessible Chromatin with high-throughput sequencing (ATAC-seq) or
chromatin
immunoprecipitation coupled to high-throughput sequencing (ChIP-seq),In some
embodiments,
chromatin accessibility is determined by ATAC-seq.
[0072] In some embodiments, the assessing the epigenetic property comprises:
(1) isolating
chromatin from the cells or the population of cells, (2) treating the
chromatin with an insertional
enzyme complex to generate tagged fragments of genomic DNA, (3) sequencing all
or a portion
of the tagged fragments to produce a plurality of sequence reads; (4)
aligning, filtering and
mapping the sequence reads to genomic regions of a genome; and (5) determining
or identifying
peaks of sequence reads in a plurality of genomic regions for each cell or
population of cells.
[0073] In some embodiments, the analyzing or assessing the epigenetic property
further
comprises determining the peaks of sequence reads that maps to or is
corresponds to the nucleic
acid sequence of the transgene In some embodiments, peaks of sequence reads
comprise
sequence reads having a peak signal, level or value that is enriched, is above
background, and/or
is higher compared to sequence reads of a surrounding regions. In some
embodiments,
analyzing the epigenetic property comprises generating an epigenetic map
showing a profile of
sequence reads associated with or indicative of the epigenetic property,
optionally sequence
reads associated with or indicative of chromatin accessibility, of the genomic
region comprising
the nucleic acid sequence of the transgene and/or comprises, for the genomic
region comprising
the nucleic acid sequence of the transgene along the length of the genomic
region, generating
one or more sequence reads indicative of an epigenetic readout, optionally
chromatin
14
CA 03049461 2019-07-04
WO 2018/132518 PCT/US2018/013227
accessibility, at said region, wherein the quantity of said one or more
sequence reads indicates a
degree or level of said epigenetic property, optionally said chromatin
accessibility, at said
region. In some embodiments, determining the epigenetic property comprises
determining,
measuring or quantitating a value or level of chromatin accessibility across
the genomic region
comprising the nucleic acid sequence of the transgene. In some embodiments,
determining the
epigenetic property comprises determining, measuring or quantitating a value
or level associated
with or indicative of the epigenetic property, optionally chromatin
accessibility, across the
genomic region comprising the nucleic acid sequence of the transgene. In some
embodiments,
the cell composition, optionally the first composition of cells and/or second
composition of cells,
comprise primary cells obtained from a sample from a subject and/or selected
or isolated from a
subject.
[0074] In some embodiments, the cell is an immune cell. In some embodiments,
the
immune cell is a T cell or an NK cell. In some embodiments, the T cells is a
CD4+ and/or CD8+
T cells.
[0075] In some embodiments, the recombinant receptor binds to, recognizes or
targets an
antigen associated with the disease or condition; and/or the recombinant
receptor is a T cell
receptor or a functional non-T cell receptor; and/or the recombinant receptor
is a chimeric
antigen receptor (CAR). In some embodiments, the CAR comprises an
extracellular antigen-
recognition domain that specifically binds to the antigen and an intracellular
signaling domain
comprising an ITAM, wherein optionally, the intracellular signaling domain
comprises an
intracellular domain of a CD3-zeta (CD3) chain; and/or wherein the CAR further
comprises a
costimulatory signaling region, which optionally comprises a signaling domain
of CD28 or 4-
1BB.
Brief Description of the Drawings
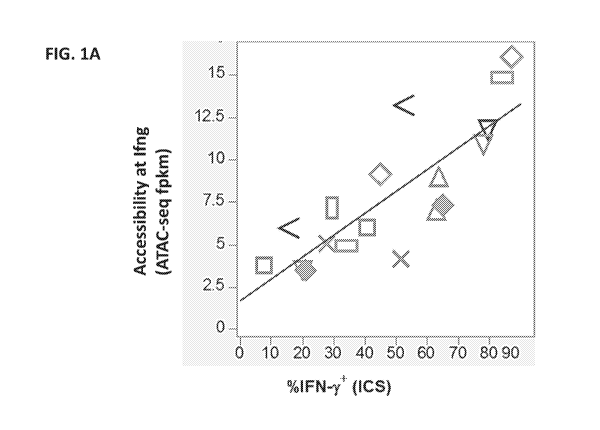
[0076] FIG. lA shows correlation of interferon-gamma (IFNy) production, as
measured by
intracellular cytokine staining (ICS) (shown on the x-axis) versus
accessibility at the gene
encoding IFNy (1fng) as determined by ATAC-seq (shown on the y-axis).
[0077] FIG. 1B shows correlation of programmed cell death protein 1 (PD-1)
production, as
measured by ICS (shown on the x-axis) versus accessibility at the gene
encoding PD1 (Pdcdl)
as determined by ATAC-seq (shown on the y-axis).
CA 03049461 2019-07-04
WO 2018/132518 PCT/US2018/013227
[0078] FIG. 1C shows correlation of the % cells producing IFNy after re-
stimulation, as
measured by ICS (shown on the x-axis) versus accessibility at the gene
encoding IFNy (1fng) as
determined by ATAC-seq (shown on the y-axis).
[0079] FIG. 1D of the % cells producing Interleukin 2 (IL-2) after re-
stimulation, as
measured by ICS (shown on the x-axis) versus accessibility at the gene
encoding IL-2 (112) as
determined by ATAC-seq (shown on the y-axis).
[0080] FIG. 2 shows protein expression by intracellular cytokine staining
(ICS) of select
genes in CD4+ or CD8+ T cells of an engineered T cell composition (left
panels) or chromatin
accessibility of genes as measured by ATAC-seq in CD4+ or CD8+ in the same
engineered T
cell compositions (right panels), each correlated to response outcome
following administration
of the cell therapy to a subject.
[0081] FIG. 3A shows the results of a whole genome analysis using ATAC-seq
performed
on CD8+ cells from a T cell composition containing genetically engineered
human T cells
expressing anti-CD19 CARs. Each column represents hierarchical clustering
based on
differences in chromatin accessibility for each gene, as calculated by the sum
of FPKM over the
gene body of each gene, shown as low (blue) or high (red). Subjects were
categorized by
response groups, including subjects who showed evidence of complete response
(CR),
progressive disease (PD) or partial response (PR). Chromatin accessibility
results by ATAC-seq
also are shown from CD8+ cells from a normal donor (ND). The asterisk
indicates a subject
who converted from CR to PD at three months.
[0082] FIG. 3B shows a clustering decision tree (constellation plot) showing
CD8+ CDP
clustering observed on whole genome ATAC-seq data by response groups.
[0083] FIG. 4A shows the results of an analysis using ATAC-seq for a subset of
targeted
panel of genes from the whole genome sequencing data performed on CD8+ cells
from a CDP
containing genetically engineered human T cells expressing anti-CD19 CARs.
[0084] FIG. 4B shows a clustering decision tree (constellation plot) for
chromatin
accessibility based on ATAC-seq data of specific genes in CD8+ cells obtained
from a CDP by
response groups.
[0085] FIG. 5A shows chromatin accessibility by ATAC-seq (represented as
relative values
of the sum of FPKM over the gene body of each gene) of genes that are
indicative of effector
cell phenotype in cryopreserved FACS-purified CD4+/CD8+ cell compositions
(CMAT) which
were not subjected to the genetic engineering.
16
CA 03049461 2019-07-04
WO 2018/132518 PCT/US2018/013227
[0086] FIG. 5B shows chromatin accessibility by ATAC-seq (represented as
relative values
of the sum of FPKM over the gene body of each gene) of genes that are
indicative of effector
cell phenotype in CD8+ CDP.
[0087] FIGS. 6A and 6B show chromatin accessibility of loci associated with
strength of
signal and effector function as measured by the sum of FPKM over the gene body
of each gene
for subjects grouped by response.
[0088] FIGS. 7A and 7B show results of principal component analysis (PCA) for
gene
expression (based on RNA-seq results; FIG. 7A) and chromatin accessibility
(based on ATAC-
seq results; FIG. 7B), in anti-BCMA CAR-expressing T cells generated from 4
different donors
(Donors 1-4), stimulated with BCMA-conjugated beads, for 24 hours (24 hr +
stim) or 7 days
(d7 + stim), or cultured without stimulation for 24 hours (24 hr), in the
presence or absence of
lenalidomide.
[0089] FIGS. 8A and 8B show volcano plots depicting statistical significance
of expression
(logio of adjusted p-value) with the 10g2 fold-change in gene expression, in
CAR+ T cells
stimulated with BCMA-conjugated beads, for 24 hours (24 hr + stim, FIG. 8A) or
7 days (d7 +
stim, FIG. 8B), in the presence or absence of lenalidomide. The tables
indicate the number of
genes or peaks that showed increase (up) or decrease (down) in expression.
[0090] FIGS. 8C and 8D show volcano plots depicting statistical significance
of change in
chromatin accessibility (logio of adjusted p-value) with the 10g2 fold-change
in chromatin
accessibility, in CAR+ T cells stimulated with BCMA-conjugated beads, for 24
hours (24 hr +
stim, FIG. 8C) or 7 days (d7 + stim, FIG. 8D). The tables indicate the number
of genes or
peaks that showed increase (up) or decrease (down) in accessibility.
[0091] FIGS. 9A and 9B depict directionality and significance of the effects
on biological
pathways, in CAR+ T cells stimulated with BCMA-conjugated beads, for 24 hours
(24 hr +
stim, FIG. 9A) or 7 days (d7 + stim, FIG. 9B).
[0092] FIG. 10 shows a plot comparing individual chromatin accessibility peaks
(diamond)
and the mean chromatin accessibility changes for each gene (circle), with the
gene expression
changes, for selected genes involved in T cell activation and signaling.
[0093] FIG. 11 shows motif enrichment analysis, enrichment log p-value,
prevalence and
transcription factors predicted to bind the motifs for peaks with increased
accessibility in the
presence of lenalidomide in day 7 cultures.
[0094] FIGS. 12A and 12B show exemplary chromatin accessibility profiles on
exemplary
immune genes (e.g., cell surface markers CD3c, CD8a, CD8b and CD4) in
different
17
CA 03049461 2019-07-04
WO 2018/132518 PCT/US2018/013227
cryopreserved CD4+ or CD8+ engineered cell compositions (CDP) or matched
samples that had
not been subjected to engineering (CMAT); in some cases, CMAT samples were
separated by
phenotype as naïve T cells (TN), central memory T cells (Tcm), effector and
effector memory T
cells (TE Em) or effector memory RA (TEmRA).
[0095] FIG. 13A shows exemplary chromatin accessibility peak profiles in the
coding
region and the intergenic region near the CCR7 gene was compared in
CD27+CCR7+,
CD27+CCR7- and CD27-CCR7- cells, and bulk CD8+ cells. FIG. 13B shows the
distribution
of accessibility peaks within various genomic locations for the CD27+CCR7+,
CD27+CCR7-
and CD27-CCR7- cells, and bulk CD8+ cells, including within intergenic, intron
and promoter
regions of genes.
[0096] FIG. 14A shows the number of overall chromatin accessibility peaks,
called using
MACS2, and the number of nucleosome free regions, determined using NucleoATAC,
in CD4+
and CD8+ CDP cells, from subjects who had been administered engineered CAR-T
cells,
grouped by response outcomes (1 month CR, 3 month CR, 1 month PD, 3 month PD,
or PR).
[0097] FIGS. 14B-14D show exemplary differential accessibility peak profiles
and
quantitation for accessibility peaks at genomic regions near two exemplary
immune-related
genes (gene 1: FIG. 14B and gene 2: FIG. 14C) in subjects achieving a PD at 3
months,
compared to subjects who achieved CR at 3 months. FIG. 14D shows a
quantitation of the
peaks from subjects who had been administered engineered CAR-T cells, grouped
by response
outcomes (1 month CR, 3 month CR, 1 month PD, 3 month PD, or PR).
[0098] FIG. 15A shows the scaled number of integrants (calculated as (aligned
reads x read
length) / (construct size)) of viral vector sequences encoding an anti-CD19
CAR, in
cryopreserved engineered cell compositions (CDP) engineered to express a CAR
or matched
samples that had not been subjected to engineering (CMAT). FIG. 15B shows a
receiver
operating characteristic (ROC) curve was generated by plotting the true
positive rate against the
false positive rate, for cells transduced with a vector encoding the anti-CD19
CAR (CAR
integrants) and cells transduced with an empty viral vector (empty
integrants).
[0099] FIG. 16A shows the number of ATACseq reads mapped to CAR sequence, in
CDP
and CMAT samples. FIG. 16B shows a plot of the number of integrants as
determined using
ATAC-seq compared to the vector copy number (VCN) as determined by
quantitative
polymerase chain reaction (qPCR), in engineered cells.
[0100] FIGS. 17A and 17B show the VCN (FIG. 17A) and the number of integrants
as
determined using ATAC-seq (FIG. 17B) in anti-CD19 CAR+ CD4+ and CD8+ T cells
subjects
18
CA 03049461 2019-07-04
WO 2018/132518 PCT/US2018/013227
who had been administered engineered CAR-T cells, grouped by response outcomes
(1 month
CR, 3 month CR, 1 month PD, 3 month PD, or PR) (excludes normal donor
samples).
[0101] FIG. 18 shows the number of unique integration sites assessed by
mapping
discordant read pairs across 50,000 cells of unknown clonality, in CD4+ and
CD8+ CDP cells
from subjects grouped by response outcomes (1 month CR, 3 month CR, 1 month
PD, 3 month
PD, or PR) (excludes normal donor samples).
[0102] FIG. 19A shows exemplary chromatin accessibility peak profile was
assessed across
the loci encoding T cell receptor beta variable (TRBV) regions in different
CD8+ CMAT cell
samples from 7 exemplary subjects. FIG. 19B shows the overall TCR
accessibility and %
coefficient of variation (CV) in the CD8+ CDP samples in ND or subjects who
achieved CR or
PD. FIG. 19C shows the overall relative TCR accessibility in CD8+ anti-CD19
CAR+ T cells
from subjects having received administration of anti-CD19 CAR+ T cells that
achieved CR, PR
or PD.
[0103] FIG. 20A shows a volcano plots depicting statistical significance of
chromatin
accessibility (logio of adjusted p-value) with the 10g2 fold-change in
chromatin accessibility,
from a differential accessibility analysis for CDP and CMAT from T cells
isolated from three (3)
healthy donors. The tables indicate the number of genes or peaks that showed
increase (up) or
decrease (down) in accessibility.
[0104] FIGS. 20B and 20C shows promoter accessibility (counts frips) at
exemplary
individual promoters of genes in the "cytokines" module (FIG. 20B) and the
"exhaustion"
module (FIG. 20C), from a gene module analysis of immune related genes.
[0105] FIG. 21 shows the relative accessibility at ratio of accessibility at
CD8A promoter to
accessibility at CD4 promoter in CD4+ and CD8+ cell populations.
[0106] FIG. 22A shows a volcano plot showing the 1og2 fold change and adjusted
p-value
for peaks with higher or lower accessibility, in subjects with progressive
disease (PD) compared
to subjects who achieved complete response (CR), as the best overall response
(BOR), durable
response at 3 months (3M0) or durable response at 6 months (6M0) . The tables
indicate the
number of genes or peaks that showed increase (up) or decrease (down) in
accessibility. The
number of subjects in the CR or PD group are shown on the upper left hand side
of each graph.
[0107] FIG. 22B shows the fold change and adjusted p-value for peaks with
higher or lower
accessibility, in subjects who developed grade 3-5 neurotoxicity (Ntx),
compared to subjects
with grades 0-2 Ntx, or grades 2-5 cytokine release syndrome (CRS) compared to
subjects with
grades 0-1 CRS, with the corresponding number of peaks that were
differentially present in the
19
CA 03049461 2019-07-04
WO 2018/132518 PCT/US2018/013227
samples. The tables indicate the number of genes or peaks that showed increase
(up) or decrease
(down) in accessibility. The number of subjects with each grade of the
toxicity are shown on
the upper left hand side of each graph.
[0108] FIGS. 23A and 23B show volcano plots showing peaks with higher or lower
accessibility, in subjects based on response groups, for CDP (FIG. 23A) or
CMAT (FIG. 23B).
FIGS. 23A and 23B show volcano plots showing peaks with higher or lower
accessibility, in
subjects based on neurotoxicity (Ntx) or cytokine release syndrome (CRS), for
CDP (FIG. 23C)
or CMAT (FIG. 23D).
[0109] FIG. 24A shows the number of identified peaks with FDR < 0.1 and FIG.
24B
shows enrichment as indicated by FRiPs, in the CD8+ CDP and CMAT samples using
modified
or standard ATAC-seq, with 3 technical replicates.
Detailed Description
I. METHODS FOR ASSESSING EPIGENETIC STATE OF CELLS
[0110] Provided are methods for determining an epigenetic profile or signature
for one more
genomic regions of a cell or a cell composition, including cell compositions
containing primary
cells, e.g. T cells, derived from a subject for use in connection with
adoptive cell therapy. In
some embodiments, the cell compositions include compositions in connection
with
manufacturing or engineering a cell therapy, including compositions prior to
and subsequent to
engineering of cells with a recombinant receptor, e.g. a chimeric antigen
receptor (CAR). In
some aspects, the epigenetic profile or signature and/or one or more
epigenetic properties of
genomic region(s) of a cell or a cell composition can provide information
about certain features
or properties of the cells, including those associated with a phenotype,
activation state and/or
function of the cell or cell composition and/or indicative of, associated
with, correlated with
and/or predictive of one or more outcomes of treatment with a cell therapy.
These methods are
based on observations that epigenetic properties, such as chromatin
accessibility, of certain
genes or genomic regions permits detailed, exquisite and/or comprehensive
tracking of features
and properties of a cell composition that is not possible with other systems,
such as methods that
rely on transcription, e.g. RNA sequencing. In some aspects, such epigenetic
properties are
found to correlate with outcomes, such as disease outcomes, response outcomes,
toxicity
outcomes and/or phenotype, persistence, activity and/or function of cells.
Such correlations are
CA 03049461 2019-07-04
WO 2018/132518 PCT/US2018/013227
not, in certain aspects, observed using existing methods of analysis, such as
methods to assess
transcription, protein expression and/or by intracellular staining.
[0111] Provided are methods for identifying genomic region(s) that are
indicative of,
associated with, correlated with, and/or predictive of an outcome, such as an
outcome for
treatment with a cell therapy, based on epigenetic properties of genomic
region(s) and/or as
determined from an epigenetic profile for one or more genomic regions. Also
provided are
methods of assessing cell compositions or cell culture compositions for
adoptive cell therapy,
based on epigenetic properties of particular genomic region(s).
[0112] The provided methods can be used to identify genomic region(s) that are
predictive
of outcomes of treatment before administration of the adoptive cell therapy.
Provided herein
are methods of identifying one or more genomic region(s) predictive of an
outcome of treatment
with a cell therapy. The provided methods can be used to identify an
epigenetic profile that is
indicative of, associated with, correlated with, and/or predictive of
particular outcomes or
properties of adoptive cell therapy, e.g., with a desired response and/or
safety outcome. In some
embodiments, the provided methods can be used to assess one or more properties
or features of
cells or cell compositions, prior to administration, e.g., by comparing the
epigenetic profile to
that of another sample, and/or to a reference profile. In some embodiments,
the method includes
analyzing or determining an epigenetic property of one or more genomic regions
of a cell or a
population of cells, said cell or population contained in a first composition
of cells to be
genetically engineered with a recombinant receptor to produce a second
composition containing
the recombinant receptor, or a second composition of cells containing the
recombinant receptor;
and identifying one or more of said one or more genomic regions, of which the
epigenetic
property, overall across the one or more genomic regions, predicts, indicates
or correlates with
an outcome of a cell therapy, said cell therapy including administering the
second composition
of cells containing the recombinant receptor.
[0113] In some embodiments, the provided methods can be used to measure or
quantitate an
epigenetic property, such as chromatin accessibility, of genomic regions,
e.g., one or more
genomic loci, and/or a gene or genes, such as a panel of genes, to provide
information about the
features or characteristics of cells used in connection with a cell therapy,
e.g., CAR+ T cell
therapy, including features or characteristics predictive of response to a
cell therapy or that are
indicative of a desired cell phenotype or function. In some aspects, the
provided methods can be
used in connection with optimizing or improving cell therapies, including by
improving
21
CA 03049461 2019-07-04
WO 2018/132518 PCT/US2018/013227
outcomes of the therapy, e.g., response and/or safety outcomes after
administration of the cell
therapy and/or the quality of the cell therapy.
[0114] In some cases, this is an advantageous over existing methods and cell
therapies, since
responses can be difficult to predict, optimal dosing can be difficult to
determine and/or the
quality of a cell therapy can be variable. The provided methods can be used to
provide better
information about the features and characteristics of the engineered cells for
adoptive cell
therapy prior to administration, such that optimal dosing can be easily and
rapidly determined,
for increased efficacy and safety of the cell therapy. The provided methods
also can be used to
identify or characterize cells in connection with manufacturing or engineering
a cell therapy,
including in connection with the effects of various process parameters (e.g.
temperature, culture
conditions and other parameters) that can or may affect the phenotype,
activity, persistence or
function of cells.
[0115] In some embodiments, the provided methods can be used for identifying
one or more
genomic region(s) predictive of an outcome of treatment with a cell therapy,
the method
including (a) determining or measuring a level or degree or relative level or
degree of an
epigenetic property of one or more genomic regions for a cell or a population
of cells contained
in a first therapeutic composition; (b) determining or measuring a level or
degree or relative
level or degree of said epigenetic property of said one or more genomic
regions for a cell or a
population of cells contained in second therapeutic composition; and (c)
comparing the level or
degree in (a) and the level or degree in (b) for one or more of the genomic
regions.
[0116] In some embodiments, the provided methods can be used for assessing a
cell
composition for administration to a subject, including analyzing an epigenetic
profile of one or
more genomic regions of a cell in a cell composition containing cells
engineered with a
recombinant receptor; and comparing the epigenetic profile for each genomic
region,
individually, to a reference profile, wherein the comparison indicates whether
the population of
cells is or is likely to exhibit or produce an outcome when administered to a
subject. In some
embodiments, the provided methods of assessing a cell culture includes
analyzing an epigenetic
profile of one or more genomic regions of a cell contained in an output cell
composition, said
output composition produced by culturing an input composition in the presence
of one or more
test agents or conditions; and comparing the epigenetic profile for each
genomic region,
individually, to a reference profile, wherein the comparison indicates whether
the cell is or is
likely to exhibit a predetermined phenotype, persistence, activity and/or
function.
22
CA 03049461 2019-07-04
WO 2018/132518 PCT/US2018/013227
[0117] In some embodiments, the provided methods can be used to assess state,
quality,
consistency, phenotype, clonality, uniformity, characteristics and/or property
of cells for cell
therapies; to select cells or cell compositions that are indicative of,
associated with, correlated
with, and/or predictive of particular outcomes or properties of adoptive cell
therapy, e.g., with a
desired response and/or safety outcome; and/or to modify or alter the dose,
types of cells and/or
one or more steps or parameters of the engineering process, such that the cell
composition for
administration can be optimized or improved, based on assessment of the
epigenetic properties.
[0118] In some aspects, the provided methods can be used to determine the
state, quality,
consistency, phenotype, clonality, uniformity, characteristics and/or property
of the cells, e.g.,
cells for adoptive cell therapy. In some aspects, the provided methods can be
used for cells at
one or more stages of engineering, or cell compositions obtained from the
subjects before
engineering, for purified or selected cell sub-populations at various stages,
or cells obtained
from the subject after administration of the engineered cells. In some
aspects, the methods can
be used to assess the state, quality, consistency, phenotype, clonality,
uniformity, characteristics
and/or property of the cells prior to administration to the subjects, and the
results from the
analysis methods can be used to select subjects for treatment, determine a
treatment regimen,
including dosing and frequency and/or additional treatment, and/or modify or
change the
engineering or manufacturing process to obtain a more desirable cell
composition for
administration. In some embodiments, the methods can be used to obtain more
uniform and
predictively potent cell compositions for administration for increased
efficacy and/or reduced
adverse effects. In some aspects, the provided methods can be used in
combination or in
conjunction with other methods or assays to characterize the cells in the cell
population, e.g.,
assays to determine cell surface marker expression, persistence, viability
and/or expansion of
cells, to determine any correlation to such characteristics and/or phenotypes.
[0119] In some embodiments, various changes may be made and equivalents may be
substituted in the various embodiments. In addition, many modifications may be
made to adapt a
particular situation, material, composition of matter, process, process act(s)
or step(s) to the
objective(s), spirit or scope of the various embodiments. In some embodiments,
each of the
individual variations described and illustrated herein has discrete components
and features that
may be readily separated from or combined with the features of any of the
other several
embodiments without departing from the scope or spirit of the various
embodiments. All such
modifications are intended to be within the scope of claims associated with
this disclosure.
23
CA 03049461 2019-07-04
WO 2018/132518 PCT/US2018/013227
II. EPIGENETIC/EPIGENOMIC ANALYSIS
[0120] In any of the provided methods, the epigenetic and/or epigenomic
analysis can
include steps to assess, characterize and analyze changes or modifications in
a gene locus, a
plurality of gene loci or genomic loci, a genomic region and/or a genome, such
as chromatin
accessibility, nucleosome occupancy, histone modification, spatial chromosomal
conformation,
transcription factor occupancy and/or DNA methylation.
[0121] In some aspects, the one or more genomic regions include a genomic
locus or a gene.
In some aspects, a genomic locus includes a fixed position in the genome, and
can include a
coding region, an open reading frame of a gene, a non-coding region, an
intergenic region or a
regulatory element. In some embodiments, one or more genomic regions, loci,
elements or
intervals include coding regions, non-coding regions, intergenic regions,
introns, exons,
proximal and distal cis-regulatory regions, promoter regions, enhancer
regions, upstream
activating sequences (UAS), untranslated regions of a transcript (UTR, e.g.,
3'UTR or 5' UTR),
non-coding RNA producing regions, non-coding RNA (ncRNA) genes (e.g., miRNA,
siRNA,
piRNA, snoRNA or lncRNA), ribosomal RNA (rRNA) genes, small RNA binding sites,
non-
coding RNA binding sites, pseudogenes, transcription termination sites (TTS),
repeats, telomeric
regions and/or accessible or non-accessible regions (e.g., open chromatin
and/or
heterochromatin).
[0122] In some embodiments, the provided methods involve one or more
epigenetic and/or
epigenomic analysis step. In some embodiments, the analysis includes a large-
scale analysis,
e.g., analysis of a plurality of genomic regions, genomic loci, genetic loci
or a genome-wide
analysis. In some embodiments, the epigenetic and/or epigenomic analysis
includes determining
the epigenetic properties, state, and/or profile of a cell, e.g., an
engineered cell for cell therapy.
In some embodiments, the provided methods involve determining the
epigenetic/epigenomic
properties, state and/or profile of cells or a population or composition of
cells. In some
embodiments, the methods can involve the use of sequencing, such as large-
scale sequencing,
e.g., high throughput sequencing or next generation sequencing, to assess the
epigenetic/epigenomic property, state and/or profile of cells or cell
compositions. In some
embodiments, the methods involve aligning and/or filtering the sequences
obtained from the
assay and/or mapping the sequences to a genome, such as a reference genome. In
some aspects,
the methods involve determining genomic regions, loci and/or interval where
sequences are
24
CA 03049461 2019-07-04
WO 2018/132518 PCT/US2018/013227
mapped, such as determining the peaks of sequence reads that are mapped to a
particular region,
locus and/or interval of the genome.
[0123] In some embodiments, the provided methods also involve analyzing the
epigenetic/epigenomic properties and/or profile, e.g., by comparing the
epigenetic/epigenomic
properties and/or profile of a particular cell or cell composition to those of
another cell or cell
composition. In some embodiments, the provided methods involve various
downstream steps or
processes for analysis or comparison, e.g., computationally implemented steps,
and/or
applications of the methods, for assessing one or more properties or
characteristics of cells or
cell compositions.
[0124] In some aspects, exemplary methods for determining or assessing the
epigenetic/epigenomic properties, state and/or profile, e.g., using assays
such as ATAC-seq, and
analysis and/or application thereof, can involve one or more of the following
steps: 1) generating
ATACseq library; 2) trimming and mapping reads; 3) removing duplicate reads;
4) filtering
mitochondrial contamination; 5) filtering for non-nucleosomal fragments; 6)
calling accessibility
peaks; 7) assembling consensus peak set; 8) counting reads in peaks; 9)
clustering samples;
and/or 10) performing differential accessibility analysis. In some
embodiments, exemplary
epigenetic and/or epigenomic analysis includes assessment of the state of the
chromatin, e.g.,
chromatin accessibility, openness or compaction. In some embodiments of the
provided
methods, epigenetic and/or epigenomic analysis includes assessing chromatin
accessibility. In
some embodiments, chromatin accessibility analysis is coupled to a step for
large-scale
sequencing, e.g., high throughput sequencing or next generation sequencing. In
some
embodiments, the method for assessing chromatin accessibility includes
assessment of
nucleosome occupancy, histone modification and/or transcription factor
occupancy. In some
embodiments, chromatin accessibility is determined using DNA insertion
elements, DNA-
modifying enzymes (e.g., DNase or MNase), and/or antibodies, including
fragments thereof.
Exemplary assays for epigenetic and/or epigenomic analysis include chromatin
immunoprecipitation coupled to high-throughput sequencing (ChIP-seq) to
identify protein
binding sites of a genome, bisulfite sequencing to determine DNA methylation
at base-pair
resolution, DNaseI-Seq, Assay for Transposase Accessible Chromatin with high-
throughput
sequencing (ATAC-seq) to assess open chromatin, and chromosome conformation
capture (3C)
and related methods, such as chromosome conformation capture-on-chip (4C),
chromosome
conformation capture carbon copy (5C), Hi-C, 3C-Seq (3C with high-throughput
sequencing),
4C-Seq, 5C-Seq and HiC-Seq to determine the spatial organization of
chromosomes. In some
CA 03049461 2019-07-04
WO 2018/132518 PCT/US2018/013227
embodiments, the epigenetic and/or epigenomic analysis includes formaldehyde
assisted
isolation of regulatory elements with high-throughput sequencing (FAIRE-seq).
A. Determining Epigenetic/Epigenomic Profile
[0125] In some embodiments of the provided methods, epigenetic and/or
epigenomic
analysis, such as determining the epigenetic/epigenomic properties, state
and/or profile, includes
assessing chromatin accessibility, of genomic regions, loci and/or intervals
and/or at a genome-
wide level, e.g., throughout a large portion or the entire genome. In some
aspects, an
epigenetic/epigenomic profile is determined, based on epigenetic/epigenomic
properties at one
or more genomic regions, loci and/or intervals, and/or at the genome-wide
level, of particular
cells or cell compositions.
[0126] In some embodiments of any of the methods of analysis provided herein,
a computer
system is used to execute one or more steps, functions, processes or scripts.
In some
embodiments, the computer system is integrated into and is part of an analysis
system, e.g., a
liquid handler, a bridge amplification system (e.g. an 11lumina cBot), and/or
a sequencing system
(e.g. an Illumina Genome Analyzer, HiSeq, or MiSeq system). In some
embodiments, the
computer system is connected to or ported to an analysis system.
I. Chromatin Accessihility Assessment using- ATAC-seg
[0127] In some embodiments, the chromatin accessibility is assessed using a
DNA insertion
element coupled to a high-throughput sequencing method. In some embodiments,
chromatin
accessibility is assessed using ATAC-seq, for example, such as the methods
described in
US20160060691, which incorporated by reference in its entirety, and any
variations of the
methods therein. In some embodiments, exemplary assays for epigenetic and/or
epigenomic
analysis include those described in, e.g., W02015102536, W02015159295,
W02015130968,
W0201692070, Dirks et al. Clinical Epigenetics (2016) 8:122, Buenrostro et
al., Nat Methods.
(2013) 10(12): 1213-1218, Sung et al., Nat Methods. (2016) 13(3): 222-228,
which are
incorporated by reference in their entirety. In some embodiments, chromatin
accessibility
assays such as ATAC-seq have advantages such as simplicity of library
preparation, short assay
timing (results can be obtained within hours, compared to 3-4 days required
for certain assays),
no requirement for sonication or phenol-chloroform extractions, no requirement
for antibodies
(eliminating limitations and biases that can be introduced by antibodies), no
requirement for
sensitive enzymatic digestion (eliminating laborious and sensitive enzymatic
titrations),
requiring only a very small number of cells as input, and a wide dynamic
range. In some
26
CA 03049461 2019-07-04
WO 2018/132518 PCT/US2018/013227
embodiments, chromatin accessibility assays such as ATAC-seq have advantages
such as
providing a more accurate and predictive assessment of the state, quality,
consistency,
phenotype, characteristics and/or property of the cells (e.g., state of
chromatin accessibility
throughout the genome) in a composition in a single assay and/or at a single
time point, without
the requirement of assessing other parameters, such as RNA or protein
expression levels,
separately.
[0128] In some aspects, determining or assessing the epigenetic/epigenomic
properties, state
and/or profile, e.g., using assays such as ATAC-seq, involve one or more of
the following steps:
(a) chromatin isolation; (b) tagmentation; (c) sequencing; (d) sequence
mapping; and/or (e) peak
determination. In some aspects, determining or assessing the
epigenetic/epigenomic properties,
state and/or profile, e.g., using assays such as ATAC-seq, involve one or more
of the following
steps: (1) isolating chromatin from the cells or the population of cells, (2)
treating the chromatin
with an insertional enzyme complex to generate tagged fragments of genomic
DNA, (3)
sequencing all or a portion of the tagged fragments to produce a plurality of
sequence reads; (4)
aligning, filtering and mapping the sequence reads to genomic regions of a
genome; and/or (5)
determining peaks of sequence reads in a plurality of genomic regions for each
cell or
population of cells.
[0129] In some embodiments, the assay for assessing chromatin accessibility,
e.g., ATAC-
seq, involves one or more of the following steps: (i) washing and lysing
cells; (ii) tagmentation;
(iii) DNA cleanup; (iv) PCR pre-amplification; (v) quantitative PCR (qPCR)
amplification; (vi)
PCR n-amplification; (vii) DNA cleanup; (viii) library generation and (ix)
sequencing. In some
embodiments, assays or steps for quality control are also performed. Exemplary
steps for library
generation and/or quality control include one or more of the following: (i)
genomic DNA
isolation and assessment; (ii) size selection to remove residual primers
(e.g., using 2% agarose);
(iii) DNA cleanup; (iv) qPCR; (v) DNA quantitation; and (vi) dilution and
pooling of library. In
some embodiments, the libraries generated from the sample are sequenced using
high-
throughput or next-generation sequencing. In some embodiments, the number of
cells required
for the methods provided herein is tested using a series of cell dilutions,
e.g., samples containing
different cell concentrations or cell numbers.
[0130] In some embodiments, other parameters or metrics can be used to
determine the
quality of the sample and the data when performing one or more steps of the
method. In some
embodiments, parameters or metrics used to determine quality of the samples
and the data
include number of mapped reads per sample, percentage alignment to the genome
of the subject
27
CA 03049461 2019-07-04
WO 2018/132518 PCT/US2018/013227
(e.g., human genome), percentage of non-redundant reads, number of unique
reads, recovery of
known peaks (positive control), qPCR amplification to assess proper
tagmentation, nucleosome
band assessment of genomic DNA, and/or correlation between repeats or
different dilutions.
[0131] In some embodiments, the assay for assessing chromatin accessibility,
e.g., ATAC-
seq, comprises: treating chromatin isolated from a population of cells with an
DNA insertion
element, e.g., an insertional enzyme complex to produce tagged fragments of
genomic DNA. In
this step, the chromatin is tagmented (i.e., cleaved and tagged in the same
reaction) using an
insertional enzyme such as Tn5 or MuA that cleaves the genomic DNA in open
regions in the
chromatin and adds adaptors to both ends of the fragments. Methods for
tagmenting isolated
genomic DNA are known in the art (see, e.g., Caruccio Methods Mol. Biol. 2011
733: 241-55;
Kaper et al, Proc. Natl. Acad. Sci. 2013 110: 5552-7; Marine et al, Appl.
Environ. Microbiol.
2011 77: 8071-9 and US20100120098) and are commercially available, e.g., from
11lumina (San
Diego, Calif.). Such systems may be readily adapted for use herein. In some
cases, the
conditions may be adjusted to obtain a desirable level of insertion in the
chromatin (e.g., an
insertion that occurs, on average, every 50 to 200 base pairs in open
regions).
[0132] The chromatin used in the assay, e.g., chromatin, which can contain
genomic DNA,
histones and/or other chromatin-associated factors, from cells, e.g., cells
obtained from a
subject, may be made by any suitable method. In some embodiments, nuclei may
be isolated,
lysed, and the chromatin may be further purified, e.g., from the nuclear
envelope. In some
embodiments, the chromatin may be isolated by contacting isolated nuclei with
the reaction
buffer. In some embodiments, the isolated nuclei may lyse when it makes
contact with the
reaction buffer (which comprises insertional enzyme complexes and other
necessary reagents),
which allows the insertional enzyme complexes access to the chromatin. In some
embodiments,
the assay includes isolating nuclei from a population of cells; and combining
the isolated nuclei
with the transposase and adaptors, wherein the combining results in both lysis
of the nuclei to
release said chromatin and production of the adaptor-tagged fragments of
genomic DNA.
[0133] After the chromatin has been fragmented and tagged to produce tagged
fragments of
genomic DNA, at least some of the adaptor tagged fragments are sequenced to
produce a
plurality of sequence reads. The fragments may be sequenced using any know
sequencing
method, e.g., a next-generation or high-throughput sequencing method. For
example, the
fragments may be sequenced using Illumina's reversible terminator method,
Roche's
pyrosequencing method (454), Life Technologies' sequencing by ligation (the
SOLiD platform)
or Life Technologies' Ion Torrent platform. Examples of such methods are
described, for
28
CA 03049461 2019-07-04
WO 2018/132518 PCT/US2018/013227
example, in Margulies et al., Nature 2005 437: 376-80; Ronaghi et al.,
Analytical Biochemistry
1996 242: 84-9; Shendure et al., Science 2005 309: 1728-32; Imelfort et al.,
Brief Bioinform.
2009 10:609-18; Fox et al., Methods Mol Biol. 2009;553:79-108; Appleby et al.,
Methods Mol
Biol. 2009;513:19-39 and Morozova et al., Genomics. 2008 92:255-64, which are
incorporated
by reference. Forward and reverse sequencing primer sites that are compatible
with a selected
next generation sequencing platform can be added to the ends of the fragments
during the
amplification step. In some embodiments, the fragments may be amplified using
PCR primers
that hybridize to the tags that have been added to the fragments, where the
primer used for PCR
have 5' tails that are compatible with a particular sequencing platform. In
some cases, the
primers used may contain a molecular barcode (an "index") so that different
pools can be pooled
together before sequencing, and the sequence reads can be traced to a
particular sample using
the barcode sequence.
[0134] In some aspects, the assay includes determining accessibility of a
nucleic acid at a
site, wherein the nucleic acid is from a cell sample, said assay comprising:
inserting a plurality
of molecular tags with an insertional enzyme into the nucleic acid and using
the molecular tags
to determine accessibility at the site. The cell sample can be from a primary
source, e.g., a cell
from a subject. In some embodiments, the cell sample includes cells from a
subject that are
selected and/or engineered or modified, e.g., engineered to express a
recombinant receptor. The
cell sample may consist of a single cell. The cell sample may consist of a
finite number of cells
(e.g. less than about 500,000 cells).
[0135] In some embodiments, the assay further includes the determined
accessibility to
identify one or more proteins that are bound to the nucleic acid and/or
chromatin at a particular
locus. In some embodiments, at least one of the proteins is a transcription
factor. Additionally,
the assay can comprise using the molecular tags to generate an accessibility
map of the nucleic
acid.
[0136] The nucleic acid may be fragmented into a plurality of fragments during
the insertion
of the molecular tags. In some embodiments, the fragments may be amplified. In
some
embodiments, the fragments can be sequenced to generate a plurality of
sequencing reads. This
may be used to determine the accessibility of the nucleic acid at any given
site. The fragments
may be sequenced using a high-throughput sequencing technique. In some
embodiments, the
sequencing reads can be normalized based on the sequence insertion preference
of the
insertional enzyme. The length of the sequenced reads can be used to determine
a chromatin
state annotation.
29
CA 03049461 2019-07-04
WO 2018/132518 PCT/US2018/013227
[0137] The nucleic acid can be bound to a plurality of association molecules.
The
association molecules can be, for example, proteins, nucleic acids or
saccharides. In some
embodiments, the association molecules can comprise histones. In other cases,
the association
molecules can comprise aptamers.
[0138] The insertional enzyme can be any enzyme capable of inserting a nucleic
acid
sequence into a nucleic acid. In some embodiments, the insertional enzyme can
insert the
nucleic acid sequence into the nucleic acid in a substantially sequence-
independent manner. The
insertional enzyme can be prokaryotic or eukaryotic. Examples of insertional
enzymes include,
but are not limited to, transposases, HERMES, and HIV integrase. The
transposase can be a Tn
transposase (e.g. Tn3, Tn5, Tn7, Tn10, Tn552, Tn903), a MuA transposase, a
Vibhar
transposase (e.g. from Vibrio harveyi), Ac-Ds, Ascot-1, Bsl, Cin4, Copia,
En/Spm, F element,
hobo, Hsmarl, Hsmar2, IN (HIV), IS1, IS2, IS3, IS4, IS5, IS6, IS10, IS21,
IS30, IS50, IS51,
IS150, IS256, IS407, IS427, IS630, IS903, IS911, IS982, IS1031, ISL2, Li,
Mariner, P element,
Tam3, Tcl, Tc3, Tel, THE-1, Tn/O, TnA, Tn3, Tn5, Tn7, Tn10, Tn552, Tn903,
Toll, To12,
Tn10, Tyl, any prokaryotic transposase, or any transposase related to and/or
derived from those
listed above. In some embodiments, the transposase is a Tn5 transposase or a
derivative thereof.
[0139] In some instances, a transposase related to and/or derived from a
parent transposase
can comprise a peptide fragment with at least about 50%, 55%, 60%, 65%, 70%,
75%, 80%,
85%, 90%, 91%, 92%, 93%, 94%, 95%, 96%, 97%, 98%, or 99% amino acid sequence
homology to a corresponding peptide fragment of the parent transposase. The
peptide fragment
can be at least about 10, 15, 20, 25, 30, 35, 40, 45, 50, 60, 70, 80, 90, 100,
150, 200, 250, 300,
400, or 500 amino acids in length. For example, a transposase derived from Tn5
can comprise a
peptide fragment that is 50 amino acids in length and 80% homologous to a
corresponding
fragment in a parent Tn5 transposase. In some embodiments, the insertion can
be facilitated
and/or triggered by addition of one or more cations. The cations can be
divalent cations such as,
for example, Ca2 , Mg2+ and Mn2 .
[0140] The molecular tags can comprise sequencing adaptors, locked nucleic
acids (LNAs),
zip nucleic acids (ZNAs), RNAs, affinity reactive molecules (e.g. biotin,
dig), self-
complementary molecules, phosphorothioate modifications, azide or alkyne
groups. In some
embodiments, the sequencing adaptors can further comprise a barcode label.
Further, the
barcode labels can comprises a unique sequence. The unique sequences can be
used to identify
the individual insertion events. Any of the tags can further comprise
fluorescence tags (e.g.
fluorescein, rhodamine, Cy3, Cy5, thiazole orange).
CA 03049461 2019-07-04
WO 2018/132518 PCT/US2018/013227
[0141] Additionally, the insertional enzyme can further comprise an affinity
tag. In some
embodiments, the affinity tag can be an antibody. The antibody can bind to,
for example, a
transcription factor, a modified nucleosome or a modified nucleic acid.
Examples of modified
nucleic acids include, but are not limited to, methylated or hydroxymethylated
DNA. In other
cases, the affinity tag can be a single-stranded nucleic acid (e.g. ssDNA,
ssRNA). In some
examples, the single-stranded nucleic acid can bind to a target nucleic acid.
In further cases, the
insertional enzyme can further comprise a nuclear localization signal.
[0142] In some embodiments, the cells, e.g., cells derived from subjects, can
be
permeabilized to allow access for the insertional enzyme. The permeabilization
can be
performed in a way to minimally perturb the nuclei in the cell sample. In some
instances, the cell
sample can be permeabilized using a permeabilization agent. Examples of
permeabilization
agents include, but are not limited to, NP40, digitonin, tween, streptolysin,
and cationic lipids. In
other instances, the cell sample can be permeabilized using hypotonic shock
and/or
ultrasonication. In other cases, the insertional enzyme can be highly charged,
which may allow it
to permeabilize through cell membranes.
[0143] In some embodiments, the methods include steps for aligning, mapping
and/or
analyzing large-scale data generated from the assays, e.g. high-throughput
sequencing data. In
some embodiments, analysis of the generated data include one or more steps of
alignments,
fixing read mates, removing PCR duplicates, filtering to mapped reads and
quality reads and/or
filtering out mitochondrial sequences and/or peak calling; and can further
include further
analysis or application steps, including nucleosome positioning, transposon
insertion sites,
genome browser visualizations, differential accessibility analysis, motif
enrichment, gene
ontology (GO) enrichment and/or determining transcription factor occupancy. In
some
embodiments, other processing steps include de-multiplexing raw data, aligning
and filtering,
and assessing quality metrics.
[0144] In some aspects, the methods include steps for aligning, filtering and
mapping the
sequence reads to genomic regions of a genome. In some aspects, the methods
include steps for
determining peaks of sequence reads in a plurality of genomic regions for each
cell or
population of cells. In some embodiments, any of the methods provided herein
further include
one or more steps, functions, processes or scripts for aligning, filtering
and/or mapping sequence
results obtained from one or more steps, functions, processes or scripts of
the methods provided
herein, e.g., sequences obtained from the epigenetic analysis. In some
embodiments, the
methods include steps, functions, processes or scripts that are performed
computationally, e.g.,
31
CA 03049461 2019-07-04
WO 2018/132518 PCT/US2018/013227
performed using one or more computer programs and/or via the use of
computational
algorithms. In some embodiments, also provided are computer systems, computer
readable
instructions, software, systems and/or devices for carrying out or performing
one or more steps
of the methods provided herein. In some embodiments, any of the further
analysis and/or
application steps, such as any described herein, can be performed
computationally, e.g.,
performed using one or more computer programs and/or via the use of
computational
algorithms.
[0145] In some embodiments, the methods involve identification, alignment,
filtering,
processing, mapping and/or analysis of the sequences obtained from one or more
steps of the
methods provided herein, e.g., sequence data obtained from the chromatin
accessibility analysis,
e.g., using ATAC-seq. In some embodiments, identification, alignment,
filtering, processing,
mapping and/or analysis of the sequences includes procedures for sequence
manipulation and
alignment procedure used to obtain peaks of signal and/or for performing
further analysis and/or
application, e.g., identify one or more genomic region(s) in the methods
described herein. In
some embodiments, the identification, alignment, filtering, processing,
mapping and/or analysis
of the sequences and/or for performing further analysis and/or application
includes any one or
more of the exemplary steps, functions, processes or scripts, described
herein, sequentially or
simultaneously in any order. In some aspects, any of the steps and/or
procedures for
identification, alignment, filtering, processing, mapping and/or analysis of
the sequences and/or
for performing further analysis and/or application can be performed using
computational scripts,
tools and/or processes, and can form an analysis pipeline, e.g., a series or
collection of
connected steps and/or procedures, e.g., by connecting various computational
steps, tools and/or
processes. In some aspects, one or more of the steps, functions, processes or
scripts can be
substituted by similar algorithms, steps, functions, processes or scripts that
achieve or carry out a
similar function. In some embodiments, the sequential order of one or more
steps can be in any
order, or any one or more steps, functions, processes or scripts can be
performed in parallel.
[0146] In some embodiments, the methods of identification, alignment,
filtering, processing,
mapping and/or analysis of the sequences, e.g., obtained from ATAC-seq, is
driven by a set of
configuration files, e.g., in YAML format, a human-readable data serialization
language. In
some embodiments, the configuration files specified general pipeline run
parameters, e.g.,
number of CPU cores used in processing and where output files are uploaded, as
well as
information for each sample, e.g., sample name and type of sequencing reads in
the sample. In
some embodiments, the steps and/or methods for identification, alignment,
filtering, processing,
32
CA 03049461 2019-07-04
WO 2018/132518 PCT/US2018/013227
mapping and/or analysis of the sequences infers, from the configuration
provided, the files that
needed to be generated, the order of files, and the processing scripts and
tools. In some
embodiments, each of these steps, functions, processes or scripts can be added
to a queue which
is distributed out to a set of computing nodes. In some embodiments, during
the run, inputs and
outputs can be organized into a common folder and file naming structure, and
logs can be
generated from recording the events during each run. In some embodiments, the
methods of
analysis include steps, functions, processes or scripts, in a setup or an
order.
[0147] In some embodiments, the methods of analysis for epigenetic and/or
epigenomic
properties, states and/or profiles, e.g., as determined from ATAC-seq data, is
driven by a set of
configuration files, e.g., in a human-readable data serialization language. In
some embodiments,
the configuration files specified general pipeline run parameters, e.g.,
number of CPU cores used
in processing and where output files are uploaded, as well as information for
each sample, e.g.,
sample name and type of sequencing reads in the sample. In some embodiments,
the pipeline
infers, from the configuration provided, the files that needed to be
generated, the order of files,
and the processing scripts and tools. In some embodiments, each of these
steps, functions,
processes or scripts can be added to a queue which is distributed out to a set
of computing nodes.
In some embodiments, during the pipeline run, inputs and outputs can be
organized into a
common folder and file naming structure, and logs can be generated from
recording the events
during each run. In some embodiments, the methods of analysis include steps,
functions,
processes or scripts, in a setup or an order.
[0148] In some cases, the steps, functions, processes or scripts are branched
and are not
connected in a linear fashion. In some embodiments, the steps, functions,
processes or scripts
include steps that are involved in general computational processing or general
analysis of next
generation sequencing results, e.g., unzipping compressed files, or specific
steps that are used
for the particular data generation platform used (e.g., particular next
generation sequencing
platform). In some embodiments, configuration files are read into the pipeline
and a directed
acyclic graph (DAG) is generated, containing the processing steps, functions,
processes or
scripts.
[0149] Exemplary methods of analysis setup include steps described below. In
some
embodiments, the steps, functions, processes or scripts, include any one or
more of the steps,
functions, processes or scripts described.
[0150] In some embodiments, one or more of the steps, functions, processes or
scripts in the
steps and/or methods for identification, alignment, filtering, processing,
mapping and/or analysis
33
CA 03049461 2019-07-04
WO 2018/132518 PCT/US2018/013227
of the sequences or further analysis and/or application, are automated. In
some embodiments, a
script, e.g., a Perl script or shell script can be used to invoke any of the
various exemplary steps,
functions, processes or scripts described herein (see, e.g., Tisdall,
Mastering Perl for
Bioinformatics, O'Reilly & Associates, Inc., Sebastopol, Calif 2003; Michael,
R., Mastering
Unix Shell Scripting, Wiley Publishing, Inc., Indianapolis, Ind. 2003). In
some embodiments,
the methods of analysis can be embodied wholly or partially in one or more
dedicated programs,
for example, each optionally written in a compiled language such as C++ then
compiled and
distributed as a binary. In some embodiments, methods of analysis may be
implemented wholly
or in part as modules within, or by invoking functionality within, existing
sequence analysis
platforms. In some embodiments, the methods of analysis include a number of
steps, functions,
processes or scripts that are all invoked automatically responsive to a single
starting queue (e.g.,
one or a combination of triggering events sourced from human activity, another
computer
program, or a machine).
[0151] In some embodiments, the steps, functions, processes or scripts or any
combination
of the steps, functions, processes or scripts in the methods of analysis can
occur automatically
responsive to a queue. The output can be provided in the format of a computer
file. In some
embodiments, the output is a FASTA file, VCF file, text file, a .bedGraph file
or an XML file
containing sequence data, such as a sequence of the nucleic acid aligned to a
sequence of a
reference genome.
[0152] In some embodiments, the sequence reads may be analyzed computationally
to
identify the ends of the fragments (from which the transposon cleavage sites
can be inferred). In
some embodiments, one end of a fragment can be defined by sequence that is at
the beginning of
a sequencing read and the other end of the fragment can be defined by sequence
that is at the
beginning of a second sequencing read, where the first and second sequencing
reads were
obtained by paired end sequencing (e.g., using Illumina's sequencing
platform), e.g. resulting in
paired-end reads R.1 and R2. The same information can be obtained from
examining the
beginning and end of longer sequence reads (e.g., having the sequence of both
adaptors; one at
one end and the other at the other end). In some embodiments, a single
sequence read may
contain both adaptor sequences, in which case both ends of a fragment (which
correspond to two
cleavage sites for the two separate transposases) can be inferred from a
single sequence read.
The lengths of the fragments can be calculated by, e.g., mapping the fragment
ends onto the
nucleotide sequence of the region of interest, and counting the number of base
pairs between
34
CA 03049461 2019-07-04
WO 2018/132518 PCT/US2018/013227
those positions. The information used may be obtained using the nucleotide
sequences at the
beginning and/or the end of a sequence read.
[0153] In some embodiments, sequence information corresponding to epigenetic
or
epigenomic data based on large-scale sequencing, e.g., high throughput
sequencing or next
generation sequencing, e.g., results from ATAC-seq, which may contain forward
(R1) and/or
reverse (R2) reads, can contain about or at least about 106, 107, 108, 2 x
108, 3 x 10⁸, 4 x 10⁸, 5 x
108, 109, 1010 or more target polynucleotide reads or clusters, e.g., may
comprise about, less than
about or more than about 2 x 10⁶, 3 x 10⁶, 4 x 10⁶, 5 x 10⁶, 107, 108 or more
target
polynucleotides or clusters for each sample in the reaction.
[0154] In some embodiments, raw data from a high-throughput sequence, which
can be in
compressed form, can be retrieved, such as from any storage location, e.g.
cloud-based storage
or downloaded on a computing cluster. Exemplary scripts or tools for
retrieving data include
get bcl, e.g. base calls in the form of a .bc1 file. In some embodiments, the
data from a
sequencer run can be decompressed for processing using downstream tools, e.g.
using the script
untar bcls. The output sequencing data can be in any of a variety of output
data file types or
formats, including, but not limited to, *.bc1, *.fasta, *.csfasta, *seq.txt,
*qseq.txt, *.fastq, *.sff,
*prb.txt, *.sms, *srs and/or *.qv. In some embodiments, one or more processing
steps,
functions, processes or scripts include converting the format of the
sequencing data output from
into formats that can be used in further steps of the methods of analysis or
for display, e.g., in
particular graphical user interface (GUI). For example, a program termed
bc12fastq can be used
to convert .bc1 raw base call files into compressed FASTQ files. In
embodiments involving
paired-end runs, each sample has two files, R1 and R2, corresponding to
forward and reverse
reads (beginning and end of each DNA fragment) respectively.
[0155] In some embodiments, raw sequencing counts is normalized for downstream
steps.
In some embodiments, normalization includes estimating sizing factors and
dispersion, and
performing a negative binomial generalized linear model fit. In some
embodiments, such steps
can be assessed using scripts or tools such as DESeq2. In some embodiments,
the normalization
also includes normalization based on measures such as fraction of reads in
peaks (FRiP;
showing enrichment of signal, calculated as (number of reads in peaks)/(number
of total reads)).
In some embodiments, FRiP-normalized counts can be determined (e.g., with
variable betaPrior
set as true).
[0156] In some embodiments, processing steps to retrieve and decompress
compressed files
generated by any of the steps. In some embodiments, exemplary steps to
retrieve compressed
CA 03049461 2019-07-04
WO 2018/132518 PCT/US2018/013227
files, e.g., compressed FASTQ files and move the files into analysis
directories sorted by
samples, include a program termed get data. In some embodiments, exemplary
steps to
decompress files, e.g., decompressing compressed FASTQ files so they can be
processed by
downstream tools, including a program termed unzip.
[0157] In some aspects, statistics to indicate the quality of the sequences,
e.g., overall
statistics for sequencing runs, base calling quality, contamination,
overclustering, can be
generated using scripts or tools, e.g., fastqc.
[0158] In some embodiments, sequences identified in one or more sequencing
reads for a
plurality of clusters are positionally mapped to a reference sequence, e.g., a
reference genome.
In general, mapping involves placing one sequence along another sequence,
iteratively
introducing gaps along each sequence, scoring how well the two sequences
match, and, in some
aspects, repeating for various positions along the reference sequence. The
best-scoring match is
deemed to be the mapping and represents an inference about the degree of
relationship between
the sequences. In some embodiments, a reference sequence to which sequencing
reads are
compared is a reference genome, such as the genome of a member of the same
species as the
subject. A reference genome may be complete or incomplete. In some
embodiments, a reference
genome contains only regions containing target polynucleotides. In some
embodiments, a
reference sequence comprises or consists of a human genome. In some
embodiments, a
reference sequence comprises or consists of sequences of polynucleotides of
one or more
organisms other than the subject or from whom a sample is taken. In some
embodiments, a
reference sequence comprises or consists of a plurality of known sequences,
such as all probe
sequences used to amplify target polynucleotide sequences (e.g. every sequence
B and/or
sequence B' for every different target polynucleotide). Sequencing data
generated from the
extension of one primer (e.g. R1 sequences from forward primer) may be mapped
to the same or
different reference sequence as sequencing data generated from the extension
of another primer
(e.g. R2 sequences from reverse primer). Sequencing data generated from the
extension of one
primer may be mapped to a reference sequence two or more times, with each
mapping using a
different mapping algorithm. R1 sequences may be mapped independently of R2
sequences.
[0159] In some embodiments, exemplary steps for positional mapping of the
reads from the
sequencing reads, include, e.g., steps, functions, processes or scripts termed
get genome,
build bowtie2 index, Index genome fasta and map atac reads. Exemplary steps
for positional
mapping include e.g., steps for fetching appropriate genome files for the
specified organism and
version from their online sources, such as get genome; steps for indexing
genome files so that
36
CA 03049461 2019-07-04
WO 2018/132518 PCT/US2018/013227
reads can be positionally mapped to the genome, using bowtie2 build and/or
build bowtie2 index; steps for builidng a FASTA index for the downloaded
genome files to
allow positional access by downstream tools, such as Index genome fasta and
steps for
mapping ATAC-seq sequences reads to the genome to determine their position,
using bowtie2
and/or map atac reads.
[0160] In some embodiments, the reference genome is the human genome. In some
embodiments, the reference genome sequence is the NCBI36/hg18 sequence.
Alternatively, the
reference genome sequence is the GRCh37/hg19. Other sources of public sequence
information
include GenBank, dbEST, dbSTS, EMBL (the European Molecular Biology
Laboratory), and
the DDBJ (the DNA Databank of Japan). A number of computer algorithms are
available for
aligning sequences, including without limitation BLAST (Altschul et al.,
1990), BLITZ
(MPsrch) (Sturrock & Collins, 1993), FASTA (Person & Lipman, 1988) or BOWTIE
(Langmead et al., (2009) Genome Biology 10:R25.1-R25.10).
[0161] Other examples of mapping or alignment programs include: BLAT from Kent
Informatics (Santa Cruz, Calif.) (Kent, W. J., Genome Research 4: 656-664
(2002)); SOAP2,
from Beijing Genomics Institute (Beijing, Conn.) or BGI Americas Corporation
(Cambridge,
Mass.); Bowtie (Langmead, et al., Genome Biology, 10:R25 (2009)); Efficient
Large-Scale
Alignment of Nucleotide Databases (ELAND) or the ELANDv2 component of the
Consensus
Assessment of Sequence and Variation (CASAVA) software (Illumina, San Diego,
Calif.); RTG
Investigator from Real Time Genomics, Inc. (San Francisco, Calif.); Novoalign
from Novocraft
(Selangor, Malaysia); Exonerate, European Bioinformatics Institute (Hinxton,
UK) (Slater, G.,
and Birney, E., BMC Bioinformatics 6:31(2005)), Clustal Omega, from University
College
Dublin (Dublin, Ireland) (Sievers F., et al., Mol Syst Biol 7, article 539
(2011)); ClustalW or
ClustalX from University College Dublin (Dublin, Ireland) (Larkin M. A., et
al., Bioinformatics,
23, 2947-2948 (2007)); and FASTA, European Bioinformatics Institute (Hinxton,
UK) (Pearson
W. R., et al., PNAS 85(8):2444-8 (1988); Lipman, D. J., Science 227(4693):1435-
41 (1985)). In
some embodiments, one end of the clonally expanded copies of the sequences are
processed by
bioinformatics alignment analysis for the Illumina Genome Analyzer, which uses
the ELAND
software. In some aspects, the analysis can include steps for genome browser
visualizations.
[0162] In some embodiments, an output file is generated containing sequence
data such as a
sequence of the nucleic acid aligned to a sequence of the reference genome. In
other
embodiments, the output contains coordinates or a string describing one or
more mutations in
the subject nucleic acid relative to the reference genome and/or other
epigenetic or epigenomic
37
CA 03049461 2019-07-04
WO 2018/132518 PCT/US2018/013227
data alignments. Alignment strings known include Simple UnGapped Alignment
Report
(SUGAR), Verbose Useful Labeled Gapped Alignment Report (VULGAR), and Compact
Idiosyncratic Gapped Alignment Report (CIGAR) (Ning, Z., et al., Genome
Research
11(10):1725-9 (2001)). In some embodiments, the output is a sequence
alignment, such as, for
example, a sequence alignment map (SAM) or binary alignment map (BAM) file,
comprising a
CIGAR string (the SAM format is described, e.g., in Li, et al., The Sequence
Alignment/Map
format and SAMtools, Bioinformatics, 2009, 25(16):2078-9). In some
embodiments, CIGAR
displays or includes gapped alignments one-per-line. CIGAR is a compressed
pairwise
alignment format reported as a CIGAR string.
[0163] In some embodiments, aligned sequence files can be converted into a
different file
format for analysis using downstream tools. In some embodiments, such steps
for conversion
include steps to convert BAM alignment files into a file format usable by
downstream HOMER
tools, e.g., using make homer tagdir.
[0164] In some embodiments, R1 sequence from a cluster comprises forward
sequences
from a plurality of different target polynucleotides and R2 sequence from a
cluster comprises
reverse sequences. When each reverse sequence is selected to target a specific
target
polynucleotide, its sequence and location within the reference sequences (e.g.
reference genome)
is generally known, and R1 sequences from the same cluster may be expected to
fall within an
anticipated nucleotide distance. An anticipated nucleotide distance may be
based on an average
or median fragment length for samples comprising fragmented sample
polynucleotides, or an
upper threshold distance representing an unlikely fragment length based on
such median or
average fragment length. Thus, in some embodiments, an R1 sequence that aligns
to a position
further away than the threshold distance from the R2 sequence from the same
cluster may be
erroneous and is discarded. In some embodiments, the upper threshold distance
along a
reference sequence between aligned R1 and R2 sequences from the same cluster,
above which
sequence reads for a cluster are discarded, is about, or more than about
1,000, 2,500, 5,000,
7,500, 10,000, 12,500, 15,000, 20,000 or more base pairs. In some embodiments,
alignments of
R1 sequences to non-unique regions of a reference sequence (e.g. a reference
genome) are
discarded and the sequences re-aligned to a smaller subset of unique sequences
within the
reference sequence.
[0165] In some embodiments, sequencing reads can be duplicative, and
duplicative
sequences can be removed following an initial positional mapping and/or
alignment. When
sequencing reads are mapped, duplicative reads may be marked as duplicates by
the alignment
38
CA 03049461 2019-07-04
WO 2018/132518 PCT/US2018/013227
algorithm. For example, a mark duplicates subroutine within the alignment
algorithm examines
all of the records in a file of aligned sequences (e.g. a *.BAM file) and
decides which reads are
duplicates of other reads. In some embodiments, one or more of the two general
types of
duplicates can exist: optical duplicates, which may be typically caused by
defects in the primary
analysis software, and PCR duplicates, which may be caused by duplicative PCR
reactions.
[0166] In some embodiments, the method of analysis involves removal of
duplicate reads,
e.g., to improve quantitative accuracy. In some embodiments of the methods of
analysis, steps,
functions, processes or scripts are used to remove duplicative sequences,
e.g., to flag and remove
duplicate reads arising from PCR amplification bias and cluster miscalling. In
some
embodiments, such steps can reduce the amount of noise in the datasets. In
some embodiments,
the steps can include algorithms or programs for proper sorting of naming and
indexing of the
reads post-mapping, and outputs idxstats files that give mapped counts per
chromosome. In
some embodiments, exemplary steps to remove duplicates and further indexing
include a step
for flagging and removing duplicate reads arising from PCR amplification bias
and cluster
miscalling, to reduce the amount of noise in the datasets, e.g., using a
script or tool termed
Picard remove duplicates. In some aspects, Picard or similar scripts or tools
can be used to
calculate and visualize the distribution of fragment sizes recovered, e.g.,
using a script or tool
termed atac insert size metrics and calculate statistics about the positional
distribution of reads
into various types of genomic features, e.g., using a script or tool termed
atac alignment summary.
[0167] In some embodiments, the analysis involves removal of mitochondrial
reads and/or
additional contaminating sequences based on sequence identity, quality,
mapping location, or
other sequencing properties of the reads. In some embodiments, the method of
analysis involves
removal of reads that map to the mitochondrial genome, mitochondrial reads
and/or additional
contaminating sequences. In some aspects, mitochondrial reads are major
contaminants in
ATAC-seq libraries that can contribute a large proportion of the sequence
reads, e.g., up to 80%,
and can reduce the accuracy of downstream steps. In some embodiments, the
removal is based
on sequence identity, quality, mapping location, or other sequencing
properties of the
sequencing reads. In some embodiments, exemplary steps for removing
mitochondrial reads
and/or additional contaminating sequences include steps for filter mtDNA
reads. In some
embodiments, the method of analysis involves retaining and comparing
mitochondrial reads.
[0168] In some embodiments, analysis involves the separation of sequence reads
into
subsets representing a specific epigenetic property, e.g. chromatin
accessibility or chromatin
39
CA 03049461 2019-07-04
WO 2018/132518 PCT/US2018/013227
occupancy. In some embodiments, the size of the sequenced fragment can be used
to determine
the degree or level to which it represents said property. In some embodiments,
the number of
reads and/or a normalized number of reads within one or more genomic regions,
loci, elements
or intervals can be used to determine the degree or level to which it
represents said property. In
some embodiments, the differences in specific quantity or quality of signal in
one or more
genomic regions, loci, elements or intervals, can be used to determine the
degree or level to
which it represents said property.
[0169] In some embodiments, analysis involves the shifting of a fixed number
of positions
of the mapped reads, e.g., about 3, 4, or 5 base pairs, in a specific strand
direction, to account for
the shift in sequence reads based on the nature of the transposase, e.g., Tn5
transposase, and
library preparation. In some embodiments, exemplary steps for shifting read
positions include
shift atac alignments.
[0170] In some embodiments, the method of analysis involves assessing or
measuring
sequence reads of the ATAC-seq fragments. The degree of accessibility of the
DNA is
associated with more sequence reads of the fragments, such that the signal
from sequence reads
form peaks that can be detectable or measured, such as by using peak calling
tools, scripts or
algorithms. In some embodiments, the provided methods include steps for
assessing, depicting,
or determining peaks of signal, representing DNA in one or more regions of the
genome that is
accessible. In some aspects, a peak signal of sequence reads is a region with
enriched signal,
signal above background, or higher signal compared to surrounding regions. In
some
embodiments, ATAC-seq peaks can be overlaid with a genomic locus region map or
a genome
map. The identity of a region(s) that are enriched for or depleted of
accessibility and/or
occupancy signal as measured by quantifying ATAC-seq fragments, e.g. peak
signals, can be
determined from its position as mapped on the reference genome. The regions
can be further
categorized into the various regulatory element types - promoters, enhancers,
insulators , etc.by
integrating further genomic and epigenomic data such as information about
histone
modifications or evidence for active transcription (Buenrostro et al. (2013)
Nature Methods,
10:1213-1218).
[0171] In some embodiments, accessible regions, e.g. ATAC-seq fragments, can
be between
about 5 and about 20,000 bp in size, such as between about 10 and about 10,000
bp, about 50
and about 5,000 bp, about 100 and about 1,000 bp, about 200 and about 900 bp,
about 300 and
about 800 bp, about 400 and about 700 bp, about 500 and about 600 bp, about 10
and about 500
bp, about 20 and about 400 bp, about 30 and about 300 bp, about 40 and about
200 bp, about 40
CA 03049461 2019-07-04
WO 2018/132518 PCT/US2018/013227
and about 100 bp, about 50 and about 100 bp, about 60 and about 100 bp, about
70 and about
100 bp, about 80 and about 100 bp, about 90 and about 100 bp, about 100 and
about 500 bp,
about 200 and about 500 bp, about 300 and about 500 bp, about 400 and about
500 bp, about
100 and about 400 bp, about 100 and about 300 bp or about 100 and about 200
bp, in size.
[0172] In some embodiments, the methods include steps, functions, processes or
scripts
that can find, determine and/or annotate peaks of signal, e.g. by using peak-
calling tools, scripts
or algorithms. In some embodiments, peak calling can be carried out on a
particular sample
and/or present in one or more biological replicates of the sample and/or
present in one or more
different samples. In some embodiments, peak calling allows discrimination
between signal and
noise. In some aspects, peak calling can include one or more steps such as
estimating fragment
length and adjusting read position, identifying local noise, identifying
enriched or peak regions
and/or estimating false discovery rate (FDR). In some aspects, the called
peaks can be broad. In
some aspects, the called peaks can be narrow. Any of a variety of peak-calling
scripts are
available and can be used. In some embodiments, exemplary peak-calling
scripts, algorithms or
software include MACS, MACS2, Epic, SICER, BayesPEak, homer findPeak,
Jmosaics, T-
PIC, EDD, GEM or SPP In some aspects, peak-calling is performed using MACS or
MACS2.
In some embodiments, exemplary peak-calling steps, functions, processes or
scripts can include
Model-based Analysis of ChIP-Seq (MACS) or MACS2, such as the macs callpeaks
step
described herein, for calling accessibility peaks. In some embodiments, the
MACS or MACS2
peak calling uses a sample-swapping strategy to estimate the false discovery
rate (FDR) by
calling both sample peaks over the control and control peaks over the sample.
In some
embodiments, such peak calling step can scale the larger of a dataset to the
smaller of the dataset
using total library size, for normalization. In some embodiments, the peaks
include genomic
regions that are enriched for or depleted of accessibility and/or occupancy
signal as measured by
quantifying ATAC-seq fragments. In some embodiments, peak regions can be
between 10 and
10,000 bp in size. Comparison of peaks between samples may be used downstream
to identify
active regulatory elements (e.g., associated with specific genes or
transcription factors) between
conditions and/or be used to identify signatures of specific cell states or
predictive of outcome of
cell therapy, potency of cell therapy, toxicity and/or other characteristics
of the cell composition
or culture.
[0173] Other exemplary peak-calling steps, functions, processes or scripts can
include steps
for finding peaks using HOMER, in some embodiments including a script and/or
tool identified
as homer findPeaks. In some embodiments, steps to search for motifs, e.g.,
enriched
41
CA 03049461 2019-07-04
WO 2018/132518 PCT/US2018/013227
transcription factor binding motifs shared within the peak sets discovered by
MACS and
HOMER, can be employed, e.g., using a script or tool termed homer find motifs.
[0174] After peak calling, other steps, functions, processes or scripts, such
as peak
annotation steps, such as annotating peaks with additional metadata including
the nearest gene
they are likely to be associated with, e.g., using homer annotate peaks or
other annotation
strategies, can be used to facilitate further analysis. In some embodiments,
other steps for
annotation includes retrieving transcriptome annotation files associated with
the organism and
genome version that the pipeline is running, e.g., using get gtf annotation,
and/or retrieving
subsets of annotations, e.g., annotated transcriptome that only includes
protein coding
transcripts, e.g., using gtf coding transcripts only.
[0175] In some aspects, the methods include generating a consensus set or sets
of peaks,
e.g., consensus peak accessibility, from common or overlapping peaks present
in multiple
biological replicates and/or in two or more samples. In some embodiments,
exemplary peak-
calling scripts, algorithms or software for generating a consensus peak from
common or
overlapping peaks in two or more samples is DiffBind.
[0176] In some embodiments, the provided methods and assay includes making an
epigenetic map (also called an epigenetic profile) of a region of the genome
of the cells. In some
aspects, the epigenetic map depicts the epigenetic state across a plurality of
different regions,
e.g. coding sequences, intergenic spacers, regulatory regions, e.g. promoters,
etc, of the entire
genome, a portion of the genome or near or around or within a particular gene
or genes. This
step may be done by mapping information obtained from the sequence reads to
the region. In
some embodiments, the sequence reads are analyzed computationally to produce a
number of
numerical outputs that are mapped to a representation (e.g., a graphical
representation) of a
region of interest. Exemplary information for mapping include, but are not
limited to: (i)
cleavage sites for the transposase; (ii) the sizes of the fragments produced;
(iii) fragment length;
(iii) the positions of sequence reads of a defined range in length; and (iv)
sequence read
abundance, e.g. peak signal.
[0177] In some embodiments, sequence read abundance, i.e., the number of times
a
particular sequence in a genomic region is represented in the sequence reads,
may be calculated.
In certain cases, an epigenetic profile or map depicting peak signals of
sequence reads, e.g. as
determined using peak-calling tools, can be generated. The resultant
epigenetic map can provide
an analysis of the chromatin in the region of interest. For example, depending
on which
information is mapped, the map can show one or more of the following:
chromatin accessibility
42
CA 03049461 2019-07-04
WO 2018/132518 PCT/US2018/013227
along the region; DNA binding protein (e.g., transcription factor) occupancy
for a site in the
region; nucleosome-free DNA in the region; positioning of nucleosomes along
the region; and
chromatin states along the region. In some embodiments, the assay further
involves measuring
global occupancy of a binding site for the DNA binding protein by, e.g.,
aggregating data for
one DNA binding protein over a plurality of sites to which that protein binds.
In some instances,
the map can also be annotated with sequence information, and information about
the sequence
(e.g., the positions of promoters, introns, exons, known enhancers,
transcriptional start sites,
untranslated regions, terminators, etc.) so that the epigenetic information
can be viewed in
context with the annotation. In some embodiments, computationally implemented
scripts or
tools can be used to generate epigenetic/epigenomic maps. Exemplary steps
include creating
genome-wide fragment counts and visualizing the counts on a genome browser.
Exemplary
scripts or tools that can be utilized include make homer ucsc file, which can
create a
.bedGraph file which allows for genome-wide pileups of fragment counts; and
homer bedgraph to bigwig which can convert the bedGraph file to a binary-
compressed
bigWig file, used by most genome browsers to visualize fragment coverage
across the genome.
[0178] In some aspects, the analysis includes generating a metric associated
with particular
elements of a gene. In some aspects, such metrics include accessibility over a
promoter of an
annotated gene, or over the coding region of an annotated gene. In some
aspects, the analysis
includes generating a metric such as normalized accessibility count metric for
the promoter
region of each gene (promoter accessibility). In some embodiments, annotation
and generation
of metric can be used for further downstream analysis, e.g., comparing
epigenetic profiles,
clustering and/or biological pathway analysis. In some embodiments, such steps
can be
computationally implemented using scrips or tools, e.g., to annotate genes
and/or regulatory
elements. In some embodiments, tools such as ChIPpeakAnno or Homer can be
used. In some
embodiments, regulatory elements, such as the promoter region, or region
including the
transcription start site (TSS) can be defined. In some aspects, the TSS can be
defined, e.g., as
the proximal 500 bp, 1000 bp, 1500 bp, or 2000 bp upstream and 500 bp, 1000
bp, 1500 bp, or
2000 bp downstream of the promoter. In some aspects, the counts can be
normalized, e.g., based
on FRiP. In some aspects, promoter accessibility can be used as a metric
associated with a
gene.
[0179] In some embodiments, the epigenetic map can provide information
regarding active
regulatory regions and/or the transcription factors that are bound to the
regulatory regions. For
example, nucleosome positions can be inferred from the lengths of sequencing
reads generated.
43
CA 03049461 2019-07-04
WO 2018/132518 PCT/US2018/013227
In some embodiments, transcription factor binding sites can be inferred from
the size,
distribution and/or position of the sequencing reads generated. In some
embodiments, novel
transcription factor binding sites can be inferred from sequencing reads
generated. In some
embodiments, novel transcription factors can be inferred from sequencing reads
generated.
[0180] In some aspects, if biological or technical replicates were performed,
replicates can
be evaluated to assess the quality and fidelity of the methods. In some
embodiments, replicates
can be evaluated using interval analysis. In some embodiments, Venn diagram of
common and
unique peaks can be used to assess replicates. In some embodiments, counts for
each replicate,
e.g., 1og2 normalized counts, can be plotted on an X-Y plot, and correlation
coefficients, e.g.,
Spearmann correlation, can be calculated to assess replicates.
[0181] In some aspects, quality control metrics can be assessed to determine
the quality of
sequence information and data from the epigenetic/epigenomic analysis.
Exemplary control
metrics include Fraction of reads in peaks (FRiP), Non-Redundant Fraction
(NRF), PCR
Bottleneck Coefficient (PBC), Relative strand cross-correlation (RSC),
normalized strand cross-
correlation (NSC) and Irreproducible Discovery Rate (IDR), determining
unmapped, unpaired
reads, percent duplication, mtDNA contamination, number of unique peaks, total
mapped reads
(sequencing depth) and effective sequence depth (redundant vs. nonredundant).
In some
embodiments, the sequence reads from a sample contain less than 15%, less than
10%, less than
8%, or less than 6% unpaired or unmapped reads. In some aspects, the fraction
of duplicate
reads can be dependent on input and mtDNA contamination. In some aspects, low
mtDNA can
also be an indicator of poor enrichment or coincides with an aspirated pellet.
In some aspects,
the number of total mapped reads (sequencing depth) is at least 105, 106, 107
or 108 or more
reads. In some aspects, the effective sequence depth is at least 105, 106, 107
or 108 or more reads.
In some aspects, low FRiP can indicate poor enrichment of the samples. In some
aspects, the
FRiP of the sample is at least 0.05, 0.1, 0.2, 0.3 or more.
2 Samples for Assessment
[0182] In some embodiments, the epigenetic and/or epigenomic state is
measured, assessed,
and/or determined in a sample, such as a sample containing cells or cell
compositions. In some
embodiments, the sample is a biological sample that is taken, collected,
and/or obtained from a
subject and/or contains cells that are taken, collected, and/or obtained from
a subject. In certain
embodiments, the subject has a disease or condition and/or is suspected of
having a disease or
condition. In some embodiments, subject has received, will receive, or is a
candidate to receive
44
CA 03049461 2019-07-04
WO 2018/132518 PCT/US2018/013227
a therapy. In some embodiments, the therapy is an administration of a cell
therapy and/or an
immunotherapy. In certain embodiments, the cell therapy treats and/or is
capable of treating the
disease or condition. In some embodiments, the cells or cell compositions in
the sample contain
cells for cell therapy. In some embodiments, the therapy is a cell therapy
that contains one or
more engineered cells. In some embodiments, the engineered cells express a
recombinant
receptor. In some embodiments, the recombinant receptor is a chimeric antigen
receptor (CAR)
or a recombinant T cell receptor (TCR).
[0183] In some embodiments, the sample is taken, collected, and/or obtained
from a subject
who has been, who will be, or is a candidate to be administered a therapy. In
some
embodiments, the sample is taken, collected, and/or obtained prior to
treatment or administration
with the therapy, e.g., the cell therapy. In some embodiments, the sample is
taken, collected,
and/or obtained after treatment or administration with the therapy, e.g., the
cell therapy.
[0184] In certain embodiments, the sample contains, is taken, is derived,
and/or originates
from a cell or cell composition. In some embodiments, the cell is contained in
the sample. In
some embodiments, the sample contains a cell that is taken from, originates
from, and/or is
derived from a biological sample and/or the same source as the biological
sample. In some
embodiments, the cell, e.g., a cell from a biological sample and/or from the
same source as the
biological sample, is one that has been generated in connection with
processing and preparing
engineered cells, such as for use in adoptive cell therapy and/or those
formulated for such use,
e.g., in a pharmaceutical composition comprising a pharmaceutically acceptable
recipient and/or
cryopreservative. In some embodiments, a cell, e.g., a cell from a biological
sample and/or from
the same source as the biological sample, assessed by the methods, which may
in some aspects
be a control cell or cells or reference cell or cells.
[0185] In some embodiments, cells of the biological sample, and/or of the same
source as
the biological sample, assessed by the methods and/or compositions provided
have been
transduced or are to be transduced to contain a heterologous nucleic acid
and/or nucleic acid
encoding a heterologous protein or other nucleic acid or polypeptide product,
e.g., a recombinant
protein. In some embodiments the heterologous nucleic acid encodes a binding
molecule, such
as a recombinant receptor, such as a chimeric antigen receptor (CAR) or
transgenic T cell
receptor (TCR). In some embodiments, the cell is comprised by populations of
such cells,
compositions containing such cells and/or enriched for such cells, such as in
which cells
expressing the binding molecule make up at least 15%, 20%, 25%, 30%, 35%, 40%,
50%, 60%,
70%, 80%, 90%, 91%, 92%, 93%, 94%, 95%, 96%, 97%, 98%, 99%, or more percent of
the
CA 03049461 2019-07-04
WO 2018/132518 PCT/US2018/013227
total cells in the composition or cells of a certain type such as T cells,
such as CD8+ and/or
CD4+ T cells. In some embodiments, the cells are primary T cells. Among the
compositions
are pharmaceutical compositions and formulations for administration, such as
for adoptive cell
therapy.
[0186] In some aspects, the sample, e.g., a sample containing the cells, is
derived or isolated
from blood or a blood-derived sample, or is or is derived from an apheresis or
leukapheresis
product. Exemplary samples include whole blood, peripheral blood mononuclear
cells
(PB MC s), leukocytes, bone marrow, thymus, tissue biopsy, tumor, leukemia,
lymphoma, lymph
node, gut associated lymphoid tissue, mucosa associated lymphoid tissue,
spleen, other
lymphoid tissues, liver, lung, stomach, intestine, colon, kidney, pancreas,
breast, bone, prostate,
cervix, testes, ovaries, tonsil, or other organ, and/or cells derived
therefrom. Samples include, in
the context of cell therapy, e.g., adoptive cell therapy, samples from
autologous and allogeneic
sources.
[0187] In some embodiments, the sample includes chromatin preparations from
genetically
engineered cells expressing the heterologous nucleic acid and/or nucleic acid
encoding a
heterologous protein or other nucleic acid or polypeptide product, e.g., a
human or human-
derived recombinant protein. In some embodiments, the cells generally are
eukaryotic cells,
such as mammalian cells, and typically are human cells. In some embodiments,
the cells, e.g.,
the cells of the sample and/or of the biological sample, are derived from the
blood, bone
marrow, lymph, or lymphoid organs, are cells of the immune system, such as
cells of the innate
or adaptive immunity, e.g., myeloid or lymphoid cells, including lymphocytes,
typically T cells
and/or NK cells. Other exemplary cells include stem cells, such as multipotent
and pluripotent
stem cells, including induced pluripotent stem cells (iPSCs). In some
embodiments, the cells are
primary cells, such as those isolated directly from a subject and/or isolated
from a subject and
frozen.
[0188] In some embodiments, the cells are T cells, such as CD4+ T cells and/or
CD8+ T
cells, and/or natural killer (NK) cells. In some embodiments, the cells are
monocytes or
granulocytes, e.g., myeloid cells, macrophages, neutrophils, dendritic cells,
mast cells,
eosinophils, and/or basophils. In some embodiments, the cells or cell
compositions include T
cells. In some embodiments, the cells or cell compositions include CD4+ cells.
In some
embodiments, the cells or cell compositions include CD8+ cells.
[0189] In some embodiments, the cells and/or reference cells can be from any
source. In
some embodiments, the cells are isolated or obtained from a subject, e.g., a
human subject. In
46
CA 03049461 2019-07-04
WO 2018/132518 PCT/US2018/013227
some embodiments, the cell includes a plurality of cells or a population of
cells. The cells may
be isolated from a soft tissue or from a bodily fluid, or from a cell culture
that is grown in vitro.
In some embodiments, the chromatin may be isolated from cells from a soft
tissue such as brain,
adrenal gland, skin, lung, spleen, kidney, liver, spleen, lymph node, bone
marrow, bladder
stomach, small intestine, large intestine or muscle. In some embodiments, the
cells are from a
body fluid of a subject, e.g., blood, plasma, saliva, mucous, phlegm, cerebral
spinal fluid, pleural
fluid, tears, lactal duct fluid, lymph, sputum, cerebrospinal fluid, synovial
fluid, urine, amniotic
fluid, or semen. In some embodiments, the cells may be obtained from a culture
of cells, e.g., a
cell line.
[0190] In some embodiments, the cells include cells that were previously
subject to
modification, e.g., genetic engineering. In some embodiments, the cells
include cells obtained
from a subject that are engineered or modified, e.g., engineered to express a
recombinant
receptor. In some embodiments, the cells include cells obtained from a subject
but have not
been subject to genetic engineering. In some embodiments, the cells include
cells obtained from
a subject, and the methods provided herein can be performed in samples of the
cells before or
after engineering or modification of the cells. In some embodiments, the cells
include cells have
been selected or purified from a biological sample from a subject, e.g.,
blood. In some
embodiments, the cells include a subset of cells that express a particular
cell surface expression
marker.
[0191] In some embodiments, the nucleic acid (e.g. genomic DNA, chromosomal
DNA) to
be assessed is from blood cells, e.g. blood cells from a sample of whole blood
or a sub-
population of cells in whole blood. Subpopulations of cells in whole blood
include platelets, red
blood cells (erythrocytes), platelets and white blood cells (i.e., peripheral
blood leukocytes,
which are made up of neutrophils, lymphocytes, eosinophils, basophils and
monocytes). White
blood cells can be further divided into two groups, granulocytes (which are
also known as
polymorphonuclear leukocytes and include neutrophils, eosinophils and
basophils) and
mononuclear leukocytes (which include monocytes and lymphocytes). Lymphocytes
can be
further divided into T cells, B cells and NK cells. Peripheral blood cells are
found in the
circulating pool of blood and not sequestered within the lymphatic system,
spleen, liver, or bone
marrow.
[0192] In some embodiments, the population of cells may be selected by
selection methods
such as fluorescence activated cell sorting (FACS) or magnetic activated cell
sorting (MACS),
from a heterogeneous population of cells, e.g., blood, by known methods using
labeled
47
CA 03049461 2019-07-04
WO 2018/132518 PCT/US2018/013227
antibodies to cells surface markers. A wide variety of cells can be isolated
using these methods,
including stem cells, cancer stem cells and subsets of blood cells. Exemplary
cells that may be
selected from blood by FACS or MACS and exemplary markers used include: T
cells (CD3+
CD4+ CD8+), B cells (CD19+ CD20+), dendritic cells (CD11c+ CD20+), NK Cell
(CD56+),
stem cells/precursor cells (CD34+; hematopoietic stem cells only),
macrophage/monocytes
(CD14+ CD33+), granulocytes (CD66b+), platelet (CD41+ CD61+ CD62+),
erythrocytes
(CD235a+), enothelial cells (CD146+) and epithelial cells (CD326+). Subsets of
these cells can
be isolated using antibodies to further cell surface markers.
[0193] In some embodiments, the cells, e.g., cells in the sample, such as
biological sample,
and/or from the same source as the biological sample, include one or more
nucleic acids
introduced via genetic engineering, and thereby express recombinant or
genetically engineered
products of such nucleic acids. In some embodiments, the nucleic acids are
heterologous, i.e.,
normally not present in a cell or sample obtained from the cell, such as one
obtained from
another organism or cell, which for example, is not ordinarily found in the
cell being engineered
and/or an organism from which such cell is derived. In some embodiments, the
nucleic acids are
not naturally occurring, such as a nucleic acid not found in nature, including
one comprising
chimeric combinations of nucleic acids encoding various domains from multiple
different cell
types.
[0194] In some embodiments, the epigenetic and/or epigenomic properties,
states and/or
profiles can be assessed at any point in the preparation, production, or
manufacture of
transduced or engineered cells, including cells that are or will be or have
been transduced for use
in adoptive cell therapy, and post-therapy monitoring of the subject.
Exemplary steps for
processing cells include steps involved in the isolation, separation,
selection, cultivation (e.g.,
stimulation of the cells, for example, to induce their proliferation and/or
activation), transducing,
washing, suspension, dilution, concentration, and/or formulation of the cells,
including those
known and/or described herein. In particular embodiments, the processing steps
include
transduction of the cells with viral vector particles, where at least a part
of the incubation with
the viral vector particles is performed in a closed system or chamber to
initiate transduction.
The methods may further and/or alternatively include other processing steps,
such as steps for
the isolation, separation, selection, cultivation (e.g., stimulation of the
cells, for example, to
induce their proliferation and/or activation), washing, suspension, dilution,
concentration, and/or
formulation of the cells. In some embodiments, the cells or cell composition
includes cells that
have been subjected to transduction and then cultured, for example at 37 C,
for greater than or
48
CA 03049461 2019-07-04
WO 2018/132518 PCT/US2018/013227
greater than about 1 day, 2 days or 3 days, such as generally greater than 4
days, 5 days, 6 days,
7 days, 8 days, 9 days, 10 days, 11 days, 12 days, 13 days, 14 days or more.
[0195] In some embodiments, the cells or cell composition comprises cells at
any stage of a
genetic engineering manufacturing process. In some embodiments, the sample
contains nucleic
acid and/or chromatin preparation derived from cells at any stage of a genetic
engineering
manufacturing process. For example, the sample may comprise nucleic acid
and/or chromatin
preparation from cells that have been transduced with a viral vector particle
encoding a
recombinant and/or heterologous molecule. In some embodiments, the sample
contains cells,
e.g. autologous or allogeneic cells, engineered by transduction with a
heterologous nucleic acid
encoding a recombinant antigen receptor (e.g., CAR) and cultured or expanded,
such as for use
in connection with adoptive cell therapy. In some cases, the sample contains
nucleic acid and/or
chromatin preparation from such transduced cells that have been cryopreserved,
which, some
aspects, is referred to as a cryopreserved drug product (CDP). In some cases,
the sample
contains nucleic acid and/or chromatin preparation from such transduced cells
that have been
formulated for administration to a subject, which, some aspects, is referred
to as a formulated
drug product (FDP).
[0196] In some embodiments, the sample is obtained from a subject after such
subject has
received a therapy comprising cells that have been transduced, such as with a
viral vector
particle encoding a recombinant and/or heterologous molecule, e.g., a CAR. In
some
embodiments, as a control, the provided methods can be performed on a patient-
matched control
sample that has not been subjected to transduction and/or genetic engineering,
which can be a
sample containing the selected or enriched cells to be used for transduction.
In some
embodiments, such a patient-matched control sample can be a cryopreserved
sample, which, in
some cases, is referred to as a cryopreserved material (CMAT). In some
embodiments, nucleic
acid and/or chromatin preparation is isolated from cells. In some cases, the
nucleic acid and/or
chromatin preparation is isolated from about 1 x 10⁴, 1 x 10⁵, 1 x 10⁶, 1 x
107, or more cells. In
some embodiments, nucleic acid and/or chromatin preparation is isolated from 1
x 106 cells. In
some cases, the nucleic acid and/or chromatin preparation is isolated from all
or substantially all
of the cells comprised by a sample or selected portion thereof.
[0197] In some embodiments, cells are incubated with a cell stimulating agent
or agents that
is/are a cell-binding agent, such as an antigen-binding reagent, such as
antibody, that is able to
induce intracellular signaling and/or cell proliferation. In some embodiments,
cells are
incubated with, including mixed with, anti-CD3/anti-CD28 beads.
49
CA 03049461 2019-07-04
WO 2018/132518 PCT/US2018/013227
[0198] In accord with the methods described herein, the sample can be assessed
for one or
more epigenetic and/or epigenomic properties, e.g., chromatin accessibility
profiles as
determined by ATAC-seq. In some aspects, the provided methods can be used to
assess,
evaluate and/or characterize cells and/or cell compositions in the sample, at
various stages of
engineering, e.g., prior to engineering or after engineering to express a
recombinant receptor. In
some aspects, the epigenetic and/or epigenomic properties can be used to
assess the quality,
consistency and/or characteristics of the cells or cell compositions for
administration, and/or to
identify subjects, prior to receiving a cell therapy, who is likely to exhibit
a desired outcome,
e.g., respond to the cell therapy and/or who may be at risk of developing a
toxicity.
[0199] In some embodiments, the sample is taken, collected, and/or obtained
prior to
engineering of the cells. In some embodiments, the sample is taken, collected,
and/or obtained
subsequent to engineering of the cells. In some embodiments, the sample is
taken, collected,
and/or obtained subsequent to treatment or administration with the therapy,
e.g., the cell therapy.
In accord with methods, kits and articles of manufacture described herein, the
sample can be
assessed for one or more epigenetic and/or epigenomic properties prior to or
after receiving the
immunotherapy. In some embodiments, the sample is collected within or about
within or about
30 minutes, 1 hours, 2 hours, 3 hours, 4 hours, 5 hours, 6 hours, 8 hours, 10
hours, 12 hours, 14
hours or more prior to engineering the cells, e.g., to express a recombinant
receptor. In some
embodiments, the sample is collected within or about within or about 30
minutes, 1 hours, 2
hours, 3 hours, 4 hours, 5 hours, 6 hours, 8 hours, 10 hours, 12 hours, 14
hours or more
following engineering the cells, e.g., to express a recombinant receptor. In
some embodiments,
the sample is collected within or within about 30 minutes, 1 hours, 2 hours, 3
hours, 4 hours, 5
hours, 6 hours, 8 hours, 10 hours, 12 hours, 14 hours or more after obtaining
a sample, e.g., a
blood sample, from the subject. In some embodiments, the sample is collected
within or about
within or about 30 minutes, 1 hours, 2 hours, 3 hours, 4 hours, 5 hours, 6
hours, 8 hours, 10
hours, 12 hours, 14 hours or more prior to initiation of administration of the
immunotherapy,
e.g. the cell therapy. In some embodiments, the sample is collected within or
about within or
about 30 minutes, 1 hours, 2 hours, 3 hours, 4 hours, 5 hours, 6 hours, 8
hours, 10 hours, 12
hours, 14 hours or more following initiation of administration of the
immunotherapy, e.g. the
cell therapy.
[0200] In some aspects, any of the methods provided herein can be used to
determine the
properties, quality and/or consistency in a cell or cell composition. In some
aspects, any of the
methods can be used to assess the properties, quality and/or consistency of a
cell or cell
CA 03049461 2019-07-04
WO 2018/132518 PCT/US2018/013227
composition at any one or more of the described time points, e.g., prior to
engineering, mid-
process of engineering, after engineering, prior to administration, during
administration and/or
after administration of the cell to the subject.
[0201] In some embodiments, the population of cells used in the assay may be
composed of
any number of cells, e.g., about 500 to about 106 or more cells, about 500 to
about 100,000 cells,
about 500 to about 50,000 cells, about 500 to about 10,000 cells, about 50 to
1000 cells, about 1
to 500 cells, about 1 to 100 cells, about 1 to 50 cells, or a single cell. In
some embodiments, the
cell sample includes less than about 1000, 2000, 3000, 4000, 5000, 6000, 7000,
8000, 9000,
10,000, 15,000, 20,000, 25,000, 30,000, 40,000, 50,000, 60,000, 70,000,
80,000, 90,000,
100,000, 120,000, 140,000, 160,000, 180,000, 200,000, 250,000, 300,000,
350,000, 400,000,
450,000, 500,000, 600,000, 700,000, 800,000, 900,000, or 1,000,000 cells. In
some
embodiments, the cell sample includes more than about 1000, 2000, 3000, 4000,
5000, 6000,
7000, 8000, 9000, 10,000, 15,000, 20,000, 25,000, 30,000, 40,000, 50,000,
60,000, 70,000,
80,000, 90,000, 100,000, 120,000, 140,000, 160,000, 180,000, 200,000, 250,000,
300,000,
350,000, 400,000, 450,000, 500,000, 600,000, 700,000, 800,000, 900,000, or
1,000,000 cells. In
some embodiments, the methods provided herein require relatively fewer cells
compared to
other methods.
B. Processing and Further Analysis of Epigenetic/Epigenomic Profile
[0202] In some embodiments, the provided methods also involve additional
processing
and/or analysis of one or more aspects of the epigenetic/epigenomic properties
and/or profile. In
some embodiments, the provide methods include comparing the
epigenetic/epigenomic
properties and/or profile of a particular cell or cell composition to those of
another cell or cell
composition, e.g., comparative and/or differential analysis, or generating
metrics and counts for
normalization or further analysis steps. In some aspects, further processing
and/or analysis
includes using additional steps to analyze the sequence results, such as
nucleosome occupancy
analysis.
[0203] In some aspects, any one or more of the various additional processing
and/or further
analysis can be computationally implemented. In some embodiments, processing
and/or further
analysis can include, e.g., differential accessibility (differential peak)
analysis, normalization
measures, andd assessing nucleosome occupancy/positioning. In some
embodiments, the method
for analyzing and identifying one or more genomic region(s), e.g., the
processing and/or further
analysis, can include any one or more of the steps, functions, processes or
scripts, described
51
CA 03049461 2019-07-04
WO 2018/132518 PCT/US2018/013227
herein, sequentially or simultaneously in any order. One or more of the steps,
functions,
processes or scripts can be substituted by similar algorithms, steps,
functions, processes or
scripts that achieve or carry out a similar function. In some embodiments, the
sequential order
of one or more steps can be in any order, or any one or more steps, functions,
processes or
scripts can be performed in parallel.
[0204] In some embodiments, the one or more of the various processing and/or
further
analysis can involve identification of one or more genomic region(s), e.g,
coding regions, non-
coding regions, intergenic regions, untranslated regions, introns, exons, cis-
regulatory regions,
small RNA binding sites, repeats, telomeric regions and/or accessible or non-
accessible regions
(e.g., open chromatin and/or heterochromatin), that correlate with an outcome
of treatment with
a cell therapy and/or that can be used to assess a cell composition or a cell
culture, e.g., for
administration to a subject. In some embodiments, the one or more genomic
region(s) is
identified using differences in epigenetic and/or epigenomic profiles of one
or more genomic
region(s) in two or more samples, e.g., samples from different subjects, from
subjects with
different outcomes, from subjects receiving different treatment, from
different stages of cell
engineering, and/or from cells subject to different conditions. In some
embodiments, the one or
more genomic region(s) include different peaks of signal in the epigenetic
and/or epigenomic
analysis. In some embodiments, the one or more genomic region(s) include
regions showing
different statistical parameters or metrics, e.g., mean signal, median signal,
sum or total signal
over a region, between two or more different samples. In some embodiments,
processing and/or
further analysis can be used within the framework of the other optional steps
of the methods,
including thresholding and clustering approaches, predictive modeling and/or
differential peak
calling.
I. Deerential Peak A na(ysis
[0205] In some embodiments, the assays can be used to compare two or more
samples. In
some embodiments, the assay may comprise analyzing a first population of cells
or first cell
composition using the assay or analysis methods provided herein to produce a
first epigenetic
map; and analyzing a second population of cells or a second cell composition
using the assay or
analysis methods provided herein to produce a second epigenetic map; and
comparing the first
epigenetic map to the second epigenetic map, e.g., to detect any differences
or changes in
chromatin accessibility or transcription factor occupancy.
52
CA 03049461 2019-07-04
WO 2018/132518 PCT/US2018/013227
[0206] In some aspects, the analysis includes differential analysis, e.g.,
differential
accessibility or differential peak analysis. In some aspects, the analysis
includes comparing
sequence or signal peaks present in two or more samples, and/or differential
enrichment of
particular sequence or signal peaks between two or more samples. The two or
more samples can
include cells from a first population of cells or cell composition and cells
from a second
population of cells or cell composition. In some aspects, the analysis
includes determining
peaks that are present in two more samples, and comparing the width and
amplitude of the peaks
or presence and absence of peaks between two or more samples.
[0207] In some embodiments, comparison of peaks between two or more samples,
e.g. cell
population or cell composition, can be used to identify regions, loci,
elements or intervals, e.g.,
containing active regulatory elements and/or optionally associated with
specific genes or
transcription factors, that are differentially accessible in samples and/or
identify signatures, e.g.,
signatures of peaks at or near a particular genomic region, element or
interval, of specific cell
states, or that is correlated with or is predictive of particular outcomes,
e.g., outcome of cell
therapy.
[0208] In some embodiments, differences in peaks can be determined using
differential peak
calling steps, functions, processes, tools or scripts, such as DESeq2,
DiffBind, MAnorm, csaw,
DPCIAP, BADS, diffReps, DIME, HMCan-diff, ChIPDiff, MMDiff, THOR, POLYPHEMUS,
GenoGAM, normR, chromstaR, PePr, ChIPComp, EpiCentr, ODIN, histoneHMM,
ImpulseDE2,
QChlPat, SICER, MACS2, unique Peaks, ODIN, RSEG, MAnorm, Homer, DBChIP,
multiGPS,
edgeR and those described in Steinhauser et al. (2016) Briefings in
Bioinformatics, 17(6):953-
966 or https://omictools.com/peak-calling-category. In some aspects, the
methods can be used
to identify peaks that exhibit differential accessibility between two or more
samples. In some
aspects, the methods include computing differentially bound sites from
multiple samples using
quantative accessibility data. In some aspects, exemplary samples that can be
used for
differential analysis include different cell compositions or cell types, e.g.,
CD4+ or CD8+ cells,
or cells at different stages of engineering process, e.g., CMAT or CDP, cells
from different
donors, or cells subject to different treatment, e.g. treatment with drugs or
incubation with
agents.
[0209] In some aspects, differences in peaks can be determined using
differential peak
calling steps, functions, processes or scripts, such as DiffBind. In some
aspects, the analysis step
identifies genomic regions, loci and/or intervals that are differently present
between two or more
samples, and includes processing of peak sets, including overlapping and
merging peak sets,
53
CA 03049461 2019-07-04
WO 2018/132518 PCT/US2018/013227
counting sequencing reads overlapping intervals in peak sets, and identifying
statistically
significantly differentially present peak sites based on evidence of
differences in read densities.
In some embodiments, the analysis step identifies peak overlaps or consensus
peaks, e.g.,
accessibility peaks present in 2 or more samples analyzed. In some
embodiments, after overlaps
are determined, peaks found in more than two libraries are filtered and
sequencing counts are
extracted. In some embodiments, measures such as fraction of reads in peaks
(FRiP; showing
enrichment of signal, calculated as (number of reads in peaks)/(number of
total reads)) is
calculated.
[0210] In some embodiments, differences or changes in peak signal between two
or more
samples can be determined. In some embodiments, a fold change of peak signal
of one sample
compared to another sample is determined, such as a control or reference
sample, e.g. a sample
that has not been treated or a sample that exhibits desired characteristics or
outcomes, e.g., any
of the reference samples described herein. In some cases, data are transformed
and plotted on
logarithmic scales. In certain embodiments, the logarithmic transformation is
a common log
(logio(x)), a natural log (1n(x)) or a binary log (10g2(x)). In some
embodiments, the data is
plotted as a volcano plot depicting on the x-axis fold change, e.g. 1og2 fold
change, and on the y-
axis the statistical significance, e.g. ¨log10 of the p-value.
[0211] In some aspects, comparison of peaks between two or more samples can be
used to
identify active regulatory elements, optionally associated with specific genes
or transcription
factors, e.g., between samples or conditions and/or be used to identify
signatures of specific cell
states or predictive of outcomes, such as response or safety outcomes, or
other characteristics of
the cells or the cell composition.
[0212] In some embodiments, analysis steps that include feature selection
algorithms can be
used to identify regions, loci, elements or intervals that are differentially
accessible in samples
and/or identify signatures, e.g., signatures of peaks at or near a particular
genomic region,
element or interval, of specific cell states, or that is correlated with or is
predictive of particular
outcomes, e.g., outcome of cell therapy.
[0213] In some aspects, differential peak analysis can be performed or
assessed on a
genome-wide scale, or globally throughout the genome, or at particular genomic
region, locus
and/or interval of interest, e.g., at or near particular genes or gene panel
of interest. In some
aspects, differential peak analysis can be performed or assessed in a
particular panel of genes,
e.g., gene associated with cell-type specification, T cell differentiation
and/or development,
54
CA 03049461 2019-07-04
WO 2018/132518 PCT/US2018/013227
immune cell function, immune phenotype and/or transcription factors, including
any gene or
panel, set or module of genes described herein.
[0214] Any two samples, e.g. cell population or cell composition, can be
assessed by the
differential accessibility analysis. In some aspects, two or more cell
samples, e.g. cell
compositions, differ or are likely differ or may differ in one or more
property, attribute or
feature, such as related to the phenotype or function of the cells, including
one or more
phenotype or function of T cells, such as T cell activation state, memory
phenotype,
differentiation state, effector function, cytokine response, production or
secretion, cytolytic
activity, trafficking or migration ability, persistence or exhaustion, or
related to the presence or
absence of a transgene, e.g. mediated by viral ¨based transduction .
[0215] In some embodiments, one of the first and second cell sample, e.g. cell
composition,
is known to be enriched for cells, e.g. more than 75% of such cells, have or
are likely to have a
naïve phenotype or a long-lived memory phenotype and the other sample, e.g.
other cell
composition, has an unknown or undetermined memory phenotype. In some
embodiments, one
of the first and second cell sample, e.g. cell composition, is known to be
enriched for cells, e.g.
more than 75% of such cells, that are activated and the other sample, e.g.
other cell composition,
has an unknown or undetermined activation state. In some embodiments, one of
the first and
second cell sample, e.g. cell composition, is known to be uniform or
homogenous or relatively
uniform or homogenous, e.g. greater than 85%, 86%, 87%, 88%, 89%, 90%, 91%,
92%, 93%,
94%, 95%, 96%, 97%, 98%, 99% or more of cells in the composition or sample,
exhibit one or
more property, attributes or features, such as percent of CD4+ cells, CD8+
cells, level of one or
more activation marker, memory marker, apoptotic or cell health marker or
other marker
indicative of a phenotype or function of the cell. In such an example, the
other of the cell
sample, e.g. cell composition, has an unknown or undetermined uniformity
profile for the
property, attribute or feature. In some embodiments, one of the first and
second sample, e.g. cell
composition, is known to have a particular average or mean number of copies of
a transgene,
e.g. viral vector, per cell (vector copy number (VCN)) and the other of the
cell sample, e.g. cell
composition, has an unknown or underdetermined VCN. Any number of desired
features,
attributes or properties of a cell composition can be used in connection with
a differential
accessibility analysis.
[0216] Other exemplary properties or features of a first and second
composition include any
related to differences in engineering of a cell composition, cell source,
disease type or state. In
some embodiments, one of the first composition and second composition
comprises cells to be
CA 03049461 2019-07-04
WO 2018/132518 PCT/US2018/013227
genetically engineered with a recombinant receptor and the other of the first
composition and
second composition comprises the cells engineered to express the recombinant
receptor. In some
embodiments, different samples, e.g. a first cell composition and second cell
composition,
comprise primary cells from different donors, optionally donors that differ
based on disease
state, severity of disease, or type of disease. In some embodiments, different
samples, e.g. a first
cell composition and a second cell composition, comprise cells at different
stages or steps of a
manufacturing process for engineering cells. In some embodiments, different
samples, e.g. a
first cell composition and a second cell composition, comprise cells contacted
with an agent to
modulate the activity, phenotype or function of the cells and the other of the
first and second
composition comprises similar cells not so contacted. In such an example, such
an agent can
include a polypeptide or protein, a peptide, an antibody, a nucleic acid, a
viral vector or viral
preparation, or a small molecule compound, including, for example, a
stimulatory reagent,
optionally anti-CD3/anti-CD28; an immunomodulatory agent, an anti-idiotype
antibody or
antigen-binding fragment thereof specific to the recombinant receptor, e.g.
CAR, an immune
checkpoint inhibitor, a modulator of a metabolic pathway, an adenosine
receptor antagonist, a
kinase inhibitor, an anti-TGFP antibody or an anti-TGUR antibody or a
cytokine.
[0217] In some embodiments, the first population of cells and the second or
additional
population of cells are obtained from the same individual at different times.
In other
embodiments, the first population of cells and the second or additional
population of cells are
different populations of cells obtained from tissues or different individuals.
In some
embodiments, the first population of cells and the second or additional
population of cells are
obtained from different individuals and/or groups of individuals, e.g.,
individuals or groups of
individuals exhibiting different disease severity, treatment response,
treatment outcome, toxicity
and/or side effects, physiological response, molecular and/or functional
activity of the cells
and/or phenotype. In some embodiments, different samples, e.g. a first cell
composition and a
second cell composition, comprises a sample of a cell composition associated
with an outcome
that occurs or has occurred with the one but not the other of the first and
second composition
following administration to a subject.
[0218] Exemplary cells for comparison that can be used in the methods include,
for
example, cells isolated from normal subjects, cells isolated from subjects
that have not been
subject to engineering, cells isolated from subjects that show complete
response, cells isolated
from subjects that show durable response, and/or cells isolated from subjects
prior to or after a
56
CA 03049461 2019-07-04
WO 2018/132518 PCT/US2018/013227
particular treatment. In some embodiments, the cells can be subject to other
processes or
treatment, e.g. a selection based on cell surface marker expression, or
genetic engineering.
[0219] In some embodiments, differential peak analysis can be performed,
comparing the
epigenetic profiles of two or more samples, e.g., two or more test samples or
a group of samples.
In some embodiments, differential peak analysis can be performed, comparing
accessibility
profiles of one or more test sample, e.g., cell composition to be tested, to
the accessibility
profile of one or more reference sample or reference profile, e.g., any
reference sample or
reference profile described herein, e.g., in Section II.C.1.
2 Norma/ization illeasures and ifetrics
[0220] In some embodiments, analysis of the sequences and/or peaks from the
epigenetic/epigenomic profile includes further processing or analysis of the
sequence and/or
peak results, e.g., for normalizing or quantitating the results. In some
aspects, the analysis
includes adopting normalization measures. In some cases, the normalization
measures can
include generating a metric associated with a gene, e.g., a normalized count
per annotated gene.
In some embodiments, data from the assays, e.g., chromatin accessibility
assays such as ATAC-
seq, is further processed or analyzed to determine threshold and/or values,
identify loci and/or
genes associated with particular outcomes, and/or to compare with results and
analyses of other
assays. For example, in some embodiments, ATAC-seq peaks can be identified by
plotting a
frequency, such as a normalized frequency, overlaid with a genomic locus
region map or a
genome map. In some embodiments, normalized frequency values include FPKM or
RPKM. In
some embodiments, the term "FPKM" as used herein refers to Fragments Per
Kilobase per
Million fragments mapped. In some embodiments, the term "RPKM" can refer to
Reads Per
Kilobase per Million reads mapped. FPKM and RPKM are units to quantify
abundance of any
genomic feature, such as an exon, transcript, insertion of transposon, histone
modification,
nucleosome occupancy, DNA methylation, or occupancy of a protein, such as a
transcription
factor, or any genomic coordinates, determined by the abundance of sequencing
reads aligning
to it. The FPKM and RPKM measures normalize the abundance by relative length
of the
genomic unit as well as the total number of reads mapping to it, to facilitate
the comparison of
abundance levels within and between samples. In some aspects, normalized
frequency values
include upper quartile (UQ), size factor (SF), counts per million (CPM), Reads
Per Kilobase
Million (RPKM), Fragments Per Kilobase Million (FPKM) or Transcripts Per
Kilobase Million
(TPM).
57
CA 03049461 2019-07-04
WO 2018/132518 PCT/US2018/013227
[0221] In some embodiments, one or more genomic regions, loci, elements or
intervals are
selected for analysis. For example, in some embodiments, data from a genomic
region, e.g.,
promoter or enhancer regions, are assessed and/or compared. In some
embodiments, data from
within or around the coding region of a gene, e.g., gene body, are assessed
and/or compared.
For example, in some embodiments, the sum of FPKM or RPKM values of the gene
body of a
gene is assessed and/or compared. In some embodiments, the sum of FPKM or RPKM
values
are assessed and/or compared, for one or more genomic regions, e.g., genomic
loci.
[0222] In some embodiments, a pattern of differences compared to a reference
value and/or
a normalized value, e.g., a higher or lower chromatin accessibility compared
to a reference or
normalized value, is determined. In some embodiments, the assay includes
determining the
differences in values, e.g., chromatin accessibility as determined by
normalized values, e.g.,
FPKM or RPKM, at one or more genomic regions, e.g., genomic loci, e.g., a
plurality or panel
of loci in the genome, are determined and compared. In some embodiments, the
plurality or a
panel, set or module of loci include any of those described herein, or any of
those identified
using the methods provided herein.
[0223] In some embodiments, determining the differences in value at one or
more genomic
regions, e.g., genomic loci involves determining that the FPKM or RPKM value
for the one or
more genomic regions, e.g., genomic loci in the nucleic acid obtained from the
cancerous
biological sample is: i) greater than between a 1 to 20-fold, such as about a
1-fold, 2-fold, 3-fold,
4-fold or 5-fold, change in mean or total FPKM or RPKM value relative to the
FPKM or RPKM
value of the one or more genomic regions, e.g., genomic loci in the reference
nucleic acid
obtained from a reference biological sample; and ii) greater than about 10-
fold reduction in
FPKM or RPKM range relative to the FPKM or RPKM value of the one or more
genomic
regions, e.g., genomic loci in the reference nucleic acid obtained from
obtained from a reference
biological sample. For example, in some embodiments, the analysis includes
determining the
values, e.g., FPKM or RPKM values, for one or more genomic regions, e.g.,
genomic loci,
generating a matrix of sequencing tag counts for the one or more genomic
regions, e.g., genomic
loci based on any of the assays for epigenetic and/or epigenomic analysis
described herein, and
determining differences in value compared to a reference value or a normalized
value. Then, the
analysis further includes clustering analysis, such as hierarchical clustering
or principal
component analysis (PCA), based on the changes or differences in values in one
or more cell
populations, e.g., from one or more subjects or cells that were subject to one
or more treatments,
such as any further or additional analyses described herein.
58
CA 03049461 2019-07-04
WO 2018/132518 PCT/US2018/013227
[0224] In some embodiments, the assay includes determining the differences in
values, e.g.,
chromatin accessibility as determined by normalized values, which can be
determined using a
normalized value adjusted for effective library size. In some embodiments, a
negative binomial
model can be used to test for differential accessibility. In some embodiments,
a difference in
peaks, e.g., sequence read peaks between samples from one or more different
conditions, in one
or more genomic regions, loci, elements or intervals, e.g., genomic loci, can
be used to
determine differences in the epigenomic and/or epigenetic profile, e.g.,
differences in chromatin
accessibility.
[0225] In some embodiments, such normalization measures include calculating a
normalized
per-gene accessibility value (e.g., normalized FPKM values) representing
general accessibility
of a gene, using a computationally implemented script or tool, e.g.,
homer calculate per gene accessibility norm. Such calculated metrics or scores
can be used
for further downstream analyses, e.g., comparing with other samples or
correlating with
outcomes of cell therapy.
[0226] In some embodiments, normalization can also include normalization based
on
measures such as fraction of reads in peaks (FRiP; showing enrichment of
signal, calculated as
(number of reads in peaks)/(number of total reads)). In some embodiments, FRiP-
normalized
counts can be determined for one or more particular genomic regions or
intervals.
3. Nudeosome Occupancy Analysis
[0227] In some aspects, further processing steps include assessing the
nucleosome
occupancy or positioning or identifying nucleosome-free regions (NFRs) in the
epigenetic/epigenomic profile.
[0228] In some embodiments, the peaks contain and/or associated with NFRs
(see, e.g.,
Schep et al., (2015) Genome Research 25:1757-1770). In some aspects,
nucleosome-free
regions can be associated with transcriptional start sites, promoters or
transcription termination
sites (see, e.g., Yadon et al., (2010) Mol. Cell. Biol. 30(21):5110-5122)
and/or more activated or
more differentiated state. In some aspects, NFRs are associated with high
genomic accessibility.
In some embodiments, peak calling and differential peak analysis can include
one or more steps
such as filtering sub-nucleosomal reads, finding peaks, counting insertion
sites per peak,
aggregating promoter and/or transcriptional start site peak signals per gene
and/or examining
differential accessibility in stably shared peaks. In some aspects, the
epigenetic profile includes
identifying peaks of differential accessibility, e.g., identifying or
determining peaks a difference
59
CA 03049461 2019-07-04
WO 2018/132518 PCT/US2018/013227
in peaks, e.g., sequence read peaks between samples from one or more different
conditions, in
one or more genomic regions, loci, elements or intervals, e.g., genomic loci,
can be used to
determine differences in the epigenomic and/or epigenetic profile, e.g.,
differences in chromatin
accessibility between samples from one or more different conditions.
[0229] In some embodiments, the sequence reads can be placed into groups by
length. In
some embodiments, some sequences can be annotated as being a nucleosome-free
sequence (i.e.,
a sequence from a fragment that is predicted to be between nucleosomes) based
on its size (see,
e.g., Schep et al., (2015) Genome Research 25:1757-1770). Reads that are
associated with
mononucleosomes, dinucleosomes and trinucleosomes can also be identified.
[0230] In some embodiments, nucleosome occupancy, nucleosome positioning
and/or
nucleosome-free region can be determined using steps, functions, processes,
tools or scripts,
e.g., for separating out particular size of fragments that can represent
nucleosome-bound
chromatin. In some aspects, fragments of a specific size, e.g., fragments
larger than 100 bp, 150
bp, 200 bp, 250 bp or more, can be separated or filtered out filtered out. In
some aspects, some
of the fragments can represent nucleosome-bound chromatin. In some aspects,
exemplary steps
for filtering out fragments of a specific size, e.g., larger than 100 bp, 150
bp, 200 bp, 250 bp or
more include Filter nucleosomal fragments. In some embodiments, such steps can
enrich the
signal. In some aspects, both filtered and non-filtered reads can be used for
further or
downstream analyses to infer open and nucleosome-occupied chromatin,
respectively. In some
embodiments, nucleosome occupancy can be determined using steps, functions,
processes, tools
or scripts, e.g., for calling nucleosome positions and occupancy using ATAC-
Seq data, such as
NucleoATAC (see., e.g., Schep et al., (2015) Genome Res. 25(11): 1757-1770).
C. Analysis and Applications
[0231] In some embodiments, the provided methods also involve additional
applications
and/or analysis of one or more aspects of the epigenetic/epigenomic properties
and/or profile. In
some embodiments, the provide methods include further analysis and/or
application steps, such
as comparing the epigenetic/epigenomic properties and/or profile of a
particular cell or cell
composition to those of a reference sample and/or a reference profile. In some
aspects, the
further analysis and/or application includes determining additional
characteristics, properties,
and/or states, using additional standards or methods to analyze the sequence
results, performing
additional downstream analysis, gene subset analysis, biological pathway
analysis,
transcriptional occupancy analysis, or motif analysis, clustering analysis
and/or additional
CA 03049461 2019-07-04
WO 2018/132518 PCT/US2018/013227
applications, e.g., correlation or association with outcomes of a cell
therapy, assessing
integration of transgenic sequences, comparing with reference samples and/or
reference profiles,
and/or assessing phenotype or state or other properties of a cell or a cell
composition.
[0232] In some aspects, any one or more of the various additional analysis
and/or
applications can be computationally implemented. In some embodiments, the
provided methods
involve various downstream steps or processes for analysis or comparison,
e.g., computationally
implemented steps, and/or applications of the methods, for assessing one or
more properties or
characteristics of cells or cell compositions. In some embodiments, additional
analysis and/or
applications can include, e.g., biological pathway analysis, gene ontology
(GO) enrichment,
motif enrichment, gene subset analysis, transcription factor occupancy,
comparison with
reference profiles, and/or integration analysis, such as determining
transposon insertion sites. In
some embodiments, the method for analyzing and identifying one or more genomic
region(s),
e.g., the further analysis and/or application, can include any one or more of
the exemplary steps,
functions, processes or scripts, described herein, sequentially or
simultaneously in any order.
One or more of the steps, functions, processes or scripts can be substituted
by similar
algorithms, steps, functions, processes or scripts that achieve or carry out a
similar function. In
some embodiments, the sequential order of one or more steps can be in any
order, or any one or
more steps, functions, processes or scripts can be performed in parallel.
1: Reference Ept:genetic Property or Prof&
[0233] In some embodiments, the one or more of the assays, steps and/or
procedures
described herein can be used to determine the epigenetic and/or epigenomic
properties, state
and/or profile of particular samples, e.g., particular cells, cell population
or cell composition. In
some aspects, the methods are used to determine the epigenetic and/or
epigenomic properties,
state and/or profiles of reference cells or a reference cell composition, or
control cells and/or a
control cell composition. In some aspects, the one or more of the assays,
steps and/or
procedures described herein can be used to determine a reference epigenetic
property, e.g., a
reference epigenetic and/or epigenomic profile. In some aspects, any of such
properties or
profiles can be used to compare with and/or to assess test samples, e.g.,
other cells or cell
compositions, or test conditions or procedures, e.g., conditions or procedures
for generating,
manufacturing and/or manipulating cells or cell compositions, e.g., cell
compositions for
adoptive cell therapy. In some aspects, further analysis and/or application
methods or
61
CA 03049461 2019-07-04
WO 2018/132518 PCT/US2018/013227
procedures involve comparing epigenetic/epigenomic profiles of test samples
with that of the
reference sample and/or the reference profile.
[0234] In some embodiments, a reference epigenetic property can be determined
by
identifying an epigenetic property, e.g. by chromatin accessibility analysis,
of a reference or
control cell sample, population or composition. In some embodiments, the
reference or control
cell sample exhibits a known attribute or feature or is suspected or likely to
have a known
attribute or feature, e.g. related to the phenotype or function of the cells,
including one or more
phenotype or function of T cells, such as T cell activation state, memory
phenotype,
differentiation state, effector function, cytokine response, production or
secretion, cytolytic
activity, trafficking or migration ability, persistence or exhaustion, or
related to the presence or
absence of a transgene, e.g. mediated by viral-based transduction. In some
embodiments, the
reference or control sample is from a healthy or normal subject.
[0235] In some embodiments, the reference sample includes a sample, e.g.,
cells or cell
compositions, derived from subjects who, after administration of the cell
therapy, went on to
achieve a desired outcome, e.g., a desired response or safety outcome. In some
embodiments,
the reference sample includes a sample derived from subjects who went on to
achieve a partial
response (PR) or a complete response (CR), and/or a durable response, after
treatment with the
cell therapy. In some embodiments, the reference sample is a sample derived
from a subject
who went on to achieve a desirable safety outcome, e.g., absence of
development of toxicity,
e.g., cytokine release syndrome (CRS) or neurotoxicity (NT), or absence of
development of
severe CRS or severe NT. In some embodiments, desired therapeutic outcomes,
e.g., response
or safety outcomes, include any described in Section III below.
[0236] In some aspects, the reference sample can include cells or cell
compositions that
possess a desired state, quality, consistency, phenotype, characteristics
and/or property. For
example, in some aspects, a cell composition containing uniform or consistent
cells can be
desired. In some embodiments, a reference sample can include cells or cell
compositions that
are known to exhibit consistency and/or uniformity, and/or particular
phenotype, state, quality,
characteristics and/or property. In some aspects, a reference sample can
contain a particular
ratio of cells exhibiting particular phenotypes. In some aspects, a reference
epigenetic and/or
epigenomic profile can be obtained from any of the reference samples
described.
[0237] In some embodiments, the reference profile includes a collection of
epigenetic
properties or states at one or more genomic regions, loci and/or intervals, of
a reference sample.
In some embodiments, the reference profile is a reference
epigenetic/epigenomic map. In some
62
CA 03049461 2019-07-04
WO 2018/132518 PCT/US2018/013227
embodiments, the reference profile is an epigenetic map that is determined
from common peaks
of sequence reads from accessibility analysis, optionally chromatin
accessibility, among a
plurality of cell compositions, e.g. reference cell compositions or samples.
In some
embodiments, the reference profile is a set of metrics and/or normalized
values, e.g., FPKM
values or promoter accessibility metrics.
[0238] In some embodiments, the reference profile includes a threshold value
for the
epigenetic property for each of the one or more genomic regions or for the
overall epigenetic
property within the one or more genomic regions.
[0239] In some embodiments, the threshold value: is a value or level of the
epigenetic
property, optionally chromatin accessibility, in the one or more genomic
regions in a cell of a
cell composition shown to exhibit the outcome when administered to a subject
having the same
or similar disease or condition; or is an average, median or mean value or
level of the epigenetic
property, optionally chromatin accessibility, in the one or more genomic
regions from a cell of
each of a plurality of cell compositions, shown to exhibit one or more desired
outcomes, e.g.,
when administered to the subject. In some embodiments, the threshold value
includes is the
value or level of the epigenetic property in a cell from a normal or healthy
subject. In some
embodiments, the threshold value includes the value or level of the epigenetic
property in a cell
that exhibits a particular phenotype, e.g., a naïve or a long-lived memory
phenotype.
[0240] In some embodiments, the provided methods can be used for assessing a
cell
composition for administration to a subject, including analyzing an epigenetic
profile of one or
more genomic regions of a cell in a cell composition containing cells
engineered with a
recombinant receptor; and comparing the epigenetic profile for each genomic
region,
individually, to a reference profile, wherein the comparison indicates whether
the population of
cells is or is likely to exhibit or produce an outcome, e.g., desired outcome,
when administered
to a subject. In some embodiments, the provided methods of assessing a cell
culture includes
analyzing an epigenetic profile of one or more genomic regions of a cell
contained in an output
cell composition, said output composition produced by culturing an input
composition in the
presence of one or more test agents or conditions; and comparing the
epigenetic profile for each
genomic region, individually, to a reference profile, wherein the comparison
indicates whether
the cell is or is likely to exhibit a predetermined phenotype, persistence,
activity and/or function.
[0241] In some embodiments, the comparison is made between
epigenetic/epigenomic
properties, state and/or profile of one sample, e.g., a test sample, with the
epigenetic/epigenomic
properties, state and/or profile of a reference sample. In some aspects, the
comparison is made
63
CA 03049461 2019-07-04
WO 2018/132518 PCT/US2018/013227
with a reference profile. In some embodiments, the reference sample and/or
reference profile
can be any of those described herein. In some aspects, the reference sample
can be a sample
from a subject who exhibits a desired outcome, e.g., response outcome or
safety outcome, and/or
a sample that contains desired properties and/or characteristics.
[0242] The methods provided herein may also be used for assessing one or more
properties
or features of a cell composition, such as consistency, composition,
phenotype, function and/or
activity of the cell composition. In some aspects, the epigenetic and/or
epigenomic profile of a
cell composition can be compared to those of a reference sample, e.g.,
comprising a reference
cell composition. In some aspects, the method can be used to select or
generate appropriate cell
composition for treatment. In some aspects, the assays and analyses described
herein can be
used to select cells for treatment, e.g., engineered cells for adoptive cell
therapy, that are
predicted to be more consistent and/or uniform, and/or to exhibit a particular
phenotype or
composition, and/or is associated with a more consistent, efficacious and/or
predictable outcome
after administration. In some aspects, The methods provided herein may be used
to provide a
reliable predictor of efficacy and/or safety of cells for treatment, by
selecting cells that exhibit
an epigenetic and/or epigenomic properties associated with efficacy and/or
safety and/or a more
defined, consistent and/or uniform cell composition.
[0243] In some embodiments, the provided methods can be used for assessing a
cell
composition for administration to a subject, including analyzing an epigenetic
profile of one or
more genomic regions of a cell in a cell composition containing cells
engineered with a
recombinant receptor; and comparing the epigenetic profile for each genomic
region,
individually, to a reference profile, wherein the comparison indicates whether
the population of
cells is or is likely to exhibit or produce an outcome when administered to a
subject and/or to
produce a consistent, defined and/or uniform cell composition that is
associated with an outcome
of cell therapy.
[0244] In some embodiments, if the comparison indicates that the cell
composition is or is
likely to exhibit the outcome, e.g., a desired response or safety outcome, the
cell composition
can be administered to the subject.
[0245] In some embodiments, if the comparison indicates that the cell
composition is not or
is not likely to exhibit an outcome, e.g., a desired response or safety
outcome, either: (i) the cell
composition can be altered prior to administration; (ii) the dose of the cell
composition can be
altered prior to administration; (iii) the dosage regimen of the cell
composition can be altered
64
CA 03049461 2019-07-04
WO 2018/132518 PCT/US2018/013227
prior to administration; (iv) the cell composition can be administered in
combination with one or
more other therapeutic agents; or (v) the cell composition is not administered
to the subject.
[0246] In some aspects, the cell composition may be altered prior to
administration, based
on the results of one or more of the epigenetic/epigenomic analyses. For
example, in some
aspects, if comparison of the epigenetic/epigenomic profile of a particular
cell composition is
compared to that of a reference cell composition, and the comparison indicates
that the cell
composition is not or is not likely to exhibit an outcome, e.g., a desired
response or safety
outcome, one or more steps or procedures of engineering the cells prior to
cell therapy can be
modified. In some aspects, such modifications can include culturing the cells
engineered with a
recombinant receptor and/or cells to be genetically engineered in the presence
of one or more
test agents or conditions. In some embodiments, the one or more test agents or
conditions
comprises presence or concentration of serum; time in culture; presence or
amount of a
stimulating agent; the type or extent of a stimulating agent; presence or
amount of amino acids;
temperature; the source or cell types of the cell composition; the ratio or
percentage of cell types
in the cell composition, optionally the CD4+/CD8+ cell ratio; the presence or
amount of beads;
cell density; static culture; rocking culture; perfusion; the type of viral
vector; the vector copy
number; the presence of a transduction adjuvant; cell density of the cell
composition in
cryopreservation; the extent of expression of the recombinant receptor; or the
presence of a
compound to modulate cell phenotype. In some embodiments, the one or more test
agents or
conditions comprises one or more compounds from a library of test compounds.
In some
embodiments, if the comparison indicates that the cell composition is or is
likely to have the
phenotype or function, the methods also include selecting the one or more test
agent or condition
for culturing the cells. In some embodiments, if the comparison indicates that
the cell
composition is or is likely not to have the phenotype or function, the methods
can also include
repeating epigenetic and/or epigenomic analysis and/or comparison with other
samples with one
or more further test agent or condition.
[0247] The methods provided herein may also be used as a diagnostic (e.g.,
methods that
provide a diagnosis as well as methods that provide a prognosis) and/or to
select appropriate
subjects and/or cells for treatment. The methods may comprise, e.g., analyzing
epigenetic and/or
epigenomic features in cells, e.g., cells obtained from a subject, using the
assays described
herein to produce an epigenetic map; and providing a diagnosis or prognosis
based on the
epigenetic map and/or further analysis and/or quantitation. For example, the
assays and analyses
described herein can be used to predict efficacy, complete response, molecular
response,
CA 03049461 2019-07-04
WO 2018/132518 PCT/US2018/013227
durability of response, persistence of cells, expansion of cells safety (lack
of or reduced toxicity
or adverse effects) and/or lack of immunogenicity of the treatment, e.g.,
adoptive cell therapy.
In some embodiments, the assays and analyses described herein can be used to
select agents for
treatment, e.g., engineered cells for adoptive cell therapy, that are
predicted to be more
efficacious and/or safer, e.g., associated with complete response or molecular
response. The
methods provided herein may be used to provide a reliable predictor of
efficacy and/or safety of
cells for treatment, by identifying genomic regions, e.g., genomic loci with
altered epigenetic
and/or epigenomic features, e.g., altered chromatin accessibility, and
selecting cells that exhibit
an epigenetic and/or epigenomic properties associated with efficacy and/or
safety.
[0248] In some embodiments, the provided methods can be used for a prognosis,
e.g., to
determine if a subject for treatment is at risk for recurrence. The methods
can be used to identify
subjects treated with the cells, e.g., engineered cells, who are likely to
experience recurrence of
the disease or condition, e.g., cancer, such that they can be offered
additional therapeutic
options, including additional or altered doses, altered frequency, and/or
treatment with
additional agents, e.g., other cells expressing a recombinant receptor,
chemotherapy, radiation,
biological modifiers, inhibitors and other suitable therapies. The methods can
be used for
predicting long term response to treatment in subjects.
[0249] In some embodiments, the provided methods can be used to determine a
suitable
dosage, frequency, dosage regime and/or course of treatment for a subject
having a disease or
condition, e.g., a cancer or a tumor. In some embodiments the dosage of
treatment, e.g., cells for
adoptive cell therapy, can be determined based on the predicted efficacy
and/or safety of the
cells to be administered. A course of treatment refers to the therapeutic
measures taken for a
subject after diagnosis or after treatment. For example, a determination of
the likelihood for
response, toxicity, recurrence, spread, or subject survival, can be used in
determining the dosage
and extent of treatment and/or any combination therapies to be administered.
[0250] In some embodiments, the provided methods can be used to characterize,
classify,
differentiate, grade, stage, for diagnosis or prognosis of a disease or
condition or to select
suitable cells for use in treatment, e.g., adoptive cell therapy,
characterized by an epigenetic
pattern (e.g., a pattern of chromatin accessibility or DNA binding protein
occupancy). For
example, the method can be used to determine whether the epigenetic map of
cells obtained
from a subject for engineering and administration, is similar or different
compared to the
epigenetic map of the same type of cells from a normal subject or a subject
who exhibited a
robust and/or durable response after adoptive cell therapy, e.g., subjects who
exhibited a
66
CA 03049461 2019-07-04
WO 2018/132518 PCT/US2018/013227
complete response. The methods can also be used for predicting the
susceptibility of an
individual to a treatment, e.g., adoptive cell therapy.
2 Biological Pathways; PCA and Other Downstream Analyses
[0251] In some aspects, the provided assays and analysis methods can include
additional,
further or downstream analyses, including combining or applying other genomic
or functional
analysis steps. In some aspects further or downstream analyses can be used to
in combination
with the any one or more of the analysis or application steps. In some
aspects, exemplary
further or downstream analysis steps can include thresholding and clustering
approaches,
predictive modeling, gene ontology (GO) analysis, motif analysis and/or
principal component
analysis (PCA). In some aspects, any of the downstream analysis methods can be
computationally implemented.
[0252] In some aspects, the further or downstream analysis is PCA. In some
aspects, PCA
can be used to reduce dimensionality of the data and examine general variance
in the data, and
identify key drivers that contribute to the variation. PCA uses an orthogonal
transformation to
convert a set of observations of possibly correlated variables into a set of
values of linearly
uncorrelated variables called principal components. In some aspects, the
transformation is
defined so that the first principal component has the largest possible
variance (e.g., accounts for
as much of the variability in the data as possible), and each succeeding
component in turn has
the highest variance possible under the constraint that it is orthogonal to
the preceding
components.
[0253] In some aspects, the further or downstream analysis can include
biological pathways
analyses, e.g., including analysis of gene networks, pathways, biological
process and molecular
functions. In some aspects, an epigenetic property, profile and/or one or more
genomic regions,
loci and/or intervals identified, can be liked to particular biological
processes or pathways, based
upon biological, molecular, and/or functional relationships. In some aspects,
these relationships
are useful for pathway or process based collapsed association methods or
inferring the
phenotypic influence of particular epigenetic property and/or profiles.
Exemplary biological
pathways analyses include, but are not limited to: Reactome pathways and gene
ontology (GO)
biological processes of the nearest gene to provide biological relationships;
Disease Ontology
utilized to provide phenotypic relationships; and protein domain information
and molecular
functions (as annotated by Gene Ontology) to provide molecular and functional
relationships.
Other exemplary biological pathways analysis includes Ingenuity Pathway
Analysis (IPA),
67
CA 03049461 2019-07-04
WO 2018/132518 PCT/US2018/013227
Pathway Studio pathways analysis, KEGG based analysis, Gene Set Enrichment
Analysis
(GSEA), Signaling Pathway Impact Analysis (SPIA), EnrichNet, GGEA, Signaling
Pathway
Impact Analysis (SPIA) and TopoGSA. Exemplary procedures and methods that can
be used
for biological pathway analysis include Over-Representation Analysis or
Enrichment Analysis
(ORA), Functional Class Scoring (FCS), and Pathway Topology (PT).
[0254] In some aspects, the further or downstream analysis can include
clustering analysis,
e.g., hierarchical clustering. In some aspects, hierarchical clustering
involves creating clusters
that have a predetermined ordering from top to bottom or bottom to top. In
some aspects,
hierarchical clustering can be agglomerative (bottom-up), where each
observation starts in its
own cluster, and pairs of clusters are merged as one moves up the hierarchy;
or divisive (top-
down), where all observations start in one cluster, and splits are performed
recursively as one
moves down the hierarchy. Hierarchical clustering can be used on
epigenetic/epigenomic profile
at one or more genomic locations, from three or more different samples. In
some aspects,
hierarchical clustering can be performed based on epigenetic profile of a
panel, set or module of
genes, e.g., using a metric value for each gene. In some embodiments,
hierarchical clustering
can identify groups or clusters of samples that show more a similar epigenetic
profile to each
other compared to samples outside the cluster. In some embodiments,
hierarchical clustering
can be performed using computationally implemented scripts, tools or software
packages, such
as JMP or Pheatmap R.
[0255] In some aspects, the further or downstream analysis can include motif
analysis, e.g.,
determining repeating or consensus sequence motifs. In some aspects, the
further or
downstream analysis can include transcription factor binding motif analysis
and/or transcription
factor occupancy analysis. In some embodiments, transcription factor binding
motif analysis
can be performed using scripts or tools such as homer find motifs. In some
aspects, the script
or tool can search for enriched transcription factor binding motifs shared
within the peak sets
determined using methods provided herein.
[0256] In some embodiments, the one or more genomic regions, e.g., genomic
loci that can
be used in the panel of gene loci in characterizing and/or assessing
particular cells and/or
subjects for treatment can be identified using clustering analysis together
with one or more
reference samples and/or with one or more different samples. For example, in
some
embodiments, data from epigenetic and/or epigenomic analysis of cells obtained
from subjects
that exhibited different outcomes (e.g., some subjects who exhibited complete
response and
some subjects who exhibited partial response, progressive disease or no
response) can be subject
68
CA 03049461 2019-07-04
WO 2018/132518 PCT/US2018/013227
to hierarchical clustering or principal component analysis (PCA), to identify
particular panel of
loci that are associated with desired outcomes (e.g., complete response,
reduced toxicity,
increased expansion). In some embodiments, cells from subjects with desired
outcomes (e.g.,
complete response, reduced toxicity, increased expansion) are reference
samples used for
clustering analysis and/or to determine reference values for comparison. In
some of these cases,
any type of epigenetic and/or epigenomic analysis can be used to identify
particular loci that are
associated with desired outcomes (e.g., complete response, reduced toxicity,
increased
expansion). Once the gene locus and/or panel of gene loci are identified, the
epigenetic and/or
epigenomic properties or pattern of a population of test cells can be
determined and compared to
the corresponding properties or patterns in samples or groups associated with
the desired
outcome, and the cells and/or subjects can be selected for treatment, e.g.,
treatment using
adoptive cell therapy. In some embodiments, threshold reference values (e.g.,
threshold FPKM
or RPKM values) for one or more genomic regions, e.g., genomic loci can be
determined and
used as threshold values to select test cells and/or patients. In some
embodiments, the epigenetic
and/or epigenomic properties for one or more genomic regions, e.g., genomic
loci in the test
cells and/or subjects is subject to further clustering analysis, and the cells
and/or subjects are
selected for treatment if the epigenetic and/or epigenomic properties for the
one or more
genomic regions, e.g., genomic loci, cluster with reference cells or groups
with desired
outcomes (e.g., complete response, reduced toxicity, increased expansion).
[0257] In some embodiments, clustering analysis can be performed based on
average and/or
total FPKM or RPKM values for a genomic interval, for one or more genomic
regions, e.g.,
genomic loci. In some embodiments, clustering is performed based on the sum of
FPKM or
RPKM values over the gene body (e.g., coding region) for one or more genomic
regions, e.g.,
genomic loci. In some embodiments, the clustering analysis is depicted as
dendrograms,
constellation plots or decision trees. In some embodiments, clustering
analysis is performed
based on a value, e.g., FPKM or RPKM, at a particular point or a particular
interval, e.g., those
associated with a coding region or associated with a non-coding region.
[0258] In some embodiments, results of the analysis and methods provided
herein can be
represented or visualized using various plots or graphs. Exemplary plots or
graphs include venn
diagrams, MA plots (M (log ratio) and A (mean average)), principal component
analysis (PCA)
plots, boxplots and heatmaps.
[0259] In some embodiments, the cells can be subject to additional analysis,
e.g., molecular,
phenotypic or functional analysis. For example, the cell samples can be
analyzed using
69
CA 03049461 2019-07-04
WO 2018/132518 PCT/US2018/013227
fluorescence activated cell sorting (FACS) and/or laser capture
microdissection (LCM) for
phenotypic analysis. In some embodiments, the cell sample and/or nucleic acids
may be divided
into a plurality of portions. The portions can be divided based on the
molecular tags (e.g.
fluorescence tags). In some embodiments, the cell sample and/or nucleic acids
can be sorted.
The sorting can be performed after the molecular tags are inserted into the
nucleic acid. The
sorting can be performed before the fragments are sequenced. The gene
transcription of the cell
samples can also be analyzed using techniques such as fluorescence in situ
hybridization (FISH).
The chromatin accessibility can be correlated with the phenotypical,
transcriptional or
translational analysis.
[0260] In some embodiments, the epigenetic and/or epigenomic analysis can be
used in
combination with other detection and/or analysis methods, such as
transcription analysis,
transcriptome analysis, transcription factor occupancy assays, RNAseq, protein
expression,
proteomic analysis, protein modification analysis, functional activity assays,
flow cytometry
and/or intracellular cytokine staining. In some embodiments, the correlation
between results
from one or more epigenetic and/or epigenomic analysis, e.g., ATAC-seq, and
other analysis
methods, e.g., ChIPseq, RNAseq analysis or intracellular cytokine staining,
are determined. In
some embodiments, the results from the various assays or analysis methods are
strongly
correlated, e.g., have a high correlation coefficient. In some embodiments,
the results from the
various assays or analysis methods are not strongly correlated, e.g., have a
low correlation
coefficient. In some embodiments, the correlation depends on the gene and/or
locus and/or
conditions of the experiment. In some embodiments, the method of analysis
includes
comparing, correlating and/or further analyzing the data obtained, with other
data sets, e.g.,
other epigenetic and/or epigenomic data sets, and/or other phenotypic or
physiological data sets.
For examples, the method of analysis includes comparing, correlating and/or
further analyzing
the data obtained, with genome-wide expression data, e.g., RNA-seq data, or
genome-wide
nucleosome positioning data.
[0261] In some embodiments, epigenetic and/or epigenomic analysis includes
determination
of post-translational histone modification. In some embodiments, the
epigenetic analysis
includes detection of one or more histone modifications, such as acetylation,
methylation,
phosphorylation, ubiquitylation, sumoylation and biotinylation of specific
residues in histone
proteins H1, H2A, H2B, H3 and/or H4.
CA 03049461 2019-07-04
WO 2018/132518 PCT/US2018/013227
3. Gene Panel Ana(ysis
[0262] In some aspects, any of the analysis methods, including additional,
further or
downstream analyses, can be performed on one or more selected genomic regions
or gene loci.
In some aspects, the methods can be performed based on one or more selected
genes, such as a
subset of genes, panel of genes or module of genes. In some aspects, any of
the analysis
methods can be used to assess the epigenetic/epigenomic state in genomic
regions, genomic loci,
at or near a particular gene or a particular panel, module or set of genes,
e.g., panel, module or
set of genes that are associated with similar activity and/or function and/or
co-regulated or co-
expressed. In some aspects, analysis can be performed on a pre-selected gene
or panel, module
or set of genes. In some aspects, analysis can be performed such that genes
that exhibit similar
epigenetic and/or epigenomic properties, state and/or pattern can be used to
identify gene or
panel, module or set of genes of interest, e.g., those associated with,
correlated with or indicative
of an outcome or characteristic, e.g., a desired outcome or characteristic. In
some aspects, such
panel, module or set of genes can be used to assess the test samples.
[0263] In some embodiments, the genomic regions, loci and/or interval for
analysis in
assessing the epigenetic/epigenomic state in a panel, module or set of genes
can include signal at
particular elements or portions of a gene, or genomic regions or elements
associated with a gene,
including an intron, an exon, a cis-regulatory element, a promoter, an
enhancer, an upstream
activating sequence (UAS), a 3' untranslated region (UTR), a 5' UTR, a non-
coding RNA
producing region, a non-coding RNA (ncRNA) gene, a miRNA gene, an siRNA gene,
a piRNA
gene, a snoRNA gene, a lncRNA gene, a ribosomal RNA (rRNA) gene, a small RNA
binding
site, a non-coding RNA binding site, a pseudogene or a transcription
termination site (TTS).
[0264] In some embodiments, the one or more genomic regions, e.g., genomic
loci, e.g., a
panel of gene loci, may be positioned within or adjacent to a gene associated
with cell-type
specification, T cell differentiation and/or development, or transcription
factors. In some
embodiments, the one or more genomic regions, e.g., genomic loci are loci
encoding biological
markers or indicators associated with particular cell phenotypes, e.g.,
particular immune cell
phenotypes or immune cell differentiation markers. For example, in some
embodiments, the one
or more genomic regions, e.g., genomic loci, e.g., a panel of gene loci,
include markers that are
associated with T cell differentiation and/or function, e.g., cytokine genes,
immunomodulatory
protein genes, cell surface markers, apoptosis markers, cell death markers
and/or transcriptional
regulators. In some embodiments, the one or more genomic regions, e.g.,
genomic loci, e.g., a
71
CA 03049461 2019-07-04
WO 2018/132518 PCT/US2018/013227
panel of gene loci, are associated with particular immune cell phenotypes,
such as T cell
phenotypes, e.g., naïve T cell phenotypes, initial effector phenotypes, short-
term or mid/late
effector phenotypes, such as any described in, e.g., Best et al., Nature
Immunology (2013) 14,
404-412, which is hereby incorporated by reference. In some embodiments, the
subject is
human and the gene loci identified are based on the human genome.
[0265] In some aspects, analysis based on a panel, module or set of genes,
e.g., those that are
described as being associated or co-regulated in known pathways or gene
groups, can be
performed. In some embodiments, the one or more genomic regions, e.g., genomic
loci, e.g., a
panel of gene loci, include one or more gene selected gene loci related to T
cells or activity,
stimulation, function and/or particular phenotypes of T cells, e.g., CD8+ T
cells, such as any
described in, e.g., Best et al., Nature Immunology (2013) 14, 404-412, which
is hereby
incorporated by reference. For example, in some aspects, a panel, module or
set of genes
identified as being involved in or indicative of T cell differentiation
states, effector function,
exhaustion, or specific memory function and/or specific T cell subpopulations
can be assessed.
[0266] In some embodiments, the one or more genomic regions, e.g., genomic
loci, e.g., a
panel of gene loci, include one or more immunoregulatory gene loci selected
from among: Ifng,
Tbet, Lag3, Pdl, Cd25, Foxp3, 112, Ki67, Tnf, 1113, 1117, 1117a, Foxp and
Foxp3. In some
embodiments, the one or more genomic regions, e.g., genomic loci, e.g., a
panel of gene loci,
include one or more loci selected from among: Ifng, Tbx21, Tnf, 1113, Il2ra,
Lag3, 112, Mki67,
1117a, Pdcdl and Foxp3. In some embodiments, the panel of gene loci includes
Ifng and Pdcdl.
In some embodiments, the panel of gene loci includes one or more loci
associated with initial
effector response, such as Ctla4, Il2ra, Ifng, Gzmb and 112. In some
embodiments, the panel of
gene loci includes one or more loci associated with cell division, such as
Myc, Id3, Egr2, Tnf,
Cd69 and Pkm2. In some embodiments, the panel of gene loci includes one or
more loci
associated with cell cycle and cell division, such as Myb, Hist1h3a, Cdkl and
Ccd45. In some
embodiments, the panel of gene loci includes one or more loci associated with
naïve and late
memory response, such as Sell, Nsg2, 51fn5 and Cnr2. In some embodiments, the
panel of gene
loci includes one or more loci associated with early effector and late memory,
such as Ly6a, Rpl
and Snora. In some embodiments, the panel of gene loci includes one or more
loci associated
with short-term effector response, such as Id2, Cxcr3, Zeb2, Cx3cr1, Klrgl, S
1pr5 and Itgam.
In some embodiments, the panel of gene loci includes one or more loci
associated with memory
precursor response, such as Bc12, Tcf7, I17r and Foxo3. In some embodiments,
the panel of
gene loci includes one or more loci associated with naïve cells or late
effector response Cxcr6,
72
CA 03049461 2019-07-04
WO 2018/132518 PCT/US2018/013227
S 1pr4, S 1prl, Klf2 and Klf3. In some embodiments, the panel of gene loci
includes one or more
loci associated with short-term effector or memory response, such as Prdml and
Hif2a. In some
embodiments, the panel of gene loci includes one or more loci associated with
late effector
response, such as Tbx21, Prfl, Bhlhe40, Cd44, Klrc2 and Il12rb1. In some
embodiments, the
panel of gene loci includes one or more loci associated with mid- or late
effector response, such
as Dmrtal, Bc12, Edaradd, Prss12, Cnripl and Aqp9. In some embodiments, the
panel of gene
loci includes one or more loci associated with late effector response, such as
Unc5a, Xcll, Yes 1,
Cdhl, Myo3b, Dock9 and Atnl In some embodiments, the panel of gene loci
includes one or
more loci selected from among: Nr4a1, Cblb, Irf4, Tbx21, Eomes, Ifng, Csf2,
Gzmb, Tnfsf10,
Gata3, Mir155, Sox21, Ctla4, Lag3, Pdcdl Actb and/or Gapdh. In some
embodiments, the panel
of gene loci includes housekeeping gene, e.g., Actb or Gapdh, which can be
indicative of
activation state of the cells.
[0267] In some embodiments, the cells are selected for treatment based on the
methods
provided herein, if the cells for administration, e.g., engineered cells for
adoptive cell therapy,
exhibit epigenetic and/or epigenomic properties that are different from
effector-like T cells. In
some embodiments, the subject is selected for treatment with engineered cells
if the cells from
the subject exhibit epigenetic and/or epigenomic properties that are different
from effector-like
T cells. For example, the cell and/or subject can be selected for treatment if
one or more gene
loci associated with effector function of T cells or effector-like phenotype,
exhibit relatively
lower levels of chromatin accessibility.
4' Transgene integration A naoisis
[0268] In some embodiments, the methods can include identifying and/or
characterizing
integration site(s) of nucleic acid molecules or constructs or transgenes
delivered to or
introduced into the cell, e.g., constructs introduced into the cell for
engineering, for example, to
express a recombinant receptor. In some embodiments, one or more sites of
integration can be
determined based on the nucleic acid sequence, e.g., containing nucleic acid
sequences that are
adjacent to the integrated construct sequence, obtained from the methods
described herein. In
some embodiments, the number and location of integration can be determined. In
some
embodiments, the epigenetic and/or epigenomic profile at the site(s) of
nucleic acid integration
can be determined. In some embodiments, the nucleic acid molecule or construct
for integration
include a vector, e.g., a viral vector, a nucleic acid molecule, a transposon
and/or a nucleic acid
construct that encodes a transgene, e.g., a recombinant receptor. In some
embodiments, the
73
CA 03049461 2019-07-04
WO 2018/132518 PCT/US2018/013227
methods can include determining the number and/or abundance of the integrated
nucleic acid
molecule or construct. For example, in some embodiments, the copy number of
the nucleic acid,
e.g., vector such as a viral vector, or a construct, can be determined, in
cells that have been
engineered, e.g., in cells engineered to express a recombinant receptor. In
some embodiments,
the methods include determining level of expression of the encoded gene, e.g.,
the encoded
recombinant receptor.
[0269] In some embodiments, the methods can include determining T cell
clonality in a
plurality or population of T cells, e.g., a plurality of engineered T cells
and/or a composition
containing a plurality or population of T cells, e.g., a plurality of
engineered T cells. In some
aspects, the methods can be used to determine clonality in a plurality or
population of T cells by
determining the epigenetic and/or epigenomic properties and/or the epigenetic
and/or
epigenomic profile, such as chromatin accessibility, at or around gene loci
that encode the T
cell receptor (TCR) genes, e.g., genes that encode the variable and/or
constant regions of TCR
alpha, beta, gamma and/or delta chains. In some aspects, the methods can be
used to determine
clonality in a plurality or population of T cells by determining the insertion
site of a nucleic acid
molecule, e.g., nucleic acid sequences encoding a recombinant receptor. In
some embodiments,
clonality assessment can be used to characterize the plurality or population
of T cells, e.g.,
plurality or population of T cells in a composition. In some aspects, such
determination can be
used to determine a treatment regimen, e.g., including doses, timing and/or
frequency of
administration of the engineered cells and/or to determine necessary or
favorable modification
of culture or process conditions.
D. Exemplary Analysis Scripts
[0270] Without wishing to be bound to nomenclature, provided are descriptions
of
exemplary sequence manipulation and alignment procedures, e.g., scripts
referenced herein. This
list is not intended to be exhaustive or definitive, rather the scripts listed
herein serve as
examples of the types of scripts that may be useful for the provided analyses.
[0271] In some embodiments, these scripts and/or steps may be performed in
parallel and/or
are organized in a branched manner, such that multiple steps may be performed
at the same
time, in any order.
[0272] get bet: Compressed raw data from a high-throughput sequencer (base
calls in the
form of a .bc1 file) are retrieved from an intermediate storage location (in
some embodiments, on
cloud-based storage) and downloaded to the computing cluster.
74
CA 03049461 2019-07-04
WO 2018/132518 PCT/US2018/013227
[0273] untar Ms: The data from the sequencer run are decompressed for
processing using
downstream tools.
[0274] bc12fastq: A software tool bc12fastq is used to convert the raw base
call files into
gzip-compressed FASTQ files, containing sequence and metadata for every read
in the
sequencing run. In exemplary embodiments, for paired-end runs from ATAC-Seq,
each sample
has two files, R1 and R2, corresponding to forward and reverse reads
(beginning and end of
each DNA fragment) respectively.
[0275] get data: Compressed FASTQ files from the previous step are retrieved
and moved
into per-sample analysis directories.
[0276] unzip: Compressed FASTQ files are decompressed so that they can be
processed by
downstream tools.
[0277] fastqc: Generates a set of reports on the overall statistics of the
sequencing run and
base calling quality, as well as potential signs of contamination or
overclustering.
[0278] get genome: Fetches the appropriate genome files for the specified
organism and
version. In some embodiments, this may include from online sources and/or
databanks.
[0279] build bowtie2 index: Indexes the genome files so that reads can be
positionally
mapped to the genome, using a software tool called bowtie2 build.
[0280] Index genome fasta: Builds a FASTA index for the downloaded genome
files to
allow positional access by downstream tools.
[0281] map atac reads: Maps the sequences of the ATAC-seq reads back to the
genome to
determine their position, using the mapping software bowtie2.
[0282] Picard remove duplicates: Uses a software suite (e.g. Picard) to flag
and remove
duplicate reads arising from PCR amplification bias and cluster miscalling, to
reduce the amount
of noise in the datasets. In some cases, this step can ensure proper sorting
naming and indexing
of the reads post-mapping, and outputs idxstats files that give mapped counts
per chromosome.
[0283] atac insert size metrics: Uses software (e.g. Picard) to calculate and
visualize the
distribution of fragment sizes recovered from the dataset.
[0284] atac alignment summary: Uses software (e.g. Picard) to calculate
statistics related
to positional distribution of reads into various types of genomic features.
[0285] filter mtDNA reads: Filters out mitochondrial DNA.
[0286] shift atac alignments: Shifts the positions of the mapped fragments to
account for
the 4 or 5-basepair insertion by the Tn5 transposase during the ATAC-seq
library preparation.
CA 03049461 2019-07-04
WO 2018/132518 PCT/US2018/013227
[0287] Filter nucleosomal fragments: Filters out fragments larger than 100bp.
In some
embodiments, it is contemplated that these fragments can represent nucleosome-
bound
chromatin rather than free chromatin. This step is capable of enriching the
signal, and both the
filtered and non-filtered reads will be used in downstream analyses to infer
open and
nucleosome-occupied chromatin, respectively.
[0288] make homer tagdir: Converts BAM alignment files into a file format
usable by
downstream HOMER tools.
[0289] homer findPeaks: A step that can be employed to find peaks, using
HOMER.
[0290] homer find motifs: Searches for enriched transcription factor binding
motifs shared
within the peak sets discovered by MACS and HOMER.
[0291] homer annotate peaks: Annotates peaks with additional metadata
including the
nearest gene they are likely to be associated with. In some embodiments, this
step could be
replaced by another annotation strategy.
[0292] get gtf annotation: Retrieves transcriptome annotation files associated
with the
organism and genome version that the pipeline is running.
[0293] gtf coding transcripts only: Subsets the transcriptome annotation to
only protein
coding transcripts.
[0294] homer calculate per gene accessibility norm: Calculates a normalized
per-gene
accessibility value (e.g., normalized FPKM values) representing general
accessibility of a gene.
[0295] make homer ucsc file: Creates a .bedGraph file. In some embodiments,
this allows
for genome-wide pileups of fragment counts.
[0296] homer bedgraph to bigwig: Converts the bedGraph file to a binary-
compressed
bigWig file. In some cases, this file type is used by genome browsers to
visualize fragment
coverage across the genome.
[0297] macs callpeaks: Uses MACS2 to call accessibility peaks. In some
aspects, the peaks
include genomic regions that are enriched for or depleted of accessibility
and/or occupancy
signal as measured by quantifying ATAC-seq fragments. In some embodiments, the
peak
regions can be between 10 and 10,000 bp in size. Comparison of peaks between
samples may be
used downstream to identify active regulatory elements (optionally associated
with specific
genes or transcription factors) between conditions and/or be used to identify
signatures of
specific cell states or predictive of outcome of cell therapy, performance of
cell therapy, toxicity
and/or other characteristics of the cell composition or culture.
76
CA 03049461 2019-07-04
WO 2018/132518 PCT/US2018/013227
[0298] nucleoatac run: Runs NucleoATAC, a tool capable of calling and counting
transposase insertion sites within peak regions as well as output summary
tables on the data
from previous steps.
[0299] Additional downstream analyses can be used within the framework of the
analysis
pipeline, including thresholding and clustering approaches, predictive
modeling and/or
differential peak calling.
III. THERAPEUTIC OUTCOMES
[0300] In some embodiments of the provided methods, the epigenetic properties
(e.g.
chromatin accessibility) of the genome of the population of cells, such as a
population of cells
that is comprised in a composition of cells to be genetically engineered with
a recombinant
receptor or that has been genetically engineered with a recombinant receptor,
is or can be
correlated with the occurrence of an outcome of treatment of a cell therapy in
accord with the
provided methods.
[0301] In some embodiments of the provided methods, the epigenetic properties
(e.g.
chromatin accessibility) of the genome of the population of cells, such as a
population of cells
that is comprised in a composition of cells to be genetically engineered with
a recombinant
receptor or that has been genetically engineered with a recombinant receptor,
can be predictive
of and/or diagnose or detect the likelihood of the occurrence of an outcome of
treatment of a cell
therapy in accord with the provided methods.
[0302] In some embodiments, the subject has been, is receiving or will be
receiving a
therapy, such as a cell therapy, for example, for treating a disease or
condition in a subject. For
example, in some embodiments, the cell therapy is an adoptive cell therapy,
including a therapy
involving administration of cells expressing chimeric receptors specific for a
disease or disorder
of interest, such as chimeric antigen receptors (CARs) and/or other
recombinant antigen
receptors, as well as other adoptive immune cells and adoptive T cell
therapies. In some
embodiments, the adoptive cell therapy includes administration of a dose of
cells expressing a
recombinant receptor, such as a CAR or other recombinant antigen receptor. In
some
embodiments, chimeric receptors, such chimeric antigen receptor, contain one
or more domains
that combine a ligand-binding domain (e.g. antibody or antibody fragment) that
provides
specificity for a desired antigen (e.g., tumor antigen) with intracellular
signaling domains. In
some embodiments, the intracellular signaling domain is an activating
intracellular domain
portion, such as a T cell activating domain, providing a primary activation
signal. In some
77
CA 03049461 2019-07-04
WO 2018/132518 PCT/US2018/013227
embodiments, the intracellular signaling domain contains or additionally
contains a
costimulatory signaling domain to facilitate effector functions. In some
embodiments, chimeric
receptors when genetically engineered into immune cells can modulate T cell
activity, and, in
some cases, can modulate T cell differentiation or homeostasis, thereby
resulting in genetically
engineered cells with improved longevity, survival and/or persistence in vivo,
such as for use in
adoptive cell therapy methods.
A. Toxicity Outcome
[0303] In some embodiments, a toxic outcome in a subject to administration of
a therapeutic
agent (e.g. CAR T-cells) can be assessed or monitored. In some embodiments,
the toxic
outcome is or is associated with the presence of a toxic event, such as
cytokine release syndrome
(CRS), severe CRS (sCRS), macrophage activation syndrome, tumor lysis
syndrome, fever of at
least at or about 38 degrees Celsius for three or more days and a plasma level
of C-reactive
protein (CRP) of at least at or about 20 mg/dL, neurotoxicity and/or severe
neurotoxicity. In
some embodiments, the toxic outcome is a sign, or symptom, particular signs,
and symptoms
and/or quantities or degrees thereof which presence or absence may specify a
particular extent,
severity or level of toxicity in a subject. It is within the level of a
skilled artisan to specify or
determine a particular sign, symptom and/or quantities or degrees thereof that
are related to an
undesired toxic outcome of a therapeutic agent (e.g. CAR- T cells).
[0304] In some embodiments, the toxic outcome is an indicator associated with
the toxic
event. In some embodiments, the toxic outcome is the presence or absence of
one or more
biomarkers or the presence of absence of a level of one or more biomarkers. In
some
embodiments, the biomarker is a molecule present in the serum or other bodily
fluid or tissue
indicative of cytokine-release syndrome (CRS), severe CRS or CRS-related
outcomes. In some
embodiments, the biomarker is a molecule present in the serum or other bodily
fluid or tissue
indicative of neurotoxicity or severe neurotoxicity.
[0305] In some embodiments, the subject exhibits toxicity or a toxic outcome
if a toxic
event, such as CRS-related outcomes, e.g. if a serum level of an indicator of
CRS or other
biochemical indicator of the toxicity is more than at or about 10 times, more
than at or about 15
times, more than at or about 20 times, more than at or about 25 times, more
than at or about 50
times, more than at or about 75 times, more than at or about 100 times, more
than at or about
125 times, more than at or about 150 times, more than at or about 200 times,
or more than at or
78
CA 03049461 2019-07-04
WO 2018/132518 PCT/US2018/013227
about 250 times the baseline or pre-treatment level, such as the serum level
of the indicator
immediately prior to administration of the first dose of the therapeutic
agent.
[0306] In some aspects, the toxic outcome is or is associated with or
indicative of cytokine
release syndrome (CRS) or severe CRS (sCRS). CRS, e.g., sCRS, can occur in
some cases
following adoptive T cell therapy and administration to subjects of other
biological products.
See Davila et al., Sci Transl Med 6, 224ra25 (2014); Brentjens et al., Sci.
Transl. Med. 5,
177ra38 (2013); Grupp et al., N. Engl. J. Med. 368, 1509-1518 (2013); and
Kochenderfer et al.,
Blood 119, 2709-2720 (2012); Xu et al., Cancer Letters 343 (2014) 172-78.
[0307] Typically, CRS is caused by an exaggerated systemic immune response
mediated by,
for example, T cells, B cells, NK cells, monocytes, and/or macrophages. Such
cells may release
a large amount of inflammatory mediators such as cytokines and chemokines.
Cytokines may
trigger an acute inflammatory response and/or induce endothelial organ damage,
which may
result in microvascular leakage, heart failure, or death. Severe, life-
threatening CRS can lead to
pulmonary infiltration and lung injury, renal failure, or disseminated
intravascular coagulation.
Other severe, life-threatening toxicities can include cardiac toxicity,
respiratory distress,
neurologic toxicity and/or hepatic failure.
[0308] In the context of administering CAR-expressing cells, CRS typically
occurs 6-20
days after infusion of cells that express a CAR. See Xu et al., Cancer Letters
343 (2014) 172-
78. In some cases, CRS occurs less than 6 days or more than 20 days after CAR
T cell infusion.
The incidence and timing of CRS may be related to baseline cytokine levels or
tumor burden at
the time of infusion. Commonly, CRS involves elevated serum levels of
interferon (IFN)-y,
tumor necrosis factor (TNF)-a, and/or interleukin (IL)-2. Other cytokines that
may be rapidly
induced in CRS are IL-113, IL-6, IL-8, and IL-10.
[0309] Exemplary signs or symptoms associated with CRS include fever, rigors,
chills,
hypotension, dyspnea, acute respiratory distress syndrome (ARDS),
encephalopathy, aspartate
transaminase (AST)/alanine transaminase (ALT) elevation, renal failure,
cardiac disorders,
hypoxia, neurologic disturbances, and death. Neurological complications
include delirium,
seizure-like activity, confusion, word-finding difficulty, aphasia, and/or
becoming obtunded.
Other CRS-related signs or outcomes include fatigue, nausea, headache,
seizure, tachycardia,
myalgias, rash, acute vascular leak syndrome, liver function impairment, and
renal failure. In
some aspects, CRS is associated with an increase in one or more factors such
as serum-ferritin,
d-dimer, aminotransferases, lactate dehydrogenase and triglycerides, or with
hypofibrinogenemia or hepatosplenomegaly.
79
CA 03049461 2019-07-04
WO 2018/132518 PCT/US2018/013227
[0310] In some embodiments, signs or symptoms associated with CRS include one
or more
of: persistent fever, e.g., fever of a specified temperature, e.g., greater
than at or about 38
degrees Celsius, for two or more, e.g., three or more, e.g., four or more days
or for at least three
consecutive days; fever greater than at or about 38 degrees Celsius; elevation
of cytokines (e.g.
IFNy or IL-6); and/or at least one clinical sign of toxicity, such as
hypotension (e.g., as
measured by at least one intravenous vasoactive pressor); hypoxia (e.g.,
plasma oxygen (P02)
levels of less than at or about 90 %); and/or one or more neurologic disorders
(including mental
status changes, obtundation, and seizures).
[0311] Exemplary CRS-related outcomes include increased or high serum levels
of one or
more factors, including cytokines and chemokines and other factors associated
with CRS.
Exemplary outcomes further include increases in synthesis or secretion of one
or more of such
factors. Such synthesis or secretion can be by the T cell or a cell that
interacts with the T cell,
such as an innate immune cell or B cell.
[0312] In some embodiments, one or more inflammatory markers, e.g., cytokines
or
chemokines are monitored before, during, or after CAR treatment. In some
aspects, the one or
more cytokines or chemokines include IFN-y, TNF-a, IL-2, IL-113, IL-6, IL-7,
IL-8, IL-10, IL-
12, sIL-2Ra, granulocyte macrophage colony stimulating factor (GM-CSF), or
macrophage
inflammatory protein (MIP). In some embodiments, IFN-y, TNF-a, and IL-6 are
monitored.
[0313] In some embodiments, the presence of one or more biomarkers is
indicative of the
grade of, severity or extent of a toxic event, such as CRS or neurotoxicity.
In some
embodiments, the toxic outcome is a particular grade, severity or extent of a
toxic event, such as
a particular grade, severity or extent of CRS or neurotoxicity. In some
embodiments, the
presence of a toxic event about a certain grade, severity or extent can be a
dose-limiting toxicity.
In some embodiments, the absence of a toxic event or the presence of a toxic
event below a
certain grade, severity or extent can indicate the absence of a dose-limiting
toxicity.
[0314] CRS criteria that appear to correlate with the onset of CRS to predict
which patients
are more likely to be at risk for developing sCRS have been developed (see
Davilla et al.
Science translational medicine. 2014;6(224):224ra25). Factors include fevers,
hypoxia,
hypotension, neurologic changes, elevated serum levels of inflammatory
cytokines whose
treatment-induced elevation can correlate well with both pretreatment tumor
burden and sCRS
symptoms. Other guidelines on the diagnosis and management of CRS are known
(see e.g., Lee
et al, Blood. 2014;124(2):188-95). In some embodiments, the criteria
reflective of CRS grade
are those detailed in Table 1 below.
CA 03049461 2019-07-04
WO 2018/132518 PCT/US2018/013227
Table 1: Exemplary Grading Criteria for CRS
Grade Description of Symptoms
1 Not life-threatening, require only symptomatic treatment
such as antipyretics
Mild and anti-emetics (e.g., fever, nausea, fatigue, headache,
myalgias, malaise)
2 Require and respond to moderate intervention:
Moderate = Oxygen requirement < 40%, or
= Hypotension responsive to fluids or low dose of a single vasopressor, or
= Grade 2 organ toxicity (by CTCAE v4.0)
3 Require and respond to aggressive intervention:
Severe = Oxygen requirement? 40%, or
= Hypotension requiring high dose of a single vasopressor (e.g.,
norepinephrine > 20 g/kg/min, dopamine? 10 g/kg/min, phenylephrine
> 200 g/kg/min, or epinephrine? 10 g/kg/min), or
= Hypotension requiring multiple vasopressors (e.g., vasopressin + one of
the above agents, or combination vasopressors equivalent to > 20
g/kg/min norepinephrine), or
= Grade 3 organ toxicity or Grade 4 transaminitis (by CTCAE v4.0)
4 Life-threatening:
Life-threatening = Requirement for ventilator support, or
= Grade 4 organ toxicity (excluding transaminitis)
Death
Fatal
[0315] In some embodiments, the toxic outcome is severe CRS. In some
embodiments, the
toxic outcome is the absence of severe CRS (e.g. moderate or mild CRS). In
some
embodiments, severe CRS includes CRS with a grade of 3 or greater, such as set
forth in Table
1. In some embodiments, severe CRS includes CRS with a grade of 2 or higher,
such as grades
2, 3, 4 or 5 CRS.
[0316] In some embodiments, the level of the toxic outcome, e.g. the CRS-
related outcome,
e.g. the serum level of an indicator of CRS, is measured by ELISA. In some
embodiments,
fever and/or levels of C-reactive protein (CRP) can be measured. In some
embodiments,
subjects with a fever and a CRP > 15 mg/dL may be considered high-risk for
developing severe
CRS. In some embodiments, the CRS-associated serum factors or CRS-related
outcomes include
an increase in the level and/or concentration of inflammatory cytokines and/or
chemokines,
including Flt-3L, fracktalkine, granulocyte macrophage colony stimulating
factor (GM-CSF),
interleukin-1 beta (IL-113), IL-2, IL-5, IL-6, IL-7, IL-8, IL-10, IL-12,
interferon gamma (IFN-y),
macrophage inflammatory protein (M1P)-1, MIP-1, sIL-2Ra, or tumor necrosis
factor alpha
(TNFa). In some embodiments, the factor or outcome includes C reactive protein
(CRP). In
addition to being an early and easily measurable risk factor for CRS, CRP also
is a marker for
81
CA 03049461 2019-07-04
WO 2018/132518 PCT/US2018/013227
cell expansion. In some embodiments, subjects that are measured to have high
levels of CRP,
such as > 15 mg/dL, have CRS. In some embodiments, subjects that are measured
to have high
levels of CRP do not have CRS. In some embodiments, a measure of CRS includes
a measure
of CRP and another factor indicative of CRS.
[0317] In some aspects, the toxic outcome is or is associated with
neurotoxicity. In some
embodiments, signs or symptoms associated with a clinical risk of
neurotoxicity include
confusion, delirium, expressive aphasia, obtundation, myoclonus, lethargy,
altered mental status,
convulsions, seizure-like activity, seizures (optionally as confirmed by
electroencephalogram
(EEG)), elevated levels of beta amyloid (AP), elevated levels of glutamate,
and elevated levels
of oxygen radicals. In some embodiments, neurotoxicity is graded based on
severity (e.g., using
a Grade 1-5 scale (see, e.g., Guido Cavaletti & Paola Marmiroli Nature Reviews
Neurology 6,
657-666 (December 2010); National Cancer Institute¨Common Toxicity Criteria
version 4.03
(NCI-CTCAE v4.03). In some embodiments, a subject is deemed to develop "severe
neurotoxicity" in response to or secondary to administration of a cell therapy
or dose of cells
thereof, if, following administration, the subject displays symptoms that
limit self-care (e.g.
bathing, dressing and undressing, feeding, using the toilet, taking
medications) from among: 1)
symptoms of peripheral motor neuropathy, including inflammation or
degeneration of the
peripheral motor nerves; 2) symptoms of peripheral sensory neuropathy,
including inflammation
or degeneration of the peripheral sensory nerves, dysesthesia, such as
distortion of sensory
perception, resulting in an abnormal and unpleasant sensation, neuralgia, such
as intense painful
sensation along a nerve or a group of nerves, and/or paresthesia, such as
functional disturbances
of sensory neurons resulting in abnormal cutaneous sensations of tingling,
numbness, pressure,
cold and warmth in the absence of stimulus. In some embodiments, severe
neurotoxicity
includes neurotoxicity with a grade of 3 or greater, such as set forth in
Table 2. In some
embodiments, severe neurotoxicity includes neurotoxicity with a grade of 2 or
higher, such as
grades 2, 3, 4 or 5 neurotoxicity.
Table 2: Exemplary Grading Criteria for neurotoxicity
Grade Description of Symptoms
1 Mild or asymptomatic symptoms
Asymptomatic or Mild
2 Presence of symptoms that limit instrumental activities
of daily living (ADL),
Moderate such as preparing meals, shopping for groceries or clothes, using
the
telephone, managing money
3 Presence of symptoms that limit self-care ADL, such as
bathing, dressing and
Severe undressing, feeding self, using the toilet, taking
medications
82
CA 03049461 2019-07-04
WO 2018/132518 PCT/US2018/013227
Table 2: Exemplary Grading Criteria for neurotoxicity
Grade Description of Symptoms
4 Symptoms that are life-threatening, requiring urgent
intervention
Life-threatening
Death
Fatal
[0318] In some embodiments, the toxic outcome is a dose-limiting toxicity. In
some
embodiments, the toxic outcome is the absence of a dose-limiting toxicity. In
some
embodiments, a dose-limiting toxicity (DLT) is defined as any grade 3 or
higher toxicity as
assessed by any known or published guidelines for assessing the particular
toxicity, such as any
described herein and including the National Cancer Institute (NCI) Common
Terminology
Criteria for Adverse Events (CTCAE) version 4Ø
B. Response Outcome
[0319] In some embodiments, the therapeutic outcome is a response or efficacy
outcome of
the cell therapy, a toxicity outcome of the cell therapy, an immunogenic
response to the cell
therapy or is another characteristic or feature of the cell therapy (e.g.
persistence or expansion of
the cells in subject). In certain embodiments, the therapeutic outcome is a
therapeutic or
prophylactic efficacy outcome of the cell therapy. In some embodiments, the
response outcome
of the cell therapy includes efficacy outcome at particular dose. In some
aspects, the therapeutic
outcome of the cell therapy includes the dose of the cell therapy that is
needed to achieve a
response. In some aspects, persistence and/or expansion of the cells are
assessed.
[0320] In some embodiments, the response outcome in a subject to
administration of the cell
therapy can be monitored or assessed. In some embodiments, the response
outcome of the cell
therapy is a complete response (CR). In some embodiments, response outcome is
assessed by
monitoring the disease burden in the subject. In some embodiments, the
presence of no
response, a partial response or a clinical or complete response can be
assessed. In some
embodiments, the response outcome of the cell therapy is durability of
response.
[0321] In some embodiments, a partial response (PR) or complete response (CR)
is one in
which the therapeutic agent reduces or prevents the expansion or burden of the
disease or
condition in the subject. For example, where the disease or condition is a
tumor, reduced
disease burden exists or is present if there is a reduction in the tumor size,
bulk, metastasis,
percentage of blasts in the bone marrow or molecularly detectable cancer
and/or an
83
CA 03049461 2019-07-04
WO 2018/132518 PCT/US2018/013227
improvement prognosis or survival or other symptom associated with tumor
burden compared to
prior to treatment with the therapeutic agent (e.g. CAR T cells).
[0322] In some aspects, response rates in subjects, such as subjects with NHL,
are based on
the Lugano criteria. (Cheson et al., (2014) JCO 32(27):3059-3067; Johnson et
al., (2015)
Radiology 2:323-338; Cheson, B.D. (2015) Chin Clin Oncol 4(1):5). In some
aspects, response
assessment utilizes any of clinical, hematologic, and/or molecular methods. In
some aspects,
response assessed using the Lugano criteria involves the use of positron
emission tomography
(PET)¨computed tomography (CT) and/or CT as appropriate. PET-CT evaluations
may further
comprise the use of fluorodeoxyglucose (FDG) for FDG-avid lymphomas. In some
aspects,
where PET-CT will be used to assess response in FDG-avid histologies, a 5-
point scale may be
used. In some respects, the 5-point scale comprises the following criteria: 1,
no uptake above
background; 2, uptake < mediastinum; 3, uptake > mediastinum but < liver; 4,
uptake
moderately > liver; 5, uptake markedly higher than liver and/or new lesions;
X, new areas of
uptake unlikely to be related to lymphoma.
[0323] In some aspects, a complete response as described using the Lugano
criteria involves
a complete metabolic response and a complete radiologic response at various
measureable sites.
In some aspects, these sites include lymph nodes and extralymphatic sites,
wherein a CR is
described as a score of 1, 2, or 3 with or without a residual mass on the 5-
point scale, when PET-
CT is used. In some aspects, in Waldeyer's ring or extranodal sites with high
physiologic uptake
or with activation within spleen or marrow (e.g., with chemotherapy or myeloid
colony-
stimulating factors), uptake may be greater than normal mediastinum and/or
liver. In this
circumstance, complete metabolic response may be inferred if uptake at sites
of initial
involvement is no greater than surrounding normal tissue even if the tissue
has high physiologic
uptake. In some aspects, response is assessed in the lymph nodes using CT,
wherein a CR is
described as no extralymphatic sites of disease and target nodes/nodal masses
must regress to <
1.5 cm in longest transverse diameter of a lesion (LDi). Further sites of
assessment include the
bone marrow wherein PET-CT-based assessment should indicate a lack of evidence
of FDG-
avid disease in marrow and a CT-based assessment should indicate a normal
morphology, which
if indeterminate should be IHC negative. Further sites may include assessment
of organ
enlargement, which should regress to normal. In some aspects, nonmeasured
lesions and new
lesions are assessed, which in the case of CR should be absent (Cheson et al.,
(2014) JCO
32(27):3059-3067; Johnson et al., (2015) Radiology 2:323-338; Cheson, B.D.
(2015) Chin Clin
Oncol 4(1):5).
84
CA 03049461 2019-07-04
WO 2018/132518 PCT/US2018/013227
[0324] In some aspects, a partial response (PR) as described using the Lugano
criteria
involves a partial metabolic and/or radiological response at various
measureable sites. In some
aspects, these sites include lymph nodes and extralymphatic sites, wherein a
PR is described as a
score of 4 or 5 with reduced uptake compared with baseline and residual
mass(es) of any size,
when PET-CT is used. At interim, such findings can indicate responding
disease. At the end of
treatment, such findings can indicate residual disease. In some aspects,
response is assessed in
the lymph nodes using CT, wherein a PR is described as >50% decrease in sum of
product
dimensions (SPD) of up to 6 target measureable nodes and extranodal sites. If
a lesion is too
small to measure on CT, 5 mm x 5 mm is assigned as the default value; if the
lesion is no longer
visible, the value is 0 mm x 0 mm; for a node >5 mm x 5 mm, but smaller than
normal, actual
measurements are used for calculation. Further sites of assessment include the
bone marrow
wherein PET-CT-based assessment should indicate residual uptake higher than
uptake in normal
marrow but reduced compared with baseline (diffuse uptake compatible with
reactive changes
from chemotherapy allowed). In some aspects, if there are persistent focal
changes in the
marrow in the context of a nodal response, consideration should be given to
further evaluation
with MRI or biopsy, or an interval scan. In some aspects, further sites may
include assessment of
organ enlargement, where the spleen must have regressed by >50% in length
beyond normal. In
some aspects, nonmeasured lesions and new lesions are assessed, which in the
case of PR should
be absent/normal, regressed, but no increase. No response/stable disease (SD)
or progressive
disease (PD) can also be measured using PET-CT and/or CT based assessments.
(Cheson et al.,
(2014) JCO 32(27):3059-3067; Johnson et al., (2015) Radiology 2:323-338;
Cheson, B.D.
(2015) Chin Clin Oncol 4(1):5).
[0325] In some respects, progression-free survival (PFS) is described as the
length of time
during and after the treatment of a disease, such as cancer, that a subject
lives with the disease
but it does not get worse. In some aspects, objective response (OR) is
described as a measurable
response. In some aspects, objective response rate (ORR) is described as the
proportion of
patients who achieved CR or PR. In some aspects, overall survival (OS) is
described as the
length of time from either the date of diagnosis or the start of treatment for
a disease, such as
cancer, that subjects diagnosed with the disease are still alive. In some
aspects, event-free
survival (EFS) is described as the length of time after treatment for a cancer
ends that the subject
remains free of certain complications or events that the treatment was
intended to prevent or
delay. These events may include the return of the cancer or the onset of
certain symptoms, such
as bone pain from cancer that has spread to the bone, or death.
CA 03049461 2019-07-04
WO 2018/132518 PCT/US2018/013227
[0326] In some embodiments, the measure of duration of response (DOR) includes
the time
from documentation of tumor response to disease progression. In some
embodiments, the
parameter for assessing response can include durable response, e.g., response
that persists after a
period of time from initiation of therapy and/or long-lasting positive
response to therapy. In
some embodiments, durable response is indicated by the response rate at
approximately 1, 2, 3,
4, 5, 6, 7, 8, 9, 10, 11, 12, 18 or 24 months after initiation of therapy. In
some embodiments, the
response is durable for greater than 3 months or greater than 6 months. In
some embodiments,
durable response is response measured at month 3 after administration of
therapy, e.g., a 3-
month response. In some embodiments, durable response is response measured at
month 6 after
administration of therapy, e.g., a 6-month response.
[0327] In some aspects, the RECIST criteria is used to determine objective
tumor response;
in some aspects, in solid tumors. (Eisenhauer et al., European Journal of
Cancer 45 (2009) 228-
247.) In some aspects, the RECIST criteria is used to determine objective
tumor response for
target lesions. In some respects, a complete response as determined using
RECIST criteria is
described as the disappearance of all target lesions and any pathological
lymph nodes (whether
target or non-target) must have reduction in short axis to <10 mm. In other
aspects, a partial
response as determined using RECIST criteria is described as at least a 30%
decrease in the sum
of diameters of target lesions, taking as reference the baseline sum
diameters. In other aspects,
progressive disease (PD) is described as at least a 20% increase in the sum of
diameters of target
lesions, taking as reference the smallest sum on study (this includes the
baseline sum if that is
the smallest on study). In addition to the relative increase of 20%, the sum
must also
demonstrate an absolute increase of at least 5 mm (in some aspects the
appearance of one or
more new lesions is also considered progression). In other aspects, stable
disease (SD) is
described as neither sufficient shrinkage to qualify for PR nor sufficient
increase to qualify for
PD, taking as reference the smallest sum diameters while on study.
[0328] In some embodiments, the disease or condition is a tumor and a
reduction in disease
burden is a reduction in tumor size. In some embodiments, the disease burden
reduction is
indicated by a reduction in one or more factors, such as load or number of
disease cells in the
subject or fluid or organ or tissue thereof, the mass or volume of a tumor, or
the degree or extent
of metastases. In some embodiments, disease burden, e.g. tumor burden, can be
assessed or
monitored for the extent of morphological disease and/or minimal residual
disease.
[0329] In some embodiments, the burden of a disease or condition in the
subject is detected,
assessed, or measured. Disease burden may be detected in some aspects by
detecting the total
86
CA 03049461 2019-07-04
WO 2018/132518 PCT/US2018/013227
number of disease or disease-associated cells, e.g., tumor cells, in the
subject, or in an organ,
tissue, or bodily fluid of the subject, such as blood or serum. In some
embodiments, disease
burden, e.g. tumor burden, is assessed by measuring the mass of a solid tumor
and/or the number
or extent of metastases. In some aspects, survival of the subject, survival
within a certain time
period, extent of survival, presence or duration of event-free or symptom-free
survival, or
relapse-free survival, is assessed. In some embodiments, any symptom of the
disease or
condition is assessed. In some embodiments, the measure of disease or
condition burden is
specified.
[0330] In some embodiments, disease burden can encompass a total number of
cells of the
disease in the subject or in an organ, tissue, or bodily fluid of the subject,
such as the organ or
tissue of the tumor or another location, e.g., which would indicate
metastasis. For example,
tumor cells may be detected and/or quantified in the blood or bone marrow in
the context of
certain hematological malignancies.
[0331] Disease burden can include, in some embodiments, the mass of a tumor,
the number
or extent of metastases and/or the percentage of blast cells present in the
bone marrow.
[0332] In some embodiments, a subject has leukemia. The extent of disease
burden can be
determined by assessment of residual leukemia in blood or bone marrow.
[0333] In some aspects, response rates in subjects, such as subjects with
chronic
lymphocytic leukemia (CLL), are based on the International Workshop on Chronic
Lymphocytic
Leukemia (IWCLL) response criteria (Hallek, et al., Blood 2008, Jun 15;
111(12): 5446-5456).
In some aspects, these criteria are described as follows: complete remission
(CR), which in some
aspects requires the absence of peripheral blood clonal lymphocytes by
immunophenotyping,
absence of lymphadenopathy, absence of hepatomegaly or splenomegaly, absence
of
constitutional symptoms and satisfactory blood counts; complete remission with
incomplete
marrow recovery (CRi), which in some aspects is described as CR above, but
without normal
blood counts; partial remission (PR), which in some aspects is described as >
50% fall in
lymphocyte count, > 50% reduction in lymphadenopathy or > 50% reduction in
liver or spleen,
together with improvement in peripheral blood counts; progressive disease
(PD), which in some
aspects is described as > 50% rise in lymphocyte count to > 5 x10⁹/L, > 50%
increase in
lymphadenopathy, > 50% increase in liver or spleen size, Richter's
transformation, or new
cytopenias due to CLL; and stable disease, which in some aspects is described
as not meeting
criteria for CR, CRi, PR or PD.
87
CA 03049461 2019-07-04
WO 2018/132518 PCT/US2018/013227
[0334] In some embodiments, the subjects exhibits a CR or OR if, within 1
month of the
administration of the dose of cells, lymph nodes in the subject are less than
at or about 20 mm in
size, less than at or about 10 mm in size or less than at or about 10 mm in
size.
[0335] In some embodiments, an index clone of the CLL is not detected in the
bone marrow
of the subject (or in the bone marrow of greater than 50%, 60%, 70%, 80%, 90%
or more of the
subjects treated according to the methods. In some embodiments, an index clone
of the CLL is
assessed by IgH deep sequencing. In some embodiments, the index clone is not
detected at a
time that is at or about or at least at or about 1, 2, 3, 4, 5, 6, 12, 18 or
24 months following the
administration of the cells.
[0336] In some embodiments, a response outcome exists if there is a reduction
in the percent
of blasts in the bone marrow compared to the percent of blasts in the bone
marrow prior to
treatment with the therapeutic agent. In some embodiments, reduction of
disease burden exists
if there is a decrease or reduction of at least or at least about 20%, 30%,
40%, 50%, 60%, 70%,
80%, 90%, 95% or more in the number or percentage of blasts in the bone marrow
compared to
the number or percent of blasts in the bone marrow prior to treatment.
[0337] In some embodiments, the subject exhibits a response if the subject
does not exhibit
morphologic disease (non-morphological disease) or does not exhibit
substantial morphologic
disease. In some embodiments, a subject exhibits morphologic disease if there
are greater than
or equal to 5% blasts in the bone marrow, for example, as detected by light
microscopy. In
some embodiments, a subject exhibits complete or clinical remission if there
are less than 5%
blasts in the bone marrow.
[0338] In some embodiments, a subject exhibits reduced or decreased disease
burden if they
exhibited morphological disease prior to treatment and exhibit complete
remission (e.g., fewer
than 5% blasts in bone marrow) with or without molecular disease (e.g.,
minimum residual
disease (MRD) that is molecularly detectable, e.g., as detected by flow
cytometry or quantitative
PCR) after treatment. In some embodiments, a subject exhibits reduced or
decreased disease
burden if they exhibited molecular disease prior to treatment and do not
exhibit molecular
disease after treatment.
[0339] In some embodiments, a subject may exhibit complete remission, but a
small
proportion of morphologically undetectable (by light microscopy techniques)
residual leukemic
cells are present. A subject is said to exhibit minimum residual disease (MRD)
if the subject
exhibits less than 5% blasts in the bone marrow and exhibits molecularly
detectable cancer. In
88
CA 03049461 2019-07-04
WO 2018/132518 PCT/US2018/013227
some embodiments, molecularly detectable cancer can be assessed using any of a
variety of
molecular techniques that permit sensitive detection of a small number of
cells.
[0340] In some embodiments, the response outcome of the cell therapy is a
molecular
response outcome. In some aspects, such techniques include PCR assays, which
can determine
unique Ig/T-cell receptor gene rearrangements or fusion transcripts produced
by chromosome
translocations. In some embodiments, flow cytometry can be used to identify
cancer cell based
on leukemia-specific immunophenotypes. In some embodiments, molecular
detection of cancer
can detect as few as 1 leukemia or blast cell in 100,000 normal cells or 1
leukemia or blast cell
in 10,000 normal cells. In some embodiments, a subject exhibits minimum
residual disease
(MRD) that is molecularly detectable if at least or greater than 1 leukemia
cell in 100,000 cells
is detected, such as by PCR or flow cytometry.
[0341] In some embodiments, the disease burden of a subject is molecularly
undetectable or
MRD-, such that, in some cases, no leukemia cells are able to be detected in
the subject using
PCR or flow cytometry techniques.
[0342] In some embodiments the response outcome is the absence of a CR or the
presence of
a complete response (CR) in which the subject achieves or exhibits minimal
residual disease or
molecular detectable disease status. In some embodiments, the response outcome
is the
presence of a CR with molecularly detectable disease or the presence of a CR
without
molecularly detectable disease. In some embodiments, subjects are assessed for
disease burden
using methods as described herein, such as methods that assess blasts in bone
marrow or
molecular disease by flow cytometry or qPCR methods.
[0343] In some embodiments of the methods provided herein, response is
determined by
complete response (CR) and/or objective response (OR); and/or the subject
exhibits CR, OR,
lymph nodes of less than at or about 20 mm in size, within 1 month of the
administration of the
dose of cells; and/or an index clone of the disease or condition, such as the
CLL or NHL, is not
detected in the bone marrow of the subject (or in the bone marrow of greater
than 50 % of
subjects treated according to the methods), optionally as assessed by IgH deep
sequencing,
optionally at a time that is at or about or at least at or about 1, 2, 3, 4,
5, 6, 12, 18, or 24 months
following the administration of the cell dose.
[0344] In some aspects, toxic outcomes and/or presence or absence of a host
immune
response are assessed. In some embodiments, the response outcome of the cell
therapy is a lack
of immune response. In some embodiments, the information about toxic outcome
and response
outcome can be jointly assessed in a subject, such as assessed in parallel or
at around the same
89
CA 03049461 2019-07-04
WO 2018/132518 PCT/US2018/013227
time or substantially the same time, and used to inform the dosing decisions
or adaptive
treatments of subjects.
[0345] In some embodiments, the toxic outcome or response outcome is present
and/or can
be assessed or monitored. In some embodiments, the toxic outcome and response
outcome are
monitored at a time at which a toxicity outcome and a response outcome are
present. In some
embodiments, the time at which a toxic outcome or response outcome is assessed
is within or
within about a period of time in which a symptom of toxicity or efficacy is
detectable in a
subject or at such time in which an adverse outcome associated with non-
response or toxicity is
not detectable in the subject. In some embodiments, the time period is near or
substantially near
to when the toxic outcome and/or response outcome has peaked in the subject.
[0346] In some embodiments, the toxic outcome or response outcome is present
or can be
assessed or monitored at such time period where only a single dose of the
therapeutic agent is
administered. In the context of adoptive cell therapy, administration of a
given "dose"
encompasses administration of the given amount or number of cells as a single
composition
and/or single uninterrupted administration, e.g., as a single injection or
continuous infusion, and
also encompasses administration of the given amount or number of cells as a
split dose,
provided in multiple individual compositions or infusions, over a specified
period of time, which
is no more than 3 days. Thus, in some contexts, the first dose is a single or
continuous
administration of the specified number of cells, given or initiated at a
single point in time. In
some contexts, however, the first dose is administered in multiple injections
or infusions over a
period of no more than three days, such as once a day for three days or for
two days or by
multiple infusions over a single day period.
[0347] The term "split dose" refers to a dose that is split so that it is
administered over more
than one day. This type of dosing is encompassed by the present methods and is
considered to
be a single dose.
[0348] As used herein, "first dose" is used to describe the timing of a given
dose, which, in
some cases can be the only dose or can be followed by one or more repeat or
additional doses.
The term does not necessarily imply that the subject has never before received
a dose of a
therapeutic agent even that the subject has not before received a dose of the
same or
substantially the same therapeutic agent.
[0349] In some embodiments, the toxic outcome and response outcome can be
assessed by
monitoring one or more symptoms or events associated with a toxic outcome and
one or more
symptoms or events associated with a response outcome.
CA 03049461 2019-07-04
WO 2018/132518 PCT/US2018/013227
IV. ENGINEERING CELLS FOR ADOPTIVE CELL THERAPY
[0350] In some embodiments, the provided methods can be used to assess cells
for adoptive
cell therapy. In any of the provided methods, the epigenetic and/or epigenomic
analysis of cells
for cell therapy can include steps to assess and analyze changes or
modifications in a genomic
locus or a genome, such as chromatin accessibility, nucleosome occupancy,
histone
modification, spatial chromosomal conformation, transcription factor occupancy
and/or DNA
methylation. In some embodiments, the provided methods involve one or more
epigenetic
and/or epigenomic analysis step of the cells. In some aspects, the epigenetic
and/or epigenomic
analysis is performed prior to genetic engineering of the cells. In some
cases, the epigenetic
and/or epigenomic analysis is performed after the cells have been genetically
engineered with a
recombinant receptor.
[0351] In some embodiments, the analysis includes a large-scale analysis,
e.g., analysis of a
plurality of genetic loci or a genome-wide analysis of the cells. In some
embodiments, the
epigenetic and/or epigenomic analysis includes determining the epigenetic
properties of a cell,
e.g., an engineered cell for cell therapy. In some embodiments, the cell
therapy is a T cell
therapy, for example, a tumor infiltrating lymphocytic (TIL) therapy, a
transgenic TCR therapy
or a chimeric antigen receptor (CAR)-expressing T cell therapy.
A. Cells
[0352] The cells generally are eukaryotic cells, such as mammalian cells, and
typically are
human cells, e.g., those derived from human subjects and engineered, for
example, to express
the recombinant receptors. In some embodiments, the cells are derived from the
blood, bone
marrow, lymph, or lymphoid organs, are cells of the immune system, such as
cells of the innate
or adaptive immunity, e.g., myeloid or lymphoid cells, including lymphocytes,
typically T cells
and/or NK cells. Other exemplary cells include stem cells, such as multipotent
and pluripotent
stem cells, including induced pluripotent stem cells (iPSCs). The cells
typically are primary
cells, such as those isolated directly from a subject and/or isolated from a
subject and frozen. In
some embodiments, the cells include one or more subsets of T cells or other
cell types, such as
whole T cell populations, CD4+ cells, CD8+ cells, and subpopulations thereof,
such as those
defined by function, activation state, maturity, potential for
differentiation, expansion,
recirculation, localization, and/or persistence capacities, antigen-
specificity, type of antigen
receptor, presence in a particular organ or compartment, marker or cytokine
secretion properties,
and/or degree of differentiation. With reference to the subject to be treated,
the cells may be
91
CA 03049461 2019-07-04
WO 2018/132518 PCT/US2018/013227
allogeneic and/or autologous. Among the methods include off-the-shelf methods.
In some
aspects, such as for off-the-shelf technologies, the cells are pluripotent
and/or multipotent, such
as stem cells, such as induced pluripotent stem cells (iPSCs). In some
embodiments, the
methods include isolating cells from the subject, preparing, processing,
culturing, and/or
engineering them, and re-introducing them into the same subject, before or
after
cryopreservation.
[0353] Among the sub-types and subpopulations of T cells and/or of CD4+ and/or
of CD8+
T cells are naïve T (TN) cells, effector T cells (TEFF), memory T cells and
sub-types thereof, such
as stem cell memory T (Tscm), central memory T (Tcm), effector memory T (TEm),
or terminally
differentiated effector memory T cells, tumor-infiltrating lymphocytes (TIL),
immature T cells,
mature T cells, helper T cells, cytotoxic T cells, mucosa-associated invariant
T (MAIT) cells,
naturally occurring and adaptive regulatory T (Treg) cells, helper T cells,
such as TH1 cells,
TH2 cells, TH3 cells, TH17 cells, TH9 cells, TH22 cells, follicular helper T
cells, alpha/beta T
cells, and delta/gamma T cells.
[0354] In some embodiments, the cells are natural killer (NK) cells. In some
embodiments,
the cells are monocytes or granulocytes, e.g., myeloid cells, macrophages,
neutrophils, dendritic
cells, mast cells, eosinophils, and/or basophils.
In some embodiments, the cells include one or more nucleic acids introduced
via genetic
engineering, and thereby express recombinant or genetically engineered
products of such nucleic
acids. In some embodiments, the nucleic acids are heterologous, i.e., normally
not present in a
cell or sample obtained from the cell, such as one obtained from another
organism or cell, which
for example, is not ordinarily found in the cell being engineered and/or an
organism from which
such cell is derived. In some embodiments, the nucleic acids are not naturally
occurring, such as
a nucleic acid not found in nature, including one comprising chimeric
combinations of nucleic
acids encoding various domains from multiple different cell types.
B. Preparation of Cells for Engineering
[0355] In some embodiments, preparation of the engineered cells includes one
or more
culture and/or preparation steps. The cells for introduction of the nucleic
acid encoding the
transgenic receptor such as the CAR, may be isolated from a sample, such as a
biological
sample, e.g., one obtained from or derived from a subject. In some
embodiments, the subject
from which the cell is isolated is one having the disease or condition or in
need of a cell therapy
or to which cell therapy will be administered. The subject in some embodiments
is a human in
92
CA 03049461 2019-07-04
WO 2018/132518 PCT/US2018/013227
need of a particular therapeutic intervention, such as the adoptive cell
therapy for which cells are
being isolated, processed, and/or engineered.
[0356] Accordingly, the cells in some embodiments are primary cells, e.g.,
primary human
cells. The samples include tissue, fluid, and other samples taken directly
from the subject, as
well as samples resulting from one or more processing steps, such as
separation, centrifugation,
genetic engineering (e.g. transduction with viral vector), washing, and/or
incubation. The
biological sample can be a sample obtained directly from a biological source
or a sample that is
processed. Biological samples include, but are not limited to, body fluids,
such as blood,
plasma, serum, cerebrospinal fluid, synovial fluid, urine and sweat, tissue
and organ samples,
including processed samples derived therefrom.
[0357] In some aspects, the sample from which the cells are derived or
isolated is blood or a
blood-derived sample, or is or is derived from an apheresis or leukapheresis
product. Exemplary
samples include whole blood, peripheral blood mononuclear cells (PBMCs),
leukocytes, bone
marrow, thymus, tissue biopsy, tumor, leukemia, lymphoma, lymph node, gut
associated
lymphoid tissue, mucosa associated lymphoid tissue, spleen, other lymphoid
tissues, liver, lung,
stomach, intestine, colon, kidney, pancreas, breast, bone, prostate, cervix,
testes, ovaries, tonsil,
or other organ, and/or cells derived therefrom. Samples include, in the
context of cell therapy,
e.g., adoptive cell therapy, samples from autologous and allogeneic sources.
[0358] In some aspects, the cells of the second dose are derived from the same
apheresis
product as the cells of the first dose. In some embodiments, the cells of
multiple doses, e.g.,
first, second, third, and so forth, are derived from the same apheresis
product.
[0359] In other embodiments, the cells of the second (or other subsequent)
dose are derived
from an apheresis product that is distinct from that from which the cells of
the first (or other
prior) dose are derived.
[0360] In some embodiments, the cells are derived from cell lines, e.g., T
cell lines. The
cells in some embodiments are obtained from a xenogeneic source, for example,
from mouse,
rat, non-human primate, and pig.
[0361] In some embodiments, isolation of the cells includes one or more
preparation and/or
non-affinity based cell separation steps. In some examples, cells are washed,
centrifuged, and/or
incubated in the presence of one or more reagents, for example, to remove
unwanted
components, enrich for desired components, lyse or remove cells sensitive to
particular reagents.
In some examples, cells are separated based on one or more property, such as
density, adherent
properties, size, sensitivity and/or resistance to particular components.
93
CA 03049461 2019-07-04
WO 2018/132518 PCT/US2018/013227
[0362] In some examples, cells from the circulating blood of a subject are
obtained, e.g., by
apheresis or leukapheresis. The samples, in some aspects, contain lymphocytes,
including T
cells, monocytes, granulocytes, B cells, other nucleated white blood cells,
red blood cells, and/or
platelets, and in some aspects contains cells other than red blood cells and
platelets.
[0363] In some embodiments, the blood cells collected from the subject are
washed, e.g., to
remove the plasma fraction and to place the cells in an appropriate buffer or
media for
subsequent processing steps. In some embodiments, the cells are washed with
phosphate
buffered saline (PBS). In some embodiments, the wash solution lacks calcium
and/or
magnesium and/or many or all divalent cations. In some aspects, a washing step
is
accomplished a semi-automated "flow-through" centrifuge (for example, the Cobe
2991 cell
processor, Baxter) according to the manufacturer's instructions. In some
aspects, a washing step
is accomplished by tangential flow filtration (TFF) according to the
manufacturer's instructions.
In some embodiments, the cells are resuspended in a variety of biocompatible
buffers after
washing, such as, for example, Ca/Mg free PBS. In certain embodiments,
components of a
blood cell sample are removed and the cells directly resuspended in culture
media.
[0364] In some embodiments, the methods include density-based cell separation
methods,
such as the preparation of white blood cells from peripheral blood by lysing
the red blood cells
and centrifugation through a Percoll or Ficoll gradient.
[0365] In some embodiments, the isolation methods include the separation of
different cell
types based on the expression or presence in the cell of one or more specific
molecules, such as
surface markers, e.g., surface proteins, intracellular markers, or nucleic
acid. In some
embodiments, any known method for separation based on such markers may be
used. In some
embodiments, the separation is affinity- or immunoaffinity-based separation.
For example, the
isolation in some aspects includes separation of cells and cell populations
based on the cells'
expression or expression level of one or more markers, typically cell surface
markers, for
example, by incubation with an antibody or binding partner that specifically
binds to such
markers, followed generally by washing steps and separation of cells having
bound the antibody
or binding partner, from those cells having not bound to the antibody or
binding partner.
[0366] Such separation steps can be based on positive selection, in which the
cells having
bound the reagents are retained for further use, and/or negative selection, in
which the cells
having not bound to the antibody or binding partner are retained. In some
examples, both
fractions are retained for further use. In some aspects, negative selection
can be particularly
useful where no antibody is available that specifically identifies a cell type
in a heterogeneous
94
CA 03049461 2019-07-04
WO 2018/132518 PCT/US2018/013227
population, such that separation is best carried out based on markers
expressed by cells other
than the desired population.
[0367] The separation need not result in 100% enrichment or removal of a
particular cell
population or cells expressing a particular marker. For example, positive
selection of or
enrichment for cells of a particular type, such as those expressing a marker,
refers to increasing
the number or percentage of such cells, but need not result in a complete
absence of cells not
expressing the marker. Likewise, negative selection, removal, or depletion of
cells of a particular
type, such as those expressing a marker, refers to decreasing the number or
percentage of such
cells, but need not result in a complete removal of all such cells.
[0368] In some examples, multiple rounds of separation steps are carried out,
where the
positively or negatively selected fraction from one step is subjected to
another separation step,
such as a subsequent positive or negative selection. In some examples, a
single separation step
can deplete cells expressing multiple markers simultaneously, such as by
incubating cells with a
plurality of antibodies or binding partners, each specific for a marker
targeted for negative
selection. Likewise, multiple cell types can simultaneously be positively
selected by incubating
cells with a plurality of antibodies or binding partners expressed on the
various cell types.
[0369] For example, in some aspects, specific subpopulations of T cells, such
as cells
positive or expressing high levels of one or more surface markers, e.g.,
CD28+, CD62L+,
CCR7+, CD27+, CD127+, CD4+, CD8+, CD45RA+, and/or CD45R0+ T cells, are
isolated by
positive or negative selection techniques.
[0370] For example, CD3+, CD28+ T cells can be positively selected using anti-
CD3/anti-
CD28 conjugated magnetic beads (e.g., DYNABEADS M-450 CD3/CD28 T Cell
Expander).
[0371] In some embodiments, isolation is carried out by enrichment for a
particular cell
population by positive selection, or depletion of a particular cell
population, by negative
selection. In some embodiments, positive or negative selection is accomplished
by incubating
cells with one or more antibodies or other binding agent that specifically
bind to one or more
surface markers expressed or expressed (marker) at a relatively higher level
(marker") on the
positively or negatively selected cells, respectively.
[0372] In some embodiments, T cells are separated from a PBMC sample by
negative
selection of markers expressed on non-T cells, such as B cells, monocytes, or
other white blood
cells, such as CD14. In some aspects, a CD4+ or CD8+ selection step is used to
separate CD4+
helper and CD8+ cytotoxic T cells. Such CD4+ and CD8+ populations can be
further sorted into
CA 03049461 2019-07-04
WO 2018/132518 PCT/US2018/013227
sub-populations by positive or negative selection for markers expressed or
expressed to a
relatively higher degree on one or more naive, memory, and/or effector T cell
subpopulations.
[0373] In some embodiments, CD8+ cells are further enriched for or depleted of
naive,
central memory, effector memory, and/or central memory stem cells, such as by
positive or
negative selection based on surface antigens associated with the respective
subpopulation. In
some embodiments, enrichment for central memory T (Tcm) cells is carried out
to increase
efficacy, such as to improve long-term survival, expansion, and/or engraftment
following
administration, which in some aspects is particularly robust in such sub-
populations. See
Terakura et al. (2012) Blood.1:72-82; Wang et al. (2012) J Immunother.
35(9):689-701. In
some embodiments, combining Tcm-enriched CD8+ T cells and CD4 + T cells
further enhances
efficacy.
[0374] In embodiments, memory T cells are present in both CD62L + and CD62L-
subsets of
CD8+ peripheral blood lymphocytes. PBMC can be enriched for or depleted of
CD62L-CD8+
and/or CD62L+CD8+ fractions, such as using anti-CD8 and anti-CD62L antibodies.
[0375] In some embodiments, the enrichment for central memory T (Tcm) cells is
based on
positive or high surface expression of CD45RO, CD62L, CCR7, CD28, CD3, and/or
CD127; in
some aspects, it is based on negative selection for cells expressing or highly
expressing
CD45RA and/or granzyme B. In some aspects, isolation of a CD8+ population
enriched for Tcm
cells is carried out by depletion of cells expressing CD4, CD14, CD45RA, and
positive selection
or enrichment for cells expressing CD62L. In one aspect, enrichment for
central memory T
(Tcm) cells is carried out starting with a negative fraction of cells selected
based on CD4
expression, which is subjected to a negative selection based on expression of
CD14 and
CD45RA, and a positive selection based on CD62L. Such selections in some
aspects are carried
out simultaneously and in other aspects are carried out sequentially, in
either order. In some
aspects, the same CD4 expression-based selection step used in preparing the
CD8+ cell
population or subpopulation, also is used to generate the CD4 + cell
population or sub-
population, such that both the positive and negative fractions from the CD4-
based separation are
retained and used in subsequent steps of the methods, optionally following one
or more further
positive or negative selection steps.
[0376] In a particular example, a sample of PBMCs or other white blood cell
sample is
subjected to selection of CD4 + cells, where both the negative and positive
fractions are retained.
The negative fraction then is subjected to negative selection based on
expression of CD14 and
CD45RA or CD19, and positive selection based on a marker characteristic of
central memory T
96
CA 03049461 2019-07-04
WO 2018/132518 PCT/US2018/013227
cells, such as CD62L or CCR7, where the positive and negative selections are
carried out in
either order.
[0377] CD4+ T helper cells are sorted into naïve, central memory, and effector
cells by
identifying cell populations that have cell surface antigens. CD4+ lymphocytes
can be obtained
by standard methods. In some embodiments, naive CD4+ T lymphocytes are CD45R0-
,
CD45RA , CD62L+, CD4+ T cells. In some embodiments, central memory CD4+ cells
are
CD62L+ and CD45R0 . In some embodiments, effector CD4+ cells are CD62L- and
CD45R0-.
[0378] In one example, to enrich for CD4+ cells by negative selection, a
monoclonal
antibody cocktail typically includes antibodies to CD14, CD20, CD11b, CD16,
HLA-DR, and
CD8. In some embodiments, the antibody or binding partner is bound to a solid
support or
matrix, such as a magnetic bead or paramagnetic bead, to allow for separation
of cells for
positive and/or negative selection. For example, in some embodiments, the
cells and cell
populations are separated or isolated using immunomagnetic (or
affinitymagnetic) separation
techniques (reviewed in Methods in Molecular Medicine, vol. 58: Metastasis
Research
Protocols, Vol. 2: Cell Behavior In Vitro and In Vivo, p 17-25 Edited by: S.
A. Brooks and U.
Schumacher 0 Humana Press Inc., Totowa, NJ).
[0379] In some aspects, the sample or composition of cells to be separated is
incubated with
small, magnetizable or magnetically responsive material, such as magnetically
responsive
particles or microparticles, such as paramagnetic beads (e.g., such as
Dynalbeads or MACS
beads). The magnetically responsive material, e.g., particle, generally is
directly or indirectly
attached to a binding partner, e.g., an antibody, that specifically binds to a
molecule, e.g.,
surface marker, present on the cell, cells, or population of cells that it is
desired to separate, e.g.,
that it is desired to negatively or positively select.
[0380] In some embodiments, the magnetic particle or bead comprises a
magnetically
responsive material bound to a specific binding member, such as an antibody or
other binding
partner. There are many well-known magnetically responsive materials used in
magnetic
separation methods. Suitable magnetic particles include those described in
Molday, U.S. Pat.
No. 4,452,773, and in European Patent Specification EP 452342 B, which are
hereby
incorporated by reference. Colloidal sized particles, such as those described
in Owen U.S. Pat.
No. 4,795,698, and Liberti et al., U.S. Pat. No. 5,200,084 are other examples.
[0381] The incubation generally is carried out under conditions whereby the
antibodies or
binding partners, or molecules, such as secondary antibodies or other
reagents, which
97
CA 03049461 2019-07-04
WO 2018/132518 PCT/US2018/013227
specifically bind to such antibodies or binding partners, which are attached
to the magnetic
particle or bead, specifically bind to cell surface molecules if present on
cells within the sample.
[0382] In some aspects, the sample is placed in a magnetic field, and those
cells having
magnetically responsive or magnetizable particles attached thereto will be
attracted to the
magnet and separated from the unlabeled cells. For positive selection, cells
that are attracted to
the magnet are retained; for negative selection, cells that are not attracted
(unlabeled cells) are
retained. In some aspects, a combination of positive and negative selection is
performed during
the same selection step, where the positive and negative fractions are
retained and further
processed or subject to further separation steps.
[0383] In certain embodiments, the magnetically responsive particles are
coated in primary
antibodies or other binding partners, secondary antibodies, lectins, enzymes,
or streptavidin. In
certain embodiments, the magnetic particles are attached to cells via a
coating of primary
antibodies specific for one or more markers. In certain embodiments, the
cells, rather than the
beads, are labeled with a primary antibody or binding partner, and then cell-
type specific
secondary antibody- or other binding partner (e.g., streptavidin)-coated
magnetic particles, are
added. In certain embodiments, streptavidin-coated magnetic particles are used
in conjunction
with biotinylated primary or secondary antibodies.
[0384] In some embodiments, the magnetically responsive particles are left
attached to the
cells that are to be subsequently incubated, cultured and/or engineered; in
some aspects, the
particles are left attached to the cells for administration to a patient. In
some embodiments, the
magnetizable or magnetically responsive particles are removed from the cells.
Methods for
removing magnetizable particles from cells are known and include, e.g., the
use of competing
non-labeled antibodies, and magnetizable particles or antibodies conjugated to
cleavable linkers.
In some embodiments, the magnetizable particles are biodegradable.
[0385] In some embodiments, the affinity-based selection is via magnetic-
activated cell
sorting (MACS) (Miltenyi Biotec, Auburn, CA). Magnetic Activated Cell Sorting
(MACS)
systems are capable of high-purity selection of cells having magnetized
particles attached
thereto. In certain embodiments, MACS operates in a mode wherein the non-
target and target
species are sequentially eluted after the application of the external magnetic
field. That is, the
cells attached to magnetized particles are held in place while the unattached
species are eluted.
Then, after this first elution step is completed, the species that were
trapped in the magnetic field
and were prevented from being eluted are freed in some manner such that they
can be eluted and
98
CA 03049461 2019-07-04
WO 2018/132518 PCT/US2018/013227
recovered. In certain embodiments, the non-target cells are labelled and
depleted from the
heterogeneous population of cells.
[0386] In certain embodiments, the isolation or separation is carried out
using a system,
device, or apparatus that carries out one or more of the isolation, cell
preparation, separation,
processing, incubation, culture, and/or formulation steps of the methods. In
some aspects, the
system is used to carry out each of these steps in a closed or sterile
environment, for example, to
minimize error, user handling and/or contamination. In one example, the system
is a system as
described in International Patent Application, Publication Number
W02009/072003, or US
20110003380 Al.
[0387] In some embodiments, the system or apparatus carries out one or more,
e.g., all, of
the isolation, processing, engineering, and formulation steps in an integrated
or self-contained
system, and/or in an automated or programmable fashion. In some aspects, the
system or
apparatus includes a computer and/or computer program in communication with
the system or
apparatus, which allows a user to program, control, assess the outcome of,
and/or adjust various
aspects of the processing, isolation, engineering, and formulation steps.
[0388] In some aspects, the separation and/or other steps is carried out using
CliniMACS
system (Miltenyi Biotec), for example, for automated separation of cells on a
clinical-scale level
in a closed and sterile system. Components can include an integrated
microcomputer, magnetic
separation unit, peristaltic pump, and various pinch valves. The integrated
computer in some
aspects controls all components of the instrument and directs the system to
perform repeated
procedures in a standardized sequence. The magnetic separation unit in some
aspects includes a
movable permanent magnet and a holder for the selection column. The
peristaltic pump controls
the flow rate throughout the tubing set and, together with the pinch valves,
ensures the
controlled flow of buffer through the system and continual suspension of
cells.
[0389] The CliniMACS system in some aspects uses antibody-coupled magnetizable
particles that are supplied in a sterile, non-pyrogenic solution. In some
embodiments, after
labelling of cells with magnetic particles the cells are washed to remove
excess particles. A cell
preparation bag is then connected to the tubing set, which in turn is
connected to a bag
containing buffer and a cell collection bag. The tubing set consists of pre-
assembled sterile
tubing, including a pre-column and a separation column, and are for single use
only. After
initiation of the separation program, the system automatically applies the
cell sample onto the
separation column. Labelled cells are retained within the column, while
unlabeled cells are
removed by a series of washing steps. In some embodiments, the cell
populations for use with
99
CA 03049461 2019-07-04
WO 2018/132518 PCT/US2018/013227
the methods described herein are unlabeled and are not retained in the column.
In some
embodiments, the cell populations for use with the methods described herein
are labeled and are
retained in the column. In some embodiments, the cell populations for use with
the methods
described herein are eluted from the column after removal of the magnetic
field, and are
collected within the cell collection bag.
[0390] In certain embodiments, separation and/or other steps are carried out
using the
CliniMACS Prodigy system (Miltenyi Biotec). The CliniMACS Prodigy system in
some
aspects is equipped with a cell processing unity that permits automated
washing and
fractionation of cells by centrifugation. The CliniMACS Prodigy system can
also include an
onboard camera and image recognition software that determines the optimal cell
fractionation
endpoint by discerning the macroscopic layers of the source cell product. For
example,
peripheral blood is automatically separated into erythrocytes, white blood
cells and plasma
layers. The CliniMACS Prodigy system can also include an integrated cell
cultivation chamber
which accomplishes cell culture protocols such as, e.g., cell differentiation
and expansion,
antigen loading, and long-term cell culture. Input ports can allow for the
sterile removal and
replenishment of media and cells can be monitored using an integrated
microscope. See, e.g.,
Klebanoff et al. (2012) J Immunother. 35(9): 651-660, Terakura et al. (2012)
Blood.1:72-82,
and Wang et al. (2012) J Immunother. 35(9):689-701.
[0391] In some embodiments, a cell population described herein is collected
and enriched
(or depleted) via flow cytometry, in which cells stained for multiple cell
surface markers are
carried in a fluidic stream. In some embodiments, a cell population described
herein is collected
and enriched (or depleted) via preparative scale (FACS)-sorting. In certain
embodiments, a cell
population described herein is collected and enriched (or depleted) by use of
microelectromechanical systems (MEMS) chips in combination with a FACS-based
detection
system (see, e.g., WO 2010/033140, Cho et al. (2010) Lab Chip 10,1567-1573;
and Godin et al.
(2008) J Biophoton. 1(5):355-376. In both cases, cells can be labeled with
multiple markers,
allowing for the isolation of well-defined T cell subsets at high purity.
[0392] In some embodiments, the antibodies or binding partners are labeled
with one or
more detectable marker, to facilitate separation for positive and/or negative
selection. For
example, separation may be based on binding to fluorescently labeled
antibodies. In some
examples, separation of cells based on binding of antibodies or other binding
partners specific
for one or more cell surface markers are carried in a fluidic stream, such as
by fluorescence-
activated cell sorting (FACS), including preparative scale (FACS) and/or
100
CA 03049461 2019-07-04
WO 2018/132518 PCT/US2018/013227
microelectromechanical systems (MEMS) chips, e.g., in combination with a flow-
cytometric
detection system. Such methods allow for positive and negative selection based
on multiple
markers simultaneously.
[0393] In some embodiments, the preparation methods include steps for
freezing, e.g.,
cryopreserving, the cells, either before or after isolation, incubation,
and/or engineering. In
some embodiments, the freeze and subsequent thaw step removes granulocytes
and, to some
extent, monocytes in the cell population. In some embodiments, the cells are
suspended in a
freezing solution, e.g., following a washing step to remove plasma and
platelets. Any of a
variety of known freezing solutions and parameters in some aspects may be
used. One example
involves using PBS containing 20% DMSO and 8% human serum albumin (HSA), or
other
suitable cell freezing media. This is then diluted 1:1 with media so that the
final concentration of
DMSO and HSA are 10% and 4%, respectively. The cells are generally then frozen
to ¨80 C. at
a rate of 10 per minute and stored in the vapor phase of a liquid nitrogen
storage tank.
[0394] In some embodiments, the cells are incubated and/or cultured prior to
or in
connection with genetic engineering. The incubation steps can include culture,
cultivation,
stimulation, activation, and/or propagation. In some embodiments, the
compositions or cells are
incubated in the presence of stimulating conditions or a stimulatory agent.
Such conditions
include those designed to induce proliferation, expansion, activation, and/or
survival of cells in
the population, to mimic antigen exposure, and/or to prime the cells for
genetic engineering,
such as for the introduction of a recombinant antigen receptor.
[0395] The conditions can include one or more of particular media,
temperature, oxygen
content, carbon dioxide content, time, agents, e.g., nutrients, amino acids,
antibiotics, ions,
and/or stimulatory factors, such as cytokines, chemokines, antigens, binding
partners, fusion
proteins, recombinant soluble receptors, and any other agents designed to
activate the cells.
[0396] In some embodiments, the stimulating conditions or agents include one
or more
agent, e.g., ligand, which is capable of activating an intracellular signaling
domain of a TCR
complex. In some aspects, the agent turns on or initiates TCR/CD3
intracellular signaling
cascade in a T cell. Such agents can include antibodies, such as those
specific for a TCR, e.g.
anti-CD3. In some embodiments, the stimulating conditions include one or more
agent, e.g.
ligand, which is capable of stimulating a costimulatory receptor, e.g., anti-
CD28. In some
embodiments, such agents and/or ligands may be, bound to solid support such as
a bead, and/or
one or more cytokines. Optionally, the expansion method may further comprise
the step of
adding anti-CD3 and/or anti CD28 antibody to the culture medium (e.g., at a
concentration of at
101
CA 03049461 2019-07-04
WO 2018/132518 PCT/US2018/013227
least about 0.5 ng/ml). In some embodiments, the stimulating agents include IL-
2, IL-15 and/or
IL-7. In some aspects, the IL-2 concentration is at least about 10 units/mL.
[0397] In some aspects, incubation is carried out in accordance with
techniques such as
those described in US Patent No. 6,040,177 to Riddell et al., Klebanoff et
al.(2012) J
Immunother. 35(9): 651-660, Terakura et al. (2012) Blood.1:72-82, and/or Wang
et al. (2012) J
Immunother. 35(9):689-701.
[0398] In some embodiments, the T cells are expanded by adding to a culture-
initiating
composition feeder cells, such as non-dividing peripheral blood mononuclear
cells (PBMC),
(e.g., such that the resulting population of cells contains at least about 5,
10, 20, or 40 or more
PBMC feeder cells for each T lymphocyte in the initial population to be
expanded); and
incubating the culture (e.g. for a time sufficient to expand the numbers of T
cells). In some
aspects, the non-dividing feeder cells can comprise gamma-irradiated PBMC
feeder cells. In
some embodiments, the PBMC are irradiated with gamma rays in the range of
about 3000 to
3600 rads to prevent cell division. In some aspects, the feeder cells are
added to culture medium
prior to the addition of the populations of T cells.
[0399] In some embodiments, the stimulating conditions include temperature
suitable for the
growth of human T lymphocytes, for example, at least about 25 degrees Celsius,
generally at
least about 30 degrees, and generally at or about 37 degrees Celsius.
Optionally, the incubation
may further comprise adding non-dividing EBV-transformed lymphoblastoid cells
(LCL) as
feeder cells. LCL can be irradiated with gamma rays in the range of about 6000
to 10,000 rads.
The LCL feeder cells in some aspects is provided in any suitable amount, such
as a ratio of LCL
feeder cells to initial T lymphocytes of at least about 10:1.
[0400] In embodiments, antigen-specific T cells, such as antigen-specific CD4+
and/or
CD8+ T cells, are obtained by stimulating naive or antigen specific T
lymphocytes with antigen.
For example, antigen-specific T cell lines or clones can be generated to
cytomegalovirus
antigens by isolating T cells from infected subjects and stimulating the cells
in vitro with the
same antigen.
[0401] In some embodiments, any one or more conditions or agents in connection
with
culturing or processing cells can be altered or tested and assessed for their
effect on the
phenotype or function or characteristic of the cells as determined by
epigenetic analysis, such as
chromatin accessibility, in accord with the provided methods. In some
embodiments, an agent
or condition can be added to a culture of cells, and a cell can be assessed
for an epigenetic
property of a genomic region or regions indicative of a phenotype or function
of the cells. In
102
CA 03049461 2019-07-04
WO 2018/132518 PCT/US2018/013227
some embodiments, a gene or a panel of genes indicative of identifying naive
cells or long-lived
memory cells are assessed. In some embodiments, a gene or panel of genes
indicative of
effector-life functions of cells, such as effector cells or effector memory
cells, are assessed.
Exemplary of such genes are provided.
C. Recombinant Receptors Expressed by the Cells
[0402] The cells generally express recombinant receptors. The receptors may
include
antigen receptors, such as functional non-TCR antigen receptors, including
chimeric antigen
receptors (CARs), and other antigen-binding receptors such as transgenic T
cell receptors
(TCRs). The receptors may also include other chimeric receptors, such as
receptors binding to
particular ligands and having transmembrane and/or intracellular signaling
domains similar to
those present in a CAR. Among the receptors are antigen receptors and
receptors containing one
or more component thereof. The recombinant receptors may include chimeric
receptors, such as
those containing ligand-binding domains or binding fragments thereof and
intracellular signaling
domains or regions, functional non-TCR antigen receptors, chimeric antigen
receptors (CARs),
and T cell receptors (TCRs), such as recombinant or transgenic TCRs, chimeric
autoantibody
receptor (CAAR) and components of any of the foregoing. The recombinant
receptor, such as a
CAR, generally includes the extracellular antigen (or ligand) binding domain
linked to one or
more intracellular signaling components, in some aspects via linkers and/or
transmembrane
domain(s).
I. Chimeric Antt:g-en Receptors (CARS)
[0403] In some embodiments, engineered cells, such as T cells, express a CAR
with
specificity for a particular antigen (or marker or ligand), such as an antigen
expressed on the
surface of a particular cell type. In some embodiments, the antigen is a
polypeptide. In some
embodiments, it is a carbohydrate or other molecule. In some embodiments, the
antigen is
selectively expressed or overexpressed on cells of the disease or condition,
e.g., the tumor or
pathogenic cells, as compared to normal or non-targeted cells or tissues. In
other embodiments,
the antigen is expressed on normal cells and/or is expressed on the engineered
cells.
[0404] In particular embodiments, the recombinant receptor, such as chimeric
receptor,
contains an intracellular signaling region, which includes a cytoplasmic
signaling domain or
region (also interchangeably called an intracellular signaling domain or
region), such as a
cytoplasmic (intracellular) region capable of inducing a primary activation
signal in a T cell, for
example, a cytoplasmic signaling domain or region of a T cell receptor (TCR)
component (e.g. a
103
CA 03049461 2019-07-04
WO 2018/132518 PCT/US2018/013227
cytoplasmic signaling domain or region of a zeta chain of a CD3-zeta (CD3)
chain or a
functional variant or signaling portion thereof) and/or that comprises an
immunoreceptor
tyrosine-based activation motif (ITAM).
[0405] In some embodiments, the chimeric receptor further contains an
extracellular ligand-
binding domain that specifically binds to a ligand (e.g. antigen) antigen. In
some embodiments,
the chimeric receptor is a CAR that contains an extracellular antigen-
recognition domain that
specifically binds to an antigen. In some embodiments, the ligand, such as an
antigen, is a
protein expressed on the surface of cells. In some embodiments, the CAR is a
TCR-like CAR
and the antigen is a processed peptide antigen, such as a peptide antigen of
an intracellular
protein, which, like a TCR, is recognized on the cell surface in the context
of a major
histocompatibility complex (MHC) molecule.
[0406] Exemplary antigen receptors, including CARs, and methods for
engineering and
introducing such receptors into cells, include those described, for example,
in international
patent application publication numbers W0200014257, W02013126726,
W02012/129514,
W02014031687, W02013/166321, W02013/071154, W02013/123061 U.S. patent
application
publication numbers US2002131960, US2013287748, US20130149337, U.S. Patent
Nos.:
6,451,995, 7,446,190, 8,252,592õ 8,339,645, 8,398,282, 7,446,179, 6,410,319,
7,070,995,
7,265,209, 7,354,762, 7,446,191, 8,324,353, and 8,479,118, and European patent
application
number EP2537416,and/or those described by Sadelain et al., Cancer Discov.
2013 April; 3(4):
388-398; Davila et al. (2013) PLoS ONE 8(4): e61338; Turtle et al., Curr.
Opin. Immunol.,
2012 October; 24(5): 633-39; Wu et al., Cancer, 2012 March 18(2): 160-75. In
some aspects,
the antigen receptors include a CAR as described in U.S. Patent No.:
7,446,190, and those
described in International Patent Application Publication No.: WO/2014055668
Al. Examples
of the CARs include CARs as disclosed in any of the aforementioned
publications, such as
W02014031687, US 8,339,645, US 7,446,179, US 2013/0149337, U.S. Patent No.:
7,446,190,
US Patent No.: 8,389,282, Kochenderfer et al., 2013, Nature Reviews Clinical
Oncology, 10,
267-276 (2013); Wang et al. (2012) J. Immunother. 35(9): 689-701; and
Brentjens et al., Sci
Transl Med. 2013 5(177). See also International Patent Publication No.:
W02014031687, U.S.
Patent Nos.: 8,339,645, 7,446,179, 7,446,190, and 8,389,282, and U.S. patent
application
Publication No. US 2013/0149337. Among the chimeric receptors are chimeric
antigen
receptors (CARs). The chimeric receptors, such as CARs, generally include an
extracellular
antigen binding domain, such as a portion of an antibody molecule, generally a
variable heavy
104
CA 03049461 2019-07-04
WO 2018/132518 PCT/US2018/013227
(VH) chain region and/or variable light (VL) chain region of the antibody,
e.g., an scFv antibody
fragment.
[0407] In some embodiments, the CAR is constructed with a specificity for a
particular
antigen (or marker or ligand), such as an antigen expressed in a particular
cell type to be targeted
by adoptive therapy, e.g., a cancer marker, and/or an antigen intended to
induce a dampening
response, such as an antigen expressed on a normal or non-diseased cell type.
Thus, the CAR
typically includes in its extracellular portion one or more antigen binding
molecules, such as one
or more antigen-binding fragment, domain, or portion, or one or more antibody
variable
domains, and/or antibody molecules. In some embodiments, the CAR includes an
antigen-
binding portion or portions of an antibody molecule, such as a single-chain
antibody fragment
(scFv) derived from the variable heavy (VH) and variable light (VL) chains of
a monoclonal
antibody (mAb).
[0408] In some embodiments, the antibody or antigen-binding portion thereof is
expressed
on cells as part of a recombinant receptor, such as an antigen receptor. Among
the antigen
receptors are functional non-TCR antigen receptors, such as chimeric antigen
receptors (CARs).
Generally, a CAR containing an antibody or antigen-binding fragment that
exhibits TCR-like
specificity directed against peptide-MHC complexes also may be referred to as
a TCR-like
CAR. In some embodiments, the extracellular antigen binding domain specific
for an MHC-
peptide complex of a TCR-like CAR is linked to one or more intracellular
signaling
components, in some aspects via linkers and/or transmembrane domain(s). In
some
embodiments, such molecules can typically mimic or approximate a signal
through a natural
antigen receptor, such as a TCR, and, optionally, a signal through such a
receptor in combination
with a costimulatory receptor.
[0409] In some embodiments, the recombinant receptor, such as a chimeric
receptor (e.g.
CAR), includes a ligand-binding domain that binds, such as specifically binds,
to an antigen (or
a ligand). Among the antigens targeted by the chimeric receptors are those
expressed in the
context of a disease, condition, or cell type to be targeted via the adoptive
cell therapy. Among
the diseases and conditions are proliferative, neoplastic, and malignant
diseases and disorders,
including cancers and tumors, including hematologic cancers, cancers of the
immune system,
such as lymphomas, leukemias, and/or myelomas, such as B, T, and myeloid
leukemias,
lymphomas, and multiple myelomas.
[0410] In some embodiments, the antigen (or a ligand) is a polypeptide. In
some
embodiments, it is a carbohydrate or other molecule. In some embodiments, the
antigen (or a
105
CA 03049461 2019-07-04
WO 2018/132518 PCT/US2018/013227
ligand) is selectively expressed or overexpressed on cells of the disease or
condition, e.g., the
tumor or pathogenic cells, as compared to normal or non-targeted cells or
tissues. In other
embodiments, the antigen is expressed on normal cells and/or is expressed on
the engineered
cells.
[0411] In some embodiments, the CAR contains an antibody or an antigen-binding
fragment
(e.g. scFv) that specifically recognizes an antigen, such as an intact
antigen, expressed on the
surface of a cell.
[0412] In some embodiments, the antigen (or a ligand) is a tumor antigen or
cancer marker.
In some embodiments, the antigen (or a ligand) the antigen is or includes
av13.6 integrin (avb6
integrin), B cell maturation antigen (BCMA), B7-H3, B7-H6, carbonic anhydrase
9 (CA9, also
known as CAIX or G250), a cancer-testis antigen, cancer/testis antigen 1B
(CTAG, also known
as NY-ESO-1 and LAGE-2), carcinoembryonic antigen (CEA), a cyclin, cyclin A2,
C-C Motif
Chemokine Ligand 1 (CCL-1), CD19, CD20, CD22, CD23, CD24, CD30, CD33, CD38,
CD44,
CD44v6, CD44v7/8, CD123, CD138, CD171, epidermal growth factor protein (EGFR),
truncated epidermal growth factor protein (tEGFR), type III epidermal growth
factor receptor
mutation (EGFR viii), epithelial glycoprotein 2 (EPG-2), epithelial
glycoprotein 40 (EPG-40),
ephrinB2, ephrine receptor A2 (EPHa2), estrogen receptor, Fc receptor like 5
(FCRL5; also
known as Fc receptor homolog 5 or FCRH5), fetal acetylcholine receptor (fetal
AchR), a folate
binding protein (FBP), folate receptor alpha, ganglioside GD2, 0-acetylated
GD2 (OGD2),
ganglioside GD3, glycoprotein 100 (gp100), G Protein Coupled Receptor 5D
(GPCR5D),
Her2/neu (receptor tyrosine kinase erb-B2), Her3 (erb-B3), Her4 (erb-B4), erbB
dimers, Human
high molecular weight-melanoma-associated antigen (HMW-MAA), hepatitis B
surface antigen,
Human leukocyte antigen Al (HLA-A1), Human leukocyte antigen A2 (HLA-A2), IL-
22
receptor alpha(IL-22Ra), IL-13 receptor alpha 2 (IL-13Ra2), kinase insert
domain receptor
(kdr), kappa light chain, Ll cell adhesion molecule (L1-CAM), CE7 epitope of
Ll-CAM,
Leucine Rich Repeat Containing 8 Family Member A (LRRC8A), Lewis Y, Melanoma-
associated antigen (MAGE)-A 1, MAGE-A3, MAGE-A6, mesothelin, c-Met, murine
cytomegalovirus (CMV), mucin 1 (MUC1), MUC16, natural killer group 2 member D
(NKG2D) ligands, melan A (MART-1), neural cell adhesion molecule (NCAM),
oncofetal
antigen, Preferentially expressed antigen of melanoma (PRAME), progesterone
receptor, a
prostate specific antigen, prostate stem cell antigen (PSCA), prostate
specific membrane antigen
(PSMA), Receptor Tyrosine Kinase Like Orphan Receptor 1 (ROR1), survivin,
Trophoblast
glycoprotein (TPBG also known as 5T4), tumor-associated glycoprotein 72
(TAG72), vascular
106
CA 03049461 2019-07-04
WO 2018/132518 PCT/US2018/013227
endothelial growth factor receptor (VEGFR), vascular endothelial growth factor
receptor 2
(VEGFR2), Wilms Tumor 1 (WT-1), a pathogen-specific antigen, or an antigen
associated with
a universal tag, and/or biotinylated molecules, and/or molecules expressed by
HIV, HCV, HBV
or other pathogens. Antigens targeted by the receptors in some embodiments
include antigens
associated with a B cell malignancy, such as any of a number of known B cell
marker. In some
embodiments, the antigen is or includes CD20, CD19, CD22, ROR1, CD45, CD21,
CD5, CD33,
Igkappa, Iglambda, CD79a, CD79b or CD30.
[0413] In some embodiments, the antigen is or includes a pathogen-specific or
pathogen-
expressed antigen. In some embodiments, the antigen is a viral antigen (such
as a viral antigen
from HIV, HCV, HBV, etc.), bacterial antigens, and/or parasitic antigens.
[0414] In some embodiments, the antibody or an antigen-binding fragment (e.g.
scFv) that
specifically recognizes an antigen, such as CD19.
[0415] In some embodiments the scFv and/or VH domains is derived from FMC63.
FMC63
generally refers to a mouse monoclonal IgG1 antibody raised against Nalm-1 and
-16 cells
expressing CD19 of human origin (Ling, N. R., et al. (1987). Leucocyte typing
III. 302). The
FMC63 antibody comprises CDRH1 and H2 set forth in SEQ ID NOS: 38, 39
respectively, and
CDRH3 set forth in SEQ ID NOS: 40 or 54 and CDRL1 set forth in SEQ ID NOS: 35
and CDR
L2 36 or 55 and CDR L3 sequences 37 or 56. The FMC63 antibody comprises the
heavy chain
variable region (VH) comprising the amino acid sequence of SEQ ID NO: 41 and
the light chain
variable region (VL) comprising the amino acid sequence of SEQ ID NO: 42. In
some
embodiments, the svFv comprises a variable light chain containing the CDRL1
sequence of SEQ
ID NO:35, a CDRL2 sequence of SEQ ID NO:36, and a CDRL3 sequence of SEQ ID
NO:37
and/or a variable heavy chain containing a CDRH1 sequence of SEQ ID NO:38, a
CDRH2
sequence of SEQ ID NO:39, and a CDRH3 sequence of SEQ ID NO:40. In some
embodiments,
the scFv comprises a variable heavy chain region of FMC63 set forth in SEQ ID
NO:41 and a
variable light chain region of FMC63 set forth in SEQ ID NO:42. In some
embodiments, the
variable heavy and variable light chain are connected by a linker. In some
embodiments, the
linker is set forth in SEQ ID NO:59. In some embodiments, the scFv comprises,
in order, a VH,
a linker, and a VL. In some embodiments, the scFv comprises, in order, a VL, a
linker, and a
VH. In some embodiments, the svFc is encoded by a sequence of nucleotides set
forth in SEQ
ID NO:57 or a sequence that eHibits at least 85%, 86%, 87%, 88%, 89%, 90%,
91%, 92%, 93%,
94%, 95%, 96%, 97%, 98%, or 99% sequence identity to SEQ ID NO:57. In some
embodiments, the scFv comprises the sequence of amino acids set forth in SEQ
ID NO:43 or a
107
CA 03049461 2019-07-04
WO 2018/132518 PCT/US2018/013227
sequence that eHibits at least 85%, 86%, 87%, 88%, 89%, 90%, 91%, 92%, 93%,
94%, 95%,
96%, 97%, 98%, or 99% sequence identity to SEQ ID NO:43.
[0416] In some embodiments the scFv is derived from 5J25C1. 5J25C1 is a mouse
monoclonal IgG1 antibody raised against Nalm-1 and -16 cells expressing CD19
of human
origin (Ling, N. R., et al. (1987). Leucocyte typing III. 302). The 5J25C1
antibody comprises
CDRH1, H2 and H3 set forth in SEQ ID NOS: 47-49, respectively, and CDRL1, L2
and L3
sequences set forth in SEQ ID NOS: 44-46, respectively. The 5J25C1 antibody
comprises the
heavy chain variable region (VH) comprising the amino acid sequence of SEQ ID
NO: 50 and
the light chain variable region (VL) comprising the amino acid sequence of SEQ
ID NO: 51. In
some embodiments, the svFv comprises a variable light chain containing the
CDRL1 sequence
of SEQ ID NO:44, a CDRL2 sequence of SEQ ID NO: 45, and a CDRL3 sequence of
SEQ ID
NO:46 and/or a variable heavy chain containing a CDRH1 sequence of SEQ ID
NO:47, a
CDRH2 sequence of SEQ ID NO:48, and a CDRH3 sequence of SEQ ID NO:49. In some
embodiments, the scFv comprises a variable heavy chain region of SJ25C1 set
forth in SEQ ID
NO:50 and a variable light chain region of 5J25C1 set forth in SEQ ID NO:51.
In some
embodiments, the variable heavy and variable light chain are connected by a
linker. In some
embodiments, the linker is set forth in SEQ ID NO:52. In some embodiments, the
scFv
comprises, in order, a VH, a linker, and a VL. In some embodiments, the scFv
comprises, in
order, a VL, a linker, and a VH. In some embodiments, the scFv comprises the
sequence of
amino acids set forth in SEQ ID NO:53 or a sequence that eHibits at least 85%,
86%, 87%, 88%,
89%, 90%, 91%, 92%, 93%, 94%, 95%, 96%, 97%, 98%, or 99% sequence identity to
SEQ ID
NO:53.
[0417] In some embodiments, the CAR contains a TCR-like antibody, such as an
antibody
or an antigen-binding fragment (e.g. scFv) that specifically recognizes an
intracellular antigen,
such as a tumor-associated antigen, presented on the cell surface as a MHC-
peptide complex. In
some embodiments, an antibody or antigen-binding portion thereof that
recognizes an MHC-
peptide complex can be expressed on cells as part of a recombinant receptor,
such as an antigen
receptor. Among the antigen receptors are functional non-TCR antigen
receptors, such as
chimeric antigen receptors (CARs). Generally, a CAR containing an antibody or
antigen-binding
fragment that exhibits TCR-like specificity directed against peptide-MHC
complexes also may
be referred to as a TCR-like CAR.
[0418] Reference to "Major histocompatibility complex" (MHC) refers to a
protein,
generally a glycoprotein, that contains a polymorphic peptide binding site or
binding groove that
108
CA 03049461 2019-07-04
WO 2018/132518 PCT/US2018/013227
can, in some cases, complex with peptide antigens of polypeptides, including
peptide antigens
processed by the cell machinery. In some cases, MHC molecules can be displayed
or expressed
on the cell surface, including as a complex with peptide, i.e. MHC-peptide
complex, for
presentation of an antigen in a conformation recognizable by an antigen
receptor on T cells, such
as a TCRs or TCR-like antibody. Generally, MHC class I molecules are
heterodimers having a
membrane spanning a chain, in some cases with three a domains, and a non-
covalently
associated (32 microglobulin. Generally, MHC class II molecules are composed
of two
transmembrane glycoproteins, a and (3, both of which typically span the
membrane. An MHC
molecule can include an effective portion of an MHC that contains an antigen
binding site or
sites for binding a peptide and the sequences necessary for recognition by the
appropriate
antigen receptor. In some embodiments, MHC class I molecules deliver peptides
originating in
the cytosol to the cell surface, where a MHC-peptide complex is recognized by
T cells, such as
generally CD8+ T cells, but in some cases CD4+ T cells. In some embodiments,
MHC class II
molecules deliver peptides originating in the vesicular system to the cell
surface, where they are
typically recognized by CD4+ T cells. Generally, MHC molecules are encoded by
a group of
linked loci, which are collectively termed H-2 in the mouse and human
leukocyte antigen (HLA)
in humans. Hence, typically human MHC can also be referred to as human
leukocyte antigen
(HLA).
[0419] The term "MHC-peptide complex" or "peptide-MHC complex" or variations
thereof,
refers to a complex or association of a peptide antigen and an MHC molecule,
such as,
generally, by non-covalent interactions of the peptide in the binding groove
or cleft of the MHC
molecule. In some embodiments, the MHC-peptide complex is present or displayed
on the
surface of cells. In some embodiments, the MHC-peptide complex can be
specifically
recognized by an antigen receptor, such as a TCR, TCR-like CAR or antigen-
binding portions
thereof.
[0420] In some embodiments, a peptide, such as a peptide antigen or epitope,
of a
polypeptide can associate with an MHC molecule, such as for recognition by an
antigen
receptor. Generally, the peptide is derived from or based on a fragment of a
longer biological
molecule, such as a polypeptide or protein. In some embodiments, the peptide
typically is about
8 to about 24 amino acids in length. In some embodiments, a peptide has a
length of from or
from about 9 to 22 amino acids for recognition in the MHC Class II complex. In
some
embodiments, a peptide has a length of from or from about 8 to 13 amino acids
for recognition
in the MHC Class I complex. In some embodiments, upon recognition of the
peptide in the
109
CA 03049461 2019-07-04
WO 2018/132518 PCT/US2018/013227
context of an MHC molecule, such as MHC-peptide complex, the antigen receptor,
such as TCR
or TCR-like CAR, produces or triggers an activation signal to the T cell that
induces a T cell
response, such as T cell proliferation, cytokine production, a cytotoxic T
cell response or other
response.
[0421] In some embodiments, a TCR-like antibody or antigen-binding portion,
are known or
can be produced by known methods (see e.g. US Published Application Nos. US
2002/0150914; US 2003/0223994; US 2004/0191260; US 2006/0034850; US
2007/00992530;
US20090226474; U520090304679; and International PCT Publication No. WO
03/068201).
[0422] In some embodiments, an antibody or antigen-binding portion thereof
that
specifically binds to a MHC-peptide complex, can be produced by immunizing a
host with an
effective amount of an immunogen containing a specific MHC-peptide complex. In
some cases,
the peptide of the MHC-peptide complex is an epitope of antigen capable of
binding to the
MHC, such as a tumor antigen, for example a universal tumor antigen, myeloma
antigen or other
antigen as described below. In some embodiments, an effective amount of the
immunogen is
then administered to a host for eliciting an immune response, wherein the
immunogen retains a
three-dimensional form thereof for a period of time sufficient to elicit an
immune response
against the three-dimensional presentation of the peptide in the binding
groove of the MHC
molecule. Serum collected from the host is then assayed to determine if
desired antibodies that
recognize a three-dimensional presentation of the peptide in the binding
groove of the MHC
molecule is being produced. In some embodiments, the produced antibodies can
be assessed to
confirm that the antibody can differentiate the MHC-peptide complex from the
MHC molecule
alone, the peptide of interest alone, and a complex of MHC and irrelevant
peptide. The desired
antibodies can then be isolated.
[0423] In some embodiments, an antibody or antigen-binding portion thereof
that
specifically binds to an MHC-peptide complex can be produced by employing
antibody library
display methods, such as phage antibody libraries. In some embodiments, phage
display libraries
of mutant Fab, scFv or other antibody forms can be generated, for example, in
which members
of the library are mutated at one or more residues of a CDR or CDRs. See e.g.
US published
application No. U520020150914, U52014/0294841; and Cohen CJ. et al. (2003) J
Mol. Recogn.
16:324-332.
[0424] The term "antibody" herein is used in the broadest sense and includes
polyclonal and
monoclonal antibodies, including intact antibodies and functional (antigen-
binding) antibody
fragments, including fragment antigen binding (Fab) fragments, F(ab')2
fragments, Fab'
110
CA 03049461 2019-07-04
WO 2018/132518 PCT/US2018/013227
fragments, Fv fragments, recombinant IgG (rIgG) fragments, variable heavy
chain (VH) regions
capable of specifically binding the antigen, single chain antibody fragments,
including single
chain variable fragments (scFv), and single domain antibodies (e.g., sdAb,
sdFv, nanobody)
fragments. The term encompasses genetically engineered and/or otherwise
modified forms of
immunoglobulins, such as intrabodies, peptibodies, chimeric antibodies, fully
human antibodies,
humanized antibodies, and heteroconjugate antibodies, multispecific, e.g.,
bispecific, antibodies,
diabodies, triabodies, and tetrabodies, tandem di-scFv, tandem tri-scFv.
Unless otherwise stated,
the term "antibody" should be understood to encompass functional antibody
fragments thereof.
The term also encompasses intact or full-length antibodies, including
antibodies of any class or
sub-class, including IgG and sub-classes thereof, IgM, IgE, IgA, and IgD.
[0425] In some embodiments, the antigen-binding proteins, antibodies and
antigen binding
fragments thereof specifically recognize an antigen of a full-length antibody.
In some
embodiments, the heavy and light chains of an antibody can be full-length or
can be an antigen-
binding portion (a Fab, F(ab')2, Fv or a single chain Fv fragment (scFv)). In
other embodiments,
the antibody heavy chain constant region is chosen from, e.g., IgGl, IgG2,
IgG3, IgG4, IgM,
IgAl, IgA2, IgD, and IgE, particularly chosen from, e.g., IgGl, IgG2, IgG3,
and IgG4, more
particularly, IgG1 (e.g., human IgG1). In another embodiment, the antibody
light chain constant
region is chosen from, e.g., kappa or lambda, particularly kappa.
[0426] Among the provided antibodies are antibody fragments. An "antibody
fragment"
refers to a molecule other than an intact antibody that comprises a portion of
an intact antibody
that binds the antigen to which the intact antibody binds. Examples of
antibody fragments
include but are not limited to Fv, Fab, Fab', Fab'-SH, F(ab')2; diabodies;
linear antibodies;
variable heavy chain (VH) regions, single-chain antibody molecules such as
scFvs and single-
domain VH single antibodies; and multispecific antibodies formed from antibody
fragments. In
particular embodiments, the antibodies are single-chain antibody fragments
comprising a
variable heavy chain region and/or a variable light chain region, such as
scFvs.
[0427] The term "variable region" or "variable domain" refers to the domain of
an antibody
heavy or light chain that is involved in binding the antibody to antigen. The
variable domains of
the heavy chain and light chain (VH and VL, respectively) of a native antibody
generally have
similar structures, with each domain comprising four conserved framework
regions (FRs) and
three CDRs. (See, e.g., Kindt et al. Kuby Immunology, 6th ed., W.H. Freeman
and Co., page 91
(2007). A single VH or VL domain may be sufficient to confer antigen-binding
specificity.
Furthermore, antibodies that bind a particular antigen may be isolated using a
VH or VL domain
111
CA 03049461 2019-07-04
WO 2018/132518 PCT/US2018/013227
from an antibody that binds the antigen to screen a library of complementary
VL or VH domains,
respectively. See, e.g., Portolano et al., J. Immunol. 150:880-887 (1993);
Clarkson et al., Nature
352:624-628 (1991).
[0428] Single-domain antibodies are antibody fragments comprising all or a
portion of the
heavy chain variable domain or all or a portion of the light chain variable
domain of an
antibody. In certain embodiments, a single-domain antibody is a human single-
domain antibody.
In some embodiments, the CAR comprises an antibody heavy chain domain that
specifically
binds the antigen, such as a cancer marker or cell surface antigen of a cell
or disease to be
targeted, such as a tumor cell or a cancer cell, such as any of the target
antigens described herein
or known.
[0429] Antibody fragments can be made by various techniques, including but not
limited to
proteolytic digestion of an intact antibody as well as production by
recombinant host cells. In
some embodiments, the antibodies are recombinantly-produced fragments, such as
fragments
comprising arrangements that do not occur naturally, such as those with two or
more antibody
regions or chains joined by synthetic linkers, e.g., peptide linkers, and/or
that are may not be
produced by enzyme digestion of a naturally-occurring intact antibody. In some
embodiments,
the antibody fragments are scFvs.
[0430] A "humanized" antibody is an antibody in which all or substantially all
CDR amino
acid residues are derived from non-human CDRs and all or substantially all FR
amino acid
residues are derived from human FRs. A humanized antibody optionally may
include at least a
portion of an antibody constant region derived from a human antibody. A
"humanized form" of
a non-human antibody, refers to a variant of the non-human antibody that has
undergone
humanization, typically to reduce immunogenicity to humans, while retaining
the specificity and
affinity of the parental non-human antibody. In some embodiments, some FR
residues in a
humanized antibody are substituted with corresponding residues from a non-
human antibody
(e.g., the antibody from which the CDR residues are derived), e.g., to restore
or improve
antibody specificity or affinity.
[0431] Thus, in some embodiments, the chimeric antigen receptor, including TCR-
like
CARs, includes an extracellular portion containing an antibody or antibody
fragment. In some
embodiments, the antibody or fragment includes an scFv. In some aspects, the
chimeric antigen
receptor includes an extracellular portion containing the antibody or fragment
and an
intracellular signaling region. In some embodiments, the intracellular
signaling region
comprises an intracellular signaling domain. In some embodiments, the
intracellular signaling
112
CA 03049461 2019-07-04
WO 2018/132518 PCT/US2018/013227
domain is or comprises a primary signaling domain, a signaling domain that is
capable of
inducing a primary activation signal in a T cell, a signaling domain of a T
cell receptor (TCR)
component, and/or a signaling domain comprising an immunoreceptor tyrosine-
based activation
motif (ITAM).
[0432] In some embodiments, the recombinant receptor such as the CAR, such as
the
antibody portion thereof, further includes a spacer, which may be or include
at least a portion of
an immunoglobulin constant region or variant or modified version thereof, such
as a hinge
region, e.g., an IgG4 hinge region, and/or a CH1/CL and/or Fc region. In some
embodiments, the
recombinant receptor further comprises a spacer and/or a hinge region. In some
embodiments,
the constant region or portion is of a human IgG, such as IgG4 or IgGl. In
some aspects, the
portion of the constant region serves as a spacer region between the antigen-
recognition
component, e.g., scFv, and transmembrane domain. The spacer can be of a length
that provides
for increased responsiveness of the cell following antigen binding, as
compared to in the absence
of the spacer. Exemplary spacers, e.g., hinge regions, include those described
in international
patent application publication number W02014031687. In some examples, the
spacer is or is
about 12 amino acids in length or is no more than 12 amino acids in length.
Exemplary spacers
include those having at least about 10 to 229 amino acids, about 10 to 200
amino acids, about 10
to 175 amino acids, about 10 to 150 amino acids, about 10 to 125 amino acids,
about 10 to 100
amino acids, about 10 to 75 amino acids, about 10 to 50 amino acids, about 10
to 40 amino
acids, about 10 to 30 amino acids, about 10 to 20 amino acids, or about 10 to
15 amino acids,
and including any integer between the endpoints of any of the listed ranges.
In some
embodiments, a spacer region has about 12 amino acids or less, about 119 amino
acids or less,
or about 229 amino acids or less. Exemplary spacers include IgG4 hinge alone,
IgG4 hinge
linked to CH2 and CH3 domains, or IgG4 hinge linked to the CH3 domain.
Exemplary spacers
include, but are not limited to, those described in Hudecek et al. (2013)
Clin. Cancer Res.,
19:3153, Hudecek et al. (2015) Cancer Immunol Res. 3(2): 125-135 or
international patent
application publication number W02014031687, U.S. Patent No. 8,822,647 or
published app.
No. US2014/0271635. In some embodiments, the constant region or portion is of
a human IgG,
such as IgG4 or IgGl. In some embodiments, the spacer has the sequence set
forth in SEQ ID
NO: 1, and is encoded by the sequence set forth in SEQ ID NO: 2. In some
embodiments, the
spacer has the sequence set forth in SEQ ID NO: 3. In some embodiments, the
spacer has the
sequence set forth in SEQ ID NO: 4.
113
CA 03049461 2019-07-04
WO 2018/132518 PCT/US2018/013227
[0433] In some aspects, the spacer is a polypeptide spacer that (a) comprises
or consists of
all or a portion of an immunoglobulin hinge or a modified version thereof or
comprises about 15
amino acids or less, and does not comprise a CD28 extracellular region or a
CD8 extracellular
region, (b) comprises or consists of all or a portion of an immunoglobulin
hinge, optionally an
IgG4 hinge, or a modified version thereof and/or comprises about 15 amino
acids or less, and
does not comprise a CD28 extracellular region or a CD8 extracellular region,
or (c) is at or about
12 amino acids in length and/or comprises or consists of all or a portion of
an immunoglobulin
hinge, optionally an IgG4, or a modified version thereof; or (d) consists or
comprises the
sequence of amino acids set forth in SEQ ID NOS: 1, 3-5, 27-34 or 58, or a
variant of any of the
foregoing having at least 85%, 86%, 87%, 88%, 89%, 90%, 91%, 92%, 93%, 94%,
95%, 96%,
97%, 98%, 99% or more sequence identity thereto, or (e) comprises or consists
of the formula
X1PPX2P, where Xi is glycine, cysteine or arginine and X2 is cysteine or
threonine.
[0434] In some embodiments, the constant region or portion is of IgD. In some
embodiments, the spacer has the sequence set forth in SEQ ID NO: 5. In some
embodiments,
the spacer has a sequence of amino acids that exhibits at least or at least
about 85%, 86%, 87%,
88%, 89%, 90%, 91%, 92%, 93%, 94%, 95%, 96%, 97%, 98%, 99% or more sequence
identity
to any of SEQ ID NOS: 1, 3, 4 and 5.
[0435] This antigen recognition domain generally is linked to one or more
intracellular
signaling components, such as signaling components that mimic activation
through an antigen
receptor complex, such as a TCR complex, in the case of a CAR, and/or signal
via another cell
surface receptor. The signal may be immunostimulatory and/or costimulatory in
some
embodiments. In some embodiments, it may be suppressive, e.g., immunosuppres
sive. Thus, in
some embodiments, the antigen-binding component (e.g., antibody) is linked to
one or more
transmembrane and intracellular signaling domains and/or regions. In some
embodiments, the
transmembrane domain is fused to the extracellular domain. In one embodiment,
a
transmembrane domain that naturally is associated with one of the domains in
the receptor, e.g.,
CAR, is used. In some instances, the transmembrane domain is selected or
modified by amino
acid substitution to avoid binding of such domains to the transmembrane
domains of the same or
different surface membrane proteins to minimize interactions with other
members of the
receptor complex.
[0436] The transmembrane domain in some embodiments is derived either from a
natural or
from a synthetic source. Where the source is natural, the domain in some
aspects is derived
from any membrane-bound or transmembrane protein. Transmembrane regions
include those
114
CA 03049461 2019-07-04
WO 2018/132518 PCT/US2018/013227
derived from (i.e. comprise at least the transmembrane region(s) of) the
alpha, beta or zeta chain
of the T-cell receptor, CD28, CD3 epsilon, CD45, CD4, CD5, CD8, CD9, CD16,
CD22, CD33,
CD37, CD64, CD80, CD86, CD134, CD137, CD154 and/or transmembrane regions
containing
functional variants thereof such as those retaining a substantial portion of
the structural, e.g.,
transmembrane, properties thereof. In some embodiments, the transmembrane
domain is a
transmembrane domain derived from CD4, CD28, or CD8, e.g., CD8alpha, or
functional variant
thereof. The transmembrane domain in some embodiments is synthetic. In some
aspects, the
synthetic transmembrane domain comprises predominantly hydrophobic residues
such as leucine
and valine. In some aspects, a triplet of phenylalanine, tryptophan and valine
will be found at
each end of a synthetic transmembrane domain. In some embodiments, the linkage
is by linkers,
spacers, and/or transmembrane domain(s).
[0437] Among the intracellular signaling domains are those that mimic or
approximate a
signal through a natural antigen receptor, a signal through such a receptor in
combination with a
costimulatory receptor, and/or a signal through a costimulatory receptor
alone. In some
embodiments, a short oligo- or polypeptide linker, for example, a linker of
between 2 and 10
amino acids in length, such as one containing glycines and serines, e.g.,
glycine-serine doublet,
is present and forms a linkage between the transmembrane domain and the
cytoplasmic
signaling domain of the CAR.
[0438] The receptor, e.g., the CAR, generally includes at least one
intracellular signaling
component or components. In some embodiments, the receptor includes an
intracellular
component of a TCR complex, such as a TCR CD3 chain that mediates T-cell
activation and
cytotoxicity, e.g., CD3 zeta chain. Thus, in some aspects, the antigen-binding
portion is linked
to one or more cell signaling modules. In some embodiments, cell signaling
modules include
CD3 transmembrane domain, CD3 intracellular signaling domains, and/or other CD
transmembrane domains. In some embodiments, the receptor, e.g., CAR, further
includes a
portion of one or more additional molecules such as Fc receptor y, CD8, CD4,
CD25, or CD16.
For example, in some aspects, the CAR or other chimeric receptor includes a
chimeric molecule
between CD3-zeta (CD3-) or Fc receptor y and CD8, CD4, CD25 or CD16.
[0439] In some embodiments, upon ligation of the CAR or other chimeric
receptor, the
cytoplasmic domain or intracellular signaling domain and/or region of the
receptor activates at
least one of the normal effector functions or responses of the immune cell,
e.g., T cell
engineered to express the CAR. For example, in some contexts, the CAR induces
a function of
a T cell such as cytolytic activity or T-helper activity, such as secretion of
cytokines or other
115
CA 03049461 2019-07-04
WO 2018/132518 PCT/US2018/013227
factors. In some embodiments, a truncated portion of an intracellular
signaling domain of an
antigen receptor component or costimulatory molecule is used in place of an
intact
immunostimulatory chain, for example, if it transduces the effector function
signal. In some
embodiments, the intracellular signaling domain and/or region or domains
include the
cytoplasmic sequences of the T cell receptor (TCR), and in some aspects also
those of co-
receptors that in the natural context act in concert with such receptors to
initiate signal
transduction following antigen receptor engagement, and/or any derivative or
variant of such
molecules, and/or any synthetic sequence that has the same functional
capability.
[0440] In the context of a natural TCR, full activation generally requires not
only signaling
through the TCR, but also a costimulatory signal. Thus, in some embodiments,
to promote full
activation, a component for generating secondary or co-stimulatory signal is
also included in the
CAR. In other embodiments, the CAR does not include a component for generating
a
costimulatory signal. In some aspects, an additional CAR is expressed in the
same cell and
provides the component for generating the secondary or costimulatory signal.
[0441] T cell activation is in some aspects described as being mediated by two
classes of
cytoplasmic signaling sequences: those that initiate antigen-dependent primary
activation
through the TCR (primary cytoplasmic signaling sequences), and those that act
in an antigen-
independent manner to provide a secondary or co-stimulatory signal (secondary
cytoplasmic
signaling sequences). In some aspects, the CAR includes one or both of such
signaling
components.
[0442] In some aspects, the CAR includes a primary cytoplasmic signaling
sequence derived
from a signaling molecule or domain that promotes primary activation of a TCR
complex in a
natural setting. Primary cytoplasmic signaling sequences that act in a
stimulatory manner may
contain signaling motifs which are known as immunoreceptor tyrosine-based
activation motifs
or ITAMs. Examples of ITAM containing primary cytoplasmic signaling sequences
include
those derived from the TCR or CD3 zeta chain, FcR gamma, CD3 gamma, CD3 delta
and CD3
epsilon or FcR beta. In some embodiments, cytoplasmic signaling molecule(s) in
the CAR
contain(s) a cytoplasmic signaling domain, portion thereof, or sequence
derived from CD3 zeta.
[0443] In some embodiments, the CAR includes a signaling domain and/or
transmembrane
portion of a costimulatory receptor, such as CD28, 4-1BB, 0X40, DAP10, and
ICOS. In some
aspects, the same CAR includes both the activating and costimulatory
components.
[0444] In some embodiments, the activating domain is included within one CAR,
whereas
the costimulatory component is provided by another CAR recognizing another
antigen, present
116
CA 03049461 2019-07-04
WO 2018/132518 PCT/US2018/013227
on the same cell. In some embodiments, the CARs include activating or
stimulatory CARs,
costimulatory CARs, both expressed on the same cell (see W02014/055668). In
some aspects,
the cells include one or more stimulatory or activating CAR and/or a
costimulatory CAR. In
some embodiments, the cells further include inhibitory CARs (iCARs, see
Fedorov et al., Sci.
Transl. Medicine, 5(215) (December, 2013), such as a CAR recognizing an
antigen other than
the one associated with and/or specific for the disease or condition whereby
an activating signal
delivered through the disease-targeting CAR is diminished or inhibited by
binding of the
inhibitory CAR to its ligand, e.g., to reduce off-target effects.
[0445] In some embodiments, the intracellular signaling component of the
recombinant
receptor, such as CAR, comprises a CD3 zeta intracellular domain and a
costimulatory signaling
region. In certain embodiments, the intracellular signaling domain comprises a
CD28
transmembrane and signaling domain linked to a CD3 (e.g., CD3-zeta)
intracellular domain. In
some embodiments, the intracellular signaling domain comprises a chimeric CD28
and CD137
(4-1BB, TNFRSF9) co-stimulatory domains, linked to a CD3 zeta intracellular
domain.
[0446] In some embodiments, the CAR encompasses one or more, e.g., two or
more,
costimulatory domains and an activation domain, e.g., primary activation
domain, in the
cytoplasmic portion. Exemplary CARs include intracellular components of CD3-
zeta, CD28,
and 4-1BB.
[0447] In some embodiments, the CAR or other antigen receptor further includes
a marker,
such as a cell surface marker, which may be used to confirm transduction or
engineering of the
cell to express the receptor, such as a truncated version of a cell surface
receptor, such as
truncated EGFR (tEGFR). In some aspects, the marker includes all or part
(e.g., truncated form)
of CD34, a NGFR, or epidermal growth factor receptor (e.g., tEGFR). In some
embodiments,
the nucleic acid encoding the marker is operably linked to a polynucleotide
encoding for a linker
sequence, such as a cleavable linker sequence, e.g., T2A. For example, a
marker, and optionally
a linker sequence, can be any as disclosed in published patent application No.
W02014031687.
For example, the marker can be a truncated EGFR (tEGFR) that is, optionally,
linked to a linker
sequence, such as a T2A cleavable linker sequence. In some embodiments, the
marker is a
molecule, e.g., cell surface protein, not naturally found on T cells or not
naturally found on the
surface of T cells, or a portion thereof.
[0448] In some embodiments, the molecule is a non-self molecule, e.g., non-
self protein, i.e.,
one that is not recognized as "self' by the immune system of the host into
which the cells will be
adoptively transferred.
117
CA 03049461 2019-07-04
WO 2018/132518 PCT/US2018/013227
[0449] In some embodiments, the marker serves no therapeutic function and/or
produces no
effect other than to be used as a marker for genetic engineering, e.g., for
selecting cells
successfully engineered. In other embodiments, the marker may be a therapeutic
molecule or
molecule otherwise exerting some desired effect, such as a ligand for a cell
to be encountered in
vivo, such as a costimulatory or immune checkpoint molecule to enhance and/or
dampen
responses of the cells upon adoptive transfer and encounter with ligand.
[0450] In some cases, CARs are referred to as first, second, and/or third
generation CARs.
In some aspects, a first generation CAR is one that solely provides a CD3-
chain induced signal
upon antigen binding; in some aspects, a second-generation CARs is one that
provides such a
signal and costimulatory signal, such as one including an intracellular
signaling domain from a
costimulatory receptor such as CD28 or CD137; in some aspects, a third
generation CAR is one
that includes multiple costimulatory domains of different costimulatory
receptors.
[0451] In some embodiments, the chimeric antigen receptor includes an
extracellular portion
containing an antigen-binding domain, such as an antibody or antigen-binding
antibody
fragment, such as an scFv or Fv. In some aspects, the chimeric antigen
receptor includes an
extracellular portion containing the antibody or fragment and an intracellular
signaling domain.
In some embodiments, the antibody or fragment includes an scFv or a single-
domain VH
antibody and the intracellular domain contains an ITAM. In some aspects, the
intracellular
signaling domain includes a signaling domain of a zeta chain of a CD3-zeta
(CD3) chain. In
some embodiments, the chimeric antigen receptor includes a transmembrane
domain linking the
extracellular domain and the intracellular signaling domain. In some aspects,
the
transmembrane domain contains a transmembrane portion of CD28. In some
embodiments, the
chimeric antigen receptor contains an intracellular domain of a T cell
costimulatory molecule.
The extracellular domain and transmembrane domain can be linked directly or
indirectly. In
some embodiments, the extracellular domain and transmembrane are linked by a
spacer, such as
any described herein. In some embodiments, the receptor contains extracellular
portion of the
molecule from which the transmembrane domain is derived, such as a CD28
extracellular
portion. In some embodiments, the chimeric antigen receptor contains an
intracellular domain
derived from a T cell costimulatory molecule or a functional variant thereof,
such as between the
transmembrane domain and intracellular signaling domain. In some aspects, the
T cell
costimulatory molecule is CD28 or 41BB.
[0452] For example, in some embodiments, the CAR contains an antibody, e.g.,
an antibody
fragment, a transmembrane domain that is or contains a transmembrane portion
of CD28 or a
118
CA 03049461 2019-07-04
WO 2018/132518 PCT/US2018/013227
functional variant thereof, and an intracellular signaling domain containing a
signaling portion
of CD28 or functional variant thereof and a signaling portion of CD3 zeta or
functional variant
thereof. In some embodiments, the CAR contains an antibody, e.g., antibody
fragment, a
transmembrane domain that is or contains a transmembrane portion of CD28 or a
functional
variant thereof, and an intracellular signaling domain containing a signaling
portion of a 4-1BB
or functional variant thereof and a signaling portion of CD3 zeta or
functional variant thereof.
In some such embodiments, the receptor further includes a spacer containing a
portion of an Ig
molecule, such as a human Ig molecule, such as an Ig hinge, e.g. an IgG4
hinge, such as a hinge-
only spacer.
[0453] In some embodiments, the transmembrane domain of the receptor, e.g.,
the CAR is a
transmembrane domain of human CD28 or variant thereof, e.g., a 27-amino acid
transmembrane
domain of a human CD28 (Accession No.: P10747.1), or is a transmembrane domain
that
comprises the sequence of amino acids set forth in SEQ ID NO: 8 or a sequence
of amino acids
that exhibits at least or at least about85%, 86%, 87%, 88%, 89%, 90%, 91%,
92%, 93%, 94%,
95%, 96%, 97%, 98%, 99% or more sequence identity to SEQ ID NO:8; in some
embodiments,
the transmembrane-domain containing portion of the recombinant receptor
comprises the
sequence of amino acids set forth in SEQ ID NO: 9 or a sequence of amino acids
having at least
or at least about 85%, 86%, 87%, 88%, 89%, 90%, 91%, 92%, 93%, 94%, 95%, 96%,
97%,
98%, 99% or more sequence identity thereto.
[0454] In some embodiments, the intracellular signaling region comprises an
intracellular
costimulatory signaling domain of human CD28 or functional variant or portion
thereof, such as
a 41 amino acid domain thereof and/or such a domain with an LL to GG
substitution at positions
186-187 of a native CD28 protein. In some embodiments, the intracellular
signaling domain can
comprise the sequence of amino acids set forth in SEQ ID NO: 10 or 11 or a
sequence of amino
acids that exhibits at least or at least about 85%, 86%, 87%, 88%, 89%, 90%,
91%, 92%, 93%,
94%, 95%, 96%, 97%, 98%, 99% or more sequence identity to SEQ ID NO: 10 or 11.
In some
embodiments, the intracellular region comprises an intracellular costimulatory
signaling domain
of 4-1BB or functional variant or portion thereof, such as a 42-amino acid
cytoplasmic domain
of a human 4-1BB (Accession No. Q07011.1) or functional variant or portion
thereof, such as
the sequence of amino acids set forth in SEQ ID NO: 12 or a sequence of amino
acids that
exhibits at least or at least about 85%, 86%, 87%, 88%, 89%, 90%, 91%, 92%,
93%, 94%, 95%,
96%, 97%, 98%, 99% or more sequence identity to SEQ ID NO: 12.
119
CA 03049461 2019-07-04
WO 2018/132518 PCT/US2018/013227
[0455] In some embodiments, the intracellular signaling region comprises a
human CD3
chain, optionally a CD3 zeta stimulatory signaling domain or functional
variant thereof, such as
an 112 AA cytoplasmic domain of isoform 3 of human CD3 (Accession No.:
P20963.2) or a
CD3 zeta signaling domain as described in U.S. Patent No.: 7,446,190 or U.S.
Patent No.
8,911,993. In some embodiments, the intracellular signaling region comprises
the sequence of
amino acids set forth in SEQ ID NO: 13, 14 or 15 or a sequence of amino acids
that exhibits at
least or at least about 85%, 86%, 87%, 88%, 89%, 90%, 91%, 92%, 93%, 94%, 95%,
96%, 97%,
98%, 99% or more sequence identity to SEQ ID NO: 13, 14 or 15.
[0456] In some aspects, the spacer contains only a hinge region of an IgG,
such as only a
hinge of IgG4 or IgGl, such as the hinge only spacer set forth in SEQ ID NO:l.
In other
embodiments, the spacer is an Ig hinge, e.g., and IgG4 hinge, linked to a CH2
and/or CH3
domains. In some embodiments, the spacer is an Ig hinge, e.g., an IgG4 hinge,
linked to CH2
and CH3 domains, such as set forth in SEQ ID NO:3. In some embodiments, the
spacer is an Ig
hinge, e.g., an IgG4 hinge, linked to a CH3 domain only, such as set forth in
SEQ ID NO:4. In
some embodiments, the spacer is or comprises a glycine-serine rich sequence or
other flexible
linker such as known flexible linkers.
[0457] In some embodiments, the chimeric antigen receptor contains an
intracellular domain
of a T cell costimulatory molecule. In some aspects, the T cell costimulatory
molecule is CD28
or 41BB.
[0458] For example, in some embodiments, the CAR includes an antibody such as
an
antibody fragment, including scFvs, a spacer, such as a spacer containing a
portion of an
immunoglobulin molecule, such as a hinge region and/or one or more constant
regions of a
heavy chain molecule, such as an Ig-hinge containing spacer, a transmembrane
domain
containing all or a portion of a CD28-derived transmembrane domain, a CD28-
derived
intracellular signaling domain, and a CD3 zeta signaling domain. In some
embodiments, the
CAR includes an antibody or fragment, such as scFv, a spacer such as any of
the Ig-hinge
containing spacers, a CD28-derived transmembrane domain, a 4-1BB-derived
intracellular
signaling domain, and a CD3 zeta-derived signaling domain.
[0459] In some embodiments, nucleic acid molecules encoding such CAR
constructs further
includes a sequence encoding a T2A ribosomal skip element and/or a tEGFR
sequence, e.g.,
downstream of the sequence encoding the CAR. In some embodiments, T cells
expressing an
antigen receptor (e.g. CAR) can also be generated to express a truncated EGFR
(EGFRt) as a
non-immunogenic selection epitope (e.g. by introduction of a construct
encoding the CAR and
120
CA 03049461 2019-07-04
WO 2018/132518 PCT/US2018/013227
EGFRt separated by a T2A ribosome switch to express two proteins from the same
construct),
which then can be used as a marker to detect such cells (see e.g. U.S. Patent
No. 8,802,374).
[0460] The terms "polypeptide" and "protein" are used interchangeably to refer
to a polymer
of amino acid residues, and are not limited to a minimum length. Polypeptides,
including the
provided receptors and other polypeptides, e.g., linkers or peptides, may
include amino acid
residues including natural and/or non-natural amino acid residues. The terms
also include post-
expression modifications of the polypeptide, for example, glycosylation,
sialylation, acetylation,
and phosphorylation. In some aspects, the polypeptides may contain
modifications with respect
to a native or natural sequence, as long as the protein maintains the desired
activity. These
modifications may be deliberate, as through site-directed mutagenesis, or may
be accidental,
such as through mutations of hosts which produce the proteins or errors due to
PCR
amplification.
2 7' Cell Receptors (TCRs)
[0461] In some embodiments, engineered cells, such as T cells, are provided
that express a T
cell receptor (TCR) or antigen-binding portion thereof that recognizes an
peptide epitope or T
cell epitope of a target polypeptide, such as an antigen of a tumor, viral or
autoimmune protein.
[0462] In some embodiments, a "T cell receptor" or "TCR" is a molecule that
contains a
variable a and 0 chains (also known as TCRa and TCRP, respectively) or a
variable y and 6
chains (also known as TCRa and TCRP, respectively), or antigen-binding
portions thereof, and
which is capable of specifically binding to a peptide bound to an MHC
molecule. In some
embodiments, the TCR is in the af3 form. Typically, TCRs that exist in af3 and
y6 forms are
generally structurally similar, but T cells expressing them may have distinct
anatomical
locations or functions. A TCR can be found on the surface of a cell or in
soluble form.
Generally, a TCR is found on the surface of T cells (or T lymphocytes) where
it is generally
responsible for recognizing antigens bound to major histocompatibility complex
(MHC)
molecules.
[0463] Unless otherwise stated, the term "TCR" should be understood to
encompass full
TCRs as well as antigen-binding portions or antigen-binding fragments thereof.
In some
embodiments, the TCR is an intact or full-length TCR, including TCRs in the
af3 form or y6
form. In some embodiments, the TCR is an antigen-binding portion that is less
than a full-
length TCR but that binds to a specific peptide bound in an MHC molecule, such
as binds to an
MHC-peptide complex. In some cases, an antigen-binding portion or fragment of
a TCR can
121
CA 03049461 2019-07-04
WO 2018/132518 PCT/US2018/013227
contain only a portion of the structural domains of a full-length or intact
TCR, but yet is able to
bind the peptide epitope, such as MHC-peptide complex, to which the full TCR
binds. In some
cases, an antigen-binding portion contains the variable domains of a TCR, such
as variable a
chain and variable 0 chain of a TCR, sufficient to form a binding site for
binding to a specific
MHC-peptide complex. Generally, the variable chains of a TCR contain
complementarity
determining regions involved in recognition of the peptide, MHC and/or MHC-
peptide complex.
[0464] In some embodiments, the variable domains of the TCR contain
hypervariable loops,
or complementarity determining regions (CDRs), which generally are the primary
contributors
to antigen recognition and binding capabilities and specificity. In some
embodiments, a CDR of
a TCR or combination thereof forms all or substantially all of the antigen-
binding site of a given
TCR molecule. The various CDRs within a variable region of a TCR chain
generally are
separated by framework regions (FRs), which generally display less variability
among TCR
molecules as compared to the CDRs (see, e.g., Jores et al., Proc. Nat'l Acad.
Sci. U.S.A.
87:9138, 1990; Chothia et al., EMBO J. 7:3745, 1988; see also Lefranc et al.,
Dev. Comp.
Immunol. 27:55, 2003). In some embodiments, CDR3 is the main CDR responsible
for antigen
binding or specificity, or is the most important among the three CDRs on a
given TCR variable
region for antigen recognition, and/or for interaction with the processed
peptide portion of the
peptide-MHC complex. In some contexts, the CDR1 of the alpha chain can
interact with the N-
terminal part of certain antigenic peptides. In some contexts, CDR1 of the
beta chain can
interact with the C-terminal part of the peptide. In some contexts, CDR2
contributes most
strongly to or is the primary CDR responsible for the interaction with or
recognition of the MHC
portion of the MHC-peptide complex. In some embodiments, the variable region
of the 13-chain
can contain a further hypervariable region (CDR4 or HVR4), which generally is
involved in
superantigen binding and not antigen recognition (Kotb (1995) Clinical
Microbiology Reviews,
8:411-426).
[0465] In some embodiments, a TCR also can contain a constant domain, a
transmembrane
domain and/or a short cytoplasmic tail (see, e.g., Janeway et al.,
Immunobiology: The Immune
System in Health and Disease, 3rd Ed., Current Biology Publications, p. 4:33,
1997). In some
aspects, each chain of the TCR can possess one N-terminal immunoglobulin
variable domain,
one immunoglobulin constant domain, a transmembrane region, and a short
cytoplasmic tail at
the C-terminal end. In some embodiments, a TCR is associated with invariant
proteins of the
CD3 complex involved in mediating signal transduction.
122
CA 03049461 2019-07-04
WO 2018/132518 PCT/US2018/013227
[0466] In some embodiments, a TCR chain contains one or more constant domain.
For
example, the extracellular portion of a given TCR chain (e.g., a-chain or 3-
chain) can contain
two immunoglobulin-like domains, such as a variable domain (e.g., Va or VP;
typically amino
acids 1 to 116 based on Kabat numbering Kabat et al., "Sequences of Proteins
of Immunological
Interest, US Dept. Health and Human Services, Public Health Service National
Institutes of
Health, 1991, 5th ed.) and a constant domain (e.g., a-chain constant domain or
Ca, typically
positions 117 to 259 of the chain based on Kabat numbering or r3 chain
constant domain or Co,
typically positions 117 to 295 of the chain based on Kabat) adjacent to the
cell membrane. For
example, in some cases, the extracellular portion of the TCR formed by the two
chains contains
two membrane-proximal constant domains, and two membrane-distal variable
domains, which
variable domains each contain CDRs. The constant domain of the TCR may contain
short
connecting sequences in which a cysteine residue forms a disulfide bond,
thereby linking the
two chains of the TCR. In some embodiments, a TCR may have an additional
cysteine residue in
each of the a and 0 chains, such that the TCR contains two disulfide bonds in
the constant
domains.
[0467] In some embodiments, the TCR chains contain a transmembrane domain. In
some
embodiments, the transmembrane domain is positively charged. In some cases,
the TCR chain
contains a cytoplasmic tail. In some cases, the structure allows the TCR to
associate with other
molecules like CD3 and subunits thereof. For example, a TCR containing
constant domains
with a transmembrane region may anchor the protein in the cell membrane and
associate with
invariant subunits of the CD3 signaling apparatus or complex. The
intracellular tails of CD3
signaling subunits (e.g. CD3y, CD3, CD3E and CD3t chains) contain one or more
immunoreceptor tyrosine-based activation motif or ITAM that are involved in
the signaling
capacity of the TCR complex.
[0468] In some embodiments, the TCR may be a heterodimer of two chains a and 0
(or
optionally y and 6) or it may be a single chain TCR construct. In some
embodiments, the TCR
is a heterodimer containing two separate chains (a and 0 chains or y and 6
chains) that are
linked, such as by a disulfide bond or disulfide bonds.
[0469] In some embodiments, the TCR can be generated from a known TCR
sequence(s),
such as sequences of Va,0 chains, for which a substantially full-length coding
sequence is
readily available. Methods for obtaining full-length TCR sequences, including
V chain
sequences, from cell sources are well known. In some embodiments, nucleic
acids encoding the
123
CA 03049461 2019-07-04
WO 2018/132518 PCT/US2018/013227
TCR can be obtained from a variety of sources, such as by polymerase chain
reaction (PCR)
amplification of TCR-encoding nucleic acids within or isolated from a given
cell or cells, or
synthesis of publicly available TCR DNA sequences.
[0470] In some embodiments, the TCR is obtained from a biological source, such
as from
cells such as from a T cell (e.g. cytotoxic T cell), T-cell hybridomas or
other publicly available
source. In some embodiments, the T-cells can be obtained from in vivo isolated
cells. In some
embodiments, the TCR is a thymically selected TCR. In some embodiments, the
TCR is a
neoepitope-restricted TCR. In some embodiments, the T- cells can be a cultured
T-cell
hybridoma or clone. In some embodiments, the TCR or antigen-binding portion
thereof or
antigen-binding fragment thereof can be synthetically generated from knowledge
of the
sequence of the TCR.
[0471] In some embodiments, the TCR is generated from a TCR identified or
selected from
screening a library of candidate TCRs against a target polypeptide antigen, or
target T cell
epitope thereof. TCR libraries can be generated by amplification of the
repertoire of Va and VP
from T cells isolated from a subject, including cells present in PBMCs, spleen
or other lymphoid
organ. In some cases, T cells can be amplified from tumor-infiltrating
lymphocytes (TILs). In
some embodiments, TCR libraries can be generated from CD4+ or CD8+ cells. In
some
embodiments, the TCRs can be amplified from a T cell source of a normal of
healthy subject,
i.e. normal TCR libraries. In some embodiments, the TCRs can be amplified from
a T cell
source of a diseased subject, i.e. diseased TCR libraries. In some
embodiments, degenerate
primers are used to amplify the gene repertoire of Va and VP, such as by RT-
PCR in samples,
such as T cells, obtained from humans. In some embodiments, scTv libraries can
be assembled
from naïve Va and VP libraries in which the amplified products are cloned or
assembled to be
separated by a linker. Depending on the source of the subject and cells, the
libraries can be
HLA allele-specific. Alternatively, in some embodiments, TCR libraries can be
generated by
mutagenesis or diversification of a parent or scaffold TCR molecule. In some
aspects, the TCRs
are subjected to directed evolution, such as by mutagenesis, e.g., of the a or
0 chain. In some
aspects, particular residues within CDRs of the TCR are altered. In some
embodiments, selected
TCRs can be modified by affinity maturation. In some embodiments, antigen-
specific T cells
may be selected, such as by screening to assess CTL activity against the
peptide. In some
aspects, TCRs, e.g. present on the antigen-specific T cells, may be selected,
such as by binding
activity, e.g., particular affinity or avidity for the antigen.
124
CA 03049461 2019-07-04
WO 2018/132518 PCT/US2018/013227
[0472] In some embodiments, the genetically engineered antigen receptors
include
recombinant T cell receptors (TCRs) and/or TCRs cloned from naturally
occurring T cells. In
some embodiments, a high-affinity T cell clone for a target antigen (e.g., a
cancer antigen) is
identified, isolated from a patient, and introduced into the cells. In some
embodiments, the TCR
clone for a target antigen has been generated in transgenic mice engineered
with human immune
system genes (e.g., the human leukocyte antigen system, or HLA). See, e.g.,
tumor antigens
(see, e.g., Parkhurst et al. (2009) Clin Cancer Res. 15:169-180 and Cohen et
al. (2005) J
Immunol. 175:5799-5808. In some embodiments, phage display is used to isolate
TCRs against
a target antigen (see, e.g., Varela-Rohena et al. (2008) Nat Med. 14:1390-1395
and Li (2005)
Nat Biotechnol. 23:349-354.
[0473] In some embodiments, the TCR or antigen-binding portion thereof is one
that has
been modified or engineered. In some embodiments, directed evolution methods
are used to
generate TCRs with altered properties, such as with higher affinity for a
specific MHC-peptide
complex. In some embodiments, directed evolution is achieved by display
methods including,
but not limited to, yeast display (Holler et al. (2003) Nat Immunol, 4,55-62;
Holler et al. (2000)
Proc Natl Acad Sci U S A, 97,5387-92), phage display (Li et al. (2005) Nat
Biotechnol, 23,
349-54), or T cell display (Chervin et al. (2008) J Immunol Methods, 339,175-
84). In some
embodiments, display approaches involve engineering, or modifying, a known,
parent or
reference TCR. For example, in some cases, a wild-type TCR can be used as a
template for
producing mutagenized TCRs in which in one or more residues of the CDRs are
mutated, and
mutants with an desired altered property, such as higher affinity for a
desired target antigen, are
selected.
[0474] In some embodiments, peptides of a target polypeptide for use in
producing or
generating a TCR of interest are known or can be readily identified by a
skilled artisan. In some
embodiments, peptides suitable for use in generating TCRs or antigen-binding
portions can be
determined based on the presence of an HLA-restricted motif in a target
polypeptide of interest,
such as a target polypeptide described below. In some embodiments, peptides
are identified
using available computer prediction models. In some embodiments, for
predicting MHC class I
binding sites, such models include, but are not limited to, ProPredl (Singh
and Raghava (2001)
Bioinformatics 17(12):1236-1237, and SYFPEITHI (see Schuler et al. (2007)
Immunoinformatics Methods in Molecular Biology, 409(1): 75-93 2007). In some
embodiments, the MHC-restricted epitope is HLA-A0201, which is expressed in
approximately
125
CA 03049461 2019-07-04
WO 2018/132518 PCT/US2018/013227
39-46% of all Caucasians and therefore, represents a suitable choice of MHC
antigen for use
preparing a TCR or other MHC-peptide binding molecule.
[0475] HLA-A0201-binding motifs and the cleavage sites for proteasomes and
immune-
proteasomes using computer prediction models are known. For predicting MHC
class I binding
sites, such models include, but are not limited to, ProPredl (described in
more detail in Singh
and Raghava, ProPred: prediction of HLA-DR binding sites. BIOINFORMATICS
17(12):1236-
1237 2001), and SYFPEITHI (see Schuler et al. SYFPEITHI, Database for
Searching and T-Cell
Epitope Prediction. in Immunoinformatics Methods in Molecular Biology, vol
409(1): 75-93
2007).
[0476] In some embodiments, the TCR or antigen binding portion thereof may be
a
recombinantly produced natural protein or mutated form thereof in which one or
more property,
such as binding characteristic, has been altered. In some embodiments, a TCR
may be derived
from one of various animal species, such as human, mouse, rat, or other
mammal. A TCR may
be cell-bound or in soluble form. In some embodiments, for purposes of the
provided methods,
the TCR is in cell-bound form expressed on the surface of a cell.
[0477] In some embodiments, the TCR is a full-length TCR. In some embodiments,
the
TCR is an antigen-binding portion. In some embodiments, the TCR is a dimeric
TCR (dTCR).
In some embodiments, the TCR is a single-chain TCR (sc-TCR). In some
embodiments, a
dTCR or scTCR have the structures as described in WO 03/020763, WO 04/033685,
W02011/044186.
[0478] In some embodiments, the TCR contains a sequence corresponding to the
transmembrane sequence. In some embodiments, the TCR does contain a sequence
corresponding to cytoplasmic sequences. In some embodiments, the TCR is
capable of forming
a TCR complex with CD3. In some embodiments, any of the TCRs, including a dTCR
or
scTCR, can be linked to signaling domains that yield an active TCR on the
surface of a T cell.
In some embodiments, the TCR is expressed on the surface of cells.
[0479] In some embodiments a dTCR contains a first polypeptide wherein a
sequence
corresponding to a TCR a chain variable region sequence is fused to the N
terminus of a
sequence corresponding to a TCR a chain constant region extracellular
sequence, and a second
polypeptide wherein a sequence corresponding to a TCR 0 chain variable region
sequence is
fused to the N terminus a sequence corresponding to a TCR f3 chain constant
region extracellular
sequence, the first and second polypeptides being linked by a disulfide bond.
In some
embodiments, the bond can correspond to the native inter-chain disulfide bond
present in native
126
CA 03049461 2019-07-04
WO 2018/132518 PCT/US2018/013227
dimeric af3 TCRs. In some embodiments, the interchain disulfide bonds are not
present in a
native TCR. For example, in some embodiments, one or more cysteines can be
incorporated
into the constant region extracellular sequences of dTCR polypeptide pair. In
some cases, both a
native and a non-native disulfide bond may be desirable. In some embodiments,
the TCR
contains a transmembrane sequence to anchor to the membrane.
[0480] In some embodiments, a dTCR contains a TCR a chain containing a
variable a
domain, a constant a domain and a first dimerization motif attached to the C-
terminus of the
constant a domain, and a TCR 0 chain comprising a variable 0 domain, a
constant 0 domain and
a first dimerization motif attached to the C-terminus of the constant f3
domain, wherein the first
and second dimerization motifs easily interact to form a covalent bond between
an amino acid in
the first dimerization motif and an amino acid in the second dimerization
motif linking the TCR
a chain and TCR 0 chain together.
[0481] In some embodiments, the TCR is a scTCR. Typically, a scTCR can be
generated
using methods known, See e.g., Soo Hoo, W. F. et al. PNAS (USA) 89, 4759
(1992); Wiilfing,
C. and Pliickthun, A., J. Mol. Biol. 242, 655 (1994); Kurucz, I. et al. PNAS
(USA) 90 3830
(1993); International published PCT Nos. WO 96/13593, WO 96/18105, W099/60120,
W099/18129, WO 03/020763, W02011/044186; and Schlueter, C. J. et al. J. Mol.
Biol. 256,
859 (1996). In some embodiments, a scTCR contains an introduced non-native
disulfide
interchain bond to facilitate the association of the TCR chains (see e.g.
International published
PCT No. WO 03/020763). In some embodiments, a scTCR is a non-disulfide linked
truncated
TCR in which heterologous leucine zippers fused to the C-termini thereof
facilitate chain
association (see e.g. International published PCT No. W099/60120). In some
embodiments, a
scTCR contain a TCRa variable domain covalently linked to a TCRf3 variable
domain via a
peptide linker (see e.g., International published PCT No. W099/18129).
[0482] In some embodiments, a scTCR contains a first segment constituted by an
amino
acid sequence corresponding to a TCR a chain variable region, a second segment
constituted by
an amino acid sequence corresponding to a TCR 13 chain variable region
sequence fused to the N
terminus of an amino acid sequence corresponding to a TCR 13 chain constant
domain
extracellular sequence, and a linker sequence linking the C terminus of the
first segment to the N
terminus of the second segment.
[0483] In some embodiments, a scTCR contains a first segment constituted by an
a chain
variable region sequence fused to the N terminus of an a chain extracellular
constant domain
sequence, and a second segment constituted by a 13 chain variable region
sequence fused to the N
127
CA 03049461 2019-07-04
WO 2018/132518 PCT/US2018/013227
terminus of a sequence f3 chain extracellular constant and transmembrane
sequence, and,
optionally, a linker sequence linking the C terminus of the first segment to
the N terminus of the
second segment.
[0484] In some embodiments, a scTCR contains a first segment constituted by a
TCR f3
chain variable region sequence fused to the N terminus of a 0 chain
extracellular constant
domain sequence, and a second segment constituted by an a chain variable
region sequence
fused to the N terminus of a sequence a chain extracellular constant and
transmembrane
sequence, and, optionally, a linker sequence linking the C terminus of the
first segment to the N
terminus of the second segment.
[0485] In some embodiments, the linker of a scTCRs that links the first and
second TCR
segments can be any linker capable of forming a single polypeptide strand,
while retaining TCR
binding specificity. In some embodiments, the linker sequence may, for
example, have the
formula -P-AA-P- wherein P is proline and AA represents an amino acid sequence
wherein the
amino acids are glycine and serine. In some embodiments, the first and second
segments are
paired so that the variable region sequences thereof are orientated for such
binding. Hence, in
some cases, the linker has a sufficient length to span the distance between
the C terminus of the
first segment and the N terminus of the second segment, or vice versa, but is
not too long to
block or reduces bonding of the scTCR to the target ligand. In some
embodiments, the linker can
contain from or from about 10 to 45 amino acids, such as 10 to 30 amino acids
or 26 to 41
amino acids residues, for example 29, 30, 31 or 32 amino acids. In some
embodiments, the
linker has the formula -PGGG-(SGGGG)5-P- wherein P is proline, G is glycine
and S is serine
(SEQ ID NO:22). In some embodiments, the linker has the sequence
GSADDAKKDAAKKDGKS (SEQ ID NO:23)
[0486] In some embodiments, the scTCR contains a covalent disulfide bond
linking a
residue of the immunoglobulin region of the constant domain of the a chain to
a residue of the
immunoglobulin region of the constant domain of the 0 chain. In some
embodiments, the
interchain disulfide bond in a native TCR is not present. For example, in some
embodiments,
one or more cysteines can be incorporated into the constant region
extracellular sequences of the
first and second segments of the scTCR polypeptide. In some cases, both a
native and a non-
native disulfide bond may be desirable.
[0487] In some embodiments of a dTCR or scTCR containing introduced interchain
disulfide bonds, the native disulfide bonds are not present. In some
embodiments, the one or
more of the native cysteines forming a native interchain disulfide bonds are
substituted to
128
CA 03049461 2019-07-04
WO 2018/132518 PCT/US2018/013227
another residue, such as to a serine or alanine. In some embodiments, an
introduced disulfide
bond can be formed by mutating non-cysteine residues on the first and second
segments to
cysteine. Exemplary non-native disulfide bonds of a TCR are described in
published
International PCT No. W02006/000830.
[0488] In some embodiments, the TCR or antigen-binding fragment thereof
exhibits an
affinity with an equilibrium binding constant for a target antigen of between
or between about
10-5 and 10-12 M and all individual values and ranges therein. In some
embodiments, the target
antigen is an MHC-peptide complex or ligand.
[0489] In some embodiments, nucleic acid or nucleic acids encoding a TCR, such
as a and 0
chains, can be amplified by PCR, cloning or other suitable means and cloned
into a suitable
expression vector or vectors. The expression vector can be any suitable
recombinant expression
vector, and can be used to transform or transfect any suitable host. Suitable
vectors include those
designed for propagation and expansion or for expression or both, such as
plasmids and viruses.
[0490] In some embodiments, the vector can be a vector of the pUC series
(Fermentas Life
Sciences), the pBluescript series (Stratagene, LaJolla, Calif.), the pET
series (Novagen,
Madison, Wis.), the pGEX series (Pharmacia Biotech, Uppsala, Sweden), or the
pEX series
(Clontech, Palo Alto, Calif.). In some cases, bacteriophage vectors, such as
X610, GT11,
kZapII (Stratagene), kEMBL4, and kNM1149, also can be used. In some
embodiments, plant
expression vectors can be used and include pBI01, pBI101.2, pBI101.3, pBI121
and pBIN19
(Clontech). In some embodiments, animal expression vectors include pEUK-C1,
pMAM and
pMAMneo (Clontech). In some embodiments, a viral vector is used, such as a
retroviral vector.
[0491] In some embodiments, the recombinant expression vectors can be prepared
using
standard recombinant DNA techniques. In some embodiments, vectors can contain
regulatory
sequences, such as transcription and translation initiation and termination
codons, which are
specific to the type of host (e.g., bacterium, fungus, plant, or animal) into
which the vector is to
be introduced, as appropriate and taking into consideration whether the vector
is DNA- or RNA-
based. In some embodiments, the vector can contain a nonnative promoter
operably linked to
the nucleotide sequence encoding the TCR or antigen-binding portion (or other
MHC-peptide
binding molecule). In some embodiments, the promoter can be a non-viral
promoter or a viral
promoter, such as a cytomegalovirus (CMV) promoter, an 5V40 promoter, an RSV
promoter,
and a promoter found in the long-terminal repeat of the murine stem cell
virus. Other known
promoters also are contemplated.
129
CA 03049461 2019-07-04
WO 2018/132518 PCT/US2018/013227
[0492] In some embodiments, after the T-cell clone is obtained, the TCR alpha
and beta
chains are isolated and cloned into a gene expression vector. In some
embodiments, the TCR
alpha and beta genes are linked via a picornavirus 2A ribosomal skip peptide
so that both chains
are coexpression. In some embodiments, genetic transfer of the TCR is
accomplished via
retroviral or lentiviral vectors, or via transposons (see, e.g., Baum et al.
(2006) Molecular
Therapy: The Journal of the American Society of Gene Therapy. 13:1050-1063;
Frecha et al.
(2010) Molecular Therapy: The Journal of the American Society of Gene Therapy.
18:1748-
1757; and Hackett et al. (2010) Molecular Therapy: The Journal of the American
Society of
Gene Therapy. 18:674-683.
[0493] In some embodiments, to generate a vector encoding a TCR, the a and 0
chains are
PCR amplified from total cDNA isolated from a T cell clone expressing the TCR
of interest and
cloned into an expression vector. In some embodiments, the a and 0 chains are
cloned into the
same vector. In some embodiments, the a and 0 chains are cloned into different
vectors. In
some embodiments, the generated a and 0 chains are incorporated into a
retroviral, e.g.
lentiviral, vector.
3. Chimeric Auto-Ant/hoary Receptor (CAAR)
[0494] In some embodiments, the recombinant receptor is a chimeric
autoantibody receptor
(CAAR). In some embodiments, the CAAR is specific for an autoantibody. In some
embodiments, a cell expressing the CAAR, such as a T cell engineered to
express a CAAR, can
be used to specifically bind to and kill autoantibody-expressing cells, but
not normal antibody
expressing cells. In some embodiments, CAAR-expressing cells can be used to
treat an
autoimmune disease associated with expression of self-antigens, such as
autoimmune diseases.
In some embodiments, CAAR-expressing cells can target B cells that ultimately
produce the
autoantibodies and display the autoantibodies on their cell surfaces, mark
these B cells as
disease-specific targets for therapeutic intervention. In some embodiments,
CAAR-expressing
cells can be used to efficiently targeting and killing the pathogenic B cells
in autoimmune
diseases by targeting the disease-causing B cells using an antigen-specific
chimeric autoantibody
receptor. In some embodiments, the recombinant receptor is a CAAR, such as any
described in
U.S. Patent Application Pub. No. US 2017/0051035.
[0495] In some embodiments, the CAAR comprises an autoantibody binding domain,
a
transmembrane domain, and an intracellular signaling region. In some
embodiments, the
intracellular signaling region comprises an intracellular signaling domain. In
some
130
CA 03049461 2019-07-04
WO 2018/132518 PCT/US2018/013227
embodiments, the intracellular signaling domain is or comprises a primary
signaling domain, a
signaling domain that is capable of inducing a primary activation signal in a
T cell, a signaling
domain of a T cell receptor (TCR) component, and/or a signaling domain
comprising an
immunoreceptor tyrosine-based activation motif (ITAM). In some embodiments,
the
intracellular signaling region comprises a secondary or costimulatory
signaling region
(secondary intracellular signaling regions).
[0496] In some embodiments, the autoantibody binding domain comprises an
autoantigen or
a fragment thereof. The choice of autoantigen can depend upon the type of
autoantibody being
targeted. For example, the autoantigen may be chosen because it recognizes an
autoantibody on
a target cell, such as a B cell, associated with a particular disease state,
e.g. an autoimmune
disease, such as an autoantibody-mediated autoimmune disease. In some
embodiments, the
autoimmune disease includes pemphigus vulgaris (PV). Exemplary autoantigens
include
desmoglein 1 (Dsg 1) and Dsg3.
4' ifufri-targeting-
[0497] In some embodiments, the cells and methods include multi-targeting
strategies, such
as expression of two or more genetically engineered receptors on the cell,
each recognizing the
same of a different antigen and typically each including a different
intracellular signaling
component. Such multi-targeting strategies are described, for example, in
International Patent
Application Publication No: WO 2014055668 Al (describing combinations of
activating and
costimulatory CARs, e.g., targeting two different antigens present
individually on off-target,
e.g., normal cells, but present together only on cells of the disease or
condition to be treated) and
Fedorov et al., Sci. Transl. Medicine, 5(215) (December, 2013) (describing
cells expressing an
activating and an inhibitory CAR, such as those in which the activating CAR
binds to one
antigen expressed on both normal or non-diseased cells and cells of the
disease or condition to
be treated, and the inhibitory CAR binds to another antigen expressed only on
the normal cells
or cells which it is not desired to treat).
[0498] For example, in some embodiments, the cells include a receptor
expressing a first
genetically engineered antigen receptor (e.g., CAR or TCR) which is capable of
inducing an
activating or stimulating signal to the cell, generally upon specific binding
to the antigen
recognized by the first receptor, e.g., the first antigen. In some
embodiments, the cell further
includes a second genetically engineered antigen receptor (e.g., CAR or TCR),
e.g., a chimeric
costimulatory receptor, which is capable of inducing a costimulatory signal to
the immune cell,
131
CA 03049461 2019-07-04
WO 2018/132518 PCT/US2018/013227
generally upon specific binding to a second antigen recognized by the second
receptor. In some
embodiments, the first antigen and second antigen are the same. In some
embodiments, the first
antigen and second antigen are different.
[0499] In some embodiments, the first and/or second genetically engineered
antigen receptor
(e.g. CAR or TCR) is capable of inducing an activating or stimulating signal
to the cell. In some
embodiments, the receptor includes an intracellular signaling component
containing ITAM or
ITAM-like motifs. In some embodiments, the activation induced by the first
receptor involves a
signal transduction or change in protein expression in the cell resulting in
initiation of an
immune response, such as ITAM phosphorylation and/or initiation of ITAM-
mediated signal
transduction cascade, formation of an immunological synapse and/or clustering
of molecules
near the bound receptor (e.g. CD4 or CD8, etc.), activation of one or more
transcription factors,
such as NF-KB and/or AP-1, and/or induction of gene expression of factors such
as cytokines,
proliferation, and/or survival.
[0500] In some embodiments, the first and/or second receptor includes
intracellular
signaling domains of costimulatory receptors such as CD28, CD137 (4-1BB),
0X40, and/or
ICOS. In some embodiments, the first and second receptor include an
intracellular signaling
domain of a costimulatory receptor that are different. In one embodiment, the
first receptor
contains a CD28 costimulatory signaling region and the second receptor contain
a 4-1BB co-
stimulatory signaling region or vice versa.
[0501] In some embodiments, the first and/or second receptor includes both an
intracellular
signaling domain containing ITAM or ITAM-like motifs and an intracellular
signaling domain
of a costimulatory receptor.
[0502] In some embodiments, the first receptor contains an intracellular
signaling domain
containing ITAM or ITAM-like motifs and the second receptor contains an
intracellular
signaling domain of a costimulatory receptor. The costimulatory signal in
combination with the
activating or stimulating signal induced in the same cell is one that results
in an immune
response, such as a robust and sustained immune response, such as increased
gene expression,
secretion of cytokines and other factors, and T cell mediated effector
functions such as cell
killing.
[0503] In some embodiments, neither ligation of the first receptor alone nor
ligation of the
second receptor alone induces a robust immune response. In some aspects, if
only one receptor
is ligated, the cell becomes tolerized or unresponsive to antigen, or
inhibited, and/or is not
induced to proliferate or secrete factors or carry out effector functions. In
some such
132
CA 03049461 2019-07-04
WO 2018/132518 PCT/US2018/013227
embodiments, however, when the plurality of receptors are ligated, such as
upon encounter of a
cell expressing the first and second antigens, a desired response is achieved,
such as full immune
activation or stimulation, e.g., as indicated by secretion of one or more
cytokine, proliferation,
persistence, and/or carrying out an immune effector function such as cytotoxic
killing of a target
cell.
[0504] In some embodiments, the two receptors induce, respectively, an
activating and an
inhibitory signal to the cell, such that binding by one of the receptor to its
antigen activates the
cell or induces a response, but binding by the second inhibitory receptor to
its antigen induces a
signal that suppresses or dampens that response. Examples are combinations of
activating CARs
and inhibitory CARs or iCARs. Such a strategy may be used, for example, in
which the
activating CAR binds an antigen expressed in a disease or condition but which
is also expressed
on normal cells, and the inhibitory receptor binds to a separate antigen which
is expressed on the
normal cells but not cells of the disease or condition.
[0505] In some embodiments, the multi-targeting strategy is employed in a case
where an
antigen associated with a particular disease or condition is expressed on a
non-diseased cell
and/or is expressed on the engineered cell itself, either transiently (e.g.,
upon stimulation in
association with genetic engineering) or permanently. In such cases, by
requiring ligation of
two separate and individually specific antigen receptors, specificity,
selectivity, and/or efficacy
may be improved.
[0506] In some embodiments, the plurality of antigens, e.g., the first and
second antigens,
are expressed on the cell, tissue, or disease or condition being targeted,
such as on the cancer
cell. In some aspects, the cell, tissue, disease or condition is multiple
myeloma or a multiple
myeloma cell. In some embodiments, one or more of the plurality of antigens
generally also is
expressed on a cell which it is not desired to target with the cell therapy,
such as a normal or
non-diseased cell or tissue, and/or the engineered cells themselves. In such
embodiments, by
requiring ligation of multiple receptors to achieve a response of the cell,
specificity and/or
efficacy is achieved.
D. Compositions and Formulations
[0507] In some embodiments, the engineered cells are provided by the methods
described
herein which include epigenetic and/or epigenomic analysis. In some
embodiments, the cells,
such as cells genetically engineered with a recombinant receptor (e.g. CAR-T
cells) are provided
as compositions, including pharmaceutical compositions and formulations, such
as unit dose
133
CA 03049461 2019-07-04
WO 2018/132518 PCT/US2018/013227
form compositions including the number of cells for administration in a given
dose or fraction
thereof. The pharmaceutical compositions and formulations generally include
one or more
optional pharmaceutically acceptable carrier or excipient. In some
embodiments, the
composition includes at least one additional therapeutic agent.
[0508] The term "pharmaceutical formulation" refers to a preparation which is
in such form
as to permit the biological activity of an active ingredient contained therein
to be effective, and
which contains no additional components which are unacceptably toxic to a
subject to which the
formulation would be administered.
[0509] A "pharmaceutically acceptable carrier" refers to an ingredient in a
pharmaceutical
formulation, other than an active ingredient, which is nontoxic to a subject.
A pharmaceutically
acceptable carrier includes, but is not limited to, a buffer, excipient,
stabilizer, or preservative.
[0510] In some aspects, the choice of carrier is determined in part by the
particular cell
and/or by the method of administration. Accordingly, there are a variety of
suitable
formulations. For example, the pharmaceutical composition can contain
preservatives. Suitable
preservatives may include, for example, methylparaben, propylparaben, sodium
benzoate, and
benzalkonium chloride. In some aspects, a mixture of two or more preservatives
is used. The
preservative or mixtures thereof are typically present in an amount of about
0.0001% to about
2% by weight of the total composition. Carriers are described, e.g., by
Remington's
Pharmaceutical Sciences 16th edition, Osol, A. Ed. (1980). Pharmaceutically
acceptable carriers
are generally nontoxic to recipients at the dosages and concentrations
employed, and include,
but are not limited to: buffers such as phosphate, citrate, and other organic
acids; antioxidants
including ascorbic acid and methionine; preservatives (such as
octadecyldimethylbenzyl
ammonium chloride; hexamethonium chloride; benzalkonium chloride; benzethonium
chloride;
phenol, butyl or benzyl alcohol; alkyl parabens such as methyl or propyl
paraben; catechol;
resorcinol; cyclohexanol; 3-pentanol; and m-cresol); low molecular weight
(less than about 10
residues) polypeptides; proteins, such as serum albumin, gelatin, or
immunoglobulins;
hydrophilic polymers such as polyvinylpyrrolidone; amino acids such as
glycine, glutamine,
asparagine, histidine, arginine, or lysine; monosaccharides, disaccharides,
and other
carbohydrates including glucose, mannose, or dextrins; chelating agents such
as EDTA; sugars
such as sucrose, mannitol, trehalose or sorbitol; salt-forming counter-ions
such as sodium; metal
complexes (e.g. Zn-protein complexes); and/or non-ionic surfactants such as
polyethylene glycol
(PEG).
134
CA 03049461 2019-07-04
WO 2018/132518 PCT/US2018/013227
[0511] Buffering agents in some aspects are included in the compositions.
Suitable
buffering agents include, for example, citric acid, sodium citrate, phosphoric
acid, potassium
phosphate, and various other acids and salts. In some aspects, a mixture of
two or more
buffering agents is used. The buffering agent or mixtures thereof are
typically present in an
amount of about 0.001% to about 4% by weight of the total composition. Methods
for preparing
administrable pharmaceutical compositions are known. Exemplary methods are
described in
more detail in, for example, Remington: The Science and Practice of Pharmacy,
Lippincott
Williams & Wilkins; 21st ed. (May 1, 2005).
[0512] The formulations can include aqueous solutions. The formulation or
composition
may also contain more than one active ingredient useful for the particular
indication, disease, or
condition being treated with the cells, preferably those with activities
complementary to the
cells, where the respective activities do not adversely affect one another.
Such active
ingredients are suitably present in combination in amounts that are effective
for the purpose
intended. Thus, in some embodiments, the pharmaceutical composition further
includes other
pharmaceutically active agents or drugs, such as chemotherapeutic agents,
e.g., asparaginase,
busulfan, carboplatin, cisplatin, daunorubicin, doxorubicin, fluorouracil,
gemcitabine,
hydroxyurea, methotrexate, paclitaxel, rituximab, vinblastine, and/or
vincristine.
[0513] The pharmaceutical composition in some embodiments contains the cells
in amounts
effective to treat or prevent the disease or condition, such as a
therapeutically effective or
prophylactically effective amount. Therapeutic or prophylactic efficacy in
some embodiments is
monitored by periodic assessment of treated subjects. The desired dosage can
be delivered by a
single bolus administration of the cells, by multiple bolus administrations of
the cells, or by
continuous infusion administration of the cells.
[0514] The cells and compositions may be administered using standard
administration
techniques, formulations, and/or devices. Administration of the cells can be
autologous or
heterologous. For example, immunoresponsive cells or progenitors can be
obtained from one
subject, and administered to the same subject or a different, compatible
subject. Peripheral blood
derived immunoresponsive cells or their progeny (e.g., in vivo, ex vivo or in
vitro derived) can
be administered via localized injection, including catheter administration,
systemic injection,
localized injection, intravenous injection, or parenteral administration. When
administering a
therapeutic composition (e.g., a pharmaceutical composition containing a
genetically modified
immunoresponsive cell), it will generally be formulated in a unit dosage
injectable form
(solution, suspension, emulsion).
135
CA 03049461 2019-07-04
WO 2018/132518 PCT/US2018/013227
[0515] Formulations include those for oral, intravenous, intraperitoneal,
subcutaneous,
pulmonary, transdermal, intramuscular, intranasal, buccal, sublingual, or
suppository
administration. In some embodiments, the cell populations are administered
parenterally. The
term "parenteral," as used herein, includes intravenous, intramuscular,
subcutaneous, rectal,
vaginal, and intraperitoneal administration. In some embodiments, the cells
are administered to
the subject using peripheral systemic delivery by intravenous,
intraperitoneal, or subcutaneous
injection.
[0516] Compositions in some embodiments are provided as sterile liquid
preparations, e.g.,
isotonic aqueous solutions, suspensions, emulsions, dispersions, or viscous
compositions, which
may in some aspects be buffered to a selected pH. Liquid preparations are
normally easier to
prepare than gels, other viscous compositions, and solid compositions.
Additionally, liquid
compositions are somewhat more convenient to administer, especially by
injection. Viscous
compositions, on the other hand, can be formulated within the appropriate
viscosity range to
provide longer contact periods with specific tissues. Liquid or viscous
compositions can
comprise carriers, which can be a solvent or dispersing medium containing, for
example, water,
saline, phosphate buffered saline, polyol (for example, glycerol, propylene
glycol, liquid
polyethylene glycol) and suitable mixtures thereof.
[0517] Sterile injectable solutions can be prepared by incorporating the cells
in a solvent,
such as in admixture with a suitable carrier, diluent, or excipient such as
sterile water,
physiological saline, glucose, dextrose, or the like. The compositions can
contain auxiliary
substances such as wetting, dispersing, or emulsifying agents (e.g.,
methylcellulose), pH
buffering agents, gelling or viscosity enhancing additives, preservatives,
flavoring agents, and/or
colors, depending upon the route of administration and the preparation
desired. Standard texts
may in some aspects be consulted to prepare suitable preparations.
[0518] Various additives which enhance the stability and sterility of the
compositions,
including antimicrobial preservatives, antioxidants, chelating agents, and
buffers, can be added.
Prevention of the action of microorganisms can be ensured by various
antibacterial and
antifungal agents, for example, parabens, chlorobutanol, phenol, and sorbic
acid. Prolonged
absorption of the injectable pharmaceutical form can be brought about by the
use of agents
delaying absorption, for example, aluminum monostearate and gelatin.
[0519] The formulations to be used for in vivo administration are generally
sterile. Sterility
may be readily accomplished, e.g., by filtration through sterile filtration
membranes.
136
CA 03049461 2019-07-04
WO 2018/132518 PCT/US2018/013227
V. METHODS OF ADMINISTRATION
[0520] In some embodiments, the provided methods generally involve
administering doses
of cells expressing recombinant molecules such as recombinant receptors, such
as CARs, other
chimeric receptors, or other antigen receptors, such as transgenic TCRs, to
subjects having a
disease or condition, such as a disease or condition a component of which is
specifically
recognized by and/or treated by the recombinant molecules, e.g., receptors. In
some
embodiments, the cells are analyzed using the methods provided for assessing
epigenetics and/or
epigenomics. In some aspects, the epigenetic and/or epigenomic analysis can be
performed on
the cells before and/or after genetic engineering. The administrations
generally effect an
improvement in one or more symptoms of the disease or condition and/or treat
or prevent the
disease or condition or symptom thereof.
[0521] The disease or condition that is treated can be any in which expression
of an antigen
is associated with and/or involved in the etiology of a disease condition or
disorder, e.g. causes,
exacerbates or otherwise is involved in such disease, condition, or disorder.
Exemplary
diseases and conditions can include diseases or conditions associated with
malignancy or
transformation of cells (e.g. cancer), autoimmune or inflammatory disease, or
an infectious
disease, e.g. caused by a bacterial, viral or other pathogen. Exemplary
antigens, which include
antigens associated with various diseases and conditions that can be treated,
are described
herein. In particular embodiments, the chimeric antigen receptor or transgenic
TCR specifically
binds to an antigen associated with the disease or condition.
[0522] Among the diseases, conditions, and disorders are tumors, including
solid tumors,
hematologic malignancies, and melanomas, and including localized and
metastatic tumors,
infectious diseases, such as infection with a virus or other pathogen, e.g.,
HIV, HCV, HBV,
CMV, HPV, and parasitic disease, and autoimmune and inflammatory diseases. In
some
embodiments, the disease, disorder or condition is a tumor, cancer,
malignancy, neoplasm, or
other proliferative disease or disorder. Such diseases include but are not
limited to leukemia,
lymphoma, e.g., chronic lymphocytic leukemia (CLL), ALL, non-Hodgkin's
lymphoma, acute
myeloid leukemia, multiple myeloma, refractory follicular lymphoma, mantle
cell lymphoma,
indolent B cell lymphoma, B cell malignancies, cancers of the colon, lung,
liver, breast, prostate,
ovarian, skin, melanoma, bone, and brain cancer, ovarian cancer, epithelial
cancers, renal cell
carcinoma, pancreatic adenocarcinoma, Hodgkin lymphoma, cervical carcinoma,
colorectal
137
CA 03049461 2019-07-04
WO 2018/132518 PCT/US2018/013227
cancer, glioblastoma, neuroblastoma, Ewing sarcoma, medulloblastoma,
osteosarcoma, synovial
sarcoma, and/or mesothelioma.
[0523] In some embodiments, the disease or condition is a tumor and the
subject has a large
tumor burden prior to the administration of the first dose, such as a large
solid tumor or a large
number or bulk of disease-associated, e.g., tumor, cells. In some aspects, the
subject has a high
number of metastases and/or widespread localization of metastases. In some
aspects, the tumor
burden in the subject is low and the subject has few metastases. In some
embodiments, the size
or timing of the doses is determined by the initial disease burden in the
subject. For example,
whereas in some aspects the subject may be administered a relatively low
number of cells in the
first dose, in context of lower disease burden the dose may be higher.
[0524] In some embodiments, the disease or condition is an infectious disease
or condition,
such as, but not limited to, viral, retroviral, bacterial, and protozoal
infections,
immunodeficiency, Cytomegalovirus (CMV), Epstein-Barr virus (EBV), adenovirus,
BK
polyomavirus. In some embodiments, the disease or condition is an autoimmune
or
inflammatory disease or condition, such as arthritis, e.g., rheumatoid
arthritis (RA), Type I
diabetes, systemic lupus erythematosus (SLE), inflammatory bowel disease,
psoriasis,
scleroderma, autoimmune thyroid disease, Grave's disease, Crohn's disease,
multiple sclerosis,
asthma, and/or a disease or condition associated with transplant.
[0525] In some embodiments, the antigen associated with the disease or
disorder is or
includes an antigen selected from the group consisting of av13.6 integrin
(avb6 integrin), B cell
maturation antigen (BCMA), B7-H3, B7-H6, carbonic anhydrase 9 (CA9, also known
as CAIX
or G250), a cancer-testis antigen, cancer/testis antigen 1B (CTAG, also known
as NY-ESO-1
and LAGE-2), carcinoembryonic antigen (CEA), a cyclin, cyclin A2, C-C Motif
Chemokine
Ligand 1 (CCL-1), CD19, CD20, CD22, CD23, CD24, CD30, CD33, CD38, CD44,
CD44v6,
CD44v7/8, CD123, CD138, CD171, epidermal growth factor protein (EGFR),
truncated
epidermal growth factor protein (tEGFR), type III epidermal growth factor
receptor mutation
(EGFR viii), epithelial glycoprotein 2 (EPG-2), epithelial glycoprotein 40
(EPG-40), ephrinB2,
ephrine receptor A2 (EPHa2), estrogen receptor, Fc receptor like 5 (FCRL5;
also known as Fc
receptor homolog 5 or FCRH5), fetal acetylcholine receptor (fetal AchR), a
folate binding
protein (FBP), folate receptor alpha, fetal acetylcholine receptor,
ganglioside GD2, 0-acetylated
GD2 (OGD2), ganglioside GD3, glycoprotein 100 (gp100), G Protein Coupled
Receptor 5D
(GPCR5D), Her2/neu (receptor tyrosine kinase erbB2), Her3 (erb-B3), Her4 (erb-
B4), erbB
dimers, Human high molecular weight-melanoma-associated antigen (HMW-MAA),
hepatitis B
138
CA 03049461 2019-07-04
WO 2018/132518 PCT/US2018/013227
surface antigen, Human leukocyte antigen Al (HLA-A1), Human leukocyte antigen
A2 (HLA-
A2), IL-22 receptor alpha(IL-22Ra), IL-13 receptor alpha 2 (IL-13Ra2), kinase
insert domain
receptor (kdr), kappa light chain, Ll cell adhesion molecule (L1CAM), CE7
epitope of Ll-
CAM, Leucine Rich Repeat Containing 8 Family Member A (LRRC8A), Lewis Y,
Melanoma-
associated antigen (MAGE)-A 1, MAGE-A3, MAGE-A6, mesothelin, c-Met, murine
cytomegalovirus (CMV), mucin 1 (MUC1), MUC16, natural killer group 2 member D
(NKG2D) ligands, melan A (MART-1), neural cell adhesion molecule (NCAM),
oncofetal
antigen, Preferentially expressed antigen of melanoma (PRAME), progesterone
receptor, a
prostate specific antigen, prostate stem cell antigen (PSCA), prostate
specific membrane antigen
(PSMA), Receptor Tyrosine Kinase Like Orphan Receptor 1 (ROR1), survivin,
Trophoblast
glycoprotein (TPBG also known as 5T4), tumor-associated glycoprotein 72
(TAG72), vascular
endothelial growth factor receptor (VEGFR), vascular endothelial growth factor
receptor 2
(VEGFR2), Wilms Tumor 1 (WT-1), a pathogen-specific or pathogen-expressed
antigen, or an
antigen associated with a universal tag, and/or biotinylated molecules, and/or
molecules
expressed by HIV, HCV, HBV or other pathogens.
[0526] As used herein, "treatment" (and grammatical variations thereof such as
"treat" or
"treating") refers to complete or partial amelioration or reduction of a
disease or condition or
disorder, or a symptom, adverse effect or outcome, or phenotype associated
therewith.
Desirable effects of treatment include, but are not limited to, preventing
occurrence or
recurrence of disease, alleviation of symptoms, diminishment of any direct or
indirect
pathological consequences of the disease, preventing metastasis, decreasing
the rate of disease
progression, amelioration or palliation of the disease state, and remission or
improved prognosis.
The terms do not imply necessarily complete curing of a disease or complete
elimination of any
symptom or effect(s) on all symptoms or outcomes.
[0527] As used herein, "delaying development of a disease" means to defer,
hinder, slow,
retard, stabilize, suppress and/or postpone development of the disease (such
as cancer). This
delay can be of varying lengths of time, depending on the history of the
disease and/or
individual being treated. As is evident to one skilled in the art, a
sufficient or significant delay
can, in effect, encompass prevention, in that the individual does not develop
the disease. For
example, a late stage cancer, such as development of metastasis, may be
delayed.
[0528] "Preventing," as used herein, includes providing prophylaxis with
respect to the
occurrence or recurrence of a disease in a subject that may be predisposed to
the disease but has
139
CA 03049461 2019-07-04
WO 2018/132518 PCT/US2018/013227
not yet been diagnosed with the disease. In some embodiments, the provided
cells and
compositions are used to delay development of a disease or to slow the
progression of a disease.
[0529] As used herein, to "suppress" a function or activity is to reduce the
function or
activity when compared to otherwise same conditions except for a condition or
parameter of
interest, or alternatively, as compared to another condition. For example,
cells that suppress
tumor growth reduce the rate of growth of the tumor compared to the rate of
growth of the tumor
in the absence of the cells.
[0530] An "effective amount" of an agent, e.g., a pharmaceutical formulation,
cells, or
composition, in the context of administration, refers to an amount effective,
at dosages/amounts
and for periods of time necessary, to achieve a desired result, such as a
therapeutic or
prophylactic result.
[0531] A "therapeutically effective amount" of an agent, e.g., a
pharmaceutical formulation
or cells, refers to an amount effective, at dosages and for periods of time
necessary, to achieve a
desired therapeutic result, such as for treatment of a disease, condition, or
disorder, and/or
pharmacokinetic or pharmacodynamic effect of the treatment. The
therapeutically effective
amount may vary according to factors such as the disease state, age, sex, and
weight of the
subject, and the populations of cells administered. In some embodiments, the
provided methods
involve administering the cells and/or compositions at effective amounts,
e.g., therapeutically
effective amounts.
[0532] A "prophylactically effective amount" refers to an amount effective, at
dosages and
for periods of time necessary, to achieve the desired prophylactic result.
Typically but not
necessarily, since a prophylactic dose is used in subjects prior to or at an
earlier stage of disease,
the prophylactically effective amount will be less than the therapeutically
effective amount. In
the context of lower tumor burden, the prophylactically effective amount in
some aspects will be
higher than the therapeutically effective amount.
[0533] Methods for administration of cells for adoptive cell therapy are known
and may be
used in connection with the provided methods and compositions. For example,
adoptive T cell
therapy methods are described, e.g., in US Patent Application Publication No.
2003/0170238 to
Gruenberg et al; US Patent No. 4,690,915 to Rosenberg; Rosenberg (2011) Nat
Rev Clin Oncol.
8(10):577-85). See, e.g., Themeli et al. (2013) Nat Biotechnol. 31(10): 928-
933; Tsukahara et
al. (2013) Biochem Biophys Res Commun 438(1): 84-9; Davila et al. (2013) PLoS
ONE 8(4):
e61338.
140
CA 03049461 2019-07-04
WO 2018/132518 PCT/US2018/013227
[0534] In some embodiments, the cell therapy, e.g., adoptive cell therapy,
e.g., adoptive T
cell therapy, is carried out by autologous transfer, in which the cells are
isolated and/or
otherwise prepared from the subject who is to receive the cell therapy, or
from a sample derived
from such a subject. Thus, in some aspects, the cells are derived from a
subject, e.g., patient, in
need of a treatment and the cells, following isolation and processing are
administered to the
same subject.
[0535] In some embodiments, the cell therapy, e.g., adoptive cell therapy,
e.g., adoptive T
cell therapy, is carried out by allogeneic transfer, in which the cells are
isolated and/or otherwise
prepared from a subject other than a subject who is to receive or who
ultimately receives the cell
therapy, e.g., a first subject. In such embodiments, the cells then are
administered to a different
subject, e.g., a second subject, of the same species. In some embodiments, the
first and second
subjects are genetically identical. In some embodiments, the first and second
subjects are
genetically similar. In some embodiments, the second subject expresses the
same HLA class or
supertype as the first subject.
[0536] The cells can be administered by any suitable means, for example, by
bolus infusion,
by injection, e.g., intravenous or subcutaneous injections, intraocular
injection, periocular
injection, subretinal injection, intravitreal injection, trans-septal
injection, subscleral injection,
intrachoroidal injection, intracameral injection, subconjectval injection,
subconjuntival injection,
sub-Tenon' s injection, retrobulbar injection, peribulbar injection, or
posterior juxtascleral
delivery. In some embodiments, they are administered by parenteral,
intrapulmonary, and
intranasal, and, if desired for local treatment, intralesional administration.
Parenteral infusions
include intramuscular, intravenous, intraarterial, intraperitoneal,
intrathoracic, intracranial, or
subcutaneous administration. In some embodiments, a given dose is administered
by a single
bolus administration of the cells. In some embodiments, it is administered by
multiple bolus
administrations of the cells, for example, over a period of no more than 3
days, or by continuous
infusion administration of the cells.
[0537] For the prevention or treatment of disease, the appropriate dosage may
depend on the
type of disease to be treated, the type of cells or recombinant receptors, the
severity and course
of the disease, whether the cells are administered for preventive or
therapeutic purposes,
previous therapy, the subject's clinical history and response to the cells,
and the discretion of the
attending physician. The compositions and cells are in some embodiments
suitably administered
to the subject at one time or over a series of treatments.
141
CA 03049461 2019-07-04
WO 2018/132518 PCT/US2018/013227
[0538] In some embodiments, the cells are administered as part of a
combination treatment,
such as simultaneously with or sequentially with, in any order, another
therapeutic intervention,
such as an antibody or engineered cell or receptor or other agent, such as a
cytotoxic or
therapeutic agent. Thus, the cells in some embodiments are co-administered
with one or more
additional therapeutic agents or in connection with another therapeutic
intervention, either
simultaneously or sequentially in any order. In some contexts, the cells are
co-administered with
another therapy sufficiently close in time such that the cell populations
enhance the effect of one
or more additional therapeutic agents, or vice versa. In some embodiments, the
cells are
administered prior to the one or more additional therapeutic agents. In some
embodiments, the
cells are administered after the one or more additional therapeutic agents. In
some
embodiments, the one or more additional agents includes a cytokine, such as IL-
2 or other
cytokine, for example, to enhance persistence. In some embodiments, the
methods comprise
administration of a chemotherapeutic agent, e.g., a conditioning
chemotherapeutic agent, for
example, to reduce tumor burden prior to the dose administrations.
[0539] Preconditioning subjects with immunodepleting (e.g., lymphodepleting)
therapies in
some aspects can improve the effects of adoptive cell therapy (ACT).
[0540] Thus, in some embodiments, the methods include administering a
preconditioning
agent, such as a lymphodepleting or chemotherapeutic agent, such as
cyclophosphamide,
fludarabine, or combinations thereof, to a subject prior to the initiation of
the cell therapy. For
example, the subject may be administered a preconditioning agent at least 2
days prior, such as
at least 3, 4, 5, 6, or 7 days prior, to the initiation of the cell therapy.
In some embodiments, the
subject is administered a preconditioning agent no more than 7 days prior,
such as no more than
6, 5, 4, 3, or 2 days prior, to the initiation of the cell therapy.
[0541] In some embodiments, the subject is preconditioned with
cyclophosphamide at a
dose between or between about 20 mg/kg and 100 mg/kg, such as between or
between about 40
mg/kg and 80 mg/kg. In some aspects, the subject is preconditioned with or
with about 60 mg/kg
of cyclophosphamide. In some embodiments, the cyclophosphamide can be
administered in a
single dose or can be administered in a plurality of doses, such as given
daily, every other day or
every three days. In some embodiments, the cyclophosphamide is administered
once daily for
one or two days. In some embodiments, where the lymphodepleting agent
comprises
cyclophosphamide, the subject is administered cyclophosphamide at a dose
between or between
about 100 mg/m2 and 500 mg/m2, such as between or between about 200 mg/m2 and
400 mg/m2,
or 250 mg/m2 and 350 mg/m2 ,inclusive. In some instances, the subject is
administered about
142
CA 03049461 2019-07-04
WO 2018/132518 PCT/US2018/013227
300 mg/m2 of cyclophosphamide. In some embodiments, the cyclophosphamide can
be
administered in a single dose or can be administered in a plurality of doses,
such as given daily,
every other day or every three days. In some embodiments, cyclophosphamide is
administered
daily, such as for 1-5 days, for example, for 3 to 5 days. In some instances,
the subject is
administered about 300 mg/m2 of cyclophosphamide, daily for 3 days, prior to
initiation of the
cell therapy.
[0542] In some embodiments, where the lymphodepleting agent comprises
fludarabine, the
subject is administered fludarabine at a dose between or between about 1 mg/m2
and 100 mg/m2,
such as between or between about 10 mg/m2 and 75 mg/m2, 15 mg/m2 and 50 mg/m2,
20 mg/m2
and 40 mg/m2, or 24 mg/m2 and 35 mg/m2, inclusive. In some instances, the
subject is
administered about 30 mg/m2 of fludarabine. In some embodiments, the
fludarabine can be
administered in a single dose or can be administered in a plurality of doses,
such as given daily,
every other day or every three days. In some embodiments, fludarabine is
administered daily,
such as for 1-5 days, for example, for 3 to 5 days. In some instances, the
subject is administered
about 30 mg/m2 of fludarabine, daily for 3 days, prior to initiation of the
cell therapy.
[0543] In some embodiments, the lymphodepleting agent comprises a combination
of
agents, such as a combination of cyclophosphamide and fludarabine. Thus, the
combination of
agents may include cyclophosphamide at any dose or administration schedule,
such as those
described herein, and fludarabine at any dose or administration schedule, such
as those described
herein. For example, in some aspects, the subject is administered 60 mg/kg (-2
g/m2) of
cyclophosphamide and 3 to 5 doses of 25 mg/m2 fludarabine prior to the first
or subsequent
dose.
[0544] Once the cells are administered to the subject (e.g., human), the
biological activity of
the engineered cell populations in some aspects is measured by any of a number
of known
methods. Parameters to assess include specific binding of an engineered or
natural T cell or
other immune cell to antigen, in vivo, e.g., by imaging, or ex vivo, e.g., by
ELISA or flow
cytometry. In certain embodiments, the ability of the engineered cells to
destroy target cells can
be measured using any suitable method known in the art, such as cytotoxicity
assays described
in, for example, Kochenderfer et al., J. Immunotherapy, 32(7): 689-702 (2009),
and Herman et
al. J. Immunological Methods, 285(1): 25-40 (2004). In certain embodiments,
the biological
activity of the cells also can be measured by assaying expression and/or
secretion of certain
cytokines, such as CD 107a, IFNy, IL-2, and TNF. In some aspects the
biological activity is
measured by assessing clinical outcome, such as reduction in tumor burden or
load. In some
143
CA 03049461 2019-07-04
WO 2018/132518 PCT/US2018/013227
aspects, toxic outcomes, persistence and/or expansion of the cells, and/or
presence or absence of
a host immune response, are assessed.
[0545] In certain embodiments, engineered cells are modified in any number of
ways, such
that their therapeutic or prophylactic efficacy is increased. For example, the
engineered CAR or
TCR expressed by the population can be conjugated either directly or
indirectly through a linker
to a targeting moiety. The practice of conjugating compounds, e.g., the CAR or
TCR, to
targeting moieties is known in the art. See, for instance, Wadwa et al., J.
Drug Targeting 3: 1 1 1
(1995), and U.S. Patent 5,087,616.
[0546] In some embodiments, the cells are administered as part of a
combination treatment,
such as simultaneously with or sequentially with, in any order, another
therapeutic intervention,
such as an antibody or engineered cell or receptor or agent, such as a
cytotoxic or therapeutic
agent. The cells in some embodiments are co-administered with one or more
additional
therapeutic agents or in connection with another therapeutic intervention,
either simultaneously
or sequentially in any order. In some contexts, the cells are co-administered
with another therapy
sufficiently close in time such that the cell populations enhance the effect
of one or more
additional therapeutic agents, or vice versa. In some embodiments, the cells
are administered
prior to the one or more additional therapeutic agents. In some embodiments,
the cells are
administered after the one or more additional therapeutic agents. In some
embodiments, the one
or more additional agent includes a cytokine, such as IL-2, for example, to
enhance persistence.
A. Dosing
[0547] In some embodiments, a dose of cells is administered to subjects in
accord with the
provided methods, and/or with the provided articles of manufacture or
compositions. In some
embodiments, the size or timing of the doses is determined as a function of
the particular disease
or condition in the subject. In some cases, the size or timing of the doses
for a particular disease
in view of the provided description may be empirically determined.
[0548] In some embodiments, the dose of cells comprises between at or about 2
x 105 of the
cells/kg and at or about 2 x 10⁶ of the cells/kg, such as between at or about
4 x 10⁵ of the
cells/kg and at or about 1 x 10⁶ of the cells/kg or between at or about 6 x
105 of the cells/kg and
at or about 8 x 10⁵ of the cells/kg. In some embodiments, the dose of cells
comprises no more
than 2 x 10⁵ of the cells (e.g. antigen-expressing, such as CAR-expressing
cells) per kilogram
body weight of the subject (cells/kg), such as no more than at or about 3 x
105 cells/kg, no more
than at or about 4 x 10⁵ cells/kg, no more than at or about 5 x 10⁵ cells/kg,
no more than at or
144
CA 03049461 2019-07-04
WO 2018/132518 PCT/US2018/013227
about 6 x 10⁵ cells/kg, no more than at or about 7 x 10⁵ cells/kg, no more
than at or about 8 x 10⁵
cells/kg, no more than at or about 9 x 10⁵ cells/kg, no more than at or about
1 x 10⁶ cells/kg, or
no more than at or about 2 x 10⁶ cells/kg. In some embodiments, the dose of
cells comprises at
least or at least about or at or about 2 x 10⁵ of the cells (e.g. antigen-
expressing, such as CAR-
expressing cells) per kilogram body weight of the subject (cells/kg), such as
at least or at least
about or at or about 3 x 10⁵ cells/kg, at least or at least about or at or
about 4 x 10⁵ cells/kg, at
least or at least about or at or about 5 x 10⁵ cells/kg, at least or at least
about or at or about 6 x
105 cells/kg, at least or at least about or at or about 7 x 10⁵ cells/kg, at
least or at least about or at
or about 8 x 10⁵ cells/kg, at least or at least about or at or about 9 x 10⁵
cells/kg, at least or at
least about or at or about 1 x 10⁶ cells/kg, or at least or at least about or
at or about 2 x 10⁶
cells/kg.
[0549] In the context of adoptive cell therapy, administration of a given
"dose" encompasses
administration of the given amount or number of cells as a single composition
and/or single
uninterrupted administration, e.g., as a single injection or continuous
infusion, and also
encompasses administration of the given amount or number of cells as a split
dose, provided in
multiple individual compositions or infusions, over a specified period of
time, which is no more
than 3 days. Thus, in some contexts, the dose is a single or continuous
administration of the
specified number of cells, given or initiated at a single point in time. In
some contexts, however,
the dose is administered in multiple injections or infusions over a period of
no more than three
days, such as once a day for three days or for two days or by multiple
infusions over a single day
period.
[0550] Thus, in some aspects, the cells are administered in a single
pharmaceutical
composition.
[0551] In some embodiments, the cells are administered in a plurality of
compositions,
collectively containing the cells of a single dose.
[0552] Thus, one or more of the doses in some aspects may be administered as a
split dose.
For example, in some embodiments, the dose may be administered to the subject
over 2 days or
over 3 days. Exemplary methods for split dosing include administering 25% of
the dose on the
first day and administering the remaining 75% of the dose on the second day.
In other
embodiments 33% of the dose may be administered on the first day and the
remaining 67%
administered on the second day. In some aspects, 10% of the dose is
administered on the first
day, 30% of the dose is administered on the second day, and 60% of the dose is
administered on
the third day. In some embodiments, the split dose is not spread over more
than 3 days.
145
CA 03049461 2019-07-04
WO 2018/132518 PCT/US2018/013227
[0553] In some embodiments, multiple doses are given, in some aspects using
the same
timing guidelines as those with respect to the timing between the first and
second doses, e.g., by
administering a first and multiple subsequent doses, with each subsequent dose
given at a point
in time that is greater than about 28 days after the administration of the
first or prior dose.
[0010] In certain embodiments, the cells, or individual populations of
sub-types of cells,
are administered to the subject at a range of about one million to about 100
billion cells and/or
that amount of cells per kilogram of body weight, such as, e.g., 1 million to
about 50 billion cells
(e.g., about 5 million cells, about 25 million cells, about 500 million cells,
about 1 billion cells,
about 5 billion cells, about 20 billion cells, about 30 billion cells, about
40 billion cells, or a
range defined by any two of the foregoing values), such as about 10 million to
about 100 billion
cells (e.g., about 20 million cells, about 30 million cells, about 40 million
cells, about 60 million
cells, about 70 million cells, about 80 million cells, about 90 million cells,
about 10 billion cells,
about 25 billion cells, about 50 billion cells, about 75 billion cells, about
90 billion cells, or a
range defined by any two of the foregoing values), and in some cases about 100
million cells to
about 50 billion cells (e.g., about 120 million cells, about 250 million
cells, about 350 million
cells, about 450 million cells, about 650 million cells, about 800 million
cells, about 900 million
cells, about 3 billion cells, about 30 billion cells, about 45 billion cells)
or any value in between
these ranges and/or per kilogram of body weight. Dosages may vary depending on
attributes
particular to the disease or disorder and/or patient and/or other treatments.
[0554] In some embodiments, the dose of genetically engineered cells comprises
from or
from about 1 x 10⁵ to 5 x 10⁸ total CAR-expressing T cells, 1 x 10⁵ to 2.5 x
108 total CAR-
expressing T cells, 1 x 10⁵ to 1 x 10⁸ total CAR-expressing T cells, 1 x 10⁵
to 5 x 10⁷ total CAR-
expressing T cells, 1 x 10⁵ to 2.5 x 10⁷ total CAR-expressing T cells, 1 x 10⁵
to 1 x 10⁷ total
CAR-expressing T cells, 1 x 10⁵ to 5 x 10⁶ total CAR-expressing T cells, 1 x
105 to 2.5 x 10⁶
total CAR-expressing T cells, 1 x 10⁵ to 1 x 10⁶ total CAR-expressing T cells,
1 x 10⁶ to 5 x 10⁸
total CAR-expressing T cells, 1 x 10⁶ to 2.5 x 10⁸ total CAR-expressing T
cells, 1 x 10⁶ to 1 x
108 total CAR-expressing T cells, 1 x 10⁶ to 5 x 10⁷ total CAR-expressing T
cells, 1 x 10⁶ to 2.5
x 107 total CAR-expressing T cells, 1 x 10⁶ to 1 x 10⁷ total CAR-expressing T
cells, 1 x 10⁶ to 5
x 106 total CAR-expressing T cells, 1 x 10⁶ to 2.5 x 10⁶ total CAR-expressing
T cells, 2.5 x
106 to 5 x 10⁸ total CAR-expressing T cells, 2.5 x 10⁶ to 2.5 x 10⁸ total CAR-
expressing T
cells, 2.5 x 10⁶ to 1 x 10⁸ total CAR-expressing T cells, 2.5 x 10⁶ to 5 x 10⁷
total CAR-
expressing T cells, 2.5 x 10⁶ to 2.5 x 10⁷ total CAR-expressing T cells, 2.5 x
106 to 1 x 10⁷ total
CAR-expressing T cells, 2.5 x 10⁶ to 5 x 10⁶ total CAR-expressing T cells, 5 x
106 to 5 x 10⁸
146
CA 03049461 2019-07-04
WO 2018/132518 PCT/US2018/013227
total CAR-expressing T cells, 5 x 10⁶ to 2.5 x 10⁸ total CAR-expressing T
cells, 5 x 10⁶ to 1 x
108 total CAR-expressing T cells, 5 x 10⁶ to 5 x 10⁷ total CAR-expressing T
cells, 5 x 10⁶ to
2.5 x 10⁷ total CAR-expressing T cells, 5 x 10⁶ to 1 x 10⁷ total CAR-
expressing T cells, 1 x
107 to 5 x 10⁸ total CAR-expressing T cells, 1 x 10⁷ to 2.5 x 10⁸ total CAR-
expressing T cells,
1 x 10⁷ to 1 x 10⁸ total CAR-expressing T cells, 1 x 10⁷ to 5 x 10⁷ total CAR-
expressing T
cells, 1 x 10⁷ to 2.5 x 10⁷ total CAR-expressing T cells, 2.5 x 10⁷ to 5 x 10⁸
total CAR-
expressing T cells, 2.5 x 10⁷ to 2.5 x 10⁸ total CAR-expressing T cells, 2.5 x
107 to 1 x 10⁸ total
CAR-expressing T cells, 2.5 x 10⁷ to 5 x 10⁷ total CAR-expressing T cells, 5 x
107 to 5 x 10⁸
total CAR-expressing T cells, 5 x 10⁷ to 2.5 x 10⁸ total CAR-expressing T
cells, 5 x 10⁷ to 1 x
108 total CAR-expressing T cells, 1 x 10⁸ to 5 x 10⁸ total CAR-expressing T
cells, 1 x 10⁸ to
2.5 x 10⁸ total CAR-expressing T cells, or 2.5 x 10⁸ to 5 x 10⁸ total CAR-
expressing T cells.
[0555] In some embodiments, the dose of genetically engineered cells comprises
at least or
at least about 1 x 10⁵ CAR-expressing cells, at least or at least about 2.5 x
105 CAR-expressing
cells, at least or at least about 5 x 10⁵ CAR-expressing cells, at least or at
least about 1 x 10⁶
CAR-expressing cells, at least or at least about 2.5 x 10⁶ CAR-expressing
cells, at least or at
least about 5 x 10⁶ CAR-expressing cells, at least or at least about 1 x 10⁷
CAR-expressing cells,
at least or at least about 2.5 x 10⁷ CAR-expressing cells, at least or at
least about 5 x 10⁷ CAR-
expressing cells, at least or at least about 1 x 10⁸ CAR-expressing cells, at
least or at least about
2.5 x 10⁸ CAR-expressing cells, or at least or at least about 5 x 10⁸ CAR-
expressing cells.
[0556] In some embodiments, the cell therapy comprises administration of a
dose
comprising a number of cell from or from about 1 x 10⁵ to 5 x 10⁸ total
recombinant receptor-
expressing cells, total T cells, or total peripheral blood mononuclear cells
(PBMCs), from or
from about 5 x 10⁵ to 1 x 10⁷ total recombinant receptor-expressing cells,
total T cells, or total
peripheral blood mononuclear cells (PBMCs) or from or from about 1 x 10⁶ to 1
x 107 total
recombinant receptor-expressing cells, total T cells, or total peripheral
blood mononuclear cells
(PBMCs), each inclusive. In some embodiments, the cell therapy comprises
administration of a
dose of cells comprising a number of cells at least or at least about 1 x 10⁵
total recombinant
receptor-expressing cells, total T cells, or total peripheral blood
mononuclear cells (PBMCs),
such at least or at least 1 x 10⁶, at least or at least about 1 x 10⁷, at
least or at least about 1 x 10⁸
of such cells. In some embodiments, the number is with reference to the total
number of CD3+
or CD8+, in some cases also recombinant receptor-expressing (e.g. CAR+) cells.
In some
embodiments, the cell therapy comprises administration of a dose comprising a
number of cell
from or from about 1 x 10⁵ to 5 x 10⁸ CD3+ or CD8+ total T cells or CD3+ or
CD8+
147
CA 03049461 2019-07-04
WO 2018/132518 PCT/US2018/013227
recombinant receptor-expressing cells, from or from about 5 x 10⁵ to 1 x 10⁷
CD3+ or CD8+
total T cells or CD3+ or CD8+ recombinant receptor-expressing cells, or from
or from about 1 x
106 to 1 x 10⁷ CD3+ or CD8+ total T cells or CD3+ or CD8+recombinant receptor-
expressing
cells, each inclusive. In some embodiments, the cell therapy comprises
administration of a dose
comprising a number of cell from or from about 1 x 10⁵ to 5 x 10⁸ total
CD3+/CAR+ or
CD8+/CAR+ cells, from or from about 5 x 10⁵ to 1 x 10⁷ total CD3+/CAR+ or
CD8+/CAR+
cells, or from or from about 1 x 10⁶ to 1 x 10⁷ total CD3+/CAR+ or CD8+/CAR+
cells, each
inclusive.
[0557] In some embodiments, the T cells of the dose include CD4+ T cells, CD8+
T cells or
CD4+ and CD8+ T cells.
[0558] In some embodiments, for example, where the subject is human, the CD8+
T cells of
the dose, including in a dose including CD4+ and CD8+ T cells, includes
between about 1 x 10⁶
and 5 x 10⁸ total recombinant receptor (e.g., CAR)-expressing CD8+cells, e.g.,
in the range of
about 5 x 10⁶ to 1 x 10⁸ such cells, such cells 1 x 10⁷, 2.5 x 10⁷, 5 x 10⁷,
7.5 x 10⁷, 1 x 10⁸, or 5 x
108 total such cells, or the range between any two of the foregoing values. In
some
embodiments, the patient is administered multiple doses, and each of the doses
or the total dose
can be within any of the foregoing values. In some embodiments, the dose of
cells comprises the
administration of from or from about 1 x 10⁷ to 0.75 x 10⁸ total recombinant
receptor-expressing
CD8+ T cells, 1 x 10⁷ to 2.5 x 10⁷ total recombinant receptor-expressing CD8+
T cells, from or
from about 1 x 10⁷ to 0.75 x 10⁸ total recombinant receptor-expressing CD8+ T
cells, each
inclusive. In some embodiments, the dose of cells comprises the administration
of or about 1 x
107, 2.5 x 10⁷, 5 x 10⁷ 7.5 x 10⁷, 1 x 10⁸, or 5 x 10⁸ total recombinant
receptor-expressing CD8+
T cells.
[0559] In some embodiments, the dose of cells, e.g., recombinant receptor-
expressing T
cells, is administered to the subject as a single dose or is administered only
one time within a
period of two weeks, one month, three months, six months, 1 year or more.
[0560] In some embodiments, the dose contains a number of cells, number of
recombinant
receptor (e.g., CAR)-expressing cells, number of T cells, or number of
peripheral blood
mononuclear cells (PBMCs) in the range from about 105 to about 106 of such
cells per kilogram
body weight of the subject, and/or a number of such cells that is no more than
about 105 or about
106 such cells per kilogram body weight of the subject. For example, in some
embodiments, the
first or subsequent dose includes less than or no more than at or about 1 x
105, at or about 2 x
105, at or about 5 x 10⁵, or at or about 1 x 10⁶ of such cells per kilogram
body weight of the
148
CA 03049461 2019-07-04
WO 2018/132518 PCT/US2018/013227
subject. In some embodiments, the first dose includes at or about 1 x 10⁵, at
or about 2 x 10⁵, at
or about 5 x 10⁵, or at or about 1 x 10⁶ of such cells per kilogram body
weight of the subject, or
a value within the range between any two of the foregoing values. In
particular embodiments,
the numbers and/or concentrations of cells refer to the number of recombinant
receptor (e.g.,
CAR)-expressing cells. In other embodiments, the numbers and/or concentrations
of cells refer
to the number or concentration of all cells, T cells, or peripheral blood
mononuclear cells
(PBMCs) administered.
[0561] In some embodiments, for example, where the subject is a human, the
dose includes
fewer than about 1 x 10⁸ total recombinant receptor (e.g., CAR)-expressing
cells, T cells, or
peripheral blood mononuclear cells (PBMCs), e.g., in the range of about 1 x
106 to 1 x 10⁸ such
cells, such as 2 x 10⁶, 5 x 10⁶, 1 x 10⁷, 5 x 10⁷, or 1 x 10⁸ or total such
cells, or the range
between any two of the foregoing values.
[0562] In some embodiments, the dose contains fewer than about 1 x 10⁸ total
recombinant
receptor (e.g., CAR)-expressing cells, T cells, or peripheral blood
mononuclear cells (PBMCs)
cells per m2 of the subject, e.g., in the range of about 1 x 10⁶ to 1 x 10⁸
such cells per m2 of the
subject, such as 2 x 10⁶, 5 x 10⁶, 1 x 10⁷, 5 x 10⁷, or 1 x 10⁸ such cells per
m2 of the subject, or
the range between any two of the foregoing values.
[0563] In certain embodiments, the number of cells, recombinant receptor
(e.g., CAR)-
expressing cells, T cells, or peripheral blood mononuclear cells (PBMCs) in
the dose is greater
than about 1 x 10⁶ such cells per kilogram body weight of the subject, e.g., 2
x 106, 3 x 10⁶, 5 x
106, 1 x 10⁷, 5 x 10⁷, 1 x 10⁸, 1 x 10⁹, or 1 x 10¹⁰ such cells per kilogram
of body weight and/or,
1 x 10⁸, or 1 x 10⁹, 1 x 10¹⁰ such cells per m2 of the subject or total, or
the range between any
two of the foregoing values.
[0564] In some aspects, the size of the dose is determined based on one or
more criteria such
as response of the subject to prior treatment, e.g. chemotherapy, disease
burden in the subject,
such as tumor load, bulk, size, or degree, extent, or type of metastasis,
stage, and/or likelihood or
incidence of the subject developing toxic outcomes, e.g., CRS, macrophage
activation
syndrome, tumor lysis syndrome, neurotoxicity, and/or a host immune response
against the cells
and/or recombinant receptors being administered.
[0565] In some aspects, the size of the dose is determined by the burden of
the disease or
condition in the subject. For example, in some aspects, the number of cells
administered in the
dose is determined based on the tumor burden that is present in the subject
immediately prior to
administration of the initiation of the dose of cells. In some embodiments,
the size of the first
149
CA 03049461 2019-07-04
WO 2018/132518 PCT/US2018/013227
and/or subsequent dose is inversely correlated with disease burden. In some
aspects, as in the
context of a large disease burden, the subject is administered a low number of
cells, for example
less than about 1 x 10⁶ cells per kilogram of body weight of the subject. In
other embodiments,
as in the context of a lower disease burden, the subject is administered a
larger number of cells,
such as more than about 1 x 10⁶ cells per kilogram body weight of the subject.
[0566] In some aspects, results of the assessment of epigenetic properties,
e.g., profiles from
ATAC-seq analysis, can be used to determine a treatment regimen, e.g.,
including doses, timing
and/or frequency of administration of the engineered cells. In some aspects,
the characteristics
and/or properties of the cell composition, such as an engineered cell
composition or a pre-
engineering cell composition obtained from a subject, as determined using
methods described
herein, can be used to select subjects for treatment and/or determine the
appropriate dose for
treatment. In some embodiments, the methods described herein can be used to
assess clinical
doses of cells in the administered composition.
VI. KITS AND ARTICLE OF MANUFACTURE
[0567] Also provided are kits and articles of manufacture, such as those
containing reagents
for performing the methods provided herein, e.g., reagents for assessing the
epigenetic
properties at one or more genomic regions, e.g., genomic loci in cells, e.g.,
cells for engineering.
In some embodiments, the kits also include reagents for assessing other
parameter or performing
additional epigenetic and/or epigenomic analysis for one or more genomic
regions, e.g.,
genomic loci.
[0568] In some embodiments, provided are kits that comprise a nucleic acid, an
insertional
enzyme and an insertion element, wherein: the insertion element can comprise a
nucleic acid
comprising a predetermined sequence and the insertional enzyme can further
comprise an
affinity tag. In some embodiments, the kits further comprise association
molecules, e.g., proteins
(e.g. histones) or nucleic acids (e.g. aptamers) that associate with the
nucleic acids. In some
embodiments, the affinity tag can be an antibody. In some embodiments, the
antibody can bind a
transcription factor, modified nucleosome and/or modified nucleic acids.
Examples of modified
nucleic acids include, but are not limited to, methylated or hydroxymethylated
DNA. The
affinity tag can also be a single-stranded nucleic acid (e.g. ssDNA, ssRNA).
In some
embodiments, the single-stranded nucleic acid can be bound to a target nucleic
acid. In some
instances, the insertional enzyme can further comprise a nuclear localization
signal.
150
CA 03049461 2019-07-04
WO 2018/132518 PCT/US2018/013227
[0569] In some embodiments, the kits further comprise: (a) reagents for
isolating nuclei
from a population of cells; (b) transposase and transposon tags, and (c)
transposase reaction
buffer, wherein the components of the kit are configured such that, combining
the reaction
buffer, transposase and adaptors with nuclei in vitro results in both lysis of
the nuclei to release
chromatin and production of adaptor-tagged fragments of genomic DNA.
[0570] In some embodiments, the kit can comprise: (a) a cell lysis buffer; (b)
an insertional
enzyme comprising an affinity tag; and (c) an insertion element comprising a
nucleic acid,
wherein said nucleic acid comprises a predetermined sequence. The insertional
enzyme can be,
for example, a transposase. The insertional enzyme can also comprise two or
more enzymatic
moieties that are linked together.
[0571] In some embodiments, the kit optionally contains other components, for
example:
PCR primers, PCR reagents such as polymerase, buffer, nucleotides, reagents
for additional
assays, e.g., intracellular cytokine staining, flow cytometry, chromatin
immunoprecipitation
and/or additional epigenetic and/or epigenomic analysis. In some embodiments,
the reagents for
additional assays include components for performing an in vitro assay to
measure the expression
or level of particular molecules. In some cases, the in vitro assay is an
immunoassay, an
aptamer-based assay, a histological or cytological assay, or an mRNA
expression level assay. In
some embodiments, the in vitro assay is selected from among an enzyme linked
immunosorbent
assay (ELISA), immunoblotting, immunoprecipitation, radioimmunoassay (RIA),
immunostaining, flow cytometry assay, surface plasmon resonance (SPR),
chemiluminescence
assay, lateral flow immunoassay, inhibition assay and avidity assay. In some
aspects, the
reagent is a binding reagent that specifically binds the molecules. In some
cases, the binding
reagent is an antibody or antigen-binding fragment thereof, an aptamer or a
nucleic acid probe.
The various components of the kit may be present in separate containers or
certain compatible
components may be precombined into a single container. In some embodiments,
the kits further
contain instructions for using the components of the kit to practice the
provided methods.
VII. DEFINITIONS
[0572] Unless defined otherwise, all terms of art, notations and other
technical and scientific
terms or terminology used herein are intended to have the same meaning as is
commonly
understood by one of ordinary skill in the art to which the claimed subject
matter pertains. In
some cases, terms with commonly understood meanings are defined herein for
clarity and/or for
151
CA 03049461 2019-07-04
WO 2018/132518 PCT/US2018/013227
ready reference, and the inclusion of such definitions herein should not
necessarily be construed
to represent a substantial difference over what is generally understood in the
art.
[0573] All publications, including patent documents, scientific articles and
databases,
referred to in this application are incorporated by reference in their
entirety for all purposes to
the same extent as if each individual publication were individually
incorporated by reference. If
a definition set forth herein is contrary to or otherwise inconsistent with a
definition set forth in
the patents, applications, published applications and other publications that
are herein
incorporated by reference, the definition set forth herein prevails over the
definition that is
incorporated herein by reference.
[0574] The section headings used herein are for organizational purposes only
and are not to
be construed as limiting the subject matter described.
[0575] As used herein, the singular forms "a," "an," and "the" include plural
referents unless
the context clearly dictates otherwise. For example, "a" or "an" means "at
least one" or "one or
more." It is understood that aspects and variations described herein include
"consisting" and/or
"consisting essentially of' aspects and variations.
[0576] The term "about" as used herein refers to the usual error range for the
respective
value readily known to the skilled person in this technical field. Reference
to "about" a value or
parameter herein includes (and describes) embodiments that are directed to
that value or
parameter per se. For example, description referring to "about X" includes
description of "X".
[0577] Throughout this disclosure, various aspects of the claimed subject
matter are
presented in a range format. It should be understood that the description in
range format is
merely for convenience and brevity and should not be construed as an
inflexible limitation on
the scope of the claimed subject matter. Accordingly, the description of a
range should be
considered to have specifically disclosed all the possible sub-ranges as well
as individual
numerical values within that range. For example, where a range of values is
provided, it is
understood that each intervening value, between the upper and lower limit of
that range and any
other stated or intervening value in that stated range is encompassed within
the claimed subject
matter. The upper and lower limits of these smaller ranges may independently
be included in
the smaller ranges, and are also encompassed within the claimed subject
matter, subject to any
specifically excluded limit in the stated range. Where the stated range
includes one or both of
the limits, ranges excluding either or both of those included limits are also
included in the
claimed subject matter. This applies regardless of the breadth of the range.
152
CA 03049461 2019-07-04
WO 2018/132518 PCT/US2018/013227
[0578] As used herein, a composition refers to any mixture of two or more
products,
substances, or compounds, including cells. It may be a solution, a suspension,
liquid, powder, a
paste, aqueous, non-aqueous or any combination thereof.
[0579] As used herein, a statement that a cell or population of cells is
"positive" for a
particular marker refers to the detectable presence on or in the cell of a
particular marker,
typically a surface marker. When referring to a surface marker, the term
refers to the presence
of surface expression as detected by flow cytometry, for example, by staining
with an antibody
that specifically binds to the marker and detecting said antibody, wherein the
staining is
detectable by flow cytometry at a level substantially above the staining
detected carrying out the
same procedure with an isotype-matched control under otherwise identical
conditions and/or at a
level substantially similar to that for cell known to be positive for the
marker, and/or at a level
substantially higher than that for a cell known to be negative for the marker.
[0580] As used herein, a statement that a cell or population of cells is
"negative" for a
particular marker refers to the absence of substantial detectable presence on
or in the cell of a
particular marker, typically a surface marker. When referring to a surface
marker, the term
refers to the absence of surface expression as detected by flow cytometry, for
example, by
staining with an antibody that specifically binds to the marker and detecting
said antibody,
wherein the staining is not detected by flow cytometry at a level
substantially above the staining
detected carrying out the same procedure with an isotype-matched control under
otherwise
identical conditions, and/or at a level substantially lower than that for cell
known to be positive
for the marker, and/or at a level substantially similar as compared to that
for a cell known to be
negative for the marker.
[0581] The term "vector," as used herein, refers to a nucleic acid molecule
capable of
propagating another nucleic acid to which it is linked. The term includes the
vector as a self-
replicating nucleic acid structure as well as the vector incorporated into the
genome of a host
cell into which it has been introduced. Certain vectors are capable of
directing the expression of
nucleic acids to which they are operatively linked. Such vectors are referred
to herein as
"expression vectors."
[0582] As used herein, a "subject" is a mammal, such as a human or other
animal, and
typically is human.
VIII. EXEMPLARY EMBODIMENTS
[0583] Among the provided embodiments are:
153
CA 03049461 2019-07-04
WO 2018/132518 PCT/US2018/013227
1. A method of identifying one or more genomic region(s) predictive of an
outcome
of treatment with a cell therapy, the method comprising:
(a) analyzing or determining an epigenetic property of one or more genomic
regions of a
cell or a population of cells, said cell or population comprised in (i) a
first composition of cells
to be genetically engineered with a recombinant receptor to produce a second
composition
comprising the recombinant receptor, or (ii) a second composition of cells
comprising the
recombinant receptor; and
(b) identifying one or more of said one or more genomic regions, of which the
epigenetic
property, overall across the one or more genomic regions, predicts, indicates
or correlates with
an outcome of a cell therapy, said cell therapy comprising administering the
second composition
of cells comprising the recombinant receptor.
2. The method of embodiment 1, wherein the outcome is optionally a complete
response, a partial response, progressive disease, a molecularly detectable
disease, relapse,
durability of response, outcome associated with or indicative of efficacy, or
outcome associated
with or indicative of toxicity.
3. A method of identifying one or more genomic region(s) predictive of an
outcome
of treatment with a cell therapy, the method comprising:
(a) determining or measuring a level or degree or relative level or degree of
an epigenetic
property of one or more genomic regions for a cell or a population of cells
comprised in a first
therapeutic composition;
(b) determining or measuring a level or degree or relative level or degree of
said
epigenetic property of said one or more genomic regions for a cell or a
population of cells
comprised in second therapeutic composition;
(c) comparing the level or degree in (a) and the level or degree in (b) for
one or more of
the genomic regions.
4. The method of embodiment 3, further comprising identifying one or more
of the
one or more genomic regions in which the level or degree determined or
measured in (a) is
different, optionally significantly different, as compared to the level or
degree determined or
measured in (b).
5. The method of embodiment 3 or embodiment 4, wherein, for each of the
plurality
of genomic regions, a difference or significant difference between the level
or degree detected or
measured in (a) and the level or degree detected or measured in (b) indicates
that the epigenetic
property or degree or level thereof correlates with, predicts, predicts the
likelihood or risk of, an
154
CA 03049461 2019-07-04
WO 2018/132518 PCT/US2018/013227
outcome that occurs or has occurred with one but not the other of, the first
and second
therapeutic compositions, wherein the outcome is optionally a complete
response, a partial
response, progressive disease, a molecularly detectable disease, relapse,
durability of response,
outcome associated with or indicative of efficacy, or outcome associated with
or indicative of
toxicity.
6. The method of any of embodiments 1-5, wherein the genomic region
comprises a
genomic locus or gene.
7. The method of embodiment 1 or embodiment 2, wherein the genomic region
comprises an open reading frame of a gene.
8. The method of any of embodiments 1-7, wherein the epigenetic property is
selected from among chromatin accessibility, nucleosome occupancy, histone
modification,
spatial chromosomal conformation, transcription factor occupancy and DNA
methylation.
9. The method of any of embodiments 1-8, wherein the epigenetic property is
chromatin accessibility.
10. The method of any of embodiments 1-9, wherein:
said epigenetic property comprises chromatin accessibility, a level or degree
of
chromatin accessibility, a relative level or degree of chromatin
accessibility, and/or
said epigenetic property comprises a degree or level of, relative degree or
level of, or
profile or map of, chromatin accessibility across the genomic region.
11. The method of any of embodiments 8-10, wherein chromatin accessibility
is
determined by Assay for Transposase Accessible Chromatin with high-throughput
sequencing
(ATAC-seq) or chromatin immunoprecipitation coupled to high-throughput
sequencing (ChIP-
seq).
12. The method of any of embodiments 8-11, wherein chromatin accessibility
is
determined by ATAC-seq.
13. The method of any of embodiments 1-12, wherein analyzing the epigenetic
property comprises generating an epigenetic map showing a profile of sequence
reads associated
with or indicative of the epigenetic property, optionally sequence reads
associated with or
indicative of chromatin accessibility, along each of the one or more genomic
regions or a subset
thereof and/or
comprises, for each of a plurality of sites or portions along the length of
the genomic
region, generating one or more sequence reads indicative of an epigenetic
readout, optionally
chromatin accessibility, at said site or portion, wherein the quantity of said
one or more
155
CA 03049461 2019-07-04
WO 2018/132518 PCT/US2018/013227
sequence reads indicates a degree or level of said epigenetic property,
optionally said chromatin
accessibility, at said site or portion.
14. The method of embodiment 13, wherein said analyzing optionally further
comprises determining an overall degree or level of said epigenetic readout,
optionally
determining an overall degree or level of accessibility, over the genomic
region.
15. The method of any of embodiments 1-14, wherein analyzing the epigenetic
property comprises determining, measuring or quantitating a value or level of
chromatin
accessibility across the one or more genomic regions.
16. The method of any of embodiments 1-14, wherein analyzing the epigenetic
property comprises determining, measuring or quantitating a value or level
associated with or
indicative of the epigenetic property, optionally chromatin accessibility,
across the one or more
genomic regions or a subset thereof.
17. The method of embodiment 15 or embodiment 16, wherein the value or
level is
or comprises determining the fragments per kilobase per million of mapped
reads (FPKM) value
within each of the one or more genomic regions or a subset thereof.
18. The method of any of embodiments 15-17, wherein the value or level is
or
comprises totaling or summing the fragments per kilobase per million of mapped
reads (FPKM)
value within each of the one or more genomic regions or a subset thereof.
19. The method of any of embodiments 1-18, wherein the step (a) and (b) are
performed for a plurality of subjects having each been independently
administered a second
composition of cells comprising cells engineered with a recombinant receptor.
20. The method of any of embodiments 16-19, wherein, for each genomic
region or
subset thereof, preparing a display comprising the value or level of the
sequence reads for each
genomic locus mapped to the outcome of the cell therapy for each of the
plurality of subjects.
21. The method of embodiment 20, wherein the display comprises a heat map,
a
scatter plot, a hierarchical clustering and/or a constellation plot.
22. The method of embodiment 20 or embodiment 21, wherein said identifying
said
one or more genomic regions comprises performing cluster analysis based on
outcome of the
cell therapy.
23. The method of embodiment 20 or embodiment 21, wherein said identifying
said
one or more genomic regions that indicate or correlate with an outcome of the
cell therapy
comprises determining if at least a majority of subjects with the same or
similar outcome cluster
together in the display.
156
CA 03049461 2019-07-04
WO 2018/132518 PCT/US2018/013227
24. The method of embodiment 23, wherein a genomic region is identified if
at least
55%, 60%, 70%, 80%, 90%, 95% or more of the subjects with the same or similar
outcome
cluster together in the display.
25. The method of any of embodiments 1-24, wherein the whole genome of the
cell
is analyzed.
26. The method of any of embodiments 1-24, wherein a portion of the genome
of the
cell is analyzed.
27. The method of embodiment 26, wherein the portion of the genome
comprises one
or more genomic regions, optionally one or more genomic loci, associated with
or indicative of
or likely to be associated with or indicative of the phenotype, the activation
state, the strength of
an activation signal or the effector function of a cell.
28. The method of any of embodiments 1-27, wherein the outcome of the cell
therapy
is a response, a toxicity, immunogenicity or a phenotype or function of the
cell therapy, a
complete response, a partial response, progressive disease, a molecularly
detectable disease,
relapse, durability of response, outcome associated with or indicative of
efficacy, or outcome
associated with or indicative of toxicity.
29. The method of embodiment 28, wherein the response is a complete
response,
partial response, progressive disease or a molecularly detectable disease.
30. The method of embodiment 28, wherein the toxicity is cytokine release
syndrome
(CRS), severe CRS, grade 3 or higher CRS, neurotoxicity, severe neurotoxicity,
grade 3 or
higher neurotoxicity and/or a cerebral edema.
31. The method of embodiment 28 or embodiment 30, wherein the toxicity is a
dose
limiting toxicity (DLT).
32. The method of any of embodiments 1-31, wherein the epigenetic property
of
from or from about 2 to 50, 2 to 20, 2 to 10,2 to 5,5 to 50,5 to 20,5 to 10,
10 to 50, 10 to 20 or
20 to 50 genomic regions are analyzed.
33. The method of any of embodiments 1-32, wherein a panel comprising two
or
more of the genomic regions are identified.
34. The method of any of embodiments 1-33, wherein the first composition of
cells
and second composition of cells comprise primary cells selected or isolated
from a subject.
35. The method of any of embodiments 1-34, wherein the cell is an immune
cell.
36. The method of any of embodiments 1-35, wherein the immune cell is a T
cell or
an NK cell.
157
CA 03049461 2019-07-04
WO 2018/132518 PCT/US2018/013227
37. The method of any of embodiments 1-36, wherein the T cells is a CD4+
and/or
CD8+ T cells.
38. The method of any of embodiments 1-37, wherein the second composition
of
cells is analyzed.
39. The method of any of embodiments 1-38, wherein the second composition
of
cells comprises a nucleic acid encoding the recombinant receptor.
40. The method of embodiment 39, wherein the nucleic acid molecule is
contained in
a viral vector.
41. The method of embodiment 40, wherein the viral vector is an adenovirus,
lentivirus, retrovirus, herpesvirus or adeno-associated virus vector.
42. The method of any of embodiments 1-41, wherein the first composition of
cells
and/or second composition of cells is produced by culturing an input
composition in the
presence of one or more conditions or agents.
43. The method of any of embodiments 1-42, wherein the one or more genomic
regions comprise genes involved in or likely to be involved in the activation
state or effector
state of the cell.
44. A method of assessing a cell composition for administration to a
subject,
comprising:
(a) analyzing an epigenetic profile of one or more genomic regions of a cell
comprised in
a cell composition comprising cells engineered with a recombinant receptor;
and
(b) comparing the epigenetic profile for each genomic region, individually, to
a reference
profile, wherein the comparison indicates whether the population of cells is
or is likely to exhibit
or produce an outcome when administered to a subject.
45. The method of embodiment 44, wherein the outcome of the cell therapy is
a
response, a toxicity, immunogenicity or a phenotype or function of the cell
therapy, a complete
response, a partial response, progressive disease, a molecularly detectable
disease, relapse,
durability of response, outcome associated with or indicative of efficacy, or
outcome associated
with or indicative of toxicity.
46. The method of embodiment 45, wherein the response is a complete
response or a
partial response.
47. The method of any of embodiments 44-46, wherein if the comparison
indicates
that the cell composition is or is likely to exhibit the outcome,
administering the cell
composition to the subject.
158
CA 03049461 2019-07-04
WO 2018/132518 PCT/US2018/013227
48. The method of embodiment 47, wherein if the comparison indicates that
the cell
composition is not or is not likely to exhibit the outcome, either:
(i) administering a cell composition in which the cell composition is altered;
(ii) administering the cell composition in which the dose of cells is altered;
(iii) administering the cell composition in which the dosage regimen of cells
administered to the subject is altered;
(iv) administering the cell composition in combination with one or more other
therapeutic agents; or
(v) not administering the cell composition to the subject.
49. The method of embodiment 48, wherein, prior to administering an altered
cell
composition, repeating steps (a) and (b) on a cell comprised in the altered
cell composition.
50. The method of embodiment 49, wherein altering the dosing regimen of
cells
comprises administering a second dose of cells to the subject subsequent to
administering a first
dose of cells to the subject.
51. The method of embodiment 50, wherein the subsequent dose of cells is
administered at least 1 week, 2 weeks, 3 weeks, 4 weeks, 2 months, 3 months, 4
months, 5
months, 6 months, 9 months or 12 months after administering the first dose of
cells.
52. The method of any of embodiments 44-51, wherein the one or more genomic
regions are associated with or indicative of a response to the cell therapy.
53. The method of any of embodiments 44-52, wherein the reference profile
comprises a threshold value for the epigenetic property for each of the one or
more genomic
regions or for the overall epigenetic property within the one or more genomic
regions.
54. The method of embodiment 53, wherein the threshold value:
is a value or level of the epigenetic property, optionally chromatin
accessibility, in the
one or more genomic regions in a cell of a cell composition shown to exhibit
the outcome when
administered to a subject having the same or similar disease or condition; or
is an average, median or mean value or level of the epigenetic property,
optionally
chromatin accessibility, in the one or more genomic regions from a cell of
each of a plurality of
cell compositions, shown to exhibit the outcome when administered to the
subject.
55. The method of any of embodiments 44-54, wherein the threshold value
comprises
is the value or level of the epigenetic property in a cell from a normal or
healthy subject.
159
CA 03049461 2019-07-04
WO 2018/132518 PCT/US2018/013227
56. The method of any of embodiments 44-55, wherein the threshold value
comprises
the value or level of the epigenetic property in a cell that exhibits a naïve
or a long-lived
memory phenotype.
57. A method of assessing a cell culture, comprising:
(a) analyzing an epigenetic profile of one or more genomic regions of a cell
comprised
in an output cell composition, said output composition produced by culturing
an input
composition in the presence of one or more test agents or conditions; and
(b) comparing the epigenetic profile for each genomic region, individually, to
a reference
profile, wherein the comparison indicates whether the cell is or is likely to
exhibit a
predetermined phenotype or function.
58. The method of embodiment 57, wherein the predetermined phenotype or
function
indicates the effector function or activation state of the cell and/or
indicates that the cells exhibit
a naïve phenotype or a long-lived memory phenotype.
59. The method of embodiment 57 or embodiment 58, wherein the one or more
test
agents or conditions comprises presence or concentration of serum; time in
culture; presence or
amount of a stimulating agent; the type or extent of a stimulating agent;
presence or amount of
amino acids; temperature; the source or cell types of the input composition;
the ratio or
percentage of cell types in the input composition, optionally the CD4+/CD8+
cell ratio; the
presence or amount of beads; cell density; static culture; rocking culture;
perfusion; the type of
viral vector; the vector copy number; the presence of a transduction adjuvant;
cell density of the
input composition in cryopreservation; the extent of expression of the
recombinant receptor; or
the presence of a compound to modulate cell phenotype.
60. The method of embodiment 58 or embodiment 59, wherein the one or more
test
agents or conditions comprises one or more compounds from a library of test
compounds.
61. The method of any of embodiments 57-60, comprising if the comparison
indicates that the cell composition is or is likely to have the phenotype or
function, selecting the
one or more test agent or condition for culturing the cells.
62. The method of any of embodiments 57-60, comprising if the comparison
indicates that the cell composition is or is likely not to have the phenotype
or function, repeating
steps (a) and (b) with one or more further test agent or condition.
63. The method of any of embodiments 57-62, wherein the reference profile
comprises a threshold value for the epigenetic property for each of the one or
more genomic
regions or for the overall epigenetic property within the one or more genomic
regions.
160
CA 03049461 2019-07-04
WO 2018/132518 PCT/US2018/013227
64. The method of embodiment 63, wherein the threshold value:
is a value or level of the epigenetic property, optionally chromatin
accessibility, in the
one or more genomic regions in a cell of a reference cell composition shown to
exhibit the
phenotype or function; or
is an average, median or mean value or level of the epigenetic property,
optionally
chromatin accessibility, in the one or more genomic regions from a cell of
each of a plurality of
reference cell compositions, shown to exhibit the phenotype or function.
65. The method of embodiment 64, wherein the reference cell composition has
a
phenotype indicative of a naïve T cell, a long-lived memory T cell, a central
memory T cell
(Tcm) or a stem-like memory T cell (Tcsm).
66. The method of any of embodiments 44-65, wherein analyzing the
epigenetic
property comprises determining, measuring or quantitating a value or level of
chromatin
accessibility across the one or more genomic regions.
67. The method of any of embodiments 44-66, wherein analyzing the
epigenetic
property comprises determining, measuring or quantitating a value or level of
the sequence reads
associated with or indicative of the epigenetic property, optionally chromatin
accessibility, in the
one or more genomic regions or a subset thereof.
68. The method of embodiment 66 or embodiment 67, wherein determining,
measuring or quantitating a value or level comprises determining the fragments
per kilobase per
million of mapped reads (FPKM) value within each of the one or more genomic
regions or a
subset thereof.
69. The method of any of embodiments 66-68, wherein determining, measuring
or
quantitating a value or level comprises totaling or summing the fragments per
kilobase per
million of mapped reads (FPKM) value within each of the one or more genomic
regions or a
subset thereof.
70. The method of any of embodiments 1-69, wherein the one or more genomic
regions comprises a panel comprising at least 2 to 50, 2 to 20, 2 to 10, 2 to
5, 5 to 50, 5 to 20, 5
to 10, 10 to 50, 10 to 20 or 20 to 50 genomic regions.
71. The method of any of embodiments 27-70, wherein the one or more genomic
regions comprise one or more genomic loci associated with or indicative of the
effector-like
function or activation state of the cell.
72. The method of any of embodiments 27-71, wherein the one or more genomic
regions comprises a genetic locus selected from the group consisting of Nr4a1,
Cblb, Irf4,
161
CA 03049461 2019-07-04
WO 2018/132518 PCT/US2018/013227
Tbx21, Eomes, Ifng, Il2ra, 112, Csf2, Gzmb, Tnfsf10, Gata3, Mir155, Sox21,
Ctla4, Lag3, and
Pdcdl.
73. The method of any of embodiments 27-72, wherein the one or more genomic
regions comprises a genomic locus selected from the group consisting of Ctla4,
Il2ra, 112, Ifng
and Gzmb.
74. The method of any of embodiments 27-73, wherein the genomic region
comprises a genomic locus or gene.
75. The method of any of embodiments 27-74, wherein the genomic region
comprises an open reading frame of a gene.
76. The method of any of embodiments 27-75,wherein the epigenetic property
is
selected from among chromatin accessibility, nucleosome occupancy, histone
modification,
spatial chromosomal conformation, transcription factor occupancy and DNA
methylation.
77. The method of any of embodiments 27-76, wherein the epigenetic property
is
chromatin accessibility.
78. The method of embodiment 77, wherein chromatin accessibility is
determined by
Assay for Transposase Accessible Chromatin with high-throughput sequencing
(ATAC-seq) or
chromatin immunoprecipitation coupled to high-throughput sequencing (ChIP-
seq).
79. The method of embodiment77 or embodiment 78, wherein chromatin
accessibility is determined by ATAC-seq.
80. The method of any of embodiments 1-79, wherein the cell is obtained
from a
sample from a subject.
81. The method of embodiment 80, wherein the cell is an immune cell,
optionally a T
cell, optionally a CD4+ and/or CD8+ T cell.
82. The method of any of embodiments 1-81, wherein:
the recombinant receptor binds to, recognizes or targets an antigen associated
with the
disease or condition; and/or the recombinant receptor is a T cell receptor or
a functional non-T
cell receptor; and/or
the recombinant receptor is a chimeric antigen receptor (CAR).
83. The method of embodiment 82, wherein:
the CAR comprises an extracellular antigen-recognition domain that
specifically binds to
the antigen and an intracellular signaling domain comprising an ITAM, wherein
optionally, the
intracellular signaling domain comprises an intracellular domain of a CD3-zeta
(CD3) chain;
162
CA 03049461 2019-07-04
WO 2018/132518 PCT/US2018/013227
and/or wherein the CAR further comprises a costimulatory signaling region,
which optionally
comprises a signaling domain of CD28 or 4-1BB.
84. A cell composition, comprising a plurality of cells, wherein the level
or value of
an epigenetic property for one or more genes in a panel is above or below a
threshold value in at
least 50% of the cells in the composition.
85. The cell composition of embodiment 84, wherein the level or value is
above or
below the threshold value in at least 60%, 70%, 75%, 80%, 85%, 90%, 95% or
more of the cells
in the composition.
86. The cell composition of embodiment 84 or embodiment 85, wherein the
threshold
value:
is a value or level of the epigenetic property, optionally chromatin
accessibility, in the
one or more genomic regions in a cell of a reference cell composition shown to
exhibit the
phenotype or function; or
is an average, median or mean value or level of the epigenetic property,
optionally
chromatin accessibility, in the one or more genomic regions from a cell of
each of a plurality of
reference cell compositions, shown to exhibit the phenotype or function.
87. The cell composition of any of embodiments 84-86, wherein the reference
cell
composition has a phenotype indicative of a naïve T cell, a long-lived memory
T cell, a central
memory T cell (Tcm) or a stem-like memory T cell (Tcsm).
88. The composition of any of embodiments 84-87, wherein the panel
comprises
from or from about 2 to 50, 2 to 20, 2 to 10,2 to 5,5 to 50,5 to 20,5 to 10,
10 to 50, 10 to 20 or
20 to 50 genomic regions.
89. A method of identifying one or more genomic region(s) associated with
an
outcome of treatment with a cell therapy, the method comprising:
(a) analyzing or determining an epigenetic property of one or more genomic
regions of a
cell or a population of cells, said cell or population comprised in (i) a
first composition of cells
to be genetically engineered with a recombinant receptor to produce a second
composition
comprising the recombinant receptor, or (ii) a second composition of cells
comprising the
recombinant receptor; and
(b) identifying one or more of the one or more genomic regions, of which the
epigenetic
property, overall across the one or more genomic regions, predicts, indicates
or correlates with
an outcome of a cell therapy, said cell therapy comprising administering to a
subject or a group
of subjects the second composition of cells comprising the recombinant
receptor.
163
CA 03049461 2019-07-04
WO 2018/132518 PCT/US2018/013227
90. The method of embodiment 89, wherein the outcome is an outcome
associated
with or indicative of efficacy, a response, persistence, a toxicity, or
immunogenicity.
91. The method of embodiment 90, wherein the outcome is a response, and the
response is a complete response, a partial response, progressive disease, a
molecularly detectable
disease, relapse, or durability of response.
92. The method of 90, wherein the outcome is a toxicity and the toxicity is
cytokine
release syndrome (CRS), severe CRS, grade 3 or higher CRS, neurotoxicity,
severe
neurotoxicity, grade 3 or higher neurotoxicity and/or a cerebral edema.
93. The method of embodiment 90 or embodiment 92, wherein the toxicity is a
dose
limiting toxicity (DLT).
94. The method of any of embodiments 89-93, wherein:
the first composition is enriched for CD4+ primary human T cells and/or CD8+
primary
human T cells; and/or
the second composition is enriched for CD4+ primary human T cells and/or CD8+
primary human T cells.
95. A method for determining one or more properties or features of a cell
composition, the method comprising analyzing or determining an epigenetic
property of one or
more genomic regions of a T cell composition, said T cell composition enriched
for CD4+
primary human T cells and/or CD8+ primary human T cells.
96. The method of embodiment 95, wherein the cell composition is (i) a
first T cell
composition of cells to be genetically engineered with a recombinant receptor
to produce a
second T cell composition comprising the recombinant receptor, or (ii) a
second T cell
composition of cells comprising the recombinant receptor.
97. The method of any of embodiments 84-96, wherein:
the cell composition comprises greater than or greater than about 70%, greater
than or
greater than about 75%, greater than or greater than about 80%, greater than
or greater than
about 85%, greater than or greater than about 90%, greater than or greater
than about 95% or
greater than or greater than about 98% CD4+ and/or CD8+ primary human T cells;
and/or
the cell composition consists essentially of CD4+ and/or CD8+ primary human T
cells.
98. The method of embodiment embodiment95-97, further comprising comparing
the
epigenetic property for each of the one or more genomic region, individually,
to the
corresponding epigenetic property of cells from a different cell composition
and/or to a
164
CA 03049461 2019-07-04
WO 2018/132518 PCT/US2018/013227
reference profile, optionally a reference profile known to indicate or
correlate with an attribute
or feature of a cell composition.
99. The method of embodiment 98, wherein the comparison indicates or
correlates
with the state, phenotype or function of the cells within the cell
composition, optionally an
activation, effector or memory state; consistency or uniformity of the cells
within the cell
composition; whether the composition of cells is or is likely to exhibit or
produce an outcome
when administered to a subject or a group of subjects; , the location,
abundance or frequency of
integration of exogenous nucleic acids; clonality of cells within the cell
composition; and/or the
proportion or frequency of engineered cells in the cell composition.
100. A method for determining or identifying an epigenetic property associated
with
an attribute or feature of a cell composition, the method comprising:
(a) determining or measuring a level or degree or relative level or degree of
an epigenetic
property of one or more genomic regions for a cell or a population of cells
comprised in a first
cell composition;
(b) determining or measuring a level or degree or relative level or degree of
said
epigenetic property of the one or more genomic regions for a cell or a
population of cells
comprised in a second cell composition; and
(c) comparing the level or degree in (a) and the level or degree in (b),
wherein a
difference, optionally a significant difference, in the level or degree of the
epigenetic property of
the one or more of the genomic regions identifies or determines the presence
of an epigenetic
property indicative of or that correlates with an attribute or feature present
in cells of one but not
the other of the first and second composition.
101. The method of embodiment 100, wherein:
one of the first composition and second composition comprises cells to be
genetically
engineered with a recombinant receptor and the other of the first composition
and second
composition comprises the cells engineered to express the recombinant
receptor;
the first composition and second composition comprise primary cells from
different
donors, optionally donors that differ based on disease state, severity of
disease, or type of
disease;
the first composition and second composition comprise cells at different
stages or steps
of a manufacturing process for engineering cells;
165
CA 03049461 2019-07-04
WO 2018/132518 PCT/US2018/013227
one of the first composition and second composition comprises cells contacted
with an
agent to modulate the activity, phenotype or function of the cells and the
other of the first and
second composition comprises similar cells not so contacted; or
one of the first composition and second composition comprises a sample of a
cell
composition associated with an outcome that occurs or has occurred with the
one but not the
other of the first and second composition following administration to a
subject.
102. The method of embodiment 101, wherein the agent is a polypeptide or
protein, a
peptide, an antibody, a nucleic acid, a viral vector or viral preparation, or
a small molecule
compound.
103. The method of embodiment 101 or embodiment 102, wherein the agent is a
stimulatory reagent, optionally anti-CD3/anti-CD28; an immunomodulatory agent,
an anti-
idiotype antibody or antigen-binding fragment thereof specific to the CAR, an
immune
checkpoint inhibitor, a modulator of a metabolic pathway, an adenosine
receptor antagonist, a
kinase inhibitor, an anti-TGFP antibody or an anti-TGUR antibody or a
cytokine.
104. The method of any of embodiments 100-103, wherein the attribute or
feature of
the first composition is indicative of a state, phenotype of function,
optionally an activation,
effector or memory state, phenotype or function; the location, abundance or
frequency of
integration of exogenous nucleic acids; clonality of cells within the cell
composition; the
proportion or frequency of engineered cells in the cell composition; and/or
whether the
composition of cells is or is likely to exhibit or produce an outcome when
administered to a
subject or a group of subjects.
105. The method of embodiment 100 or embodiment 104, wherein the outcome is an
outcome associated with or indicative of efficacy, a response, persistence, a
toxicity, or
immunogenicity.
106. The method of embodiment 105, wherein the outcome is a response, and the
response is a complete response, a partial response, progressive disease, a
molecularly detectable
disease, relapse, or durability of response.
107. The method of 106, wherein the outcome is a toxicity and the toxicity is
cytokine
release syndrome (CRS), severe CRS, grade 3 or higher CRS, neurotoxicity,
severe
neurotoxicity, grade 3 or higher neurotoxicity and/or a cerebral edema.
108. The method of embodiment 106 or embodiment 107, wherein the toxicity is a
dose limiting toxicity (DLT).
109. The method of any of embodiments 1100-108 that is repeated a plurality of
times.
166
CA 03049461 2019-07-04
WO 2018/132518 PCT/US2018/013227
110. The method of embodiment 109, wherein an epigenetic property is
identified or
determined that is present in a majority of one but not the other of the first
and second
composition.
111. A method of assessing an attribute or feature of a cell composition,
comprising:
(a) analyzing an epigenetic property of one or more genomic regions of a cell
or
population of cells comprised in a cell composition comprising cells
engineered with a
recombinant receptor and/or cells to be genetically engineered with a
recombinant receptor; and
(b) comparing the epigenetic property of the one or more genomic region,
individually,
to a reference profile, wherein the comparison indicates whether the
composition of cells is or is
likely to exhibit the attribute or feature.
112. The method of embodiment 111, wherein the attribute or feature is
indicative of a
state, phenotype of function, optionally an activation, effector or memory
state, phenotype or
function; the location, abundance or frequency of integration of exogenous
nucleic acids;
clonality of cells within the cell composition; the proportion or frequency of
engineered cells in
the cell composition; and/or whether the composition of cells is or is likely
to exhibit or produce
an outcome when administered to a subject or a group of subjects.
113. The method of embodiment 113 or embodiment 112, wherein the attribute or
feature is whether the composition of cells is or is likely to exhibit or
produce an outcome when
administered to a subject or a group of subjects and the method is for
assessing the cell
composition for administration to a subject.
114. The method of embodiment 112 or embodiment 113, wherein the outcome is an
outcome associated with or indicative of efficacy, a response, persistence, a
toxicity, or
immunogenicity.
115. The method of embodiment 114, wherein the outcome is a response, and the
response is a complete response, a partial response, progressive disease, a
molecularly detectable
disease, relapse, or durability of response.
116. The method of 115, wherein the outcome is a toxicity and the toxicity is
cytokine
release syndrome (CRS), severe CRS, grade 3 or higher CRS, neurotoxicity,
severe
neurotoxicity, grade 3 or higher neurotoxicity and/or a cerebral edema.
117. The method of embodiment 115 or embodiment 116, wherein the toxicity is a
dose limiting toxicity (DLT).
167
CA 03049461 2019-07-04
WO 2018/132518 PCT/US2018/013227
118. The method of any of embodiments 111-117, wherein if the comparison
indicates
that the cell composition is or is likely to exhibit a desired outcome,
administering the cell
composition to the subject.
119. The method of any of embodiments 111-118, wherein if the comparison
indicates
that the cell composition is not or is not likely to exhibit a desired
outcome, either:
(i) administering a cell composition in which the cell composition is altered;
(ii) administering the cell composition in which the dose of cells is altered;
(iii) administering the cell composition in which the dosage regimen of cells
administered to the subject is altered;
(iv) administering the cell composition in combination with one or more other
therapeutic agents; or
(v) not administering the cell composition to the subject.
120. The method of embodiment 118 or embodiment 119, wherein the desired
outcome is a complete response, partial response, or durable response and/or
is a grade 3 or
lower neurotoxicty or grade 1 or grade 2 neurotoxicty, is a grade 3 or lower
CRS, or is grade 1
or grade 2 CRS, or does not include any grade of neurotoxicity or any grade of
CRS.
121. The method of embodiment 119 or embodiment 120, wherein the cell
composition is altered by altering one or more agents or conditions in one or
more steps for
engineering the cells in the cell composition.
122. The method of embodiment 121, wherein the one or more agents or
conditions is
selected from presence or concentration of serum; time in culture; presence or
amount of a
stimulating agent; the type or extent of a stimulating agent; presence or
amount of amino acids;
temperature; the source or cell types of the cell composition; the ratio or
percentage of cell types
in the cell composition, optionally the CD4+/CD8+ cell ratio; the presence or
amount of beads;
cell density; static culture; rocking culture; perfusion; the type of viral
vector; the vector copy
number; the presence of a transduction adjuvant; cell density of the cell
composition in
cryopreservation; the extent of expression of the recombinant receptor; or the
presence of a
compound to modulate cell phenotype.
123. The method of embodiment 121 or embodiment 122, wherein, prior to
administering an altered cell composition, repeating steps (a) and (b) on a
cell comprised in the
altered cell composition.
168
CA 03049461 2019-07-04
WO 2018/132518 PCT/US2018/013227
124. The method of embodiment 123, wherein altering the dosing regimen of
cells
comprises administering a second dose of cells to the subject subsequent to
administering a first
dose of cells to the subject.
125. The method of embodiment 124, wherein the subsequent dose of cells is
administered at least 1 week, 2 weeks, 3 weeks, 4 weeks, 2 months, 3 months, 4
months, 5
months, 6 months, 9 months or 12 months after administering the first dose of
cells.
126. The method of any of embodiments 111-125, wherein the reference profile
comprises a threshold value for the epigenetic property for each of the one or
more genomic
regions or for the overall epigenetic property within the one or more genomic
regions.
127. The method of embodiment 126, wherein the threshold value:
is a value or level associated with or indicative of the epigenetic property,
optionally
chromatin accessibility, in the one or more genomic regions in a cell of a
cell composition
shown to exhibit the desired outcome when administered to a subject having the
same or similar
disease or condition;
is an average, median or mean value or level, or is within a standard
deviation of the
average, median or mean value or level, associated with or indicative of the
epigenetic property,
optionally chromatin accessibility, in the one or more genomic regions from a
cell of each of a
plurality of cell compositions that had been individually administered to a
group of subjects,
wherein each of the subjects of the group went on to to exhibit the desired
outcome following
administration ; or
is the value or level associated with or indicative of the epigenetic property
in a similar
cell composition from a normal or healthy subject.
128. The method of any of embodiments 111-125, wherein:
the comparison comprises differential accessibility analysis; and/or
the reference profile comprises a reference epigenetic map comprising peaks of
sequence reads within the one or more genomic regions.
129. The method of embodiment 128, wherein:
the reference epigenetic map is determined from accessibility analysis,
optionally
chromatin accessibility, of a cell composition shown to exhibit the desired
outcome following
administration of the cell or cell composition to a subject having the same or
similar disease or
condition;
the reference epigenetic map is a determined from common peaks of sequence
reads
from accessibility analysis, optionally chromatin accessibility, among a
plurality of cell
169
CA 03049461 2019-07-04
WO 2018/132518 PCT/US2018/013227
compositions that had been individually administered to a group of subjects,
wherein each of the
subjects of the group went on to to exhibit the desired outcome following
administration; or
the reference epigenetic map is determined from accessibility analysis,
optionally
chromatin accessibility of a similar cell composition from a normal or healthy
subject.
130. A method of assessing a cell composition, comprising:
(a) analyzing an epigenetic property of one or more genomic regions of a cell
comprised
in an output cell composition, said output composition produced by culturing
an input
composition in the presence of one or more test agents or conditions, and/or
of a cell comprised
in the input composition; and
(b) comparing the epigenetic property of the one or more genomic region,
individually,
to a reference profile, wherein the comparison indicates whether the cell is
or is likely to exhibit
a predetermined feature or attribute.
131. The method of embodiment 130, wherein the predetermined feature or
attribute is
the state, phenotype or function of cells within the composition, the
consistency or uniformity of
the cells within the cell composition, the location, abundance or frequency of
integration of
exogenous nucleic acids, clonality of cells within the cell composition and/or
the proportion or
frequency of engineered cells in the cell composition.
132. The method of embodiment 131, wherein the predetermined phenotype or
attribute is a state, phenotype or function that indicates the effector
function or activation state of
the cell and/or indicates that the cells exhibit a naïve phenotype or a long-
lived memory
phenotype.
133. The method of embodiment 131 or embodiment 132, wherein the one or more
test agents or conditions comprises presence or concentration of serum; time
in culture; presence
or amount of a stimulating agent; the type or extent of a stimulating agent;
presence or amount
of amino acids; temperature; the source or cell types of the input
composition; the ratio or
percentage of cell types in the input composition, optionally the CD4+/CD8+
cell ratio; the
presence or amount of beads; cell density; static culture; rocking culture;
perfusion; the type of
viral vector; the vector copy number; the presence of a transduction adjuvant;
cell density of the
input composition in cryopreservation; the extent of expression of the
recombinant receptor; or
the presence of a compound to modulate cell phenotype.
134. The method of any of embodiments 131-133, wherein the one or more test
agents
or conditions comprises one or more compounds from a library of test
compounds.
170
CA 03049461 2019-07-04
WO 2018/132518 PCT/US2018/013227
135. The method of any of embodiments 131-134, comprising if the comparison
indicates that the cell composition is or is likely to have a desired feature
or attribute, selecting
the one or more test agent or condition for culturing the cells and/or
selecting the cell
composition for administration to a subject.
136. The method of any of embodiments 131-134, comprising if the comparison
indicates that the cell composition is or is likely not to have a desired
feature or attribute,
repeating steps (a) and (b) with one or more further test agent or condition.
137. The method of any of embodiments 131-136, wherein the reference profile
comprises a threshold value for the epigenetic property for each of the one or
more genomic
regions or for the overall epigenetic property within the one or more genomic
regions.
138. The method of embodiment 137, wherein the threshold value:
is a value or level associated with or indicative of the epigenetic property,
optionally
chromatin accessibility, in the one or more genomic regions in a cell of a
cell composition
known to exhibit the desired attribute or feature;
is an average, median or mean value or level, or is within a standard
deviation of the
average, median or mean value or level, associated with or indicative of the
epigenetic property,
optionally chromatin accessibility, in the one or more genomic regions from a
cell of each of a
plurality of cell compositions known to exhibit the desired attribute or
feature.
139. The method of any of embodiments 131-136, wherein:
the comparison comprises differential accessibility analysis; and/or
the reference profile comprises a reference epigenetic map comprising peaks of
sequence
reads within the one or more genomic regions.
140. The method of embodiment 139, wherein:
the reference epigenetic map is determined from accessibility analysis,
optionally
chromatin accessibility, of a cell composition known to exhibit the desired
attribute or feature;
the reference epigenetic map is a determined from common peaks of sequence
reads
from accessibility analysis, optionally chromatin accessibility, among a
plurality of cell
compositions known to exhibit the desired attribute or feature.
141. The method of any of embodiments 131-140, wherein the desired outcome or
feature is a phenotype or function indicative of a naïve T cell, a long-lived
memory T cell, a
central memory T cell (Tcm) or a stem-like memory T cell (Tcsm).
142. The method of any of embodiments 89-141, wherein the genomic region
comprises a genomic locus or gene.
171
CA 03049461 2019-07-04
WO 2018/132518 PCT/US2018/013227
143. The method of any of embodiments 89-142, a wherein the genomic region
comprises a coding region, an open reading frame of a gene, a non-coding
region, an intergenic
region or a regulatory element.
144. The method of any of embodiments 89-143, wherein the genomic region
comprises an open reading frame of a gene.
145. The method of any of embodiments 89-143, wherein the genomic region
comprises an intergenic region or a regulatory element.
146. The method of any of embodiments 89-143 and 145, wherein the genomic
region
comprises an intron, an exon, a cis-regulatory element, a promoter, an
enhancer, an upstream
activating sequence (UAS), a 3' untranslated region (UTR), a 5' UTR, a non-
coding RNA
producing region, a non-coding RNA (ncRNA) gene, a miRNA gene, an siRNA gene,
a piRNA
gene, a snoRNA gene, a lncRNA gene, a ribosomal RNA (rRNA) gene, a small RNA
binding
site, a non-coding RNA binding site, a pseudogene, a transcription termination
site (TTS), a
repeat, a telomeric region, accessible chromatin region, non-accessible
chromatin region, open
chromatin region and/or heterochromatin region.
147. The method of any of embodiments 89-146, wherein the epigenetic property
is
selected from among chromatin accessibility, nucleosome occupancy, histone
modification,
spatial chromosomal conformation, transcription factor occupancy and DNA
methylation.
148. The method of any of embodiments 89-147, wherein the epigenetic property
is
chromatin accessibility.
149. The method of any of embodiments 89-148, wherein:
the epigenetic property comprises chromatin accessibility, a level or degree
of chromatin
accessibility, a relative level or degree of chromatin accessibility, and/or
the epigenetic property comprises a degree or level of, relative degree or
level of, or
profile or map of, chromatin accessibility of the genomic region.
150. The method of any of embodiments 147-149, wherein chromatin accessibility
is
determined by Assay for Transposase Accessible Chromatin with high-throughput
sequencing
(ATAC-seq) or chromatin immunoprecipitation coupled to high-throughput
sequencing (ChIP-
seq).
151. The method of any of embodiments 147-150, wherein chromatin accessibility
is
determined by ATAC-seq.
152. The method of any of embodiments 147-151, wherein the assessing the
epigenetic property comprises:
172
CA 03049461 2019-07-04
WO 2018/132518 PCT/US2018/013227
(1) isolating chromatin from the cells or the population of cells,
(2) treating the chromatin with an insertional enzyme complex to generate
tagged
fragments of genomic DNA,
(3) sequencing all or a portion of the tagged fragments to produce a plurality
of sequence
reads;
(4) aligning, filtering and mapping the sequence reads to genomic regions of a
genome;
and
(5) determining or identifying peaks of sequence reads in a plurality of
genomic regions
for each cell or population of cells.
153. The method of embodiment 152, wherein the analyzing or assessing the
epigenetic property further comprises comparing peaks of sequence reads and,
optionally
identifying peaks of sequence reads that are different between samples from
two or more cells or
cell compositions.
154. The method of embodiment 152 or embodiment 153, wherein peaks of sequence
reads comprise sequence reads having a peak signal, level or value that is
enriched, is above
background, and/or is higher compared to sequence reads of a surrounding
regions.
155. The method of any of embodiments 152-154, wherein the analyzing or
assessing
the epigenetic property further comprises performing motif analysis,
transcription factor
occupancy analysis and/or biological pathway analysis of genomic regions
identified as
containing peaks of sequence reads that are different between samples from two
or more cell
populations.
156. The method of any of embodiments 152-155, wherein the analyzing or
assessing
the epigenetic property further comprises determining positions of nucleosomes
within genomic
regions containing peaks of sequence reads.
157. The method of any of embodiments 89-156, wherein analyzing the epigenetic
property comprises generating an epigenetic map showing a profile of sequence
reads associated
with or indicative of the epigenetic property, optionally sequence reads
associated with or
indicative of chromatin accessibility, along each of the one or more genomic
regions or a subset
thereof and/or
comprises, for each of a plurality of sites or portions along the length of
the genomic
region, generating one or more sequence reads indicative of an epigenetic
readout, optionally
chromatin accessibility, at said site or portion, wherein the quantity of said
one or more
173
CA 03049461 2019-07-04
WO 2018/132518 PCT/US2018/013227
sequence reads indicates a degree or level of said epigenetic property,
optionally said chromatin
accessibility, at said site or portion.
158. The method of embodiment 157, wherein said analyzing optionally further
comprises determining an overall degree or level of said epigenetic property,
optionally
determining an overall degree or level of accessibility, over the genomic
region.
159. The method of any of embodiments 89-158, wherein analyzing the epigenetic
property comprises determining, measuring or quantitating a value or level of
chromatin
accessibility across the one or more genomic regions.
160. The method of any of embodiments 89-159, wherein analyzing the epigenetic
property comprises determining, measuring or quantitating a value or level
associated with or
indicative of the epigenetic property, optionally chromatin accessibility,
across the one or more
genomic regions or a subset thereof.
161. The method of embodiment 127, 138, 159 or embodiment 160, wherein the
value
or level is or comprises determining the fragments per kilobase per million of
mapped reads
(FPKM) value within each of the one or more genomic regions or a subset
thereof.
162. The method of any of embodiments 127, 138 and 159-161, wherein the value
or
level is or comprises totaling or summing the fragments per kilobase per
million of mapped
reads (FPKM) value within each of the one or more genomic regions or a subset
thereof.
163. The method of any of embodiments 89-162, wherein the analysis comprises
steps
for removal of mitochondrial reads and/or additional contaminating sequences
based on
sequence identity, quality, mapping location, or other sequencing properties
of said reads.
164. The method of any of embodiments 89-163, wherein the analysis comprises
steps
for removal of duplicate reads to improve quantitative accuracy.
165. The method of any of embodiments 89-164, wherein the analysis comprises
steps
for separation of sequence reads into subsets representing a specific
epigenetic property,
optionally chromatin accessibility or chromatin occupancy, wherein the size of
the sequenced
fragment is used to determine the degree or level to which it represents said
epigenetic property.
166. The method of any of embodiments 89-94 and 142-165, wherein the step (a)
and
(b) are performed on cell compositions from a plurality of subjects having
each been
independently administered a second composition of cells comprising cells
engineered with a
recombinant receptor.
167. The method of any of embodiments 89-94 and 142-166, wherein, for each
genomic region or subset thereof, preparing a display comprising the value or
level of the
174
CA 03049461 2019-07-04
WO 2018/132518 PCT/US2018/013227
sequence reads for each genomic locus mapped to the outcome of the cell
therapy for each of the
plurality of subjects.
168. The method of embodiment 167, wherein the display comprises a heat map, a
scatter plot, a hierarchical clustering and/or a constellation plot.
169. The method of embodimentembodimentany of embodiments 89-169 and 142-
169, wherein said identifying said one or more genomic regions comprises
performing cluster
analysis based on outcome of the cell therapy.
170. The method of embodimentembodiment89-169 and 142-169 , wherein said
identifying said one or more genomic regions that indicate or correlate with
an outcome of the
cell therapy comprises determining if at least a majority of subjects with the
same or similar
outcome cluster together in the display.
171. The method of embodiment 170, wherein a genomic region is identified if
at least
55%, 60%, 70%, 80%, 90%, 95% or more of the subjects with the same or similar
outcome
cluster together in the display.
172. The method of any of embodiments 89-171, wherein the whole genome of the
cell is analyzed.
173. The method of any of embodiments 89-172, wherein a portion of the genome
of
the cell is analyzed.
174. The method of embodiment 173, wherein the portion of the genome comprises
one or more genomic regions, optionally one or more genomic loci, associated
with or indicative
of or likely to be associated with or indicative of the phenotype, the
activation state, the strength
of an activation signal or the effector function of a cell.
175. The method of any of embodiments 89-174, wherein said analyzing further
comprises performing principle component analysis (PCA), biological pathway
analysis, gene
ontology (GO) analysis and/or motif analysis.
176. The method of embodiment 175, wherein the analysis comprises biological
pathway analysis and/or gene subset analysis of one or more genomic regions
associated with a
T cell memory phenotype, T cell activation state, effector function, cytokine
response,
trafficking, persistence or exhaustion.
177. The method of any of embodiments 174-176, wherein the one or more genomic
regions comprise one or more genomic loci associated with or indicative of the
effector-like
function or activation state of the cell.
175
CA 03049461 2019-07-04
WO 2018/132518 PCT/US2018/013227
178. The method of any of any of embodiments 174-177, wherein the one or more
genomic regions comprises a genetic locus selected from the group consisting
of Nr4a1, Cblb,
Irf4, Tbx21, Eomes, Ifng, Il2ra, 112, Csf2, Gzmb, Tnfsf10, Gata3, Mir155,
Sox21, Ctla4, Lag3,
and Pdcdl.
179. The method of any of embodiments 174-178, wherein the one or more genomic
regions comprises a genomic locus selected from the group consisting of Ctla4,
Il2ra, 112, Ifng
and Gzmb.
180. The method of any of embodiments 89-180, wherein:
the epigenetic property of from or from about 2 to 50, 2 to 20, 2 to 10, 2 to
5, 5 to 50, 5
to 20, 5 to 10, 10 to 50, 10 to 20 or 20 to 50 genomic regions are analyzed;
or
the epigenetic property of at least 2, 3, 5, 6, 7, 8, 9, 10, 15, 20, 30, 40,
50, 60, 70, 80. 90.
100, 200, 300, 400, 500 or more genomic regions are analyzed; or
the epigenetic property of only one genomic region is analyzed.
181. The method of any of embodiments 89-180, wherein a panel comprising two
or
more of the genomic regions are identified.
182. A method of assessing transgene integration, the method comprising:
determining an epigenetic property of one or more genomic regions comprising a
nucleic acid
sequence of a transgene, in a cell or a cell composition genetically
engineered with a
recombinant receptor.
183. The method of embodiment 182, wherein the genetic engineering is carried
out
by introduction, into one or more cells of a cell composition, of a nucleic
acid encoding the
recombinant receptor.
184. The method of embodiment 183, wherein the introduction is by transduction
with
a viral vector comprising the nucleic acid.
185. The method of any of embodiments 182-184, wherein the epigenetic property
is
chromatin accessibility.
186. The method of any of embodiments 182-185, wherein:
the epigenetic property comprises chromatin accessibility, a level or degree
of chromatin
accessibility, a relative level or degree of chromatin accessibility, and/or
the epigenetic property comprises a degree or level of, relative degree or
level of, or
profile or map of, chromatin accessibility of the genomic region.
187. The method of any of embodiments 182-186, wherein chromatin accessibility
is
determined by Assay for Transposase Accessible Chromatin with high-throughput
sequencing
176
CA 03049461 2019-07-04
WO 2018/132518 PCT/US2018/013227
(ATAC-seq) or chromatin immunoprecipitation coupled to high-throughput
sequencing (ChIP-
seq).
188. The method of any of embodiments 182-187, wherein chromatin accessibility
is
determined by ATAC-seq.
189. The method of any of embodiments 188, wherein the assessing the
epigenetic
property comprises:
(1) isolating chromatin from the cells or the population of cells,
(2) treating the chromatin with an insertional enzyme complex to generate
tagged
fragments of genomic DNA,
(3) sequencing all or a portion of the tagged fragments to produce a plurality
of sequence
reads;
(4) aligning, filtering and mapping the sequence reads to genomic regions of a
genome;
and
(5) determining or identifying peaks of sequence reads in a plurality of
genomic regions
for each cell or population of cells.
190. The method of embodiment 189, wherein the analyzing or assessing the
epigenetic property further comprises determining the peaks of sequence reads
that maps to or is
corresponds to the nucleic acid sequence of the transgene
191. The method of any of embodiments 182-190, wherein peaks of sequence reads
comprise sequence reads having a peak signal, level or value that is enriched,
is above
background, and/or is higher compared to sequence reads of a surrounding
regions.
192. The method of any of embodiments 182-191, wherein analyzing the
epigenetic
property comprises generating an epigenetic map showing a profile of sequence
reads associated
with or indicative of the epigenetic property, optionally sequence reads
associated with or
indicative of chromatin accessibility, of the genomic region comprising the
nucleic acid
sequence of the transgene and/or
comprises, for the genomic region comprising the nucleic acid sequence of the
transgene
along the length of the genomic region, generating one or more sequence reads
indicative of an
epigenetic readout, optionally chromatin accessibility, at said region,
wherein the quantity of
said one or more sequence reads indicates a degree or level of said epigenetic
property,
optionally said chromatin accessibility, at said region.
177
CA 03049461 2019-07-04
WO 2018/132518 PCT/US2018/013227
193. The method of any of embodiments 182-192, wherein determining the
epigenetic
property comprises determining, measuring or quantitating a value or level of
chromatin
accessibility across the genomic region comprising the nucleic acid sequence
of the transgene.
194. The method of any of embodiments 182-193, wherein determining the
epigenetic
property comprises determining, measuring or quantitating a value or level
associated with or
indicative of the epigenetic property, optionally chromatin accessibility,
across the genomic
region comprising the nucleic acid sequence of the transgene.
195. The method of any of embodiments 89-194, wherein the cell composition,
optionally the first composition of cells and/or second composition of cells,
comprise primary
cells obtained from a sample from a subject and/or selected or isolated from a
subject.
196. The method of any of embodiments 89-195, wherein the cell is an immune
cell.
197. The method of any of embodiments 89-196, wherein the immune cell is a T
cell
or an NK cell.
198. The method of any of embodiments 89-197, wherein the T cells is a CD4+
and/or
CD8+ T cells.
199. The method of any of embodiments 89-198, wherein:
the recombinant receptor binds to, recognizes or targets an antigen associated
with the
disease or condition; and/or the recombinant receptor is a T cell receptor or
a functional non-T
cell receptor; and/or
the recombinant receptor is a chimeric antigen receptor (CAR).
200. The method of embodiment199, wherein:
the CAR comprises an extracellular antigen-recognition domain that
specifically binds to
the antigen and an intracellular signaling domain comprising an ITAM, wherein
optionally, the
intracellular signaling domain comprises an intracellular domain of a CD3-zeta
(CD3) chain;
and/or wherein the CAR further comprises a costimulatory signaling region,
which optionally
comprises a signaling domain of CD28 or 4-1BB.
IX. EXAMPLES
[0584] The following examples are included for illustrative purposes only and
are not
intended to limit the scope of the invention.
178
CA 03049461 2019-07-04
WO 2018/132518 PCT/US2018/013227
Example 1: Sample Preparation and Analysis of CAR T cell Chromatin
Accessibility by
ATAC-seq
[0585] Compositions of CD4+/CD8+ T cells genetically engineered with a
chimeric antigen
receptor were assessed for chromatin accessibility using assay for transposase-
accessible
chromatin using sequencing (ATAC-Seq).
[0586] CD4+ and/or CD8+ T cells were isolated by immunoaffinity-based
enrichment from
leukapheresis of human Peripheral Blood Mononuclear Cells (PBMC). The isolated
CD4+/CD8+T cells were activated and transduced with a viral vector encoding an
anti-CD19
CAR. The viral vector construct further encoded a truncated EGFR (EGFRt),
which served as a
surrogate marker for CAR expression; the EGFRt-coding region was separated
from the CAR
sequence by a T2A skip sequence. After transduction, cells were expanded in
culture and frozen
by cryopreservation. A total of 43 cryopreserved engineered cell compositions
(CDP) from 19
subjects were prepared. CD4+/CD8+ cell compositions matched to 18 of the
subjects, but which
were not subjected to the genetic engineering, also were cryopreserved (CMAT)
and assessed. In
some cases, CMAT samples were separated by phenotype as naïve T cells (TN),
central memory
T cells (Tcm), effector and effector memory T cells (TE Em) or effector memory
RA (TEmRA) for
analysis. To generate libraries for ATAC-Seq analysis, cells were thawed,
washed and lysed.
DNA was then fragmented and tagged ("tagmented") using an enzyme (Tn5
transposase) which
mediates both the fragmentation of double- stranded DNA and ligates synthetic
oligonucleotides
to the DNA fragments. The samples were then cleaned using a column followed by
five cycles
of PCR amplification and column purification. qPCR amplification was performed
on samples
and normal amplification was observed on all samples, indicative of
successfully tagmented
DNA. Successful library generation was qualitatively determined based on
nucleosome
banding. Agilent D1000 electrophoresis profiles were run on size-selected DNA
for library size
distribution which was used as a correction factor for quantification. Size
selection removed
residual primers and primer-dimers that may interfere with sequencing. qPCR
dilutions were
then made and libraries were pooled for sequencing. After sequencing, the DNA
was aligned to
a reference genome (Langmead et al. Genome Biol. (2009) 10:R25). Sequence data
were
analyzed for quality using various sequencing metrics, including metrics for
total mapped reads,
% alignment to genome, non-redundant fractions (redundancy), mitochondrial DNA
contamination, effective sequence depth, as well as genome-wide accessibility
peaks and
fragments of reads in peaks (FRiP). It was observed that on average across
libraries generated
using the methods described above, >97% of reads aligned to the reference
genome.
179
CA 03049461 2019-07-04
WO 2018/132518 PCT/US2018/013227
[0587] Additional processing steps to ensure quality of the data was performed
including
filtering out reads that failed quality checks, removing duplicates, and
fixing read mates.
Nucleosome positioning, transposon insertion sites, and transcription factor
occupancy were
identified and the data was visualized using a genome browser (U.S. Patent
Application
Publication Number US 20160060691).
[0588] Peak calling was performed to identify sequence reads with accessible
chromatin.
To quantify chromatin accessibility, in some studies Fragments Per Kilobase
per Million
fragments mapped (FPKM) was determined within each gene body and in others
peak
accessibility was calculated based on FRiP-normalized sequencing tag counts
with DESeq2
software. In all cases common and unique peaks were identified by interval
analysis, then
quantification and/or differential accessibility was performed by downstream
interrogation of
gene body FPKM values or FRIP-normalized peak counts. These count metrics were
used for
direct correlation with other assays, input into gene module analysis or
interrogated for
differences between various groups of interest.Including subsequent studies,
approximately 450
ATAC-seq libraries have been sequenced.
Example 2: Assessment of Markers of T cells by Flow Cytometry and ATAC-seq
[0589] ATAC-Seq was used to assess the chromatin accessibility of genes
associated with T
cell activation state or response in a cell composition containing genetically
engineered cells and
was compared to protein expression of the same genes by intracellular cytokine
staining (ICS; in
some cases referred to as intracellular flow cytometry). Genetically
engineered human T cells
expressing anti-CD19 CARs, produced as described in Example 1, were thawed.
For
assessment of protein markers by flow cytometry, cells were re-stimulated in
culture with
phorbol myristate acetate (PMA)/Ionomycin in the presence of Golgi inhibitor,
and assessed by
flow cytometry. For measuring chromatin accessibility of the genes, the
genetically engineered
cells, without further re-stimulation, were assessed by ATAC-seq as outlined
in Example 1.
[0590] Table El provides the p value for correlation of each marker as
determined using
multivariate correlations. FIGS. lA and IB show a representative correlation
of interferon-
gamma (IFNy) and programmed cell death protein 1 (PD-1) production,
respectively, as
measured by ICS (shown on the x-axis) versus accessibility at the gene
encoding each protein
(1fng and Pdcdl, respectively) as determined by ATAC-seq (shown on the y-
axis). As shown in
Table 1, there was not a statistically significant correlation between the
extent of chromatin
180
CA 03049461 2019-07-04
WO 2018/132518 PCT/US2018/013227
accessibility and protein expression of many of the assessed T cell markers,
although expression
of certain cytokine markers did exhibit a significant correlation to chromatin
accessibility.
Table El. ATAC-seq vs ICS
initial
multivariate correlations
Cytokine P value
IFN-g p<0.0001
IL-13 p=0.0002
PD-1 p=0.018
Tbet p=0.05
CD25 p=0.106
IL-2 p=0.104
Lag3 p=0.171
KI-67 p=0.123
TNF p=0.249
Annexin V p=0.342
Foxp3 p=0.491
[0591] In another study, ATAC-seq was performed generally as described above
to assess
chromatin accessibility at the gene encoding IFNy and IL-2 (1fng and 112,
respectively).
Production of IFNy and IL-2 were assessed by ICS following a 6-hour re-
stimulation with
phorbol myristate acetate (PMA)/Ionomycin. As shown in FIG. 1C, chromatin
accessibility at
the gene encoding IFNy correlated with the production of IFNy as measured by
ICS, with an R2
value of 0.579, Spearman's rank correlation (p) of 0.7536, and a prob > Ipl of
0.0012. As shown
in FIG. 1D, chromatin accessibility at the gene encoding IL-2 correlated with
production of IL-
2, with an R2 value of 0.229, Spearman's rank correlation (p) of 0.5679, and a
prob > Ipl of
0.0272.
[0592] The results in Table El and FIGS. 1A-1D are consistent with the finding
that in
some cases, accessibility of chromatin for a given gene can be predictive of
and/or correlate with
the expression of the gene or other outcomes following activation of the
cells.
[0593] ICS and ATAC-seq were used to assess immunophenotype (protein
expression or
chromatin accessibility, respectively) of exemplary T cell markers in CD4+
cells or CD8+ cells
obtained from a CDP sample containing engineered T cells that had been
administered to an
autologous subject for treating a B cell malignancy using the methods
described above. The
results of the ICS and ATAC-seq were independently further correlated with the
response
outcome of the subject to treatment with the autologous engineered cells
(complete response
(CR), progressive disease (PD), or partial response (PR)). The level of
cytokine accessibility for
181
CA 03049461 2019-07-04
WO 2018/132518 PCT/US2018/013227
the representative genes or the level of protein expression by ICS was
determined and displayed
in a hierarchial cluster and annotated by the response outcome. As a control,
the levels of T cell
markers in normal donor (ND) cells also were assessed by ICS and ATAC-Seq.
FIG. 2 shows
the response clustering on immunophenotyping data of CD4+ CDP samples and CD8+
CDP
samples. As shown in FIG. 2, cytokine production as measured by ATAC-seq in
CD8+ CDP
samples was correlated to response outcome. No correlation to response outcome
was observed
by ICS.
Example 3: Whole Genome Assessment of Chromatin Accessibility by ATAC-seq
[0594] Whole genome analysis using ATAC-seq was performed on a thawed CD8+
cells
from a CDP containing genetically engineered human T cells expressing anti-
CD19 CARs
produced as described above in Example 1. The results of the ATAC-seq were
independently
further correlated with the response outcome of the subjects to treatment with
the autologous
engineered cells based on whether the treatment resulted in complete response
(CR), progressive
disease (PD) or a partial response (PR). The asterisk indicates a subject who
converted from CR
to PD at three months after initiation of the dose of cells. Whole genome
analysis of normal
donor (ND) CD8+ cells also was assessed by ATAC-seq. Hierarchial clustering
was performed
based on differences in chromatin accessibility for each gene, as calculated
by the sum of FPKM
over the gene body of each gene, which was scaled low (blue) to high (red) for
each gene.
[0595] A representative whole genome analysis of chromatin accessibility for a
plurality of
genes in cells from a CDP from each of 9 subjects that had been administered
the autologous
CDP is shown in FIG. 3A. FIG. 3B shows a clustering decision tree
(constellation plot)
showing CD8+ CDP clustering observed on ATAC-seq data by response groups (the
CR patient
that clustered with the PR and PD samples converted to a PD at 3 months.)
[0596] A select subset of targeted panel of genes from above was further
analyzed and
represented in FIG. 4A as a hierarchial cluster and FIG. 4B as a constellation
plot. Similar to
above, CD8+ CDP clustering for the specific genes indicated was observed on
ATAC-seq data
by response groups.
Example 4: Assessment of Chromatin Accessibility in CD8+ CAR T cells by A TAC-
seq
[0597] Cyropreserved CMAT samples, containing T cells obtained from subjects
but not
engineered with an anti-CD19 CAR, were separated based on phenotype into naïve
T cells (TN),
182
CA 03049461 2019-07-04
WO 2018/132518 PCT/US2018/013227
central memory T cells (Tcm), effector cells and effector memory T cells (TE
Em) or effector
memory RA (TEmRA). Cells from each subset were assessed for chromatin
accessibility of each
of six panel of genes that represented selected gene subsets from memory CD8+
T cell modules
identified by the Immgen Consortium (Best et al., Nature Immunology (2013)
14:404-412).
Hierarchial clustering was performed based on differences in chromatin
accessibility for each
gene, as calculated by the sum of FPKM over the gene body of each gene, which
was scaled low
(blue) to high (red) for each gene. The signature profile of chromatin
accessibility for each gene
panel for the assessed cell types is shown in FIG. 5A. The results
demonstrated that chromatin
accessibility of these panels of gene subsets are indicative of the phenotypic
effector-like state of
the cells.
[0598] The same gene panels were used to assess chromatin accessibility in
thawed CD8+
cells from a CDP containing genetically engineered human T cells expressing
anti-CD19 CARs
produced as described above in Example 1. Normal donor (ND) CD8+ cells also
were assessed
by ATAC-seq. The results of the ATAC-seq were independently further correlated
with the
response outcome of the subjects to treatment with the autologous engineered
cells based on
whether the treatment resulted in complete remission (CR), progressive disease
(PD) or a partial
response (PR). As shown in FIG. 5B, CD8+ CDP from subjects who showed evidence
of PR
and PD appear to have more of an effector-like phenotype, as determined by
chromatin
accessibility of genes associated with an effector-like phenotype, compared to
subjects who
showed evidence of CR or ND.
Example 5: Assessment of CD8+ Chromatin Accessibility by ATAC-seq at Selected
Loci
[0599] Thawed CD8+ cells from a CDP containing genetically engineered human T
cells
expressing anti-CD19 CARs produced as described above in Example 1, were
further analyzed
for chromatin accessibility, as calculated by the sum of FPKM over the gene
body of each gene,
at loci associated with strength of signal and effector function of T cells.
The results of the
ATAC-seq were independently further correlated with the response outcome of
the subjects to
treatment with the autologous engineered cells based on whether the treatment
resulted in
complete response (CR), progressive disease (PD) or a partial response (PR).
Normal donor
(ND) CD8+ cells also were assessed by ATAC-seq.
[0600] As shown in FIGS. 6A and 6B, higher fpkm levels of chromatin
accessibility of all
tested genes, except pdcdl, correlated to developing a partial response or
progressive disease.
Lower fpkm levels of chromatin accessibility of pdcdl gene loci correlated to
developing a
183
CA 03049461 2019-07-04
WO 2018/132518 PCT/US2018/013227
partial response or progressive disease. Housekeeping genes Actb and Gapdh,
which track with
activation state of T cells, were increased in PR and PD, indicating that
cells from CDP samples
administered to subjects that went on to develop PR or PD may be in a more
activated state.
These results demonstrated that these genes or panels of genes may be
epigenetic markers for
predicting response outcome to treatment with a cell therapy.
Example 6: Gene Expression and Chromatin Accessibility Analysis in CAR T Cells
in the
Presence or Absence of Lenalidomide
[0601] Gene expression and chromatin accessibility was assessed in CAR T cells
upon
stimulation, in the presence or absence of lenalidomide.
[0602] Anti-BCMA CAR-expressing T cells, generated from four (4) different
independent
donors, were stimulated with 50 i.t.g/mL BCMA-conjugated beads for 24 hours
(24 hr + stim) or
7 days (d7 + stim), or cultured without stimulation for 24 hours (24 hr), in
the presence or
absence of lenalidomide. The CAR-expressing cells were assessed by RNA
sequencing (RNA-
seq) for gene expression and assayed for transposase-accessible chromatin
using sequencing
(ATAC-seq) for chromatin accessibility analysis.
[0603] RNA-seq was performed on the complementary DNA (cDNA) samples prepared
from the RNA isolated from the cultured anti-BCMA CAR-expressing cells. ATAC-
seq was
performed generally as described in Buenrostro et al., Nat Methods. (2013)
10(12): 1213-1218.
ATAC-seq accessibility peaks were called using MACS2 (q<0.01) and a consensus
set was
generated from overlapping peaks present in 2 or more samples, using DiffBind.
[0604] Principal component analysis (PCA) was performed for the RNA-seq and
ATAC-seq
data sets, generated from DESeq2-normalized counts. Differential expression
(DE, for RNA-
seq) or consensus peak accessibility (DA, for ATAC-seq) were calculated,
modeling donor
effects (Donors 1-4) and treatment effects (lenalidomide vs. vehicle) at 24
hours and day 7.
Differential locus selection cut off was q<0.05 and 1og2 fold change > 0.5 for
RNA-seq or q<0.1
for ATAC-seq. Gene ontology (GO) enrichment analysis was performed and
activation z-score
was determined on the subset of genes differentially expressed at q<0.1 using
Ingenuity Pathway
Analysis software (Qiagen, Inc.), accounting for donor effects within each
treatment condition.
A motif enrichment analysis was performed for peaks that were shown to be more
accessible in
the presence of lenalidomide, with HOMER software, using the consensus peakset
as
background, for the day 7 stimulation (d7 + stim) ATAC-seq data.
184
CA 03049461 2019-07-04
WO 2018/132518 PCT/US2018/013227
[0605] Results of PCA, representing the overall diversity across gene
expression or
chromatin accessibility on the genome, are shown in FIG. 7A (gene expression;
based on RNA-
seq results) and FIG. 7B (chromatin accessibility; based on ATAC-seq results).
Ellipses were
drawn to indicate the groups as it was observed that the major factors that
contributed to the
variation in gene expression or chromatin accessibility were culture time and
presence of
stimulation. Cells cultured in the presence of lenalidomide (circles)
exhibited different overall
gene expression and chromatin accessibility compared to cells cultured in the
absence of
lenalidomide (triangles, vehicle), showing a lenalidomide treatment effect in
each donor and
culture condition. For lenalidomide treatment, the general direction of change
(shown by dotted
line between triangle and circle) was similar in each donor, and the degree of
change was
generally greater in cells cultured for 7 days with stimulation, compared to
the change in cells
cultured for 24 hours, with or without stimulation.
[0606] FIGS. 8A-8D show changes in gene expression (FIGS. 8A and 8B, following
24
hour and 7 day cultures with stimulation, respectively) or chromatin
accessibility (FIGS. 8C and
8D, following 24 hour and 7 day cultures with stimulation, respectively) in
the presence of
lenalidomide. As shown, the effect of lenalidomide on gene expression and
chromatin
accessibility was greater in the 7 day cultures, compared to the 24 hour
cultures. Following 7
days of culture in the presence of lenalidomide, a total of 583 genes were
altered as shown by
gene expression changes (FIG. 8B), whereas chromatin accessibility at 2804
peaks changed
(FIG. 8D). These results indicated that lenalidomide treatment altered both
the transcriptional
and epigenetic profile of CAR-T cells.
[0607] Biological signaling pathways that were enriched differentially
expressed genes
(FIGS. 9A and 9B) were identified. Directionality and significance of the
effects on biological
pathways are shown at 24 hours (FIG. 9A) or 7 days (FIG. 9B). The results
showed that the
presence of lenalidomide resulted in increased expression of genes involved in
T cell activation
and signaling. Results showed that pathways differentially regulated in the
presence and
absence of lenalidomide showed an enrichment of immune synapse-associated
genes, genes
involved in cytokine signaling and genes involved in T cell activation
pathways
[0608] For a selected subset of genes, including genes involved in T cell
activation and
signaling, the gene expression and chromatin accessibility changes in the
presence of
lenalidomide were compared, for the cells cultured for 7 days with
stimulation. FIG. 10 shows
individual chromatin accessibility peaks (diamond) and the mean chromatin
accessibility change
185
CA 03049461 2019-07-04
WO 2018/132518 PCT/US2018/013227
for each gene (circle) plotted against the corresponding gene expression
changes measured by
RNA-seq showing concordance of signal between the two methods.
[0609] Results of the motif enrichment analysis for peaks with increased
accessibility in the
presence of lenalidomide in day 7 cultures are shown in FIG. 11. Motifs
predicted to bind
various transcription factors, understood to be involved in T cell activation
and signaling, were
enriched in peaks with increased accessibility in the presence of
lenalidomide.
[0610] The results were consistent with an increase in functional activity in
the CAR-
expressing T cells in the presence of lenalidomide.
Example 7: Chromatin Accessibility Profile Analysisin Cells at Different
Stages of Cell
Engineering
[0611] Chromatin accessibility at or near exemplary immune genes (e.g.
cytokines,
chemokines, cell surface markers) was assessed and compared among samples from
cell
compositions prior to, and after, genetic engineering with the exemplary anti-
CD19 CAR
described in Example 1. Samples were thawed from cryopreserved CD4+ or CD8+
engineered
cell compositions (CDP) or matched samples that had not been subjected to
engineering
(CMAT). In some cases, CMAT samples were separated by phenotype as naïve T
cells (TN),
central memory T cells (Tcm), effector and effector memory T cells (TE Em) or
effector memory
RA (TEmRA) for analysis. Libraries were generated substantially as described
in Example 1.
[0612] ATAC-seq reads were aligned and mapped back to a reference genome to
determine
their position, such as by using bowtie (Langmead et al., (2009) Genome
Biology 10:R25.1-
R25.10) or bowtie2 and analyzed. Additional processing steps was performed
including
removing duplicates, filtering out mitochondrial DNA, shifting position of
mapped fragments to
account for 4 or 5-basepair insertion by the Tn5 transposase during the ATAC-
seq library
preparation, and filtering out fragments larger than 100 base pairs (bp)
which, in some cases, can
represent nucleosome-bound chromatin rather than nucleosome-free chromatin.
Nucleosome
positioning (e.g. using NucleoATAC), transposon insertion sites, and
transcription factor
occupancy were also assessed. Identification of accessibility peaks, including
genomic regions
that were enriched for or depleted of accessibility and/or occupancy signal as
measured by
quantifying ATAC-seq fragments, was performed using MACS2.
[0613] Exemplary profiles for cell surface marker genes are shown in FIGS. 12A
and 12B.
As shown, chromatin accessibility peaks correlated with expression of specific
surface markers
(e.g., accessibility peaks were present at or around the genes encoding CD3E,
CD8a and CD8b
186
CA 03049461 2019-07-04
WO 2018/132518 PCT/US2018/013227
in CD8+ cells and accessibility peaks were present at or around the gene
encoding CD3E and
CD4 in CD4+ cells). Some differences in chromatin accessibility peaks at or
near other immune
genes in matched CDP and CMAT cell samples were observed, consistent with
changes in state
and/or phenotype of the cells during manufacturing.
Example 8: Genomic Interval Analysis of Peak Profiles in Sub-Populations of
Cells
[0614] CD8+ CDP cells and CD8+ CMAT cells from an identical donor, as
described in
Example 1, were separated into subpopulations based on surface marker
expression and
phenotype as follows: CD27+CCR7+, CD27+CCR7-, CD27-CCR7-, naïve T cells (TN),
central
memory T cells (Tcm), effector cells and effector memory T cells (TE Em) and
effector memory
RA (TEmRA). ATAC-seq was performed on the sub-populations, generally as
described in
Example 7. Accessibility peaks were determined and were subjected to genomic
interval
analysis by assessing common or overlapping peaks and unique peaks between and
among the
subpopulation of cells.
[0615] Analysis of common and unique peaks among different subpopulations of
the CDP
and CMAT samples showed that the CDP samples contained many more unique
accessibility
peaks, indicating an increase in chromatin accessibility in the CDP samples,
which have been
subjected to stimulation and genetic engineering. The majority of the CMAT
accessibility peaks
were in common with the CDP sample peaks. The accessibility profile of the
CD27+ CCR7+
CMAT sample showed substantial overlap with the accessibility profile of TN,
Tcm, TE Em and
TEmRA samples, whereas the CD27+ CCR7+ CDP contained more unique accessibility
peaks.
[0616] The peak profile in the coding region and the intergenic region near
the CCR7 gene
was compared in CD27+CCR7+, CD27+CCR7- and CD27-CCR7- cells, and bulk CD8+
cells.
As shown in FIG. 13A, CCR7+ cells showed a similar peak profile over the
coding region of the
CCR7 gene as CCR7- cells, but a peak was observed in an intergenic region
upstream of the
coding region in CCR7+ cells, indicative of an upstream enhancer site that
associates with the
expression of CCR7 in the cell.
[0617] The overall peak profiles of CD27+CCR7+ CDP cells, CD27+CCR7- CDP cells
and
CD27-CCR7- CDP cells were subject to gene accessibility analysis. The largest
number of
unique peaks was observed for the CD27+CCR7+ CDP populations. FIG. 13B shows
the
distribution of accessibility peaks within various genomic locations for the
cell populations,
including within intergenic, intron and promoter regions of genes.
187
CA 03049461 2019-07-04
WO 2018/132518 PCT/US2018/013227
[0618] These results are consistent with a conclusion that accessibility
around the coding
region of a gene, and not just within a gene coding sequence, can provide
information about a
cell state.
Example 9: Genomic Accessibility and Peak Profile and Response Outcome in
Subjects
Administered Engineered T Cells
[0619] The relationship between genomic accessibility and peak profiles in CDP
cell
compositions and response outcomes in subjects that have been administered
engineered T cell
was assessed. CD4+ and CD8+ CDP cell accessibility peak profile was determined
by ATAC-
seq for subjects that had been administered the autologous engineered cell
compositions,
generally as described in Examples 1 and 3 above.
[0620] The overall number of genomic accessibility peaks and nucleosome free
regions in
CD4+ and CD8+ CDP cells and response outcomes (1 month CR, 3 month CR, 1 month
PD, 3
month PD, or PR) was assessed. The ATAC-seq accessibility peaks were called
using MACS2
and the nucleosome free regions were determined using NucleoATAC, described in
Example 7.
As shown in FIG. 14A, in CD8+ CDP cells, the number of overall genomic
accessibility peaks
and nucleosome-free regions was observed to be higher, indicating greater
genome-wide
accessibility, in subjects that exhibited PD or PR, compared to in subjects
who exhibited 3
month CR. Measuring peak nucleosome free regions yielded similar results to
analysis
measuring chromatin accessibility peaks. Exemplary differential accessibility
peak profiles,
showing accessibility peaks that are different among samples, at the genomic
regions near two
exemplary immune-related genes (gene 1 and gene 2) in subjects with different
response
outcome are shown in FIGS. 14B-14D. As shown, accessibility near the exemplary
gene loci
were higher in subjects that exhibited a PD at 3 months, compared to subjects
that exhibited a
CR at 3 months.
Example 10: Assessment of Integration of Chimeric Antigen Receptor-encoding
Vector
[0621] ATAC-seq was used to assess various parameters related to integration
of a viral
vector encoding a chimeric antigen receptor (CAR) in engineered cells.
[0622] ATAC-seq was performed generally as described in Examples 1 and 7 on a
CDP cell
composition that was engineered to express an anti-CD19 CAR by transduction
with a viral
vector encoding the anti-CD19 CAR (CAR integrants). CMAT cell compositions and
cells
transduced with an empty viral vector (empty integrants) were used as
controls. The sequences
188
CA 03049461 2019-07-04
WO 2018/132518 PCT/US2018/013227
from the ATAC-seq reads were aligned with the nucleic acid sequences encoding
the CAR by
treating the construct as an artificial chromosome during the alignment steps.
Scaled number of
integrants (ATAC-seq CAR integrants) was calculated as (aligned reads x read
length) /
(construct size)). A receiver operating characteristic (ROC) curve was
generated by plotting the
true positive rate against the false positive rate, and the area under the
curve (AUC) was
determined.
[0623] As shown in FIGS. 15A and 15B, the analysis indicated the CAR-encoding
nucleic
acid sequence was integrated only in the engineered CDP cells and not in the
CMAT cells, and
were integrated into accessible regions in the genome, as indicated by ATACseq
signal. The
AUC (95% confidence interval) of the CAR integrants was 1, with CI low
binomial of 0.61847
and CI high binomial of 0.6397; the AUC of the empty integrants was 0.9766,
with CI low
binomial of 0.056865 and CI high binomial of 0.63939). The results are
consistent with the
utility of the ATAC-seq methods to assess integration of recombinant vectors,
e.g., viral vectors,
such as CAR-encoding vectors, into the genome of engineered cells.
[0624] In another study, the number of integrants as determined using ATAC-seq
and vector
copy number (VCN) as determined by quantitative polymerase chain reaction
(qPCR) were
compared, in CMAT and in anti-CD19 CAR T cell CDP compositions. As shown in
FIG. 16A,
ATAC-seq reads mapped to the CAR-encoding sequences in the CDP cells but not
in the CMAT
cells. The correlation between the scaled number of integrants as determined
by ATAC-seq and
VCN as determined by qPCR are shown in FIG. 16B (Nonparametric Spearman's p:
0.3121,
probability > !pi: 0.2073).
[0625] Integrants by ATAC-seq and VCN also was assessed in anti-CD19 CAR+ CD4+
and
CD8+ T cells from subjects that had been administered the autologous anti-CD19
CAR+ CDP
engineered cell compositions. As shown in FIGS. 17A and 17B (excludes normal
donor
samples), higher integrant number was observed in CD8+ CDP cells from subjects
who
achieved PD or PR, consistent with the observation that expression of the CAR
construct in
certain individuals may differ depending on chromatin accessibility, even when
total VCN may
be similar.
[0626] Unique integration sites were assessed by mapping discordant read pairs
across
50,000 cells of unknown clonality, in CD4+ and CD8+ CDP cells from subjects
that achieved
different response outcomes (1 month CR, 3 month CR, 1 month PD, 3 month PD,
or PR). The
results are shown in FIG. 18. The results are consistent with an observation
that in different
subjects with relatively similar VCN, expression of the CAR construct may vary
due to the
189
CA 03049461 2019-07-04
WO 2018/132518 PCT/US2018/013227
epigenetic state and health of the cell, resulting in different response or
durable response
outcomes.
Example 11: Accessibility at T Cell Receptor (TCR) Loci
[0627] The chromatin accessibility peak profile was assessed across the loci
encoding T cell
receptor (TCR) chains in different anti-CD19 CAR+ T cell CDP T cell
compositions and CMAT
T cell compositions, or in CD8+ anti-CD19 CAR+ T cells from subjects having
received
administration of anti-CD19 CAR+ T cells.
[0628] As shown in FIG. 19A, the accessibility peaks over the TCR beta chain-
encoding
loci were observed to be different in CD8+ CMAT samples from 7 exemplary
subjects. The
overall TCR accessibility and % coefficient of variation (CV) in the CD8+ CDP
samples in ND
or subjects who achieved CR or PD are shown in FIG. 19B. As shown in FIG. 19C,
subjects
that achieved different response outcome showed varying relative TCR
accessibility across the
TCR loci, with samples from subjects with PR or PD being more oligoclonal The
results are
consistent with the utility of ATAC-seq analysis to assess the differences in
accessibility at
regions of the TCR loci, and to generally assess clonality of T cells within a
composition of
cells.
Example 12: Chromatin Accessibility Profile and Additional Analysis in Cells
from
Different Donors at Different Stages of Cell Engineering
[0629] Compositions of CD4+/CD8+ T cells from three different healthy donors,
prior to
and after genetic engineering with different chimeric antigen receptors, were
assessed for
chromatin accessibility using ATAC-seq, together with additional downstream
analyses
including principal component analysis (PCA), differential accessibility
analysis, biological
pathway analysis and analysis at selected subset of genes.
[0630] CD4+ and/or CD8+ T cells were isolated from three (3) healthy donors
(Donors 1, 2
and 3) by immunoaffinity-based enrichment from leukapheresis of PBMCs and
cryopreserved
(CMAT, prior to engineering). The isolated CD4+/CD8+T cells were activated for
24 hours and
transduced with a viral vector, encoding one of two different anti-CD19 CARs
or an anti-BCMA
CAR, or mock transduction as controls, and cryopreserved (CDP, cryopreserved
engineered cell
compositions). The cells were subject to ATAC-seq analysis, generally as
described in Example
1 above.
190
CA 03049461 2019-07-04
WO 2018/132518 PCT/US2018/013227
[0631] The obtained sequences were mapped and ATAC-seq accessibility peaks
were called
using MACS2. Raw sequencing counts were processed with the DESeq2 package to
estimate
sizing factors, dispersion estimates and perform a negative binomial
generalized linear model fit.
Fraction of reads in peaks (FRiP; showing enrichment of signal, calculated as
(number of reads
in peaks)/(number of total reads))-normalized counts were extracted with a
betaPrior set to True.
After raw data were demultiplexed, aligned and filtered to quality
specifications as above they
were imported into and the following analysis steps were done in R. Peaks were
annotated with
the ChIPpeakAnno package or Homer software. Transcription star site (TSS)
region was defined
as proximal 2000 bp upstream and 500 bp downstream of promoter. Peak overlaps
and
consensus peaks for group analysis was performed with DiffBind package. After
overlaps were
calculated, peaks found in more than two libraries were filtered and
sequencing counts extracted.
The obtained sequences and peaks were analyzed using various sequencing
quality control
metrics, including unmapped, unpaired and duplicate reads, fraction of
mitochondrial DNA,
sequence depth, reads mapping to the CAR-encoding constructs, number of MACS2
peaks with
a false discovery rate (FDR) of 0.1 or less, FRiP and number of unique peaks,
to ensure
consistency and fidelity of the data.
[0632] Clustering analysis was performed based on overall epigenetic profiles
of various
samples. The results showed that samples tended to cluster first based on type
of sample, e.g.
CMAT or CDP, then based on donor, and, for CDP, last based on type of
construct.
[0633] Principal component analysis (PCA) was performed for dimensionality
reduction to
examine overall variance in the data and parse out key drivers on consensus
peaks, e.g., peaks
present in 2 or more samples, on CMAT and various CDP samples from the
different donors
(PC1, contributing to 33.996% of variation; associated with the difference
between CDP and
CMAT; PC2, contributing to 10.13% of variation; associated with T cell
states). 31 principal
components were calculated during this step. The results showed a pattern of
three different
CMATs, from different donors, resulting in three different CDPs after
engineering, consistent
with the clustering data described above. The various different CAR constructs
used for
engineering resulted in similar profiles on the PCA analysis.
[0634] Differential accessibility analysis was performed, using models built
with DESeq2
package. Differential results were extracted and significance peaks were
assigned as those
passing a false discovery rate (FDR, or q) of 0.1. Results from an exemplary
differential
accessibility analysis, for CDP and CMAT from all donors, is shown in FIG.
20A. Biological
pathway analysis using differential peaks was performed, based on Gene Set
Enrichment
191
CA 03049461 2019-07-04
WO 2018/132518 PCT/US2018/013227
Analysis (GSEA) using the Ingenuity Canonical Pathway, Biofunctions and
Predicted Upstream
Regulators analyses. The results showed enrichment of differential peaks in
various pathways
involved in T cell response, signaling pathways related to immune cell
activity and/or function,
biofunctions related to immune cells and predicted upstream regulators of
genes related to
immune function.
[0635] Gene module analysis was performed, using the following selected module
of genes:
genes in the "T cell module" (Chaussabel et al., (2008), Immunity 29(1): 150-
164); genes in the
"cytokines" module (Immgen Consortium (Best et al., Nature Immunology (2013)
14:404-
412)); genes in the Thl.cells module, CD8po5.TEm module and CD4po5.TEm module
(xCell
(Aran et al. Genome Biology (2017) 18:220; http://xcell.ucsf.edu/)); "memory"
module (Weng
et al., (2012) Nat Rev Immunol. 12(4):306-15)), "trafficking" module including
chemokine
receptor genes and "exhaustion" module (Martinez et al., (2015) Immunity
42(2):265-278).
FRiP-normalized or FPKM counts were used for the gene module analysis. In the
case of FRiP-
normalized counts, peaks at promoters were used as a proxy for a gene-level
metric. Counts
were 1og2 transformed and graphically aligned to color scales. Hierarchical
clustering was
performed with JMP software or the Pheatmap R package.
[0636] Clustering analysis based on a normalized accessibility count metric
for the promoter
region of each gene (promoter accessibility), showed clustering of CMAT
samples separate from
the CDP samples, and an analysis of CMAT and CDP profiles showed that the
engineering
process appears to reduce detectable variation in memory T cell (TmEm) and
effector cell
signature. The results also showed that varied engineered cell composition
(CDP) can be
produced, with different epigenetic states, from different donors.
[0637] Clustering analysis of CDP samples for the "T cell module," "memory T
cell
module" and "trafficking module" genes showed that CDPs from different donors
generally
clustered together, distinguishing donors. Results of promoter accessibility
at exemplary
individual promoters of genes in the "cytokines" module and the "exhaustion"
module are
shown in FIGS. 20B ("cytokines") and 20C ("exhaustion").
[0638] The results are consistent with the utility of promoter accessibility
as a metric to
distinguish different states of T cells, e.g., during the manufacturing
process.
Example 13: Chromatin Accessibility Analysis and Treatment Outcomes in
Subjects
Administered Engineered T Cells
192
CA 03049461 2019-07-04
WO 2018/132518 PCT/US2018/013227
[0639] Chromatin accessibility profiles were assessed in CMAT and CDP samples
from
subjects in a clinical study who had been administered autologous engineered
cells expressing a
chimeric antigen receptor (CAR). Accessibility profiles were determined and
compared in
subjects who achieved certain response outcomes or subjects who developed a
toxicity.
A. Subjects and Cell Compositions
[0640] Adult human subjects with relapsed or refractory (R/R) aggressive non-
Hodgkin's
lymphoma (NHL) administered autologous engineered CD4+ and/or CD8+ T cells
expressing
an anti-CD19 CAR. For generation of engineered cells, CD4+/CD8+ T cells were
isolated by
immunoaffinity-based enrichment from leukapheresis of PBMCs and cryopreserved
(CMAT,
prior to engineering). Isolated CD4+/CD8+T cells were activated and transduced
with a viral
vector encoding an anti-CD19 CAR, containing an anti-CD19 scFv, an
immunoglobulin-derived
spacer, a transmembrane domain derived from CD28, a costimulatory region
derived from 4-
1BB, and a CD3-zeta intracellular signaling domain. The viral vector further
contained
sequences encoding a truncated receptor, which served as a surrogate marker
for CAR
expression; separated from the CAR sequence by a T2A ribosome skip sequence.
The resulting
engineered cells were cryopreserved (CDP, cryopreserved engineered cell
compositions).
B. ATAC-seq and Quality Metrics
[0641] A total of 82 CD4+ or CD8+ CMAT or CDP samples from 24 subjects, were
assayed
by ATAC-seq, generally as described in Example 1. The obtained sequences were
mapped and
ATAC-seq accessibility peaks were called using MACS2. The obtained sequences
and peaks
were analyzed using various sequencing quality control metrics, including
unmapped, unpaired
and duplicate reads, fraction of mitochondrial DNA, effective sequence depth,
number of
MACS2 peaks with a false discovery rate (FDR) of 0.1 or less, fraction of
reads in peaks (FRiP)
and number of unique peaks, to ensure consistency and fidelity of the data.
Seven (7) samples
were excluded for due to low enrichment and/or data fidelity.
[0642] In some cases, technical replicate samples were obtained and assayed.
Interval
analysis, PCA, peak overlaps and Log2 normalized counts in peaks were assessed
for the
technical replicates, and Spearman correlations were calculated. The results
showed that the
replicates showed highly similar profiles, with a large overlap and high
correlation coefficients.
C. Analysis of CD4+ and CD8+ CDP and GMAT
[0643] A normalized accessibility count metric for the promoter region of each
gene
(promoter accessibility) was assessed at the CD4 and CD8A promoters in the CDP
and CMAT
cell populations as a confirmation of the cell types, based on the chromatin
accessibility at each
193
CA 03049461 2019-07-04
WO 2018/132518 PCT/US2018/013227
locus in the CD4+ and CD8+ cell populations. The ratio of accessibility at
CD8A promoter to
accessibility at CD4 promoter was determined. As shown in FIG. 21, the
CD8A:CD4
accessibility ratio reflected the CD4+ or CD8+ status of each composition, for
both CDP and
CMAT samples.
[0644] Principal component analysis (PCA) was performed on the consensus peaks
(144,591
peaks) for all samples. The results showed that in general, CMAT CD4+ samples
clustered
together and CMAT CD8+ cells clustered together, in disparate clusters on the
PCA plot. CD4+
CDP samples and CD8+ CDP samples tended to cluster within the same group, with
CD4+ CDP
samples and CD8+ CDP samples forming sub-clusters based on CD4 or CD8
expression. The
results indicated that the engineering process resulted in a reduced variation
in overall profile for
CD4+ and CD8+ cells. In comparison, prior to engineering, CD4+ and CD8+
samples showed a
more varied profile.
[0645] Clustering analysis using the total consensus peak set (122,495 peaks
for CDP and
106,867 peaks for CMAT) was performed in CD4+ and CD8+ CDP samples. The
results
showed that for both CMAT and CDP samples, the CD4+ or CD8+ cell types
typically clustered
together.
D. Analysis Related to Clinical Outcomes
[0646] Differential accessibility analysis was performed, for peaks with
different
accessibility, in samples from subjects that went on to achieve different
response outcomes or
toxicity outcomes, after administration of the engineered cell composition.
[0647] FIG. 22A shows the 1og2 fold change and adjusted p-value for peaks with
higher or
lower accessibility, in subjects with progressive disease (PD) compared to
subjects who
achieved complete response (CR), as the best overall response (BOR), durable
response at 3
months (3M0) or durable response at 6 months (6M0), with the corresponding
number of peaks
that were differentially present in the samples. A large number of
differentially accessible peaks
were present in the 3 month and 6 month response analysis, indicating that the
epigenetic state in
the cell compositions were different for subjects who achieved a CR, compared
to for subjects
who had PD at 3- or 6- months. Peak overlap analysis showed that many of the
peaks that were
shown to be differentially accessible in the 6 month response analysis
overlapped with the peaks
in the 3 month response analysis, and some of the peaks in the BOR analysis
also overlapped
with peaks in the 3 month response analysis.
[0648] FIG. 22B shows the 1og2 fold change and adjusted p-value for peaks with
higher or
lower accessibility, in subjects who developed grade 3-5 neurotoxicity (Ntx),
compared to
194
CA 03049461 2019-07-04
WO 2018/132518 PCT/US2018/013227
subjects with grades 0-2 Ntx, or grades 2-5 cytokine release syndrome (CRS)
compared to
subjects with grades 0-1 CRS, with the corresponding number of peaks that were
differentially
present in the samples. Overlap analysis showed that only some of the peaks
were overlapping
between Ntx and CRS analyses. The results show a large number of differential
accessibility
peaks between the groups for both Ntx and CRS.
E. Analysis of GMAT and CDP Related to Clinical Outcomes
[0649] PCA on normalized counts on consensus peak sets, and differential
accessibility
analysis in CDP or CMAT samples from subjects that achieved different response
outcomes or
toxicity outcomes, generally as described above. PCA for CDP samples
(consensus set: 112,495
peaks) showed that generally CD4+ and CD8+ samples clustered based on the cell
type (CD4+
or CD8+ cells). PCA of CMAT samples (consensus set: 106,867 peaks) also showed
that
generally, samples clustered based on cell type (CD4+ or CD8+), however these
samples did not
cluster as tightly as the CDP samples indicating that the variability was
greater within different
CMAT samples, compared to the variability within the CDP samples.
[0650] Differential accessibility analysis for response outcome, for BOR, 3-
month and 6-
month response, was performed in the CDP samples and in the CMAT samples
separately. As
shown in FIGS. 23A (CDP) and 23B (CMAT), a large number of peaks were
differentially
accessible for the 3- and 6-month response analysis in the CDP samples, but
very few peaks
were differentially accessible in the CMAT samples. Overlap analysis showed
that for CDP,
many of the differentially accessible peaks overlapped in 3- and 6-month
response analysis, but
the overlap of each with BOR peaks were low, and very few peaks were present
and overlapping
for CMAT.
[0651] Differentially accessibility analysis for Ntx and CRS were performed in
CDP and
CMAT samples separately. As shown in FIG. 23C (CDP), few peaks were shown to
be
differentially accessible for Ntx, whereas a larger number of peaks were
differentially accessible
for subjects with grades 2-5 CRS. As shown in FIG. 23D (CMAT), a very high
number of peaks
were observed to be differentially accessible for Ntx, but few were
differentially accessible for
CRS. Overlap analysis for both CDP and CMAT samples show very few overlapping
peaks
between the Ntx and CRS analysis.
[0652] The results showed that examining CDP alone reduces the overall power
of the
model to assign differential accessibility peaks relating to clinical
outcomes, and examining
CMAT alone reduced the power of the model to assign differential accessibility
peaks relating to
response and CRS, consistent with the observation that interrogating CDP state
may be
195
CA 03049461 2019-07-04
WO 2018/132518 PCT/US2018/013227
informative with regard to the potential development of CRS. For Ntx,
examining CMAT
retained a very large number of differential accessibility peaks, consistent
with the observation
that starting T cell and disease state may be informative with regard to the
potential development
of neurotoxicity.
[0653] The results demonstrate the utility of the ATACseq analysis to identify
potential
differences in cell types that may correlate with clinical outcomes, e.g.,
response or safety
outcomes, and to identify epigenetic properties or features that are
associated with clinical
outcomes.
Example 14: Modified ATAC-seq Method for Chromatin Accessibility Analysis in
Analysis
of CAR T cells
[0654] A modified ATAC-seq method was used to assess chromatin accessibility
profiles in
CD8+ T cells genetically engineered with a chimeric antigen receptor and
compared with the
ATAC-seq methods generally described in Example 1.
[0655] CD8+ CDP samples from a subject with NHL and CD8+ CMAT samples from a
healthy donor were subject to modified ATACseq analysis, generally as
described in Corces et
al. (2017) Nature Methods 14:959-962, or ATAC-seq methods generally as
described in
Example 1 (standard ATAC-seq). Modifications included addition of PBS to wash
buffer,
addition of Tween-20 and digitonin to lysis buffer and addition of PBS, Tween-
20 and digitonin
to transposition reaction, and using a different DNA purification column.
[0656] The obtained sequences were mapped and ATAC-seq accessibility peaks
were called
using MACS2. The sequences and peaks obtained from modified or standard ATAC-
seq were
analyzed using various sequencing quality control metrics, including unmapped,
unpaired and
duplicate reads, fraction of mitochondrial DNA, effective sequence depth,
number of MACS2
peaks with a false discovery rate (FDR) of 0.1 or less, fraction of reads in
peaks (FRiP) and
number of unique peaks, to ensure consistency and fidelity of the data.
Mitochondrial DNA
fraction was lower in some samples obtained using modified ATACseq.
[0657] FIG. 24A shows the number of identified peaks with FDR < 0.1 and FIG.
24B
shows enrichment as indicated by FRiPs, in the CD8+ CDP and CMAT samples using
modified
or standard ATAC-seq, with 3 technical replicates. The results show that the
number of
identified peaks is higher using the modified ATAC-seq, and the enrichment
signal was
substantially higher in samples prepared using modified ATACseq.
196
CA 03049461 2019-07-04
WO 2018/132518 PCT/US2018/013227
[0658] Peak overlap analysis showed that the peak overlap was high between
technical
replicates of the samples, using both standard and modified ATACseq methods.
The overlap
between standard and modified ATACseq peaks showed that almost all of the
standard
ATACseq peaks were present in the peaks from modified ATACseq, with more peaks
present in
samples processed using the modified ATACseq. Inter-sample correlation was
high between
technical replicates and across different methods. Differential accessibility
analysis, genome
viewer visualization, clustering analysis using gene modules related to T
cells, exhaustion,
cytokine and short term effector and memory modules, and Gene Set Enrichment
Analysis
(GSEA) show consistent results between data obtained using standard and
modified ATACseq
methods.
[0659] The results showed that the modified ATACseq methods generated data
with
decreased mitochondrial read fraction, increased complexity and efficiency,
enriched signal and
increased technical reproducibility across samples. Consistent patterns were
observed in
differential analysis and biological pathway analysis of results from standard
and modified
ATACseq.
[0660] The present invention is not intended to be limited in scope to the
particular disclosed
embodiments, which are provided, for example, to illustrate various aspects of
the invention.
Various modifications to the compositions and methods described will become
apparent from
the description and teachings herein. Such variations may be practiced without
departing from
the true scope and spirit of the disclosure and are intended to fall within
the scope of the present
disclosure.
197
CA 03049461 2019-07-04
WO 2018/132518
PCT/US2018/013227
Sequences
# SEQUENCE ANNOTATION
1 ES KY GP PC PP CP spacer (IgG4hinge)
(aa)
2 GAATCTAAGTACGGACCGCCCTGCCCCCCTTGCCCT spacer (IgG4hinge)
(nt)
3 ESKYGPPCPP CP GQPREPQVYT LPP SQEEMTKNQVS LT CLVKGFYP SD IA Hinge-CH3
spacer
VEWESNGQPENNYKTTPPVLDSDGSFFLYSRLTVDKSRWQEGNVFSCSVM
HEALHNHYTQKS LS LS LGK
4 ESKYGPPCPPCPAPEFLGGP SVFLFPPKPKDTLMISRTPEVTCVVVDVSQ Hinge-CH2-CH3
EDPEVQFNWYVDGVEVHNAKTKPREEQFNSTYRVVSVLTVLHQDWLNGKE spacer
YKCKVSNKGLPS S IEKT I SKAKGQPREPQVYT LPP SQEEMTKNQVS LT CL
VKGFYP SD IAVEWESNGQPENNYKTTPPVLDSDGSFFLYSRLTVDKSRWQ
EGNVF S CSVMHEALHNHYTQKS LS LS LGK
RWPE SP KAQAS SVP TAQPQAEGSLAKATTAPATTRNTGRGGEEKKKEKEK IgD-hinge-Fc
EEQEERETKTPECP SHTQPLGVYLLTPAVQDLWLRDKATFTCFVVGSDLK
DAHLTWEVAGKVP T GGVEEGLLERHSNGSQ SQHS RLT LP RS LWNAGT SVT
CT LNHP SLPPQRLMALREPAAQAPVKLSLNLLAS SDPPEAASWLLCEVSG
F SPPNI LLMWLEDQREVNT S GFAPARPPPQP GS T TFWAWSVLRVPAPP SP
QPATYTCVVSHEDSRTLLNASRSLEVSYVTDH
6 LEGGGEGRGSLLTCGDVEENPGPR T2A
7 MLLLVT SLLLCELP HPAF LL IPRKVCNGI GI GEFKD SL S INATNIKHFKN tEGFR
CT S I SGDLHI LPVAFRGD SF THTPPLDPQELD ILKTVKE I TGFLL I QAWP
ENRTDLHAFENLE I IRGRTKQHGQFSLAVVSLNI TSLGLRSLKE I SDGDV
II SGNKNLCYANT INWKKLF GT SGQKTK I I SNRGENSCKATGQVCHALCS
PEGCWGPEPRDCVSCRNVSRGRECVDKCNLLEGEPREFVENSEC IQCHPE
CLPQAMNI TCTGRGPDNC I QCAHY I D GP HCVKTCPAGVMGENNT LVWKYA
DAGHVCHLCHPNCTYGCT GP GLEGCP TNGPKIPS IATGMVGALLLLLVVA
LGIGLFM
8 FWVLVVVGGVLACY SLLVTVAF I I FWV CD28 (amino acids
153-179 of
Accession No.
P10747)
9 IEVMYPPPYLDNEKSNGT I I HVKGKHLCP SPLFP GP SKP CD28 (amino acids
FWVLVVVGGVLACY SLLVTVAF I I FWV 114-179 of
Accession No.
P10747)
RSKRSRLLHSDYMNMTPRRP GP TRKHYQPYAPPRDFAAYRS CD28 (amino acids
180-220 of
P10747)
11 RSKRSRGGHSDYMNMTPRRP GP TRKHYQPYAPPRDFAAYRS CD28 (LL to GG)
12 KRGRKKLLYIFKQPFMRPVQTTQEEDGCSCRFPEEEEGGCEL 4-1BB (amino
acids 214-255 of
Q07011.1)
13 RVKFSRSADAPAYQQGQNQLYNELNLGRREEYDVLDKRRGRDPEMGGKPR CD3 zeta
RKNP QE GLYNELQKDKMAEAYS E I GMKGERRRGKGHDGLYQGLS TATKDT
YDALHMQALP PR
14 RVKFSRSAEPPAYQQGQNQLYNELNLGRREEYDVLDKRRGRDPEMGGKPR CD3 zeta
RKNP QE GLYNELQKDKMAEAYS E I GMKGERRRGKGHDGLYQGLS TATKDT
YDALHMQALP PR
RVKFSRSADAPAYKQGQNQLYNELNLGRREEYDVLDKRRGRDPEMGGKPR CD3 zeta
RKNP QE GLYNELQKDKMAEAYS E I GMKGERRRGKGHDGLYQGLS TATKDT
198
CA 03049461 2019-07-04
WO 2018/132518
PCT/US2018/013227
# SEQUENCE ANNOTATION
YDALHMQALPPR
16 RKVCNGIGIGEFKDSLSINATNIKHFKNCTSISGDLHILPVAFRGDSFTH tIEGFR
TPPLDPQELDILKTVKEITGFLLIQAWPENRTDLHAFENLEIIRGRTKQH
GQFSLAVVSLNITSLGLRSLKEISDGDVIISGNKNLCYANTINWKKLFGT
SGQKTKIISNRGENSCKATGQVCHALCSPEGCWGPEPRDCVSCRNVSRGR
ECVDKCNLLEGEPREFVENSECIQCHPECLPQAMNITCTGRGPDNCIQCA
HYIDGPHCVKTCPAGVMGENNTLVWKYADAGHVCHLCHPNCTYGCTGPGL
EGCPTNGPKIPSIATGMVGALLLLLVVALGIGLFM
17 EGRGSLLTCGDVEENPGP T2A
18 GSGATNFSLLKQAGDVEENPGP P2A
19 ATNFSLLKQAGDVEENPGP P2A
20 QCTNYALLKLAGDVESNPGP E2A
21 VKQTLNFDLLKLAGDVESNPGP F2A
22 -PGGG-(SGGGG)5-P- wherein P is proline, G is Linker
glycine and S is serine
23 GSADDAKKDAAKKDGKS Linker
24 atgcttctcctggtgacaagccttctgctctgtgagttaccacacccagc GMCSFR alpha
attcctoctgatccca chain signal
sequence
25 MLLLVTSLLLCELPHPAFLLIP GMCSFR alpha
chain signal
sequence
26 MALPVTALLLPLALLLHA CD8 alpha signal
peptide
27 Glu Pro Lys Ser Cys Asp Lys Thr His Thr Cys Pro Hinge
Pro Cys Pro
28 Glu Arg Lys Cys Cys Val Glu Cys Pro Pro Cys Pro Hinge
29 ELKTPLGDTHTCPRCPEPKSCDTPPPCPRCPEPKSCDTPPPCPRCPEPKS Hinge
CDTPPPCPRCP
30 Glu Ser Lys Tyr Gly Pro Pro Cys Pro Ser Cys Pro Hinge
31 Glu Ser Lys Tyr Gly Pro Pro Cys Pro Pro Cys Pro Hinge
32 Tyr Gly Pro Pro Cys Pro Pro Cys Pro Hinge
33 Lys Tyr Gly Pro Pro Cys Pro Pro Cys Pro Hinge
34 Glu Val Val Val Lys Tyr Gly Pro Pro Cys Pro Pro Hinge
Cys Pro
35 RASQDISKYLN FMC63 CDR L 1
36 SRLHSGV FMC63 CDR L2
37 GNTLPYTFG FMC63 CDR L3
38 DYGVS FMC63 CDR H1
39 VIWGSETTYYNSALKS FMC63 CDR H2
40 YAMDYWG FMC63 CDR H3
41 EVKLQESGPGLVAPSQSLSVTCTVSGVSLPDYGVSWIRQPPRKGLEWLGV FMC63VH
IWGSETTYYNSALKSRLTIIKDNSKSQVFLKMNSLQTDDTAIYYCAKHYY
YGGSYAMDYWGQGTSVTVSS
42 DIQMTQTTSSLSASLGDRVTISCRASQDISKYLNWYQQKPDGTVKLLIYH FMC63VL
TSRLHSGVPSRFSGSGSGTDYSLTISNLEQEDIATYFCQQGNTLPYTFGG
GTKLEIT
43 DIQMTQTTSSLSASLGDRVTISCRASQDISKYLNWYQQKPDGTVKLLIYH FMC63 scFv
TSRLHSGVPSRFSGSGSGTDYSLTISNLEQEDIATYFCQQGNTLPYTFGG
GTKLEITGSTSGSGKPGSGEGSTKGEVKLQESGPGLVAPSQSLSVTCTVS
GVSLPDYGVSWIRQPPRKGLEWLGVIWGSETTYYNSALKSRLTIIKDNSK
199
CA 03049461 2019-07-04
WO 2018/132518
PCT/US2018/013227
# SEQUENCE ANNOTATION
SQVFLKMNSLQTDDTAIYYCAKHYYYGGSYAMDYWGQGTSVTVSS
44 KASQNVGTNVA SJ25C1 CDR Ll
45 SATYRNS SJ25C1 CDR L2
46 QQYNRYPYT SJ25C1 CDR L3
47 SYWMN SJ25C1 CDR H1
48 QIYPGDGDTNYNGKFKG SJ25C1 CDR H2
49 KTISSVVDFYFDY SJ25C1 CDR H3
50 EVKLQQSGAELVRPGSSVKISCKASGYAFSSYWMNWVKQRPGQGLEWIGQ SJ25C1VH
IYPGDGDTNYNGKFKGQATLTADKSSSTAYMQLSGLTSEDSAVYFCARKT
ISSVVDFYFDYWGQGTTVTVSS
51 DIELTQSPKFMSTSVGDRVSVTCKASQNVGTNVAWYQQKPGQSPKPLIYS SJ25C1VL
ATYRNSGVPDRFTGSGSGTDFTLTITNVQSKDLADYFCQQYNRYPYTSGG
GTKLEIKR
52 GGGGSGGGGSGGGGS Linker
53 EVKLQQSGAELVRPGSSVKISCKASGYAFSSYWMNWVKQRPGQGLEWIGQ SJ25C1 scFv
IYPGDGDTNYNGKFKGQATLTADKSSSTAYMQLSGLTSEDSAVYFCARKT
ISSVVDFYFDYWGQGTTVTVSSGGGGSGGGGSGGGGSDIELTQSPKFMST
SVGDRVSVTCKASQNVGTNVAWYQQKPGQSPKPLIYSATYRNSGVPDRFT
GSGSGTDFTLTITNVQSKDLADYFCQQYNRYPYTSGGGTKLEIKR
54 HYYYGGSYAMDY FMC63 HC-CDR3
55 HTSRLHS FMC63 LC-CDR2
56 QQGNTLPYT FMC63 LC-CDR3
57 gacatccagatgacccagaccacctccagcctgagcgccagcctgggcga Sequence encoding
ccgggtgaccatcagctgccgggccagccaggacatcagcaagtacctga scTIT
actggtatcagcagaagcccgacggcaccgtcaagctgctgatctaccac
accagccggctgcacagcggcgtgcccagccggtttagcggcagcggctc
cggcaccgactacagcctgaccatctccaacctggaacaggaagatatcg
ccacctacttttgccagcagggcaacacactgccctacacctttggcggc
ggaacaaagctggaaatcaccggcagcacctccggcagcggcaagcctgg
cagcggcgagggcagcaccaagggcgaggtgaagctgcaggaaagcggcc
ctggcctggtggcccccagccagagcctgagcgtgacctgcaccgtgagc
ggcgtgagcctgcccgactacggcgtgagctggatccggcagccccccag
gaagggcctggaatggctgggcgtgatctggggcagcgagaccacctact
acaacagcgccctgaagagccggctgaccatcatcaaggacaacagcaag
agccaggtgttcctgaagatgaacagcctgcagaccgacgacaccgccat
ctactactgcgccaagcactactactacggcggcagctacgccatggact
actggggccagggcaccagcgtgaccgtgagcagc
58 X1PPx2P Hinge
X1 is glycine, cysteine or arginine
X2 is cysteine or threonine
59 GSTSGSGKPGSGEGSTKG Linker
200