Note: Descriptions are shown in the official language in which they were submitted.
CA 03059804 2019-10-10
WO 2018/191745 PCT/US2018/027769
NON-INVASIVE HEMODYNAMIC ASSESSMENT VIA INTERROGATION OF BIOLOGICAL TISSUE
USING A COHERENT LIGHT SOURCE
CROSS REFERENCE
[00011 This application claims priority to U.S. Patent Application No.
15/488,263, filed April 14, 2017, the
specification(s) of which is/are incorporated herein in their entirety by
reference.
FIELD OF THE INVENTION
100021 Embodiments of the disclosure relate to noninvasive medical monitoring
and methods for obtaining
non-invasive measurements of physiological parameters, including hemodynamic
parameters such as
blood pressure and arterial compliance.
GOVERNMENT SUPPORT
[00031 This invention was made with government support under Grant No.
El3015890 awarded by the
National Institutes of Health. The government has certain rights in the
invention.
BACKGROUND OF THE INVENTION
[00041 Noninvasive hemodynamic monitoring refers to techniques that measure
and characterize in some
way the physiological and pathological state of the cardiovascular system
without cannulating a vessel or
introducing harmful radiation or substances to the subject. Examples include
methods that aim to
measure blood pressure, cardiac output, vascular tone, arterial stiffness or
fluid status. These methods
have the potential to improve inpatient and outpatient healthcare, in addition
to opening up new research
directions and revolutionizing wearable devices for personal health and
fitness.
(0005j One method of noninvasive hemodynamic monitoring is
Photoplethysmography (PPG), which is an
optical technique that measures microvascular expansion caused by the
pulsatile component of blood
pressure. This can be achieved by interrogating tissue with visible and near
infrared light. PPG
instrumentation consists of a light source to illuminate the tissue and a
photodetector to measure small
fluctuations in light intensity. These dynamics are then transformed
mathematically into the PPG signal
which is representative of blood volume expansion due to the pulse. PPG is the
base technology for
pulse oximetry where the ratiometric comparison of PPG amplitude is compared
at multiple discrete
wavelengths in order to recover arterial oxygen saturation.
10061 Despite the clinical success of pulse-oximetry, PPG has not been
successful in other aspects of
hemodynamic monitoring One technique called vascular unloading applies PPG
alongside a finger-sized
cuff to measure blood pressure non-invasively. Although this device has
achieved some level of clinical
dissemination, it is highly susceptible to changes in vascular tone in
addition to requiring calibration steps
to account for differences in central and peripheral blood pressure. Overall,
its limited accuracy makes it
unsuited for ubiquitous use. Researchers have also used PPG pulse-wave
analysis and characterization
strategies for a wide variety of hemodynamic monitoring applications including
cardiac output, vascular
stiffness, venous assessment, and microvascular perfusion, to name a few.
There has been some
success in these ventures, but due to the limited signal quality inherent in
the PPG they fail to surpass the
CA 03059804 2019-10-10
WO 2018/191745 PCT/US2018/027769
threshold of clinical viability.
SUMMARY OF THE INVENTION
[00071 Laser Speckle Imaging (LSI) is a noncontact optical imaging method that
recovers relative blood
flow by imaging tissue being illuminated with a coherent light source. Red
blood cells moving through the
vascular system act as optical scatterers that modulate the spatial coherence
distribution of photons
interrogating the tissue. In LSI, light remitted from the tissue is most often
imaged using a CCD or CMOS
camera Images recorded by the detector contain a pattern referred to as
speckle that is due to
constructive and destructive interference of coherent light on the detector.
The speckle pattern fluctuates
at a rate dependent on the degree of motion of the scattering objects. Hence,
blood perfusion has a
direct effect on the spatial and temporal variance of remitted light. Over
finite integration times, the tissue
perfusion can be calculated by measuring the level of the variance in one or
more collected images.
[00081 If performed at a high enough frame-rate, LSI is capable of sampling
the heartbeat waveform in the
same manner as PPG. The main difference is that LSI is probing the pulsatile
component of blood flow
velocity whereas PPG is sampling the pulsatile component of vascular
volumetric expansion. The pulsatile
LSI signal, named here the Speckleplethysmograph (SPG), has several qualities
that make it ideal for
noninvasive hemodynamic monitoring. First, the signal quality is superior to
that of PPG. The total
volume modulation during the pulsatile cardiac cycle is relatively small
(e.g., less than 2%) and
confounded by many variables (e.g., vasoconstriction/dilation, vascular
stiffness, Reynold's number, etc.)
resulting in a PPG signal with limited physiological information. The small
size of the signal also makes
the PPG signal especially vulnerable to noise (i.e. a relatively small signal-
to-noise ratio). The SPG signal
is a physiologically larger signal and is less diluted by noise. For example,
a clear SPG signal can be
acquired in patient groups where PPG tends to fail, such as in individuals
over the age of 50, subjects with
peripheral vascular disease, and those experiencing vasoconstriction. The SPG
also maintains signal
quality during increased vascular tone such as during cold shock or
dehydration. This is significant
because it is in these cases that the PPG signal becomes overwhelmed by noise.
In addition to being a
more robust signal than PPG, the SPG offers complimentary information since it
is physically interrogating
a different phenomenon (PPG represents volumetric expansion whereas SPG
represents blood flow).
[00091 Various embodiments disclosed herein relate to a new approach for the
non-invasive measurement
and characterization of physiological parameters. These parameters may include
but are not limited to:
blood pressure, vascular stiffness, microvascular function, hyper-/hypo-
tension, oxygen metabolism,
cardiac function, fluid status, hemoglobin concentration, oxygenation, and
blood viscosity. The
quantitative measurement and/or qualitative characterization of these or other
physiological parameters
comprise the determination of physiological parameters (i.e. physiological
information) about a subject
upon which the assessment is performed.
(0010j The principle behind embodiments disclosed herein is that the
aforementioned physiological
parameters can be characterized by information related to the blood flow and
blood volume in a given
tissue, where the flow and volume may be determined using a coherent light-
based imaging system. The
2
CA 03059804 2019-10-10
WO 2018/191745 PCT/US2018/027769
coherent light-based imaging system measures speckle signals after interaction
with moving scattering
objects (i.e. blood cells), and relates the speckle signals to flow and
volume. The flow and volume of
blood is pulsatile due to the cardiac cycle, and thus is represented by a
waveform. The flow and volume
waveforms contain valuable information about the hemodynamics of the sample.
Embodiments relate to
systems and methods for producing and analyzing said waveforms, in order to
characterize said
physiological parameters.
100111 In one embodiment, coherent light from a light source interrogates a
complex turbid medium. The
light remitted after propagation through said medium is measured using a
photodetector placed in either a
transmission or reflectance geometry. Either the light source or detector (or
both) may be making contact
with the tissue or may be in a noncontact configuration. Using a single light
source emitting at least
partially coherent light, at least two distinct signals, which are offset in
time, may be acquired. One of
these signals is the periodic representation of blood flow, which utilizes
spatiotemporally varying dynamic
scattering information known as the speckle variance. From the variance
information, metrics of contrast
can be derived and transformed into indices such as but not limited to:
speckle contrast and/or the
speckle flow index. The signal derived from metrics of contrast will be
referred to herein as the
Speckleplethysmogram (SPG) A second signal can be obtained through a metric of
total light intensity,
such as but not limited to the mean intensity of the sensor array. The signal
derived from metrics of mean
photo-intensity will be referred to herein as the Photoplethysmogram (PPG),
and is representative of the
volume of light absorbing blood within the sample. The PPG can be derived from
the same source of
coherent light as the speckle signal.
100121 Within a single instrument, comparisons may be drawn between the SPG
and the PPG signals as
well as the characterization of each signal individually. For example,
embedded within the waveforms are
both timing features with respect to each other and intrinsically within the
dynamics of the individual
signals. Additionally, timing features can be derived from one of many
reference signals including but not
limited to the PPG and an electrocardiogram (ECG) signal The SPG signal may be
used to extract these
timing features in addition to one of the aforementioned reference signals. In
the absence of a quality
PPG signal or as a substitute for the PPG signal, an ECG signal may be used.
Physiological parameters
can then be derived from features of the waveform or the comparison between
said waveforms For
example, by generating data descriptive of the timing offset between signals
and/or by analyzing the offset
nature as well as the structure of the individual time-varying signals, one
can recover parameters
quantifying or characterizing vascular stiffness, blood pressure, and other
features not limited to these.
100131 As a non-limiting example, vascular compliance may be quantified as
follows. A laser diode
emitting near-infrared light may be directed into the finger or digit of a
subject. Laser light entering the
tissue is scattered in part by moving red blood cells within the digit, and a
CMOS camera may be used to
collect images of the light leaving the digit. In this example, the laser
diode and CMOS camera may be
contained within a digit clip as shown in FIG 2, such that the laser diode and
CMOS camera are placed
on opposite sides of the digit (i.e. using a transmission geometry). Images
may be collected using the
CMOS camera at a rate of 60 images per seconds and transferred to a computer
where they are stored in
3
CA 03059804 2019-10-10
WO 2018/191745 PCT/US2018/027769
memory, for example. A processor may then use the images to compute a single
speckle contrast
parameter from each image by calculating the standard deviation of the pixel
values within each image by
the average value of all pixels. An SPG waveform may be generated by computing
the speckle contrast
for each collected image and observing how the speckle contrast changes over
time with each heartbeat.
Using the same collected images, a PPG waveform may be generated by using a
processor to compute
an average pixel value in each collected image and observing how this average
pixel value changes over
time with each heartbeat. A vascular compliance metric may then be estimated
using the computer
processor by comparing the SPG waveform to the PPG waveform. Specifically, the
maximum value of
the SPG and PPG waveforms for to each heartbeat may occur at slightly
different times, and this
difference may be correlated to vascular compliance. As such, by computing the
time delay between the
peaks of the SPG and PPG waveforms, a relative metric of vascular compliance
may be generated.
[0014) In contrast with other methods, the disclosed systems and methods are
based on content-rich
information reflective of the complexities of the cardiovascular system. By
analyzing the timing offset and
SPG waveform information, the methods presented herein gain access to highly
informed signals
reflecting the complexities of the arterial network. Accordingly, the systems
and methods disclosed herein
have more potential for greater clinical applicability than other hemodynamic
monitoring technologies
known in the art.
100151 Another advantage of the disclosed systems and methods is their
reliance on the SPG signal,
which possesses superior signal over the PPG signal. As mentioned earlier, the
SPG maintains signal
quality in situations where the PPG concedes to noise such as in patient
groups with extensive
cardiovascular disease. Importantly, patients with cardiovascular problems are
in greatest need of
effective monitoring.
100161A third advantage is that the systems and methods disclosed herein may
be practiced with
inexpensive component devices that are simple to build and/or easy to operate.
In contrast with other
methods that measure liming features of camliovascular system such as pulse-
transit-time, embodiments
of the methods described herein may be performed with only a single light-
source and a single detector.
[0017) In some embodiments, a system for determining one or more physiological
parameters in a subject
is disclosed. The system includes a light source, a photo-sensitive detector,
and a processor. The light
source is positionable along a first location outside of the subject, and is
configured to direct light from the
first location toward a plurality of light-scattering particles flowing in
pulsatile motion within a blood vessel
inside of the subject. The photo-sensitive detector is positionable along a
second location outside of the
subject, and configured to detect light scattered by the plurality of light-
scattering particles and generate a
signal related to the detected light. The processor includes a program and a
memory and is operably
coupled to the photo-sensitive detector. The processor is configured to
receive and store in memory the
signals generated over a period of time The processor is programmed to derive
contrast metrics from the
signals stored in memory over the period of time and calculate a waveform from
the contrast metrics. The
processor is further programmed to decompose the waveform into one or more
characteristic features and
4
CA 03059804 2019-10-10
WO 2018/191745 PCT/US2018/027769
make a comparison using the one or more decomposed characteristic features to
determine the one or
more physiological parameters. The one or more physiological parameters may
relate to one or more of
atherosclerotic obstruction, vascular compliance, blood pressure, cardiac
output, venous status, hydration
status or vascular tone.
100181 The processor may be further programmed to convert the contrast metrics
into metrics of
volumetric flow. The one or more characteristic features may be amplitudes of
a basis function The
processor may be further programmed to generate a histogram based on a ratio
of basis function
amplitudes. The one or more characteristic features may be amplitudes of a
periodic basis function, and
the decomposition may be equivalent to a time-frequency transform. The one or
more characteristic
features may be amplitudes of a wavelet basis function, and the decomposition
may represent a wavelet
transform. The one or more characteristic features may be abstract features.
The one or more
characteristic features can describe the width of the waveform pulse. The one
or more characteristic
features may be the timing occurrences of local extrema. The one or more
characteristic features may be
amplitudes of local extrema. The one or more characteristic features may be
magnitudes of slopes of the
waveform.
100191 In some embodiments, a method for determining one or more physiological
parameters from light-
scattering particles in pulsatile motion within a physiological system is
disclosed The method comprises
positioning a light source at a first site outside of the physiological system
and actuating the light source,
such that light is directed toward the light-scattering particles. The method
further comprises positioning a
photo-sensitive detector at a second site outside of the physiological system,
wherein the second site is
located along a path of light scattered by at least some of the light-
scattering particles, and using the
photo-sensitive detector to detect light scattered by at least some of the
light-scattering particles over a
period of time. The method further comprises communicating signals related to
the detected light to a
processor, deriving intensity values from the communicated signals, and
calculating a contrast metric by
comparing the intensity. The method further comprises producing a contrast
waveform related to the
pulsatile motion of the light-scattering particles based on a change in the
contrast metric over time,
decomposing the contrast waveform into one or more characteristic features,
and making a comparison
using the one or more decomposed characteristic features. The method also
comprises determining the
one or more physiological parameters based at least in part on the comparison.
The one or more
physiological parameters may relate to one or more of atherosclerotic
obstruction, vascular compliance,
blood pressure, cardiac output, venous status, hydration status or vascular
tone.
100201 The method may further comprise relating the contrast metric to a
metric of volumetric flow. The
method may further comprise determining a reference signal of a physiological
origin distinct from the
contrast metric, wherein making a comparison comprises comparing the contrast
waveform to the
reference signal. The reference signal can be a photo-intensity metric. The
method may further comprise
converting the photo-intensity metric into a metric of absorption. Comparing
the contrast waveform to the
reference signal may comprise comparing temporal locations of a characteristic
feature found in both the
contrast waveform and the reference signal. The reference signal may be a
reference waveform.
CA 03059804 2019-10-10
WO 2018/191745 PCT/US2018/027769
Comparing the contrast waveform to the reference signal may comprise comparing
pulsatile amplitudes of
the contrast and reference waveforms. Comparing the contrast waveform to the
reference signal may
comprise comparing non-pulsatile amplitudes of the contrast and reference
waveforms. Comparing the
contrast waveform to the reference signal may comprise determining a temporal
offset of one or more
characteristic features. The reference signal can be an electrocardiogram.
[00211 The method may further comprise decomposing the contrast and reference
waveforms into basis
functions and respective amplitudes. Comparing the contrast waveform to the
reference signal may
comprise comparing the decomposed contrast and reference waveforms. Comparing
the contrast
waveform to the reference signal may comprise comparing one or more basis
function amplitudes of one
decomposed waveform to one or more basis function amplitudes of the other
decomposed waveform.
Comparing the contrast waveform to the reference signal may comprise comparing
one or more ratios of
basis function amplitudes of one decomposed waveform to one or more ratios of
basis function
amplitudes of the other decomposed waveform.
100221 Some of the unique and inventive technical features of the present
invention include generating a
waveform from the contrast metric, decomposing the waveform to determine one
or more characteristic
features, and comparing using the one or more decomposed characteristic
features to determine
physiological parameters. Without wishing to limit the invention to any
theory or mechanism, it is
believed that the technical feature of the present invention advantageously
provides for using an optical
method such as laser speckle imaging to identify physiological parameters that
may relate to one or more
of atherosclerotic obstruction, vascular compliance, blood pressure, cardiac
output, venous status,
hydration status or vascular tone, and the like. None of the presently known
prior references or work has
the unique inventive technical features of the present invention.
100231 Moreover, scientist, engineers, and other who are skilled in this field
would even teach away from
assembling the technical features of the present invention as presented here.
Traditionally, scientists
seek to use Laser Speckle Imaging to generate wide field surface blood flow
maps, as one might
intuitively use a camera (namely, to generate photographs of the surface of
objects). Thus, scientific
research generally teaches towards improving the accuracy and spatial
resolution of the blood flow image
map. The blood flow at the skin surface is composed of small vessels such as
capillaries, which contain
very little to no pulsatile blood movement. In contrast, the present invention
utilizes Laser Speckle
Imaging in a variety of unique geometries, (i.e. as presented in FIGs. IA-ID)
that collect highly diffuse
light, which has penetrated more deeply into the sample. The collection of
diffuse light into the camera
system is counter-intuitive because diffuse light typically produces poorly
focused and low-resolution
images The present invention emphasizes generating a detailed waveform instead
of high-resolution
blood flow images, and thus prefers diffuse light because it allows access to
deeper blood vessels such
as arteries and arterioles, with increased pulsatile blood flow. Once the
blood flow information from
deeper blood vessels is retrieved, the high resolution SPG pulsatile waveform
becomes apparent for the
first time, and hence the present invention relating to the decomposition of
said waveform, can be
performed
6
CA 03059804 2019-10-10
WO 2018/191745 PCT/US2018/027769
(0024j Also, the informational result provided for by the unique technical
features of the present invention
is surprising. For example, features of the SPG waveform may be seen that do
not appear on other,
analogous waveforms such as PPG and EKG. One surprising feature is the time
delay between SPG and
PPG, as illustrated in FIG. 8A. Other surprising and unique features were also
seen such as multiple
secondary peaks, high frequency systolic injection spikes, large dichrotic
notch, etc. Further,
decomposing said waveform using FFT or Wavelet transforms, show frequency
spectrum differing from
PPG. Perhaps the most surprising information found was that many of these
unique features were found
to be related to physiological information. Non-limiting examples are shown in
FIGs. 8A-8C and 10, which
illustrate relationships between SPG features and physiological information,
such as age and vascular
tone.
100251 In a broad embodiment, the above referenced "contrast metric" refers to
an inter/intra pixel
contrast. A non-limiting example of a contrast metric is the speckle contrast
(K), defined as sigma / <I>
where sigma is the standard deviation of the intensity and <I> is the average
intensity. Various other
examples of the contrast metric are discussed throughout the application.
[00261 In a broad embodiment, the above referenced "generating the waveform'
may comprise generating
a single determinable value of the contrast metric for every sampled point of
time across a continuous
sample of time. This example of the generating the waveform from the contrast
metric is not limiting.
Various other examples of how the waveforms are generated are discussed
throughout the application.
[00271 In a broad embodiment, the above referenced 'decomposing the waveform
to determine one or
more characteristic features" may include decomposing the waveform into basis
functions and respective
amplitudes. In a non-limiting example, decomposition may transform the
waveform from being a time-
dependent function into a frequency-dependent function, which can be described
by the superimposition
of scaled frequency-dependent basis functions (i.e. a time-frequency
transformation). In such a manner,
the decomposition may be equivalent to performing a Fourier transform on the
time-dependent waveform.
This example of decomposing the waveform is not limiting. Various other
examples of the decomposing
are discussed throughout the application
[00281 In a broad embodiment, the above referenced "one or more characteristic
features" may include
amplitudes of basis function or width of waveform, and the like. These
examples of the "one or more
characteristic features" are not limiting. Various other examples of "the one
or more characteristic
features" are discussed throughout the application.
(00291 In a broad embodiment, the above referenced 'comparing" step may
include, but are not limited to
a determination of which basis function has the greater/lesser amplitude, the
difference in amplitudes,
and/or the ratio of one amplitude to another.
[00301 In a broad embodiment, the above referenced "physiological parameters'
may include but are not
limited to blood pressure, vascular stiffness, microvascular function, hyper-
/hypo- tension, oxygen
metabolism, cardiac function, fluid status, hemoglobin concentration,
oxygenation, and blood viscosity.
CA 03059804 2019-10-10
WO 2018/191745 PCT/US2018/027769
These examples of the "comparing" step and the "physiological parameters" are
not limiting. Various
other examples of the "comparing' step and the "physiological parameters" are
discussed throughout the
application.
[00311 Any feature or combination of features described herein are included
within the scope of the
present invention provided that the features included in any such combination
are not mutually
inconsistent as will be apparent from the context, this specification, and the
knowledge of one of ordinary
skill in the art. Additional advantages and aspects of the present invention
are apparent in the following
detailed description and claims.
BRIEF DESCRIPTION OF THE DRAWINGS
[0032) These and other features, aspects, and advantages of the present
disclosure will now be described
with reference to the drawings of embodiments, which embodiments are intended
to illustrate and not to
limit the disclosure. One of ordinary skill in the art would readily
appreciate that the features depicted in
the illustrative embodiments are capable of combination in manners that are
not explicitly depicted, but
are both envisioned and disclosed herein.
(0033) FIGs. 1A-1D schematically illustrate various system configurations.
FIG. 1A shows the system in a
reflectance, non-contact configuration. FIG. 18 shows the system in a
transmission, non-contact
configuration. FIG. 1C shows the system in a reflectance, contact
configuration. FIG. 1D shows the
system in a transmission, contact configuration.
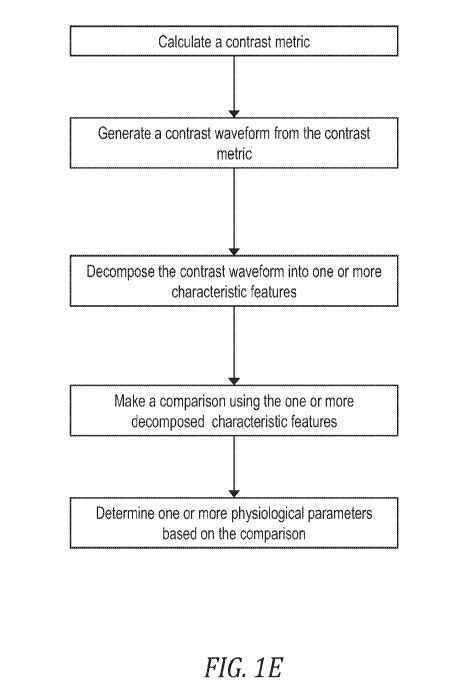
[0034) FIG. 1 E schematically illustrates an example of an algorithm for
determining one or more
physiological parameters from light scattering particles in a pulsatile motion
within a physiological system.
[00351 FIG. 2 illustrates an example of an interrogation device coupled to a
processor.
[0036) FIG. 3 schematically illustrates the components of a system including
an interrogation device
coupled to a computer.
[0037) FIG. 4 schematically illustrates the interrogation of vascularized
tissue comprising flowing red blood
cells.
(0038) FIG. 5 schematically illustrates an example of an algorithm for
calculating descriptive statistics from
an SPG signal.
[0039) FIG. 6 schematically illustrates an example of an algorithm for
calculating the time delay between
an SPG and a PPG signal.
[0040) FIGs. 7A-7C illustrate the use of a wavelet transform on SPG signals.
FIG. 7C illustrates an
example of an algorithm for extracting physiological parameters from detector
input using a wavelet
transform. FIG. 78 depicts an example of a generated SPG signal and scalogram
attained under normal
conditions. FIG. 7C depicts an example of a generated SPG signal and scalogram
attained under post-
exercise vasodilation
(0041) FIGs. 8A-8C depict data obtained by a comparison of PPG and SPG
signals. FIG. 8A shows the
lime delay between the signals. FIG. 88 shows the average time delay
calculated for four subjects in
three different physiological states. FIG. 8C shows the correlation between
the measured time delay and
subject age.
8
CA 03059804 2019-10-10
WO 2018/191745 PCT/US2018/027769
(0042j FIGs. 9A-9E depict a method of deriving physiologically relevant data
from an SPG signal FIG.
9A shows the identification of a single pulse from a raw SPG signal. FIG. 98
shows the extraction of the
identified pulse from the raw SPG signal. FIG. 9C shows the appending of the
extracted peak onto itself.
FIG. 9D shows the generation by a Fast Fourier Transform (FFT) of a frequency
spectrum characterizing
the harmonic content of the extracted pulse. FIG. 9E shows the generation of a
histogram characterizing
the distributions of harmonic ratios over a set of pulses extracted from the
raw SPG signal.
[00431 FIG. 10 depicts data showing the correlation between measured harmonic
ratio and subject age.
[0044j FIG. 11 depicts a scatter plot resolving two groups of subjects with
different health statuses based
on a measured time delay and harmonic ratio of SPG signals.
DESCRIPTION OF PREFERRED EMBODIMENTS
100451 Referring now to FIGs. 1A-11, the present invention described herein
enables the non-invasive
recovery of parameters relevant to subject physiology. These parameters may be
used along
mathematical models to derive non-invasive hemodynamic parameters including
but not limited to blood
pressure, cardiac output, venous status, hydration status, hematocrit, and
vascular tone. The systems
and methods disclosed herein may incorporate component devices, including a
light source 100, a
photodetector 200 (i.e. a photo-sensitive detector, such as an image sensor),
and a processor 500, which
may be operatively connected to one another to interrogate a sample 300. In
many embodiments, the
sample 300 may be a physiological sample, such as a region of tissue on
subject, about which
physiological information is to be ascertained. The subject may be a living
animal, such as a human. The
component devices may be standard devices employed in new configurations,
methodologies, and/or
systems or they may be devices specifically designed or adapted to perform in
the systems and methods
disclosed herein. The light source 100 may be configured to emit at least
partially coherent light. The
light source 100 may be a laser, such as a diode laser. In some embodiments,
the light source 100 is a
VCSEL laser. The photodetector 200 may comprise one or more light-sensitive
elements (e.g. pixels) for
detecting light recovered from the light source 100 after interaction with a
sample 300. The photodetector
200 may, for example, be a silicon camera sensor. The camera sensor may be of
any suitable type,
including but not limited to CMOS or CCD image sensors. The photodetector 200
may comprise a slit or
aperture for modulating the angle of light (i.e. the amount of light)
detected. The photodetector 200 may
be configured to generate one or more signals related to the detected light
and to transmit these signals to
the processor 500. The signals may comprise quantifiable information about ihe
intensity of light detected
at one or more pixels at a point in time or over a course of lime In some
embodiments, the signals may
comprise information about the wavelength(s) of the detected light. The
signals may be analog or digital.
If the signals are analog they may be subsequently converted into digital
signals either before or after
being transmitted from the photodetector 200.
100461 The light source 100 and photodetector 200 may be positionable in any
number of configurations
relative to the sample 300 including but not limited to being placed in
contact or noncontact geometries, or
in reflectance or transmission geometries, as seen in FIG.s 1A-1D. The devices
are positionable in that
they can each be maintained in a relatively constant spatial orientation
relative to the sample 300 during
the measurement so that changes in the deteded signal resulting from movement
of the light source 100.
9
CA 03059804 2019-10-10
WO 2018/191745 PCT/US2018/027769
photodetector 200, and/or sample 300 relative to one another are negligible
relative to the informational
content attained from the sample 300. The positionable devices may be affixed
to each other, part of an
integral device, or distinct structures. One or both of the devices may be
removably attached to the
sample, such as affixed to a surface of the sample, or they may be free-
standing or affixed to a structure
independent of the sample 300. At least a portion of the light emitted from a
positionable light source 100
is able to reach a surface of the sample 300 and at least a portion of the
light detected by a positionable
photodetector 200 has contacted the sample 300. FIG. 1A shows a non-contact
reflectance geometry
wherein the light source 100 and photodetector 200 are both positioned on the
same side of the sample
300, neither of which is in direct physical contact with a surface of the
sample 300. FIG *I B shows a non-
contact transmission geometry wherein the light source 100 and the
photodetector 200 are positioned on
opposite sides of the sample 300 through which the light emitted from the
light source 100 passes through
and in which neither the light source 100 nor the photodetector 200 are in
direct physical contact with a
surface of the sample 300. The light source 100 and photodetector 200 may or
may not be positioned
directly across from each other in a transmission geometry. FIG. 1C shows a
contact reflectance
geometry wherein the light source 100 and the photodetector 200 are both
positioned on the same side of
the sample 300, both of which are in direct physical contact with a surface of
the sample 300. FIG. 1D
shows a contact transmission geometry wherein the light source 100 and
photodetector 200 are
positioned on opposite sides of the sample 300 through which the light emitted
from the light source 100
passes through and in which both the light source 100 and the photodetector
200 are in direct physical
contact with a surface of the sample 300. Variations are also possible for
each geometry wherein one of
the light source 100 and the photodetector 200 is in direct physical contact
with a surface of the sample
300 and the other is not. These geometries as described and illustrated in
FIG.s 1A-1D are non-limiting
examples and the systems and methods disclosed herein may be practiced with
any suitable
configuration of the system components.
[00471 During many embodiments, coherent light or at least partially coherent
light is emitted by the light
source 100 and directed toward the sample 300. The photodetector 200 is
positioned to recover at least
some of the light emitted by the light source 100 after it has interacted with
the sample 300 The light
emitted by the light source 100 may be emitted at a constant intensity over a
time sufficient for detection.
In other embodiments, the light may be emitted according to dynamic patterns.
In many embodiments,
the light may be emitted and detected over a period of time sufficient to
detect changes which occur in the
sample 300 and which alter the path of the emitted light and/or properties of
the detected light. The
processor 500 may be used to record the signal(s) detected by the
photodetector 200 over time and/or
analyze the signals and/or the temporal changes in the signals over time to
determine physiological
information about the sample 300.
[0048j FIG. 1E illustrates an example of an algorithm that may be performed by
the processor 500 to
determine one or more physiological parameters from light scattering particles
in a pulsatile motion within
a physiological system. The algorithm instructs the processor 500 to calculate
a contrast metric from the
input received from the photodetector 200. The algorithm instructs the
processor 500 to generate a
contrast waveform from the contrast metric and subsequently to decompose the
contrast waveform into
CA 03059804 2019-10-10
WO 2018/191745 PCT/US2018/027769
one or more characteristic features. The algorithm additionally instructs the
processor to make a
comparison using the one or more decomposed characteristic features and
determine the one or more
physiological parameters based on the comparison. As such, the algorithm shown
in FIG. 5A provides an
overview of the steps performed to determine the one or more physiological
parameters, and the details of
each steps are discussed further below.
[0049j FIG. 2 illustrates an example of an interrogation device 400
operatively coupled to a processor 500.
The interrogation device 400 can include the light source 100 and
photodetector 200 in an integrated or
joinable housing. As shown in FIG. 2, the interrogation device 400 may
comprise a finger clip for
interrogating blood flow within the digit of a subject. The finger clip 400
may be configured to operate in
any configuration (e.g., transmission or reflectance as well as contact or non-
contact). Some
embodiments of the interrogation device 400 may be configured to be wearable
or attachable to a subject.
These may include, but are not limited to, belts, wrist-bands, skin patches,
ear-clips, etc. The
interrogation device 400 may be operatively coupled to the processor 500 by a
data cable 402, which may
transfer data and/or power between the interrogation device 400 and the
processor 500. The data cable
402 may be a USB cable or any other suitable cable. In some embodiments, the
interrogation device 400
may include wireless functionality for operatively coupling to the processor
500. The processor 500 can
include a display 502 for displaying data, such as a detected waveform, an
image of a spectral pattern, a
histogram of data. etc.
(0050j FIG. 3 schematically illustrates the interaction of the components of
an example interrogation
device 400 and a computer. The processor 500 can be part of a computer, a
tablet, or any other suitable
device. The computer may further include a memory, a display, audio devices,
and/or other components.
The computer may comprise a PC USB hub for operatively coupling to the
interrogation device 400. In
some embodiments, a display 502 may be separate from the processor 500. In
some embodiments, the
interrogation device 400 can include a display. The interrogation device 400
can include the light source
100 (e.g., a laser diode) and/or the photodetector 200. In the example shown
in FIG. 3, the light source
100 and the photodetector 200 are configured in a transmission geometry around
a sample 300 of
physiological tissue. The processor 500 may both exchange information with the
photodetector 200, such
as receive generated signals, and the light source 100, such as send
instructions for controlling operation
of the light source 100. In some embodiments, the systems may incorporate
feedback for modulating the
emission of light from the light source 100 and/or the detection of light by
the photodetector 200 according
to an analysis of the detected light and/or generated signals by the processor
500.
[00511 FIG. 4 schematically depicts the interrogation of a physiological
sample 300 which comprises
vascularized tissue, according to an embodiment of the invention. In some
embodiments, including those
related to the interrogation of physiological tissue, the light emitted from
the light source 100 passes
through a turbid medium in which the light is scattered one or more times,
causing the light to diffuse.
Within the path of the diffuse light as it travels through the turbid
biological medium, there may be vessels
302 of many types The dotted arrows in FIG. 4 indicate the direction of blood
flow. The solid arrows in
FIG. 4 represent the vascular expansion of the vessels 302. The vessels 302
may contain light scattering
CA 03059804 2019-10-10
WO 2018/191745 PCT/US2018/027769
particles (i.e. light scatterers) undergoing motion, such as a steady or
pulsatile flow. For example, the red
blood cells 310 flowing through blood vessels can scatter and/or absorb the
light emitted by the light
source 100. Static scatterers 320 may also scatter light emitted by the light
source 100. Light traveling
through the turbid medium therefore may interact with the both the static base
tissue in addition to the
flowing blood, as illustrated in FIG. 4.
[0052) The flowing blood may impart two major changes on the photons
travelling through the sample 300.
First, hemoglobin contained within the red blood cells 310 is highly
absorptive at a range of useable
wavelengths which can be suitably emitted from the light source 100, and acts
to attenuate the intensity of
the light. Second, the flowing scatterers cause decorrelation of the coherent
light emitted by the light
source 100. The photodetector 200 is positioned relative to the light source
100 and sample 300 such
that at least some of the light emitted by the light source 100 is recovered
by the photodetector 200 after
diffusing through the sample 300. The photodetector 200 can measure the
intensity of the detected light
at each of its one or more pixels. The processor 500 operatively coupled to
the photodetector 200 may be
used to measure the attenuation and the decorrelation of the light traveling
from the light source 100 to
the photodetector 200. By performing the detection over a period of time
sufficient to capture a subject's
heartbeat (e.g., one or more cardiac cycles), pulsatile changes in the
attenuation or the decorrelation of
scattered light associated with the subject's heartbeat may also be measured.
100531 The pulsatile nature of blood pressure and cardiac output imparted by
the beating heart causes
there to be pulsatility in the net attenuation and decorrelation of coherent
light passing through the tissue.
The pulsatile attenuation of the light is hypothesized to represent increases
in vessel diameter due to
increased pressure. The change in red blood cell volume as a result of the
pulsatile pressure in the blood
vessels may modulate the absorption of light by the red blood cells. This is
the source of the
Photoplethysmogram (PPG) signal, typically defined as C*Ln(1 /I) where I is
intensity. Ln is the natural
logarithm and C is a multiplicative coefficient used to account for path-
length and the molar extinction
coefficient of blood The PPG signal, however, can be calculated in many other
ways and embodiments
of the invention may use any suitable derivation of the PPG signal.
10054j In addition to the PPG signal, the heartbeat also produces pulsatile
fluctuations in blood flow
velocity that modulate the correlation of coherent light passing through the
interrogated tissue. The
scattering of coherent light causes mutual interference in the light waves
which randomly alters the
intensity (i.e. the amplitude) of the scattered light and may result in
observable spatial patterns (i.e.
speckle patterns) in the intensity of scattered light, such as the light
detected by the photodetector 200.
When the coherent light is scattered by moving light scatterers, such as the
red blood cells 310
undergoing pulsatile flow, the intensity of observed light at any given point
(e.g., at a pixel of the
photodetector 200) may change over time as a result of the changing position
of the moving light
scatterers. The faster the moving light scatterer moves, the quicker the
intensity pattern changes and the
quicker the coherent light decorrelates. The decorrelation may be observed
both spatially and temporally.
Because the photodetector 200 cumulates light at each pixel over a finite
exposure time (i.e. shutter
speed), the changes in intensity that occur during that time, such as the
result of the moving scatterers,
12
CA 03059804 2019-10-10
WO 2018/191745 PCT/US2018/027769
will blur the detected image. The blurring is analogous to the way in which a
fast moving racecar may
appear blurry when captured by a slow-speed camera whereas a slower moving
pedestrian may appear
perfectly clear when captured by the same camera. Similarly, faster moving
light scatterers will reduce
the spatial contrast in an image detected by the photodetector 200, more than
slower moving light
scatterers. The exposure time of the photodetector 200 may affect the amount
of blurring (i.e. reduction in
contrast) observed.
100551 Faster moving light scatterers will also tend to cause more rapid
fluctuations at a given point in
space, such as at a single pixel, over time. The temporal effects of moving
light scatterers may therefore
also be observable at individual pixels over periods of lime longer than the
exposure time During such
time frames, faster moving light scatterers will cause more rapid fluctuations
in the detected intensity of a
single pixel than will slower moving light scatterers. Therefore, in some
embodiments, the systems and
methods may comprise a photodetector 200 with a single pixel or single
operative pixel. In
photodetectors 200 with multiple operative pixels, it may be possible to
attain multiple measures of
decorrelation over the same time period from multiple individual pixels or
from multiple groups of pixels.
[0056) The correlation of the scattered coherent light emitted from the light
source 100 can be measured
with the photodetecior 200 and extrapolated to blood flow in a number of ways.
The processor 500 may
be configured according to a programmed algorithm to derive a contrast metric
based on the intensity of
light detected by the photodetector 200 at one or more pixels al one point in
time or over a period of time.
A contrast metric may comprise any suitable quantification of the
decorrelation in the intensity of detected
light caused by the motion of moving light scatters within the sample 300. As
such, the contrast metric
may include any metric that measures contrast between pixels. In some
embodiments, the contrast
metric may be an inter-pixel contrast. In some embodiments, the contrast
metric may be an intra-pixel
contrast, without deviating from the scope of the invention. In some
embodiments, the contrast metric
may include one or more of the inter and intro pixel contrast, without
deviating from the scope of the
invention. One example of a contrast metric is the speckle contrast (K),
defined as sigma / <I> where
sigma is the standard deviation of the raw signal and <I> is the average
intensity. The standard deviation,
sigma, and average intensity. <I>, may be calculated from a sample of pixels
belonging to the
photodetector 200 according to standard mathematical calculations. Sigma is
the standard deviation of
ihe pixels in a single image formed by the pholodetector 200. The sample of
pixels may be a generally
contiguous arrangement of adjacent pixels. A pixel may be adjacent another
pixel if it shares a common
border portion, including an edge or a corner. The sample of pixels may be of
any suitable shape and/or
size for deriving the contrast metric. A size and/or shape of a sample of
pixels may be suitable (e.g. large
enough) for a particular sample 300 or type of sample if a broad enough range
of contrast is obseivable
over the sample of pixels, such that the contrast may be quantifiably
correlated to measures of the moving
light scatterers' motion with desirable precision. Faster moving light
scatterers may increase the amount
of blurring of pixels, thereby causing the standard deviation of the intensity
to decrease, and consequently
the speckle contrast will be lower. On the contrary, slower moving light
scatterers may decrease the
amount of blurring, thereby increasing the standard deviation, therefore
increasing the speckle contrast
In this way, the speckle contrast may be extrapolated lo blood flow.
13
CA 03059804 2019-10-10
WO 2018/191745 PCT/US2018/027769
(00571 Other suitable contrast metrics may be employed by the systems and
methods disclosed herein,
including the speckle flow index (defined as 1/K2 where K is the speckle
contrast as described herein), the
mean percent difference between pixels of the photodetector 200, the magnitude
of fluctuation in the pixel
intensities over time, reduction of the pixels to local binary patterns or
local ternary patterns, etc. An
autocorrelation performed on the signal generated by a single pixel over a
period of time may quantify the
temporal decorrelation in detected light intensity as a result of the motion
of the moving light scatterers.
[00581 The calculated speckle contrast relates, at least in part, to the
velocity of the moving light scatterers
and may be correlated to a flow rate of such light scatterers. The flow rate
may be determinable through
calibration of a given system in a particular configuration with samples of
known flow rates. The flow rate
may be a measure of the volume of fluid (e.g., blood) transported per unit of
time (i.e. volumetric flow) and
may be represented in any suitable units (e.g., mUs). In some embodiments, the
flow rate may be
determined as the velocity, or average velocity (e.g., m/s), of the moving
light scatterers within a sample
300. In some embodiments, the flow rate may be determined as a measure of
volumetric flux (e.g., mt.'s'
191) through the blood vessel(s).
100591 When measured rapidly over time or multiple time points, periodic
fluctuations in the flow rate may
be observed which reveal the heartbeat (i.e. the cardiac cycle). Despite the
specific process or
formulation, the measurement of a speckle signal generated by the flow of
light scatterers (a speckle flow
signal) may be derived from sampling the correlation of the coherent light
emitted by the light source 100
and detected by the photodetector 200. The systems and methods disclosed
herein may use any form of
this speckle correlation signal, which may be used to interrogate blood flow
and the pulsatildy therein, and
will be referred to herein as the Speckleplethysmogram (SPG).
[00601 Embodiments of the invention comprise systems and methods to produce
and analyze a waveform
associated with blood flow (SPG) and vessel volume (PPG) during the pulsatile
cardiac cycle. The
waveforms may be derived by the processor 500 from the signals generated by
the photodetector 200,
and/or in some embodiments another detector, and may comprise a single
determinable value for every
sampled point of time across a continuous sample of time. When values for
adjacent time points of a
waveform are connected, a smooth, continuous, and substantially periodic curve
pattern is formed. The
waveform may comprise a period, the interval of time that elapses during a
single cycle of the waveform
before it repeats itself, and a corresponding fundamental frequency the number
of cycles that occur over
a unit time (e.g., s or Hz). As a non-limiting example, the contrast metric
may be measured about 30
times in 1 sec to generate the SPG waveform. In other non-limiting examples,
the contrast metric may be
measured 250 times in 1 sec to generate the SPG waveform. In some embodiments,
the contrast metric
may be measured over multiple time points. As a non-limiting example, the
contrast metric may be
measured at five time points which are 1 second apart to generate the SPG
waveform.
(00611 An additional non-limiting example includes using a CMOS camera as a
photodetector which may
acquire images at a rate of 100 frames per second for 60 seconds. Each
acquired image may be used to
compute a single speckle contrast value by computing the standard deviation of
the intensity values within
14
CA 03059804 2019-10-10
WO 2018/191745 PCT/US2018/027769
each image by the average of the intensity values within each image. The
resulting speckle contrast
values, corresponding to an acquisition rate of 100 values per second, are
then plotted against their
respective time of acquisition resulting in an SPG waveform plot where speckle
contrast is plotted against
time for 60 seconds. A similar process may be followed to create a PPG
waveform by computing the
average of the pixel intensities within each image (rather than the speckle
contrast), and then plotting the
average intensity within each image and their time of acquisition. Because the
human cardiac cycle has a
period of approximately 1 second, approximately 60 oscillations will be
visible in the PPG and SPG
waveform due to changes in blood flow that accompany each heartbeat. For each
heartbeat, differences
in PPG and SPG waveform features may be analyzed. In some embodiments, SPG and
PPG data from
several heartbeats may be used for feature analysis where the results of such
analysis may represent the
average of all the included waveform data. Additionally or alternatively, in
the example above, speckle
contrast within the collected images may be computed by calculating the
standard deviation of pixel
intensity within a single pixel over multiple images and then dividing the
result by the average intensity of
that pixel over the same group of images. The singular speckle contrast may
then be computed by, for
example, computing the average of the resulting array of speckle contrast
values computed within each
pixel. Such temporal computations of speckle contrast may be combined with
spatial computations of
speckle contrast by computing the standard deviation of pixel intensities
within a group of pixels in a
single image, as well as the intensity values of those pixels in other images,
and then dividing this value
by average pixel intensity value within this same group of pixels over time.
100621A single cycle of the waveform may be considered a pulse. The SPG signal
may be analyzed
independently or may be compared to the PPG signal, and then related to a
physiological parameter. The
systems of some embodiments may comprise the coherent light source 100 which
is configured to
illuminate a turbid sample, the photodetector 200 which is configured to
record the remitted speckle
pattern, and/or a processor 500 for analyzing the detected signal(s) and
generating physiological relevant
data. The speckle pattern may be used to determine blood flow and blood volume
during the pulsatile
cardiac cycle of an interrogated subject, which produces the SPG and PPG
waveforms. The two distinct
signals - derived from the coherent light of a single light source 100 - may
be acquired, processed and
analyzed to provide information related to the physiology and pathology of the
subject.
100631in some embodiments, relevant physiological information may be obtained
directly from the signals.
A signal may be decomposed into one or more of its characteristic features,
which may be identified and
extracted from the signal by the processor. Physiological parameters may be
determinable by comparing
characteristic features of a waveform to characteristic features of the same
waveform or another
waveform. Various features of the signals may comprise embedded information
descriptive of
physiological parameters. A characteristic feature may comprise any
determinable characteristic of the
signal which is related to or descriptive of some physiological information.
These may include, but are not
limited to, the timing of peaks or other discernible shapes that are
repetitive in the waveform, magnitudes
of slopes (e.g. of a peak), peak sharpness (e.g. width or height-to-width
ratio), amplitudes of peaks,
differences in amplitudes between peaks, etc. Both pulsatile and non-pulsatile
amplitudes of the
waveforms can provide useful physiological information. Pulsatile amplitudes
can include any part of the
CA 03059804 2019-10-10
WO 2018/191745 PCT/US2018/027769
waveform feature that originates from the cardiac pulse, while non-pulsatile
amplitudes may characterize
effects that do not originate in the cardiac pulse (e.g., motion of the
patient, ambient light interference,
etc.). For example, a non-pulsatile amplitude may characterize the flow
amplitude after purposefully
obstructing the pulse through arterial occlusion (e.g., via an inflatable arm
cuff).
100641 Comparisons of features can include, but are not limited to,
comparisons of quantifiable values and
the relative timing of features. Comparisons may be quantitative or
qualitative. Quantitative comparisons
may include, for example, the difference or ratio between the magnitudes of
features (e.g., peak
amplitudes) or the timing of features (e.g., a time delay). Qualitative
comparisons may include a
determination of which feature has a greater or lesser quantified value, which
waveform has more or
fewer of a feature or type of feature, or which feature occurred earlier or
later in time For example, a
characteristic feature may be the number of occurrences of local extrema or
the timing occurrences of
local extrema. The local extrema may comprise time points in which the
waveform experiences a relative
maximum or minimum value over a period of time. The local extrema may include
any point where the
derivative changes from positive to negative or vice-versa and is therefore
zero (as best determinable by
the processor 500). The processor 500 may count the number of occurrences of a
maxima, minima, or
both within one or more pulses of a waveform, which may be indicative of
pulsatility of the waveform The
processor 500 can also determine the timing of the extrema, which may be used
to determine time delays
within the signal or between two signals.
100651 In some embodiments, the methods of analyzing the waveforms generated
by the photodetector
200 and/or other detectors comprises a decomposition of the one or more of the
waveforms into basis
functions and respective amplitudes. Each basis function may comprise a
mathematical expression
relating a dependent variable to an independent variable. The dependent
variables for each basis
function may be scaled (i.e. multiplied) by a single coefficient (i.e.
respective amplitude) so that a linear
combination or superimposition of the basis functions scaled by their
respective amplitudes approximates
the waveform or a representation of the waveform over a range of the
independent variable. The basis
functions may be any generalized basis functions. Physiological parameters may
be determinable by
comparing the amplitudes of the basis functions. As an example, the basis
functions may include a
periodic basis function, a wavelet basis function, and the like. As a non-
limiting example, an SPG
waveform may be analyzed by performing a Fourier transform on the waveform.
Using this method, the
waveform may be decomposed using a sinusoidal basis function. The Fourier
transform of the SPG
waveform thus provides the amplitude and frequency of sinusoids needed to
construct the waveform. If
SPG data is acquired over time, an increase in the amplitude of relatively
high frequencies within the
Fourier transformed SPG waveform may indicate increasing vasoconstriction.
This is because increases
in vascular tone are often accompanied by an increase in the systolic upstroke
within a blood flow-based
derived waveform. In another non-limiting example, the Fourier transform of
continuously collected SPG
data may be used to compute an amplitude ratio of one relatively low frequency
(e.g. 1 Hz) to one
relatively high frequency (e.g. 50 Hz) from each pulse waveform to create a
continuous relative measure
of vascular tone. As such, the comparisons may include, but are not limited
to, a determination of which
basis function has the greater/lesser amplitude, the difference in amplitudes,
and/or the ratio of one
16
CA 03059804 2019-10-10
WO 2018/191745 PCT/US2018/027769
amplitude to another.
100661 In some embodiments, the basis functions may be selected so that the
decomposition results in a
signal that is dependent on an independent variable other than time. For
example, the decomposition
may transform the waveform from being a time-dependent function into a
frequency-dependent function,
which can be described by the superimposition of scaled frequency-dependent
basis functions (i.e. a time-
frequency transformation). In such a manner, the decomposition may be
equivalent to performing a
Fourier transform on the time-dependent waveform. In many embodiment methods,
the basis functions
may be periodic (e.g. sinusoidal) and the frequencies of each basis function
may be integer multiples of a
fundamental frequency of the waveform (i.e. harmonics). The first harmonic can
be defined as equivalent
to the fundamental frequency. The waveforms may be decomposed into basis
functions that define other
spaces as well (i.e., defined by independent variables other than time or
frequency).
100671 In some embodiments, the methods of analysis comprise various steps for
analyzing the
decomposed SPG signal alone to recover a physiological parameter. In other
embodiments, the methods
of analysis comprise steps for comparing the SPG signal to a second signal,
wherein the second signal is
of a physiological origin distinct from that of the contrast metric (i.e. the
speckle flow signal). For example,
the second signal may relate to a metric of photo-intensity, rather than a
metric of contrast, such as the
PPG signal, which originates in the periodic volumetric expansion of the
vasculature, rather than the
periodic change in flow rate. The detected photo-intensity metric may be
converted into a metric of
absorption This conversion may be performed numerically using the radiative
transport equation or
estimated through one of various diffusion approximations. For example, the
metric of absorption may be
approximated by using the Beer-Lambert law with a-priori estimate for mean
path-length. The Beer-
Lambert law states that the percent of intensity transmitting through a sample
is inversely related to the
exponential of absorption coefficient times the path length. The metric of
absorption can also be
approximated by the inverse intensity of the detected signal
100681 The second signal may originate from any reference signal including but
not limited to an ECG
signal, PPG signal, a blood pressure signal, other measures of cardiac output,
etc. In some
embodiments, the ECG signal or other reference signal may be used in the
absence of, or as a substitute
for the PPG signal. The SPG signal and reference signal may each be thought of
as modified carrier
waves, wherein the carrier wave is a simple waveform (e.g. a sinusoidal
waveform) representing the
periodicity of the cardiac cycle and the modifications of the carrier wave
comprise embedded physiological
information. In some embodiments the reference signal may not be a waveform.
For example, the
reference signal may be a single value, a collection of intermittently sampled
values, or an average value
over a continuous sampling period (e.g., blood pressure readings).
100691 Some features may be intrinsic to the dynamics of each signal alone and
other features may relate
to a comparison of the signals. Features that are intrinsic to each signal may
be described by the
amplitudes of selected basis functions or by the ratios of the amplitudes
(i.e. coefficients) of selected basis
functions. In the case of frequency-dependent basis functions, the ratios may
be harmonic ratios. The
17
CA 03059804 2019-10-10
WO 2018/191745 PCT/US2018/027769
ratios may be calculated by dividing the resolved amplitude of one basis
function by the resolved
amplitude of another basis function. In some embodiments, one or more ratios
are calculated for each
pulse (i.e. cycle) in the recorded waveform over a sample period of time
(e.g., 100 pulses, 500 pulses,
1000 pulses, 5,000 pulses, 10,000 pulses, etc.). The ratios may be simple or
complex and may include
sums, differences, products, and quotients of amplitudes or other suitable
mathematical operations. The
variability across the distribution of pulses may relate to a physiological
parameter. The method of
analysis may comprise determining a distribution of ratio values for the
sample of pulses. In doing so, the
processor 500 may generate a histogram, in which a continuous range of ratio
values are discretized and
the number of sampled pulses exhibiting a ratio value that falls within each
discretized range are tabulated
(a graphical representation of the histogram does not necessarily need to be
displayed).
100701 FIG. 5 illustrates an example of an algorithm that may be performed by
the processor 500 to
calculate descriptive statistics on an SPG signal generated by the processor
500 from input received from
the photodetector 200. The algorithm instructs the processor 500 to extract
single pulses from the SPG
signal or SPG waveform, append the extracted pulse to itself 1000 times,
perform a Fast Fourier
Transform (FFT), use a peak-finding routine to calculate a harmonic ratio, and
repeat the process for each
sequential pulse identified in the data set derived from the SPG signal. Once
every pulse is completed,
the processor 500 may generate statistics describing the distribution of
calculated harmonic ratios within
the data set.
10071j Features that take into account both signals include, but are not
limited to: timing differences
between distinct features in PPG signal and SPG signal (e.g., the signal peak,
systolic peak, diastolic
peak, dicrotic notch, the minimum (i.e. "foot"), etc.), differences between
the full-width-half-maxima,
differences between slopes, differences between peak sharpness, the phase
difference of the carrier
wave, and the relative magnitudes (i.e. amplitudes) of carrier wave harmonics.
For example, one or more
harmonic ratios of the SPG signal may be compared to the same harmonic ratios
in the reference signal
(e.g. a ratio of ratios). The harmonic ratios can characterize the pulsatility
of a signal (i.e. larger harmonic
ratios characterize more pulsatile signals) and the comparison of the harmonic
ratios may be indicative of
tissue health. For instance, someone with advanced vessel disease may display
a relatively pulsatile
SPG signal and a relatively weak PPG signal, with much smaller harmonic ratios
For example, the ratio
of the 3rd harmonic to the 5th harmonic may be used to characterize
pulsatilfty. The methods may
comprise any useful comparison of the SPG signal to a reference signal for
extracting the timings of
features and/or comparing features, which are descriptive of physiological
parameters. The embodiments
disclosed herein generally relate to the structure and timing features of the
SPG signal. These timing
features can be derived from one of several technologies including but not
limited to PPG or ECG.
100721 FIG. 6 illustrates an example of an algorithm that may be performed by
the processor 500 to
calculate the lime delay between a detected SPG signal and a detected PPG
signal. The processor 500
may generate the SPG signal and the PPG signal from the same raw input signal
received from the
photodetector 200. The SPG signal can be generated by calculating a measure of
inter-pixel contrast in
the raw signal detected by the pholodetedor 200. The PPG signal can be
generated by calculating the
18
CA 03059804 2019-10-10
WO 2018/191745 PCT/US2018/027769
DC-averaged intensity of the raw signal detected by the photodetector 200 Both
signals may be
additionally filtered by the processor 500. The processor 500 may employ a
peak-finding algorithm to
locate peaks within the SPG and PPG signals and calculate a series of time
delays between
corresponding peaks.
100731 The SPG waveform decomposition method may include but is not limited
to: Fourier decomposition
to determine harmonic amplitudes, wavelet decomposition, decomposition into
non-continuous basis
functions (e.g., comb or rectangle functions), and abstract feature
decomposition Abstract feature
decomposition decomposes the waveform into abstract features (i.e. one or more
non-continuous
quantitative values, determinable and comparable by the processor 500, which
describe one or more
characteristic features of the waveform) Abstract decomposition, for example,
can include decomposition
of a waveform into characteristic features, including but not limited to, the
timing of peaks, a count of the
integer number of distinctive peaks within a particular time period, the count
of the integer number of
times that the waveform breaches a particular amplitude, and/or other
characteristic features described
herein. In some instances, the features may be a binary description of whether
a certain criterion is met
(e.g., whether the systolic peak is 50% higher than the diastolic trough).
100741 In addition to decomposing waveforms, the processor 500 may generate
and/or display useful
representations of the data, such as histograms and scalograms. For example,
the processor 500 may
generate a scalogram as a representation of the amplitudes of a wavelet
transform. FIG. 7A illustrates an
example of an algorithm that may be performed by the processor 500 to extract
physiological parameters
from SPG and PPG signals generated from detector 200 input using the processor
500 to perform a
wavelet transform on extracted subsets of data from the signals. Wavelet
transforms advantageously
provide frequency information on all time points, without the need to select a
section for analysis (e.g., as
with a FFT). FIG.s 78 and 7C illustrate examples of SPG signals (bottom)
generated by a processor from
detector input and scalograms (top) generated by a processor from the SPG
signals. FIG. 78 illustrates
baseline data collected on a subject with normal vascular tone. FIG. 7C
illustrates data collected from the
same subject post-exercise (vasodilation conditions). As shown in FIG.s 78 and
7C, increasing arterial
resistance may be correlated with decreased higher frequency arterial
components, as indicated by the
lower scale values, generally at all sampled time values, for higher
frequencies (e.g., 5-6Hz) in FIG. 7C
relative to FIG. 78
EXAMPLES
[00751 The following are specific examples of the systems and methods
presented herein.
Example 1: SPG-PPG time delay
100761 The example here demonstrates the extraction the time-delay between the
SPG and PPG signals.
The SPG signal, which is representative of the blood flow velocity, has
slightly different morphological
characteristics than the PPG signal, which is representative of the tissue
vascular expansion. One
contrasting feature between the PPG and SPG signals is that the PPG signal
peak (i.e. the maxima within
a pulse) lags the SPG peak in time. Different repetitive features in each
signal such as the peak or the
19
CA 03059804 2019-10-10
WO 2018/191745 PCT/US2018/027769
trough (i.e. the minima within a pulse) can be used to measure this timing
offset between the peaks.
100771 FIG. 8A shows the raw detected SPG and PPG signals in blue and red,
respectively, over the same
time frame. The slight timing offset between the two signals in this example
(indicated by the black lines)
is visually discernible. Measurement of the timing offset provides meaningful
physiological information.
FIG. 8B shows the average time-delay of four subjects in three different
physiological conditions. The
squares were acquired post-exercise, the diamonds were acquired at a baseline,
and the circles were
acquired during a cold-pressor challenge (the cold pressor challenge consists
of submerging the subject's
hand in ice water for around 30 seconds). This data demonstrates that the
timing offset features are
related to vascular tone. Vascular tone may refer to ihe degree of
constriction experienced by a blood
vessel relative to its maximally dilated slate. Exercise relaxes vasculature
to increase blood flow while the
cold-pressor constricts vasculature to reduce blood-flow. The data shows that
larger timing offsets are
experienced for all subjects when the blood vessels are relatively
constricted. The increase in vascular
tone (i.e. arterial stiffness) may cause a delayed and/or an attenuated
elastic expansion of the vessel.
The result can be detected in the timing offset and/or peak sharpness of the
detected PPG signal relative
to the SPG signal. Finally, FIG. 8C shows the correlation between the average
time-delay and subject
age. In this study, a baseline signal was recorded and signals were then
continually recorded as the
subjects underwent arterial occlusion and recovery by applying a blood
pressure cuff to the subjects' arms
and cyclically pressurizing the cuff (e.g., 100-220 mmHg for no more than 3
minutes) and then quickly
depressurizing the cuff (e.g., 3-5 minute recovery). In doing so, the
subjects' interrogated blood vessels
are expected to cycle between vasoconstridive and hyperemia-induced dilated
conditions. The time
delay for each subject in FIG. 8C was averaged during post-hyperemia
vasodilation. The data shows that
the timing offset tends to increase with age. The r-squared coefficient of
this correlation is 0.8 and
indicates that time-delay may be a sensitive measurement for atherosclerosis
associated with the aging
process. Atherosclerosis can reduce blood vessel compliance and, like vascular
tone, may delay and/or
attenuate the filling of the interrogated blood vessel. Therefore, the
measured time delay between the
detected PPG signal and SPG signal may be predictive of atherosclerosis.
Example 2: SPG Harmonic Content
100781 This example demonstrates the recovery of physiological information
from independent analysis of
ihe dynamics of the SPG signal. As pulsatile flow travels from the heart to
the extremities the input
impulse is distorted by several vascular characteristics that include the
atherosclerotic obstruction, arterial
branching, vascular compliance and blood pressure. By analyzing the frequency
content of the SPG
waveform on a pulse-by-pulse basis it is possible to recover these
characteristics quantitatively. FIG.s
9A-9E demonstrates a method for extracting the frequency domain harmonic
content from a detected
SPG signal. A single pulse is first identified within time-series data by the
processor 500 (FIG. 9A),
extracted by the processor 500 (FIG. 9B), appended to itself numerous times
such as, for example, 1000
times (FIG. 9C), and then frequency transformed via FFT in order to produce a
harmonic spectrum that
approximates a Fourier Series Expansion (FIG. 9D). This spectrum is then used
to calculate a harmonic
ratio based off any two harmonics. This process is then repeated for every
single pulse within a given
data set producing a distribution of harmonic ratios, as illustrated in FIG.
9E. The harmonic ratio may be
CA 03059804 2019-10-10
WO 2018/191745 PCT/US2018/027769
defined relative to the fundamental frequency (e.g., the second harmonic
ratio. Harmonic Ratio 2
(SPGHR2), is the ratio of the second harmonic to the fundamental frequency and
so on) or between each
other (e.g., Harmonic Ratio 3-2 is the ratio of the third harmonic to the
second harmonic and so on).
[00791 FIG. 10 depicts the correlation between the third harmonic ratio of the
SPG signal (SPGHR3) and
subject age. It shows a strong inverse correlation between the third harmonic
ratio and age, indicating
that frequency content, as derived by the disclosed systems and methods
herein, decrease as individuals
get older. Frequency content (i e. harmonic content) can generally be
described as the frequency
components of a waveform. Harmonic content may be correlated with overall
vascular health. II has
been shown in the literature that the pulsatile frequency content (relatively
higher frequencies) decreases
with age due to index mismatch at arterial branches that attenuates high
frequency signal components.
The refractive index between the liquid and vessel influences the propagation
of a velocity wave down a
vessel and can be affected by the cross-sectional area and elastic composition
of an artery. Healthy
vasculature is generally well-matched in the refractive indexes between parent
and daughter vessels at
vessel branching points. Atherosclerosis can affect both the elasticity and
cross-sectional area of blood
vessels and therefore the refractive index of blood vessels. As the refractive
index is dependent on the
cross-sectional area of the blood vessels, atherosclerosis can affect the
refractive index of larger parent
vessels differently from how it affects the refractive indexes of smaller
daughter vessels. Atherosclerosis
may result in index mismatch between parent vessels and daughter vessels. The
systems and methods
disclosed herein may be used to quantify harmonic content and/or characterize
vascular health of a
subject. The determined physiological information may be indicative of index
mismatch at sites of arterial
branching, which may be predictive of atherosclerosis.
Example 3: Further Evidence of Clinical Utility
[00801 Using both the timing comparison between the two signals as well as the
frequency content derived
from the structure of the SPG, it was possible to separate two distinct
patient groups. The first group
consisted of individuals aged 50+ who have some combination of cardiovascular
risk factors. The second
group consisted of healthy controls under the age of 35 FIG. 11 depicts a
scatter plot of the subjects (the
first group indicated by triangles and the second group indicated by circles)
with resped to their liming
offset (i.e. lime-delay) and their measured third harmonic ratio, as
determined by ihe systems and
methods disclosed herein. As shown in FIG. 11, the two groups can be
discernably separated within ihe
scatter plot based on the time-delay and the third SPG harmonic ratio. In
general, the first group, which
comprises older subjects with cardiovascular risk factors, tend to have larger
timing-offsets and lower third
harmonic ratios than the second group, comprising younger healthy subjects,
which generally positions
the first group in the upper left portion of the scatter plot and the second
group in the lower right portion of
the scatter plot. The combined timing-delay and third harmonic ratio may
therefore be a useful factor
(along with age) in diagnosing cardiovascular disease. The systems and methods
disclosed herein may
have other potential clinical applications as well.
(00811 While the present invention has been described in terms of particular
embodiments and
applications, in both summarized and detailed forms, it is not intended that
these descriptions in any way
21
CA 03059804 2019-10-10
WO 2018/191745 PCT/US2018/027769
limit its scope to any such embodiments and applications, and it will be
understood that many
substitutions, changes and variations in the described embodiments,
applications and details of the
method and system illustrated herein and of their operation can be made by
those skilled in the art without
departing from the spirit of this invention.
100821 Various modifications of the invention, in addition to those described
herein, will be apparent to
those skilled in the art from the foregoing description Such modifications are
also intended to fall within
the scope of the appended claims. Each reference cited in the present
application is incorporated herein
by reference in its entirety.
100831 Although there has been shown and described the preferred embodiment of
the present invention,
it will be readily apparent to those skilled in the art that modifications may
be made thereto which do not
exceed the scope of the appended claims. Therefore, the scope of the invention
is only to be limited by
the following claims. Reference numbers recited in the claims are exemplary
and for ease of review by
the patent office only, and are not limiting in any way. The figures presented
in this patent application may
or may not be drawn to scale, including the angles, ratios of dimensions, etc.
In some embodiments, the
figures are representative only and the claims are not limited by the
dimensions of the figures In some
embodiments, descriptions of the inventions described herein using the phrase
"comprising" includes
embodiments that could be described as "consisting of", and as such the
written description requirement
for claiming one or more embodiments of the present invention using the phrase
"consisting of" is met.
[00841 The reference numbers recited in the below claims are solely for ease
of examination of this patent
application, and are exemplary, and are not intended in any way to limit the
scope of the claims to the
particular features having the corresponding reference numbers in the
drawings.
22