Note: Descriptions are shown in the official language in which they were submitted.
CA 03062870 2019-10-29
WO 2017/190044
PCT/US2017/030178
METHODS FOR DETECTING AND TREATING PAIN USING BRAIN ACTIVITY
FIELD OF THE INVENTION
The invention features methods for detecting pain using brain activity as
determined by, e.g.,
electroencephalography (EEG), particularly for the diagnosis and treatment of
pain and for screening of
therapeutic agents that treat or prevent pain.
BACKGROUND
Rhythmic activity in field potentials, referred to as oscillation, is an
essential mode of
communication between neuronal ensembles. Recordings of brain activity
invariably feature oscillation at
multiple frequencies. Oscillation in the brain is thought to require cortical
layer hierarchy and recruitment
of subcortical structures, such as the thalamus. Neuronal oscillation plays a
crucial, though as of yet
incompletely defined, role in health and disorders of thought and cognition,
such as autism and
schizophrenia. For instance, pain modulates brain oscillation in animals,
including humans. Recent
studies using functional magnetic resonance imaging (fMRI) suggest that
chronic pain alters functional
connectivity between brain structures relevant to nociceptive processing.
However, temporal resolution of
fMRI (-1 Hz) is well below the frequency domain of fast neuronal 'spiking'
activity (typically above 500 Hz)
or neuronal oscillation related to cognition (between 2-250 Hz). Notably,
animals used in fMRI studies are
deeply anesthetized or head-restrained, and thus, do not reflect the
physiology and different pain states
of awake, freely-behaving animals.
Pain is a major symptom in many medical conditions and can significantly
interfere with a
patient's quality of life and general functioning. The financial burden
associated with chronic pain in the
United States is estimated to be greater than $150 billion a year, due to
decreased productivity and
medical expenses. Accordingly, there exists a need in the medical field to
develop safe and effective
methods of detecting pain and the use of these methods to determine
efficacious therapies for the diverse
diseases and disorders associated with pain. Thus, methods capable of
detecting and monitoring pain
are highly desirable.
SUMMARY OF THE INVENTION
Disclosed are methods to detect and treat pain in subjects (such as a mammal
(e.g., a human))
using brain activity, e.g., as determined by electroencephalography (EEG).
Additionally, methods of
screening for a therapeutic agent that treats or prevents pain in a subject
(e.g., a non-human mammal)
are disclosed. The invention also features methods of treating or reducing
pain in a subject (e.g., a
human) by stimulating thalamic reticular nucleus (TRN) in the subject (e.g., a
non-human mammal or a
human), such as with electrical stimulation, optogenetic stimulation (e.g.,
using a laser-emitting optic fiber
adapted for implantation in the brain of the subject), a therapeutic agent,
thermal stimulation, or
ultrasound stimulation. Accordingly, the invention can include a closed-loop
system featuring, e.g., a
therapeutic agent or neuromodulatory device.
A first aspect of the invention features a method for detecting pain in a
subject (such as a
mammal (e.g., a human)). The method includes (a) recording waveforms in brain
tissue of the subject by
EEG; (b) applying fast Fourier transfer (FFT) to convert the waveforms from
the time domain to the
1
CA 03062870 2019-10-29
WO 2017/190044
PCT/US2017/030178
frequency domain, thereby producing power spectral density (PSD); and (c)
determining power amplitude
from the PSD, in which an increase in the power amplitude from baseline serves
as an indicator of pain.
In some embodiments, the pain is selected from the group consisting of acute
pain, inflammatory pain,
and neuropathic pain. Preferably, the method further includes determining
connectivity between brain
regions, such as the coherence of brain regions from PSD, cross-frequency
coupling, or Granger
causality analyses.
For example, the method can further include the step of (d) determining
coherence of brain
regions from the FFT, in which an increase in the coherence of brain regions
(e.g., the primary
somatosensory cortex and prefrontal cortex) serves as an indicator of pain. In
particular, the coherence
of brain regions is determined from the difference in coherence at individual
frequency units or frequency
bands (e.g., about 3 Hz to about 30 Hz). For example, an increase in the
coherence of brain regions
indicates a transition from acute pain to chronic pain.
In some embodiments, the method can further include the step of administering
a therapeutic
agent to the subject (such as a mammal (e.g., a human)), e.g., to determine an
effective amount of the
therapeutic agent for the treatment or prevention of pain. In particular,
there can be a decrease in the
power amplitude after administering the therapeutic agent relative to
baseline. Additionally, there can be
a decrease in the coherence of brain regions after administering the
therapeutic agent relative to
baseline. The determining can also include repeating steps (a)-(d) of the
method after administration of
the therapeutic agent.
In some embodiments, the method can be performed on a second subject, e.g., in
which the
power amplitude from the PSD of the subject is compared to the second subject.
Moreover, the method
can be performed on the subject one or more times. The method can also be
performed on a subject
under anesthesia or during surgery.
The method of the first aspect can further include stimulating thalamic
reticular nucleus (TRN) in
the subject (e.g., a non-human mammal or a human), such as with electrical
stimulation, optogenetic
stimulation (e.g., using a laser-emitting optic fiber adapted for implantation
in the brain of the subject), a
therapeutic agent, thermal stimulation, or ultrasound stimulation. For
example, a therapeutic agent can
act on GABAergic neurons, such as therapeutic agents that target GABA
receptors (e.g., barbiturates,
bamaluzole, gabamide, y-Amino-P-hydroxybutyric acid (GABOB), gaboxadol,
ibotenic acid, isoguvacine,
isonipecotic acid, muscimol, phenibut, picamilon, progabide, quisqualamine, SL
75102, or thiomuscimol)
or GABA transmitter uptake/trafficking (e.g., 0I-966, deramciclane (EGIS-
3886), gabaculine, guvacine
(010149), nipecotic acid, NNC 05-2090, NNC-711, SKF-89976A, SNAP-5114,
tiagabine, or hyperforin).
In particular, there is a decrease in pain after stimulation of the TRN in the
subject. The decrease
in pain can be determined by repeating steps (a)-(c) of the method of the
first aspect, e.g., in which a
decrease in a theta frequency band from baseline indicates a reduction in pain
of the subject. In
particular, the TRN stimulation is at a frequency sufficient to treat or
reduce pain, such as about 0.2 Hz to
about 60 Hz (e.g., about 0.2 Hz, about 0.5 Hz, about 1 Hz, about 5 Hz, about
10 Hz, about 15 Hz, about
20 Hz, about 25 Hz, about 30 Hz, about 35 Hz, about 40 Hz, about 45 Hz, about
50 Hz, about 55 Hz, or
about 60 Hz).
A second aspect of the invention features a method of treating or reducing
pain in a subject (such
as a mammal (e.g., a human)) by (a) recording waveforms in brain tissue of the
subject by EEG; (b)
2
CA 03062870 2019-10-29
WO 2017/190044
PCT/US2017/030178
applying FFT to convert the waveforms from the time domain to the frequency
domain, thereby producing
PSD; (c) determining power amplitude from the PSD; and (d) administering a
therapeutic agent to the
subject if there is an increase in the power amplitude from baseline. In some
embodiments, the pain is
selected from the group consisting of acute pain, inflammatory pain, and
neuropathic pain. Preferably,
the method further includes determining connectivity between brain regions,
such as the coherence of
brain regions from the FFT, cross-frequency coupling, or Granger causality
analyses.
For example, the method can further include the step of (d) determining
coherence of brain
regions (e.g., the primary somatosensory cortex and prefrontal cortex) from
the PSD, in which an
increase in the coherence of the brain regions serves as an indicator of pain.
In some embodiments, the
coherence of brain regions is determined from the difference in coherence at
individual frequency units or
frequency bands (e.g., about 3 Hz to about 30 Hz). For example, an increase in
the coherence of brain
regions indicates a transition from acute pain to chronic pain.
The method can further include the step of determining an effective amount of
the therapeutic
agent for the treatment or prevention of pain in the subject (such as a mammal
(e.g., a human)). For
instance, if the therapeutic agent is effective, there can be a decrease in
the power amplitude or
coherence of brain regions after administering the therapeutic agent relative
to baseline. The determining
can further include repeating steps (a)-(d) of the method after administration
of the therapeutic agent.
The method can also include administering one or more additional therapeutic
agents to the
subject. Furthermore, the determining can be performed, e.g., one or more
times an hour, one or more
times a day, or one or more times a month.
A third aspect of the invention features a method of screening for a
therapeutic agent that treats
or prevents pain in a subject (e.g., a non-human mammal). This method includes
the steps of: (a)
administering an agent to the subject that results in behavior associated with
pain (e.g., hindpaw licking
and flinching); (b) recording waveforms in brain tissue of the subject by EEG;
(c) applying FFT to convert
the waveforms from the time domain to the frequency domain, thereby producing
PSD; (d) determining
power amplitude from the PSD; (e) administering a test therapeutic agent to
the subject; and (f) repeating
steps (b)-(d), in which a decrease in the power amplitude relative to baseline
indicates that the test
therapeutic agent treats or prevents pain in the subject. In some embodiments,
the pain is selected from
the group consisting of acute pain, inflammatory pain, and neuropathic pain.
Preferably, the method
further includes determining connectivity between brain regions, such as the
coherence of brain regions
from FFT, cross-frequency coupling, or Granger causality analyses.
For example, the method can further include the step of determining coherence
of brain regions
(e.g., the primary somatosensory cortex and prefrontal cortex) from the PSD of
the subject (e.g., a non-
human mammal). In one embodiment, the coherence of brain regions (e.g., the
primary somatosensory
cortex and prefrontal cortex) is determined from the difference in coherence
at individual frequency units
or frequency bands (e.g., about 3 Hz to about 30 Hz). For example, a decrease
in coherence of brain
regions relative to baseline indicates that the test therapeutic agent treats
or prevents pain in the subject
(e.g., a non-human mammal).
A fourth aspect of the invention features a method of treating or reducing
pain in a subject (e.g., a
non-human mammal or a human) that includes stimulating TRN in the subject with
electrical current or
using a laser-emitting optic fiber adapted for implantation in the brain of
the subject. The method can also
3
CA 03062870 2019-10-29
WO 2017/190044
PCT/US2017/030178
include TRN stimulation using, e.g., a therapeutic agent, thermal stimulation,
or ultrasound stimulation, to
treat or reduce pain the subject. For example, a therapeutic agent can act on
GABAergic neurons, such
as therapeutic agents that target GABA receptors (e.g., barbiturates,
bamaluzole, gabamide, y-Amino-P-
hydroxybutyric acid (GABOB), gaboxadol, ibotenic acid, isoguvacine,
isonipecotic acid, muscimol,
phenibut, picamilon, progabide, quisqualamine, SL 75102, or thiomuscimol) or
GABA transmitter
uptake/trafficking (e.g., 0I-966, deramciclane (EGIS-3886), gabaculine,
guvacine (010149), nipecotic
acid, NNC 05-2090, NNC-711, SKF-89976A, SNAP-5114, tiagabine, or hyperforin).
The TRN stimulation is at a frequency sufficient to treat or reduce pain
(e.g., acute pain,
inflammatory pain, or neuropathic pain), such as about 0.2 Hz to about 60 Hz
(e.g., about 0.2 Hz, about
0.5 Hz, about 1 Hz, about 5 Hz, about 10 Hz, about 15 Hz, about 20 Hz, about
25 Hz, about 30 Hz, about
35 Hz, about 40 Hz, about 45 Hz, about 50 Hz, about 55 Hz, or about 60 Hz).
The method can further
include determining a theta frequency band in brain tissue of the subject
after the TRN stimulation, such
that a decrease in the theta frequency band from baseline indicates a
reduction in pain of the subject.
For example, the method can further include: (a) recording waveforms in brain
tissue of the subject by
EEG; (b) applying fast FFT to convert the waveforms from the time domain to
the frequency domain,
thereby producing PSD; and (c) determining a theta frequency band from the
PSD, such that a decrease
in the theta frequency band from baseline indicates a reduction in pain of the
subject.
In any of the above aspects, the waveforms can be recorded with one or more
sensors (e.g., one
or more electrodes) positioned on the skull of the subject. The waveforms can
also be recorded with one
or more sensors (e.g., one or more electrodes) attached to the scalp of the
subject.
In any of the above aspects, the waveforms can be recorded at sample
frequencies of about 2Hz
to about 35,000 Hz (e.g., sample frequencies of about 10 Hz to about 300 Hz).
Additionally, brain activity
can be recorded, e.g., by magnetoencephalography (MEG,) functional magnetic
resonance imaging
(fMRI), or positron emission tomography (PET).
Definitions
As used herein, "a" or "an" means "at least one" or "one or more" unless
otherwise indicated. In
addition, the singular forms "a," "an," and "the" include plural referents
unless the context clearly dictates
otherwise. Thus, for example, reference to a composition containing "a
therapeutic agent" includes a
mixture of two or more therapeutic agents.
As used herein, "about" refers to an amount 10 of the recited value.
As used herein, "acute pain" refers to a type of pain that typically lasts
less than three to six
months and/or pain that is directly related to soft tissue damage. Acute pain
may follow non-neural tissue
injury, for example, tissue damage from surgery or inflammation. Acute pain is
of short duration and
gradually resolves as the injured tissues heal.
As used herein, "chronic pain" refers to a type of pain that lasts longer than
three to six months
and/or pain that extends beyond the expected period of tissue healing. Chronic
pain may originate with
an initial trauma/injury or infection, or may be an ongoing cause of pain
associated with neuropathic pain
(e.g., diabetic peripheral neuropathy, post-herpetic neuralgia, trigeminal
neuralgia, phantom limb pain,
carpal tunnel syndrome, sciatica, pudendal neuralgia, complex regional pain
syndrome, sensory
polyneuropathies, mono-neuropathies, or central pain syndrome), headaches,
joint pain, backaches,
4
CA 03062870 2019-10-29
WO 2017/190044
PCT/US2017/030178
sinus pain, muscle pain, nerve pain, and pain affecting specific parts of the
body, such as shoulders,
pelvis, and neck. Chronic pain may also be associated with lower back pain,
arthritis, multiple sclerosis,
fibromyalgia, shingles, nerve damage, or cancer.
As used herein, "coherence" refers to the magnitude squared coherence as a
measure of power
transfer between stochastic systems. The output of the function yields
coherence values between 0 and
1, with a value of 1 signifying 100% perfectly matching amplitude difference
between two waveforms at
the observed frequency. For example, the coherence of brain regions is
determined from the difference
in coherence at individual frequency units or frequency bands (e.g., about 3
Hz to about 30 Hz).
As used interchangeably herein, the terms "decrease" and "reduce" refer to the
ability to cause
an overall decrease preferably of 20% or greater, more preferably of 50% or
greater, and most preferably
of 75%, 85%, 90%, 95%, or greater. Decrease or reduce may refer to, e.g., the
symptoms of the disease,
disorder, or pain in general or the determination of waveforms as recorded by
the methods disclosed
herein.
As used herein, the terms "electroencephalography" and "EEG" refer to an
electrophysiological
monitoring method to record electrical activity in brain tissue of a subject
using one or more sensors
attached to the scalp of a subject or with implantable sensors.
As used herein, "electrode" refers to an electric conductor through which an
electric current
enters or leaves an electrolytic cell or other medium. It further refers to
the geometric configuration of
discrete type electrical conductive elements capable of causing an
electromagnetic field when a current
and voltage is applied. The electrode can be of any shape, and can be
symmetrically or asymmetrically
configured. Size and shape depend on the specific requirements of the
application.
As used herein, the phrase "fast Fourier transfer" or "FFT" is an algorithm
used to convert
waveforms from the time domain to the frequency domain. FFT may be implemented
using a computing
program including a computing language, e.g., MATLAB (MathWorks), and/or a
computing language,
e.g., C, C++, Java, Fortran, or Python.
The abbreviation "fMRI," as used herein, refers to functional magnetic
resonance imaging.
As used herein, the phrase "inflammatory pain" refers to a form of pain that
is caused by tissue
injury or inflammation (e.g., in postoperative pain or rheumatoid arthritis).
The abbreviation "MEG," as used herein, refers to magnetoencephalography.
As used herein, the term "naïve" refers to the state of a subject, such as a
non-human mammal,
prior to induction of a pain model, as described herein.
As used herein, the term "neuropathic pain" refers to pain caused by damage or
disease affecting
the somatosensory nervous system. For example, neuropathic pain includes, but
is not limited to,
diabetic peripheral neuropathy, post-herpetic neuralgia, trigeminal neuralgia,
phantom limb pain, carpal
tunnel syndrome, sciatica, pudendal neuralgia, complex regional pain syndrome,
sensory
polyneuropathies, mono-neuropathies, or central pain syndrome, headaches,
joint pain, backaches, sinus
pain, muscle pain, nerve pain, and pain affecting specific parts of the body,
such as shoulders, pelvis, and
neck, and/or pain that is associated with lower back pain, arthritis,
headache, multiple sclerosis,
fibromyalgia, shingles, nerve damage, or cancer.
The abbreviation "PET," as used herein, refers to positron emission
tomography.
5
CA 03062870 2019-10-29
WO 2017/190044
PCT/US2017/030178
As used herein, "power spectral density" or "PSD" refers to the numerical or
visual representation
(e.g., histogram) of the distribution of the power amplitude of a waveform as
a function of frequency.
Specific frequency bands may be evaluated using PSD, which include, but are
not limited to, theta (e.g.,
4-8Hz), alpha (e.g., 8-12 Hz), beta (e.g., 12-25 Hz), and gamma (e.g., 25-100
Hz) frequency bands.
Analysis of PSD outside of standard frequency bands (e.g. 6-15 Hz, 100-3000
Hz)) may also be
evaluated using the methods described herein.
As used herein, "prevention" refers to a prophylactic treatment given to a
subject who has or will
have a disease, a disorder, a condition, or one or more symptoms associated
with a disease, a disorder,
or a condition.
As used herein, "therapeutic agent" refers to any agent that produces a
healing, curative,
stabilizing, or ameliorative effect. An "agent" may also be used, for example,
to stimulate or cause a
response in the subject, such as behavior in response to pain, e.g., hindpaw
licking and flinching, in a
non-human subject. In particular, a therapeutic agent may be included in a
closed-loop system. For
example, a therapeutic agent can act on GABAergic neurons to stimulate the
thalamic reticular nucleus
(TRN) in a subject, such as therapeutic agents that target GABA receptors
(e.g., barbiturates,
bamaluzole, gabamide, y-Amino-P-hydroxybutyric acid (GABOB), gaboxadol,
ibotenic acid, isoguvacine,
isonipecotic acid, muscimol, phenibut, picamilon, progabide, quisqualamine, SL
75102, or thiomuscimol)
or GABA transmitter uptake/trafficking (e.g., 0I-966, deramciclane (EGIS-
3886), gabaculine, guvacine
(010149), nipecotic acid, NNC 05-2090, NNC-711, SKF-89976A, SNAP-5114,
tiagabine, or hyperforin).
As used herein, "treating" refers to administering a pharmaceutical
composition for prophylactic
and/or therapeutic purposes. To "reduce the likelihood" refers to prophylactic
treatment of a patient who
is not yet ill, but who is susceptible to, or otherwise at risk of, a
particular disease or condition (e.g., the
conditions described herein, such as pain (e.g., acute pain, inflammatory
pain, or neuropathic pain). To
"treat disease" or use for "therapeutic treatment" refers to administering
treatment to a patient already
suffering from a disease to ameliorate the disease and improve the patient's
condition. The term
"treating" also includes treating a patient to delay progression of a disease
or its symptoms. Beneficial or
desired results can include, but are not limited to, alleviation,
amelioration, or prevention of pain, a
condition associated with pain, or one or more symptoms associated with pain.
As used interchangeably herein, the terms "subject" and "patient" refer to any
animal (e.g., a
mammal, e.g., a human). A subject to be treated or tested for responsiveness
to a therapy according to
the methods described herein can be one who has been diagnosed with pain.
As used herein, the phrase "waveform" refers to an extracellular local field
potential measurement
that represents the aggregate activity of a population of neurons.
Measurements of waveforms may be
used to determine neural activity in the central nervous system, e.g., the
brain and spinal cord, or in
peripheral nervous system.
The recitation herein of numerical ranges by endpoints is intended to include
all numbers
subsumed within that range (e.g., a recitation of 1 to 5 includes 1, 1.5, 2,
2.75, 3, 3.80, 4, and 5).
Other features and advantages of the invention will be apparent from the
following Detailed
Description and from the claims.
6
CA 03062870 2019-10-29
WO 2017/190044
PCT/US2017/030178
BRIEF DESCRIPTION OF THE DRAWINGS
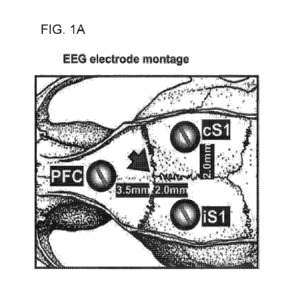
FIGS. 1A-1C are an image and a series of graphs showing electrode placement
and
representative waveforms recorded using electroencephalography (EEG). Screw
electrodes were placed
stereotaxically over the primary somatosensory cortex (51), specifically the
ipsilateral 51 (iS1) and
contralateral 51 (cS1), and midline prefrontal cortex (PFC), according to
Bregma coordinates (FIG. 1A).
For a naïve rat, representative EEG cS1 waveforms down-sampled to 250 Hz and
band-passed between
3-30 Hz, a spectrogram of the same EEG waveform, and the corresponding power
spectral density (PSD)
are shown (FIG. 1B). For a rat at day 7 (d7) after chronic constriction injury
(COI), representative EEG
cS1 waveforms down-sampled to 250 Hz and band-passed between 3-30 Hz, a
spectrogram of the same
EEG waveform, and the corresponding PSD of are shown (FIG. 10).
FIGS. 2A-2C are a series of graphs showing EEG power spectra recorded for PFC
(FIG. 2A),
cS1 (FIG. 2B), and iS1 (FIG. 20) at 30 minutes after capsaicin, day 2 (d2)
after Complete Freund's
Adjuvant (CFA), and d7 after CCI (shaded areas represent standard error of the
mean).
FIGS. 3A-3B are a series of graphs showing EEG mean power amplitude over time
after
capsaicin, CFA, or CCI (FIG. 3A) and thermal hyperalgesia, as determined by
paw withdrawal latency
(PWL), after capsaicin, CFA, or CCI (FIG. 3B).
FIGS. 4A-4B are a series of graphs showing EEG mean power amplitude over time
after
capsaicin, CFA, or CCI and capsaicin, CFA, or CCI followed by treatment with
ibuprofen, pregabalin, or
mexiletine (FIG. 4A). Thermal hyperalgesia for each pain model followed by
treatment with ibuprofen,
pregabalin, or mexiletine was also determined using PWL (FIG. 4B).
FIGS. 5A-5C are graphs showing cortical coherence between PFC and cS1 (FIG.
5A), iS1 and
PFC (FIG. 5B), and iS1 and cS1 (FIG. 5C) after capsaicin, CFA, or CCI and
capsaicin, CFA, or CCI
followed by treatment with ibuprofen, pregabalin, or mexiletine.
FIG. 6 is a graph showing control conditions using sham pain models and
vehicle drug
treatments.
FIG. 7 is an image of a wireless, 16-electrode, single-use EEG system used to
study waveforms
in human subjects after pain.
FIGS. 8A-8C are images of the study design (FIG. 8A) and corresponding
waveforms (FIG. 8B)
and source localization (FIG. 8C) of human subjects during a pain state, as
detected using EEG.
FIGS. 9A-9D are images of extracellular in vivo recording. Shown are the
assembly of the
FlexDrive stereotrode system mounted with a fiberoptic ferrule (FIG. 9A),
isolation of two putative single-
units from a 300-3000 Hz band-pass local field potential (FIG. 9B),
channelrhodopsin-2 expression
restricted to thalamic reticular nucleus (TRN) in a transgenic mouse co-
expressing the vesicular GABA
transporter (VGAT; FIG. 9C), and a representative coronal section showing
electrolytic lesion (circle;
arrows mark tetrode track) denoting a recording site in the ventral
posterolateral (VPL) thalamus (white
shadow in right panel; FIG. 9D).
FIGS. 10A-10D are graphs showing that TRN stimulation decreases SI power in
the theta band
while increasing thalamic bursts and the withdrawal threshold in naïve VGAT
mice. A histogram of the
effects of TRN stimulation at 0.5, 10, and 50 Hz on mean theta (4-8 Hz) power
under 1.5% isoflurane
sedation is shown (n=2 mice; FIG. 10A). SI power spectra are shown, in which
the right panel inset
shows a significant decrease in power within the theta band (3.8-8.5 Hz)
following 10 Hz TRN stimulation
7
CA 03062870 2019-10-29
WO 2017/190044
PCT/US2017/030178
in awake mice (n=5 mice; FIG. 10B). TRN stimulation increases burst firing in
VPL neurons (n=17 units,
3-4 units per mouse; 5 mice) and increases the threshold of mechanical
withdrawal to von Frey stimuli (d;
n=4 mice; FIG. 100-D).
FIGS. 11A-11E are graphs showing that TRN stimulation during acute pain
rescues SI theta
power and reverses allodynia. SI power spectra are shown, in which the right
panel inset shows
increased power within the theta band (3.8-6.2 Hz) following capsaicin
compared to naïve mice, whereas
TRN stimulation reverses these changes (n=5 mice; FIG. 11A). Capsaicin
increases burst firing in VPL
neurons, which is further enhanced following TRN stimulation (n=17 units, 5
mice; FIG. 11B). Withdrawal
thresholds following capsaicin indicate tactile allodynia, which is reversed
upon TRN stimulation, but re-
emerges 5 minutes afterwards (n=7 mice, FIG. 11C). A spectrogram illustrating
the temporal dynamics of
SI theta in relation to bursts in the VPL under naive, capsaicin, and
capsaicin plus optogenetic conditions
is shown (arrowhead marks light onset; gray line marks duration of optical
stimulation; FIG. 11D). Note
that theta and burst epochs do not temporally coincide. Dynamic, time-lagged
cross-correlation between
SI theta power relative to tonic and burst firing shows a significant negative
correlation between theta-
bursts when bursts precede theta by 120 ms (n=17 units; 5 mice; FIG. 11E).
DETAILED DESCRIPTION OF THE INVENTION
There is a lack of reliable methods available for detecting and monitoring
pain, particularly for
determining effective therapeutic agents for a variety of conditions,
disorders, and diseases associated
with pain. I have developed a method of detecting pain in a subject (such as a
mammal, e.g., a human)
by recording waveforms in brain tissue using electroencephalography (EEG),
applying fast Fourier
transfer (FFT) to convert the waveforms from the time domain to the frequency
domain, thereby
producing power spectral density (PSD), and then determining power amplitude
from the PSD. The
methods disclosed herein can also be used, e.g., to treat or reduce pain in a
subject, e.g., by
.. administering a therapeutic agent to the subject, if there is an increase
in the power amplitude from
baseline. In particular, the methods are useful for detecting and treating or
reducing acute pain,
inflammatory pain, and neuropathic pain. Additionally, the methods can be used
to screen for therapeutic
agents that decrease power amplitude, and thus, treat or prevent pain in the
subject.
The invention also features methods to treat or reduce pain in a subject (such
as a mammal, e.g., a
human) by stimulating thalamic reticular nucleus (TRN) in the subject, such as
with electrical stimulation,
optogenetic stimulation (e.g., using a laser-emitting optic fiber adapted for
implantation in the brain of the
subject), a therapeutic agent, thermal stimulation, or ultrasound stimulation.
Thus, the methods can
feature a closed loop system including, e.g., a closed-loop system featuring,
e.g., a therapeutic agent or
neuromodulatory device.
Diagnostic Methods
Neuronal activity in a subject may be detected at the level of waveforms using
EEG, In particular,
analysis of waveforms in brain tissue using EEG allows for the study of
multiple neuronal networks
simultaneously. Waveforms may be recorded at sampling frequencies between
about 2 Hz to about
35,000 Hz. Preferably, waveforms are recorded at sample frequencies between
about 3 Hz to about 300
Hz. Waveforms may be recorded via EEG with one or more sensors (e.g.,
electrodes) positioned on the
8
CA 03062870 2019-10-29
WO 2017/190044
PCT/US2017/030178
skull of the subject or with one or more sensors (e.g., electrodes) attached
to the scalp of the subject.
Other types of sensors include any sensor capable of detecting neuronal
activity, e.g., calcium imaging,
fMRI, MEG, MRI, and PET (acronyms defined below).
Neuronal waveforms may be detected by EEG with invasive methods (e.g.,
intraoperative or
implantable sensors) or non-invasive methods (such as sensors, e.g.,
electrodes, attached to the scalp of
a subject). These methods can include detecting shifts in PSD using FFT
analysis to determine the
occurrence or absence of new spectral peaks, shifts in peak amplitudes or peak
latency from a PSD.
Methods of detecting waveforms in brain tissue of a subject may further
include the use of
magnetoencephalography (MEG) in addition to other types of imaging techniques
and brain scans (for
example, magnetic resonance imaging (MRI), functional magnetic resonance
imaging (fMRI), and
positron emission tomography (PET)) in combination with EEG. Such techniques
may be applied to a
subject prior to, concurrently, or subsequent to recording of waveforms using
EEG.
Thus, the present invention provides methods for detecting waveforms in brain
tissue of a subject
(e.g., a mammal, e.g., a human) indicative of pain using EEG. These methods
feature the detection of
waveforms in brain tissue of a subject, e.g., as a biornarker for pain, such
as acute pain, inflammatory
pain, and neuropathic pain. The neuronal activity patterns that make up the
pain biomarker can be
divided into two major categories: spontaneous (e.g., independent or
temporally not associated with an
overt stimulus or identifiable cause) and evoked (e.g., activity correlated
with an overt stimulus or
identifiable cause). Both forms of pain may be detected using these methods.
The methods can also be performed one or more (e.g., two, there, four, or
five) times to detect
waveforms in brain tissue of a subject (e.g., a mammal, e.g., a human)
indicative of pain using EEG at
intervals (e.g., in seconds, minutes, or in hours), irregularly, or
continuously. In particular, the methods
using EEG are performed in intervals of seconds, such as for 1, 2, 3, 4, 5, 6,
7, 8, 9, 10, 11, 12, 13, 14,
15, 20, 25, 30, 35, 40, 45, 50, 55, or 60 seconds, to detect waveforms in
brain tissue indicative of pain.
Pain
Pain is associated with a wide range of medical conditions. The present
invention features
methods for diagnosing and treating a subject (e.g., a mammal, such as a
human) with pain or conditions
associated with pain. The methods of diagnosis and treatment are based, inter
alia, on the inventor's
discovery that waveforms in brain tissue of a subject detected by EEG are
indicative of pain. Subjects
diagnosed and treated using the methods can include subjects with acute pain,
subacute pain, or chronic
pain (e.g., pain that lasts longer than three to six months or pain that
extends beyond the expected period
of healing); or conditions associated with pain (e.g., post-herpetic
neuralgia, trigeminal neuralgia,
phantom limb pain, carpal tunnel syndrome, sciatica, pudendal neuralgia,
complex regional pain
syndrome, or central pain syndrome, headaches, in particular, migraine, joint
pain, backaches, sinus pain,
muscle pain, nerve pain, and pain affecting specific parts of the body, such
as shoulders, pelvis, and
neck, and/or pain that is associated with lower back pain, arthritis,
headache, fibromyalgia, shingles, or
nerve damage).
Methods described herein may be useful for the diagnosis, treatment,
reduction, or prevention of
various forms of pain, whether acute or chronic. Exemplary conditions that may
be associated with pain
include, for example, soft tissue, joint, and bone inflammation and/or damage
(e.g., acute trauma,
osteoarthritis, or rheumatoid arthritis), myofascial pain syndromes
(fibromylagia), headaches (including
9
CA 03062870 2019-10-29
WO 2017/190044
PCT/US2017/030178
cluster headache, migraine, and tension type headache), myocardial infarction,
angina, ischemic
cardiovascular disease, post-stroke pain, sickle cell anemia, peripheral
vascular occlusive disease,
cancer, inflammatory conditions of the skin or joints, diabetic neuropathy,
and acute tissue damage from
surgery or traumatic injury (e.g., burns, lacerations, or fractures).
For example, the present invention provides methods for detecting and treating
inflammatory
pain. Inflammatory pain is a form of pain caused by tissue injury or
inflammation (e.g., in postoperative
pain or rheumatoid arthritis). Following a peripheral nerve injury, symptoms
are typically experienced in a
chronic fashion, distal to the site of injury and are characterized by
hyperesthesia (enhanced sensitivity to
a natural stimulus), hyperalgesia (abnormal sensitivity to a noxious
stimulus), allodynia (widespread
tenderness associated with hypersensitivity to normally innocuous tactile
stimuli), and/or spontaneous
burning or shooting lancinating pain. In inflammatory pain, symptoms are
apparent, at least initially, at
the site of injury or inflamed tissues and typically accompany arthritis-
associated pain, musculo-skeletal
pain, and postoperative pain. The different types of pain may coexist or pain
may be transformed from
inflammatory to neuropathic during the natural course of the disease, as in
post-herpetic neuralgia.
Additionally, the present invention provides methods for detecting and
treating neuropathic pain.
Neuropathic pain can take a variety of forms depending on its origin and can
be characterized as acute,
subacute, or chronic depending on the duration. Acute pain can last anywhere
from a couple hours to
less than 30 days. Subacute pain can last from one to six months and chronic
pain is characterized as
pain that lasts longer than three to six months or pain that extend beyond the
expected period of healing.
In neuropathic pain, the pain may be described as being peripheral neuropathic
if the initiating injury
occurs as a result of a complete or partial transection of a nerve or trauma
to a nerve plexus. Peripheral
neuropathy can result from traumatic injuries, infections, metabolic
disorders, diabetes, and/or exposure
to toxins. Alternatively, neuropathic pain is described as being central
neuropathic following a lesion to
the central nervous system, such as a spinal cord injury or a cerebrovascular
accident. The methods of
the invention include administration of the compositions described herein to
treat neuropathic pain.
Types of neuropathic pain include but are not limited to: diabetic peripheral
neuropathy, post-herpetic
neuralgia, trigeminal neuralgia, phantom limb pain, carpal tunnel syndrome,
sciatica, pudendal neuralgia,
complex regional pain syndrome, sensory polyneuropathies, mono-neuropathies,
and central pain
syndrome.
The present invention may also be useful for the diagnosis, treatment,
reduction, or prevention of
musculo-skeletal pain (after trauma, infections, and exercise), pain caused by
spinal cord injury, tumors,
compression, inflammation, dental pain, episiotomy pain, deep and visceral
pain (e.g., heart pain, bladder
pain, or pelvic organ pain), muscle pain, eye pain, orofacial pain (e.g.,
odontalgia, trigeminal neuralgia,
glossopharyngeal neuralgia), abdominal pain, gynecological pain (e.g.,
dysmenorrhea and labor pain),
pain associated with nerve and root damage due to trauma, compression,
inflammation, toxic chemicals,
hereditary conditions, central nervous system pain, such as pain due to spinal
cord or brain stem
damage, cerebrovascular accidents, tumors, infections, demyelinating diseases
including multiple
sclerosis, low back pain, sciatica, and post-operative pain.
CA 03062870 2019-10-29
WO 2017/190044
PCT/US2017/030178
Methods of Treatment
The present invention provides methods of treating or reducing pain in a
subject (e.g., a mammal,
such as a human) by recording waveforms in brain tissue of the subject using
EGG, applying FFT to
convert waveforms from the time domain to the frequency domain, thereby
producing PSD, determining
power amplitude from the PSD, and administering a therapeutic agent to the
subject, if there is an
increase in the power amplitude from baseline. Additionally, waveforms
recorded in brain tissue of a
subject by EEG can be used to determine coherence of brain regions, in which
an increase in the
coherence of brain regions (e.g., the PFC and Si) is indicative of, e.g., a
transition from acute pain to
chronic pain. Accordingly, a therapeutic agent can be administered after
determining an increase in brain
region coherence. Thus, the methods result in a reduction in the likelihood of
pain or prevention of pain.
The methods of the present invention for treating or reducing pain in a
subject may be performed
on the subject within 24 hours (e.g., within 20 hours, 16 hours, 12 hours, 8
hours, 4 hours, 3 hours, 2
hours, or 1 hour) of an initial presentation of the subject to a medical
professional. The method may also
be performed at least 24 hours (e.g., at least 48 hours, 3 days, 4 days, 5
days, 6 days, or one week) after
an initial presentation of the subject to a medical professional. The method
may be performed on a
subject previously admitted to a medical facility for a disease or disorder.
The method may also be
performed one or more (e.g., two, there, four, or five) times for treating a
subject at intervals (e.g., hourly,
daily, weekly, or monthly) or irregularly.
Upon assessing that there is an increase in the power amplitude from baseline,
a therapeutic
agent may be administered to the subject one or multiple times daily (e.g.,
two times, three times, up to
four times a day), weekly (or at some other multiple day interval), or on an
intermittent schedule, with that
cycle repeated a given number of times (e.g., 2, 3, 4, 5, 6, 7, 8, 9, or 10
cycles) or indefinitely. According
to the methods described herein, therapeutic agents may also be administered
chronically (e.g., more
than 20 days, e.g., 21 days, 30 days, 60 days, 3 months, 6 months, 9 months, 1
year, 2 years, or 3
years). Sensors of the present method may also be coupled to an 'effector'
(e.g. pharmacotherapy or
neuromodulatory device) in an automated closed-loop system.
The present invention also provides methods of treating or reducing pain
(e.g., acute pain,
inflammatory pain, or neuropathic pain) in a subject (e.g., a mammal, such as
a human) by stimulating
thalamic reticular nucleus (TRN) in the subject. In particular, methods of
treating or reducing pain in a
subject feature stimulation of TRN using, e.g., electrical stimulation,
optogenetic stimulation (e.g., using a
laser-emitting optic fiber adapted for implantation in the brain of the
subject), a therapeutic agent, thermal
stimulation, or ultrasound stimulation. For example, the TRN can be stimulated
at a frequency of about
0.2 Hz to about 100 Hz, such as about 0.2 Hz, about 0.5 Hz, about 1 Hz, about
5 Hz, about 10 Hz, about
15 Hz, about 20 Hz, about 25 Hz, about 30 Hz, about 35 Hz, about 40 Hz, about
45 Hz, about 50 Hz,
about 55 Hz, about 60 Hz, about 65 Hz, about 70 Hz, about 75 Hz, about 80 Hz,
about 85 Hz, about 90
Hz, about 95 Hz, or about 100 Hz. In particular, TRN stimulation can be
intermittent or 'burst' stimulation,
such as about 100 Hz to about 200 Hz bursts of individual stimulation epochs.
Additionally, the TRN of
the subject can be stimulated with a laser-emitting optic fiber one or
multiple times daily (e.g., two times,
three times, up to four times a day), weekly (or at some other multiple day
interval), or on an intermittent
schedule, with that cycle repeated a given number of times (e.g., 2, 3, 4, 5,
6, 7, 8, 9, or 10 cycles), or
indefinitely. For example, a therapeutic agent may also be administered to the
subject to stimulate the
11
CA 03062870 2019-10-29
WO 2017/190044
PCT/US2017/030178
TRN in the subject, thereby treating or reducing pain in the subject. In
particular, a therapeutic agent can
target GABA receptors (e.g., barbiturates, bamaluzole, gabamide, y-Amino-P-
hydroxybutyric acid
(GABOB), gaboxadol, ibotenic acid, isoguvacine, isonipecotic acid, muscimol,
phenibut, picamilon,
progabide, quisqualamine, SL 75102, or thiomuscimol) or GABA transmitter
uptake/trafficking (e.g., CI-
966, deramciclane (EGIS-3886), gabaculine, guvacine (010149), nipecotic acid,
NNC 05-2090, NNC-711,
SKF-89976A, SNAP-5114, tiagabine, or hyperforin).
The methods of the present invention for treating or reducing pain in a
subject (e.g., a mammal,
such as a human) featuring TRN stimulation may be performed on the subject
within 24 hours (e.g.,
within 20 hours, 16 hours, 12 hours, 8 hours, 4 hours, 3 hours, 2 hours, or 1
hour) of an initial
presentation of the subject to a medical professional. The method of TRN
stimulation may also be
performed at least 24 hours (e.g., at least 48 hours, 3 days, 4 days, 5 days,
6 days, or one week) after an
initial presentation of the subject to a medical professional. The method of
TRN stimulation may be
performed on a subject previously admitted to a medical facility for a disease
or disorder associated with
pain (e.g., acute pain, inflammatory pain, or neuropathic pain). The method of
TRN stimulation may also
be performed one or more (e.g., two, there, four, or five) times for treating
a subject at intervals (e.g.,
hourly, daily, weekly, or monthly) or irregularly. Additionally, TRN
stimulation may be performed on a
subject having pain as determined by, e.g., recording waveforms in brain
tissue of the subject by EEG;
applying FFT to convert the waveforms from the time domain to the frequency
domain, thereby producing
PSD; and determining power amplitude from the PSD, in which an increase in the
power amplitude from
baseline serves as an indicator of pain. The subject may also have not
previously received treatment for
pain prior to the methods.
Dosing of Therapeutic Agents
Methods of the present invention may be used to determine the effective amount
of the
therapeutic agent (e.g., dosage or titration) to treat or prevent the
likelihood of pain in a subject (such as a
mammal, e.g., a human). In particular, an effective amount of the therapeutic
agent results in, e.g., an
amelioration or stabilization of pain in the subject, such that there is a
decrease in the power amplitude of
the PSD relative to baseline.
The recording, applying, and determining steps of the method may be repeated
after
administration of the therapeutic agent in order to determine an effective
amount of the agent. These
steps may be repeated one or more times an hour (e.g., within 1 minute, 5
minutes, 10 minutes, 15
minutes, 30 minutes, 45 minutes), day (e.g., within 12 hours, 8 hours, 4,
hours, 2 hours, 1 hour), or month
(e.g., at least 48 hours, 3 days, 4 days, 5 days, 6 days, or one week).
Suitable therapeutic agents also
include combinations thereof, such that one or more (e.g., two, three, four,
or five or more) additional
therapeutic agents is administered to the subject. When co-administered, the
two therapeutic agents are
desirably administered within 24 hours of each other (e.g., within 12 hours, 8
hours, 4, hours, 2 hours, 1
hour, 30 minutes, 15 minutes, or substantially simultaneously).
Actual dosage levels of the active ingredients in the therapeutic agents
administered according to
the present invention may be varied so as to obtain an amount of the active
ingredient which is effective
to achieve the desired response of treating or reducing the likelihood of pain
in a subject, without
undesirable side effects or being toxic to the subject (such as a mammal,
e.g., a human). According to
12
CA 03062870 2019-10-29
WO 2017/190044
PCT/US2017/030178
the methods of the present invention, the selected dosage level can be
determined by recording
waveforms in brain tissue of the subject by EEG. For instance, after
administering an agent to the subject
that results in behavior associated with pain, assessment of a decrease in the
power amplitude relative to
baseline indicates that the test therapeutic agent treats or prevents pain in
the subject and can be used to
.. select the appropriate dosage of the test therapeutic agent. Additionally,
side effects associated with
analgesics (e.g., drowsiness with gabapentanoids or an increase in coherence
values with mexiletine)
can be determined with the methods.
The selected dosage level will also depend upon a variety of pharmacokinetic
factors including
the activity of the therapeutic agents, the route of administration, the time
of administration, the rate of
.. absorption of the particular agent being employed, the duration of the
treatment, other drugs, substances,
and/or materials used in combination with the particular compositions
employed, the age, sex, weight,
condition, general health and prior medical history of the subject being
treated, and like factors well
known in the medical arts. It is to be understood that, for any particular
subject, specific dosage regimes
should be adjusted over time according to the individual need and the
professional judgment of the
.. person administering or supervising the administration of the compound. For
example, the dosage of a
therapeutic agent can be increased if the lower dose does not provide
sufficient activity to decrease
power amplitude relative to baseline as assessed by the methods described
herein. Conversely, the
dosage of a therapeutic agent may be maintained or decreased if there is an
appreciable decrease in
power amplitude relative to baseline.
Therapeutic agents can include, pharmacological, non-pharmacological, and
neuromodulatory
agents (e.g. deep brain stimulation, spinal cord stimulation, transcranial
current stimulation, transcranial
magnetic stimulation, and ultrasound stimulation). In particular, therapeutic
agents useful in the methods
include non-steroidal anti-inflammatory drug (NSAIDs). Exemplary NSAIDs
include, without limitation,
ibuprofen, aceclofenac, acemetacin, acetaminophen, aloxiprin, aspirin,
benorilate, bromfenac, celecoxib,
deracoxib, diclofenac, diflunisal, ethenzamide, etodolac, etofenamate,
etoricoxib, fenbufen, fenoprofen,
flufenamic acid, flurbiprofen, lonazolac, lornoxicam, indomethacin, isoxicam,
kebuzone, ketoprofen,
ketorolac, licofelone, loxoprofen, lumiracoxib, meclofenamic acid, mefenamic
acid, meloxicam, metamizol,
mofebutazone, naproxen, nabumetone, niflumic acid, nimesulide, oxaprozin,
oxyphenbutazone,
parecoxib, phenidone, phenylbutazone, piroxicam, propacetamol, propyphenazone,
rofecoxib,
.. salicylamide, sulfinpyrazone, sulindac, suprofen, tiaprofenic acid,
tenoxicam, or tolmetin. Therapeutic
agents useful in the methods can also include anticonvulsants, such as
pregabalin, carbamazepine,
flupirtine, gabapentin, lamotrigine, oxcarbazepine, phenytoin, retigabine,
topiramate, or valproate.
Additionally, useful therapeutic agents of the methods include antiarrhythmic
agents, such as mexiletine,
lidocaine, or tocainide.
Methods of Screening Therapeutic Agents
The present invention features methods of screening for a therapeutic agent
using a non-human
animal subject (e.g., mammal) that include administering an agent to the
subject that results in behavior
associated with pain (e.g., hindpaw licking and flinching); recording
waveforms in brain tissue of the
.. subject by EEG, applying FFT to convert the waveforms from the time domain
to the frequency domain,
thereby producing PSD; determining power amplitude from the PSD; administering
a test therapeutic
13
CA 03062870 2019-10-29
WO 2017/190044
PCT/US2017/030178
agent to the subject; and repeating the prior recording, applying, and
determining steps. In particular, a
decrease in the power amplitude relative to baseline indicates that the test
therapeutic agent treats or
prevents pain in the subject.
Test therapeutic agents of the present invention may be screened from a
plurality of chemical
entities. The steps of screening for a therapeutic agent may be repeated with
one or more compounds,
e.g., with a library of compounds. For instance, the invention may feature a
library comprising
compounds or complexes that may treat or reduce the likelihood of pain the
subject. Screening of
multiple compounds can be carried out simultaneously or concurrently; or can
be carried out
simultaneously with some compounds and then concurrently with others.
Therapeutic agents may
include pharmacological, non-pharmacological, and neuromodulatory agents, as
described herein.
Clinical Applications
In addition to using the methods of the present invention for detecting pain
in a subject (such as a
mammal, e.g., a human) and/or treating or reducing the likelihood of pain, the
present methods may be
used during invasive or surgical procedures (e.g., intraoperative, awake light
sedation, or unconscious
deep anesthesia), in particular if anesthetics or sedatives are
contraindicated. Furthermore, the
diagnostic methods of the present invention are useful for subjects or
patients that are non-cooperative, in
a non-communicating vegetative state, cognitively impaired, facing language
barrier, or where verbal
reporting is unreliable (e.g., in pediatric neonate subjects).
Methods of the present invention also provide for safe, effective, and long-
term treatment
strategies for pain using, e.g., a neuromodulatory system for the relief of
chronic pain. The methods may
also include providing therapeutic neurostimulation to the brain of the
patient, e.g., at predefined times,
frequencies, voltages, periodicities, and currents. For instance, these
methods can involve electrodes
implanted into a subjects brain, e.g., a deep brain stimulation system,
electrodes on the scalp, e.g., a
transcranial direct current stimulation system, and/or the use of magnetic
stimulation, e.g., a transcranial
magnetic stimulation system. The neurostimulation can be provided in response
to detecting an increase
in EEG power amplitude indicative of pain or on a periodic basis (e.g., every
1-2 hours). Methods of the
present invention can also include the use of a transdermal patch placed on
the skin for drug delivery or
an intrathecal drug delivery pump for direct delivery of medication.
The following examples are intended to illustrate, rather than limit, the
disclosure. These studies
feature the use of EEG recording methods in awake, freely-behaving rats to
demonstrate that pain
modulates neuronal oscillations in clinically relevant models and that
effective analgesic drugs reverse
this modulation. These results suggest that recording waveforms in brain
tissue of subjects using EEG
can be used to predict spontaneous nociceptive states in rodents and that
waveforms associated with
pain can be used for diagnostic and therapeutic purposes.
Example 1. Electrophysiological measurements using clinically tethered
electrodes
Experiments were performed on male Sprague-Dawley rats (n=43 rats, weight of
200 to 300 g).
Animals were housed under a 12-hour light/dark cycle in a temperature- and
humidity-controlled
environment. Under deep anesthesia (isoflurane, 3.5%), the head was fixed in a
stereotaxic apparatus.
A small skin incision was used to expose the skull. Two stainless steel screw
electrodes (0-80 ga, 1/8-
14
CA 03062870 2019-10-29
WO 2017/190044
PCT/US2017/030178
inch, and impedance of 0.6 Ohm; Component Supply Company, Fort Meade, FL) were
placed over the
intact skull corresponding to the primary somatosensory cortex (51) hindlimb
area bilaterally without
craniotomy (Bregma -2, 2 mm lateral) and a third screw was placed over the
area corresponding to the
prefrontal cortex (PFC; Bregma +3.5 mm, midline). Minimal craniotomies were
used to place three
.. stabilization screws (corresponding to Bregma +1.4, 2 mm bilaterally and
Bregma -4.8 mm, midline) to
anchor all EEG electrodes chronically using dental acrylic. EEG screws were
threaded with a silver wire
and attached to a female miniature pin connector (A&M Systems, Sequim, WA).
Signal reference was
provided by a silver wire permanently threaded to skin at the back of the
neck.
EEG recordings began five to seven days after implantation of contralateral 51
(c51), ipsilateral
51 (i51), and PFC electrodes, as described above (FIG. 1A). EEG waveforms were
amplified (DAM80,
World Precision Instruments, Sarasota, FL), led to a processing system
(micro1401mkII, Cambridge
Electronic Design (CED), Cambridge, UK), and analyzed off-line using Spike 2
(CED) or MATLAB
(Mathworks, R2012b, Natick, MA). Prior to EEG recording, pin connectors from
each electrode were
tethered to pre-amplifier headstages leading to a multichannel amplifier (iso-
DAM8A, WPI Inc., Sarasota,
FL). Amplification for each channel was set at x1000. This system allowed free
movement of tethered
rats with no head restraint, while recording EEG signals simultaneously from
all electrodes (c51, i51, and
PFC). Rats were allowed to freely navigate individually in Plexiglas chambers.
The rat's behavior was
visually monitored, noting periods of rest. Each EEG recording session was
approximately five minutes
per animal, irrespective of the pain model. Of that 5 minute interval, 15
second segments were selected
randomly during the rest state with one 15 second segment selected per
condition and per animal. After
15 minutes of acclimation, EEG waveforms were sampled at 25 kHz and down-
sampled offline to 250 Hz.
Only data during awake, resting periods (defined as alertness with no
locomotor behavior) were
further analyzed. Potentials generated due to vigorous myogenic activity, such
as scratching, were
excluded from analysis. These artifacts were identified by monitoring the
animal's behavior, voltage
amplitude, and spectral frequency (e.g., greater than 30 Hz). Study exclusion
criteria included signs of
skin infection due to surgical complications from the EEG implant or low
signal-to-noise ratio indicating
faulty electrophysiological signal transmission. No rat was excluded from the
capsaicin or Complete
Freund's Adjuvant (CFA) groups. Three rats were excluded from the chronic
constriction injury (CCI)
treatment group due to high noise in the electrophysiological signal at a
later stage of CCI.
Example 2. Pain models, thermal sensitivity, and analgesic treatment
Seven days after implantation of EEG electrodes, different pain models were
induced. For
capsaicin as a model of acute pain, capsaicin (0.1%, 40 pL, Sigma-Aldrich) was
intradermally injected in
the left hindpaw under brief isoflurane anesthesia (1.5% for 2 minutes). A
transient receptor potential
vanilloid 1 agonist, capsaicin increases neuronal firing in nociceptors,
mainly polymodal C-fibers, and is
commonly used as a model of acute nociceptive pain. Within 24 hours after
capsaicin injection,
nocifensive behavior indicative of spontaneous pain, such as hindpaw licking
and flinching, completely
subsides. Sham capsaicin rats received only vehicle injections (20 pL, 7%
Tween 80 in saline).
For Complete Freund's Adjuvant (CFA) as a model of inflammatory pain, CFA (100
pL,
intradermal, Sigma-Aldrich) was injected in the left hindpaw under brief
isoflurane anesthesia (1.5% for 2
minutes). CFA-induced nociceptive behaviors result from the edema caused by
the inflammatory
CA 03062870 2019-10-29
WO 2017/190044
PCT/US2017/030178
response to heat-killed Mycobacterium tuberculosis in the inoculate and
persists for more than 2 days
after injection. Sham CFA rats received vehicle injections (100 pL, incomplete
Freund's adjuvant as 85%
paraffin oil and 15% mannide monooleate).
For chronic constriction injury (CCI) as a model of neuropathic pain, the left
sciatic nerve was
.. exposed unilaterally after skin incision at the mid-thigh level and blunt
dissection of the biceps under deep
anesthesia (isoflurane, 3.5%). Four chromic gut (4-0) ligatures were tied
loosely around the nerve 1 mm
apart, and the overlying muscles and skin were closed in layers with 4-0
Ethilon TM sutures. A minor
modification was introduced, consisting of loose ligatures, to minimize nerve
damage and deafferentation.
Rats with this slightly modified CCI procedure gradually develop typical signs
of sensory hypersensitivity
associated with neuropathic pain, such as guarding the affected hindpaw and
thermal hypersensitivity, for
more than 2 weeks after CCI. Sham CCI animals underwent the same procedures
without nerve ligation.
Thermal sensitivity of the hindpaw was assessed by measuring the latency of
the withdrawal
reflex in response to a radiant heat source. Individual animals were placed in
a Plexiglas box on an
elevated glass plate under which a radiant heat source (4.7 amps) was applied
to the plantar surface of
.. the hindpaw after 15 minutes of acclimation. Paw withdrawal latencies (PWL)
in response to four thermal
stimulations, separated by five minutes of rest, were averaged for each paw.
Rats unresponsive to
radiant heat stimuli were excluded from PWL data analysis.
For analgesic treatment, ibuprofen was dissolved in a 5% solution of 2-
hydroxylpropy1-13-
cyclodextrin (Sigma-Aldrich) formulated to deliver 30 mg/kg in a volume of 3
ml/kg. Pregabalin was
.. dissolved in 5% Tween 80 (Sigma-Aldrich) in saline. Mexiletine was
dissolved in saline for intraperitoneal
(i.p) delivery of 10 mg/kg in a volume of 3 ml/kg. EEG was performed 30 min
after i.p. delivery of
analgesics. Ibuprofen was administered concomitantly with capsaicin to allow
at least 30 minutes for the
analgesic effects to manifest. Pregabalin was administered at day 2 (d2) after
CFA treatment and day 14
(d14) after CCI treatment. Mexiletine was administered at day 16 (d16) after
CCI treatment in the same
rats that received pregabalin to allow within group comparison of analgesic
effects.
Example 3. Analysis of EEG waveform recordings
Fast Fourier transform (FFT) was used to convert EEG waveforms from the time
domain to the
frequency domain, yielding power spectra. Power values were generated in 27
frequency bins between 3
and 30 Hz. For each experimental condition, 15 second continuous segments
during complete rest were
selected for power analysis.
The magnitude squared coherence function (mscohere) in MATLABO Signal
Processing Toolbox or the "COHER" script in Spike 2 was used as a measure of
power transfer between
stochastic systems. The output of the function yields coherence values between
0 and 1, with a value of
1 signifying perfectly matching amplitude difference between two waveforms at
the observed frequency.
For signals x and y, the magnitude squared coherence is a function of their
power spectral densities P(f)
and P(f) and their cross power spectral density Pxy(f):
C(f) = IP(f)I2/P(f) PYYM
16
CA 03062870 2019-10-29
WO 2017/190044
PCT/US2017/030178
The function parameters were defined as follows: the fast Fourier transfer
length ("nfft") is the
next power of 2 greater than the length of each signal, the sampling frequency
("fs") is 250, the window
length ("window") is the periodic Hamming window to obtain 8 equal sections of
each signal, and the
number of overlapping samples ("noverlap") is the value yielding 50% overlap.
To minimize type I errors,
coherence values were down-sampled from 54 to 27 frequency bins between 3 and
30 Hz. Two-way
ANOVA analysis followed by Bonferroni's correction was used to compute
statistical significance.
Bartlett's test was performed to compute normal distribution and equal
variance. A 'p value <0.05 was
considered significant (denoted with * in figures). All values are reported as
standard error of the mean.
Example 4. EEG power, pain, and nociceptive behavior
EEG recordings were performed in awake, freely-behaving rats during rest. EEG
waveforms
were generally stable over time, allowing for a reliable analysis of
longitudinal EEG data. When 10
second interval EEG waveforms (sampling frequency of 250 Hz) were band-pass
filtered between 3-30
Hz, increased voltage amplitude and oscillations were evident in corresponding
spectrograms and power
spectra of the cS1 of a rat at seven days following 001 relative to a naïve
rat (FIG. 1B-1C). In particular,
the spectrogram of the naïve versus the 001 treated rat revealed increased low-
frequency power (<10
Hz) in the cS1 at seven days following 001.
EEG power waveforms from iS1, cS1, and PFC relevant to acute (capsaicin, n=8
rats),
inflammatory (d2 after CFA, n=10 rats for PFC and cS1, n=4 rats for iS1), and
neuropathic pain states
(d14 after CCI, n=5 rats for PFC and cS1, n=6 rats for iS1) are shown in FIG.
2. Compared to naïve rats,
EEG power amplitude in the 3-30 Hz range of the iS1, cS1, or PFC was more
synchronized following CFA
or CCI (FIG. 2A-2C). There was no remarkable difference of EEG power spectra
between iS1, cS1, or
PFC, suggesting that pain is associated with widespread synchronization of
EEG. Interestingly,
capsaicin, which evokes a transient and relatively less pronounced state of
nociception within 30 minutes
after intradermal injection, resulted in a modest increase in EEG power
amplitude compared to CFA and
CCI, which arguably evoke a more heightened nociceptive state. EEG power
amplitude increased in the
three pain models, except for power recorded over iS1, which remained
unchanged in rats with capsaicin.
Mean EEG power (mV2 x 10-5) between 3 Hz to 30 Hz of the cS1, iS1, and PFC
followed an
ascending, linear trend during the development of inflammatory pain due to CFA
and neuropathic pain
due to CCI (FIG. 3A). For cS1, EEG mean power was not changed 30 min after
capsaicin (1.05 0.11,
n=8 rats) compared to naïve rats (from 0.85 0.15) 0r24 hours after capsaicin
(0.89 0.12). In contrast,
CFA increased EEG mean power from 0.54 0.10 (naïve) to 0.81 0.10 and 0.91 0.09
within one and two
days, respectively (p<0.05, n=10 rats). CCI increased EEG mean power from 0.67
0.13 (naïve) to
1.03 0.15, 1.25 0.23, and 1.39 0.21 at 7, 14, and 16 days after injury,
respectively (p<0.05, n=5 rats).
For iS1, mean power increased from 0.91 0.13 (naïve) to 1.05 0.8 at 30 min
after capsaicin
(p<0.05), and reversed 24 hours after capsaicin to naïve levels (0.90 0.18;
n=8 rats). CFA increased
mean power from 0.76 0.19 (naïve) to 1.13 0.20 and 1.53 0.03 within one and
two days, respectively
(p<0.05, n=4 rats). CCI increased mean power from 0.52 0.07 (naïve) to 0.75
0.08, 1.11 0.16, and
1.22 0.10 at 7, 14, and 16 days after injury, respectively (p<0.05, n=6 rats).
For PFC, mean EEG power increased from 0.56 0.08 (naïve) to 0.67 0.06 at 30
min after
capsaicin (p<0.05), and reversed 24 hours after capsaicin to naïve levels
(0.65 0.07; n=8 rats). CFA
17
CA 03062870 2019-10-29
WO 2017/190044
PCT/US2017/030178
increased mean power from 0.46 0.07 (naïve) to 0.72 0.08 and 0.76 0.06 within
one and two days,
respectively (p<0.05, n=10 rats). CCI increased mean power from 0.58 0.06
(naïve) to 0.86 0.08,
1.06 0.10 and 1.08 0.16 at 7, 14, and 16 days after injury, respectively
(p<0.05, n=5 rats).
In summary, nociceptive states in rat models of acute, inflammatory, and
neuropathic forms of
pain were discovered to correlate with increased EEG power over cS1 and PFC.
Notably, EEG power in
Si ipsilateral after capsaicin injection was not significantly changed. These
data further suggest that
power spectra in iS1 to noxious stimuli might encode long-lasting, but not
transient forms of pain,
indicating that Si is critical for sensory discrimination and localization of
acute, noxious stimuli on the
contralateral side of the body. Notably, intradermal capsaicin injection
elicits pain that has maximal
.. intensity immediately upon injection with rapid decay within 5 minutes.
Secondary hyperalgesia occurs at
a later time point starting at 10 minutes after injection and persists at
least 20 minutes thereafter. In the
present study, capsaicin was injected under brief (2-3 minute) isoflurane
sedation and collection of EEG
data began 30 minutes after injection. Accordingly, the present EEG data
correspond to a time point of
secondary, not primary, hyperalgesia. Thus, long-term pain leads to widespread
increases in EEG power
according to an anatomical representation that does not strictly overlap with
the cortical projection map of
the spinothalamic system.
Example 5. Relationship of EEG power and thermal hyperalgesia
The relationship between EEG power and thermal hyperalgesia, a widely-used
correlate of pain-
induced behavioral hypersensitivity, was then determined. Thermal hyperalgesia
developed reliably in all
pain models as determined from paw withdrawal latencies (PWL; FIG. 3B). PWL
decreased from
9.43 0.22 seconds to 6.00 0.24 seconds at 30 min after capsaicin (p<0.05), and
reversed to 9.15 0.26
seconds at 24 hour after capsaicin (n=8 rats). CFA decreased PWL from 9.67
0.29 seconds (naïve) to
5.73 0.36 seconds and 6.10 0.33 seconds within one and two days, respectively
(p<0.05, n=10 rats).
CCI decreased PWL from 8.71 0.21 seconds (naïve) to 7.03 0.36, 7.00 0.24, and
7.26 0.45 seconds at
7, 14, and 16 days after injury, respectively (p<0.05, n=7 rats). Notably, the
modulation of mean power
versus PWL was not identical. For example, in rats with CCI, near-perfect
linear trends in mean power
were observed for iS1, PFC and cS1 (R2= 0.96, 0.89, and 0.95, respectively),
whereas a near-perfect
polynomial trend was observed for PWL at the same longitudinal time points.
The present EEG data reflect a spontaneous, 15 second interval during resting
state, whereas
the behavioral data represent an evoked, paw withdrawal reflex. Generally, an
increase in EEG power
correlated with a decrease in the latency of PWL. This relationship was
consistent for capsaicin and CFA
conditions across waveforms recorded via all three EEG electrodes, with the
exception of iS1 after
capsaicin, as discussed above. Moreover, a longitudinal inverse plateau trend
was observed in PWL,
whereby values at d7, d14, and d16 after CCI were not statistically different,
in contrast to the ascending
linear trend over time for Si EEG mean power. Thus, EEG power provides
valuable information
regarding the chronic nociceptive state, which cannot be inferred from solely
PWL.
Example 6. Effect of administering analgesics on EEG power
The sensitivity of EEG power to analgesic treatment was investigated using the
clinically relevant
drugs ibuprofen, pregabalin and mexiletine. Ibuprofen, a NSAID cyclooxygenase
inhibitor, is widely used
as a non-prescription analgesic which was initially developed for mild forms
of musculoskeletal and
18
CA 03062870 2019-10-29
WO 2017/190044
PCT/US2017/030178
arthritis pain. Pregabalin, an anticonvulsant a2o-subunit ligand, is
clinically effective for the management
of peripheral neuropathic pain and post-incisional pain, as well as cutaneous
and muscle hyperalgesia in
inflammatory models of muscle pain. Mexiletine, a non-selective, use-dependent
voltage-gated sodium
channel blocker (which is also anti-arrhythmic), has been shown to suppress
persistent sodium currents
in peripheral sensory axons of patients and is considered a third-line
treatment for neuropathic pain.
For cS1, treatment with ibuprofen (FIG. 4A) did not have a significant effect
on EEG mean power
(122 10, n=4 rats) compared to capsaicin alone (128 17; n=8 rats), whereas
pregabalin treatment in rats
with CFA reduced mean power from 299 70 to 209 35 (p<0.05, n=7 rats; Fig 4A).
In rats with CCI,
treatment with pregabalin or mexiletine reduced mean power from 217 39 to 87
12 (p<0.05, n=5 rats)
and from 245 56 to 134 18 (p<0.05, n=5 rats), respectively. Similar results
were observed for PFC and
iS1.
For PFC, treatment with ibuprofen did not have a significant effect on EEG
mean power (117 18,
n=4 rats) compared to capsaicin alone (123 16; n=8 rats), whereas pregabalin
treatment in rats with CFA
reduced mean power from 208 26 to 138 20 (p<0.05, n=5 rats). In rats with CCI,
treatment with
pregabalin or mexiletine reduced EEG mean power from 188 27 to 133 14 (p<0.05,
n=7 rats), and from
156 10 to 113 6 (p<0.05, n=6 rats), respectively. For iS1, treatment with
ibuprofen did not have a
significant effect on mean power (143 35, n=4 rats) compared to capsaicin
alone (124 14; n=8 rats),
whereas pregabalin treatment in rats with CFA reduced EEG mean power from 208
24 to 133 9 (p<0.05,
n=5 rats). In rats with CCI, treatment with pregabalin or mexiletine reduced
EEG mean power from
219 32 to 151 20 (p<0.05, n=6 rats), and from 247 78 to 139 26 (p<0.05, n=8
rats), respectively.
The analgesic effect of these drugs was also tested behaviorally in the same
animals. Although
ibuprofen had no effect on EEG mean power following capsaicin, ibuprofen
blocked thermal hyperalgesia
by increasing PWL from 64 3 (n=8 rats) to 114 10 (p<0.05, n=4 rats; Fig 4B).
Pregabalin also increased
PWL in rats with CFA from 60 3 to 132 17 (p<0.05, n=5 rats). In rats with CCI,
treatment with pregabalin
or mexiletine increased PWL from 81 3 to 119 5 (p<0.05, n=7 rats) and from 83
5 to 119 17 (p<0.05,
n=7 rats), respectively.
In summary, ibuprofen was effective in attenuating thermal hyperalgesia, but
did not have a
significant effect on EEG power, which could result from the differential
effects of the mechanism of action
of ibuprofen on evoked versus spontaneous pain. Otherwise, pregabalin and
mexiletine effectively
blocked thermal hyperalgesia and reversed EEG mean power to normal levels in
rats with CFA and CCI.
These results further confirm that pregabalin and mexiletine, at the optimal
analgesic doses used in this
study, did not manifest adverse EEG signs, such as diffuse or paroxysmal slow
activity that is often
associated with drowsiness and would have an enhancing effect on EEG power in
the low-frequency
range.
Example 7. Coherence of brain regions following pain
The effect of pain on cortico-cortical 51-PFC coherence was also investigated.
Coherence in the
3-30 Hz range between cS1-PFC increased in rats more than 14 days after CCI,
whereas capsaicin and
CFA did not cause a significant change in cS1-PFC coherence (Fig 5A). In
particular, coherence
between cS1 and PFC (following values are mean 3-30 Hz coherence) did not
change in rats with
19
CA 03062870 2019-10-29
WO 2017/190044
PCT/US2017/030178
capsaicin (0.60 0.06 in naïve and 0.61 0.05 in capsaicin; n=7 rats) or CFA
(0.67 0.4 in naïve and
0.67 0.03 in CFA; n=11 rats). Similarly, c51-PFC coherence was not changed in
rats at day 7 (d7) after
001 (0.68 0.05) compared to naïve (0.65 0.04; n=5 rats), whereas it was
significantly (p<0.05) increased
starting at day 14 (d14) following nerve injury (0.71 0.04; n=5 rats).
Analgesic treatment with pregabalin
or mexiletine reversed c51-PFC coherence (p<0.05), with mexiletine having a
more pronounced
attenuating effect (0.71 0.04 for CCI d14 and 0.61 0.03 after pregabalin and
0.68 0.03 for CCI d16 and
0.50 0.10 after mexiletine, respectively; n=5 rats). Similarly, capsaicin and
CFA did not significantly effect
c51-i51 coherence and iS1-PFC coherence.
Coherence between iS1 and PFC was significantly (p<0.05) enhanced at d7 (0.61
0.03; n=6 rats)
and d14 (0.69 0.04 compared to naïve 0.59 0.06) after CCI (Fig 5B.) Coherence
between cS1 and iS1
was also significantly (p<0.05) enhanced at d7 (0.63 0.06 in naïve compared to
0.72 0.02 d7; n=6 rats)
and d14 (0.63 0.06 in naïve compared to 0.75 0.04 d14; n=6 rats) after CCI
(FIG. 5C).
In summary, 51-PFC coherence is enhanced in rats at d14 after CCI,
corresponding to a late-
stage neuropathic pain. This result indicates that increased functional
connectivity between 51- PFC may
predict pain transition from an acute to a chronic stage. In contrast, inter-
hemispheric coherence
between iS1 and cS1 increases in rats with CCI as early as d7 after CCI.
Lastly, control experiments demonstrated that cS1 mean EEG power did not
significantly
changed in rats following capsaicin sham (93 31 versus 100 24 in naïve; n=3
rats), d7 CCI sham
(105 27 versus 100 24 in naïve; n=6 rats), and d2 CFA sham (85 11 versus 100
23 in naïve; n=5 rats;
.. FIG. 6). We also confirmed that intradermal vehicle injection in the left
hindpaw of rats at d2 after CFA
had no effect on mean cS1 EEG power (94 4 compared to CFA d2 pre-vehicle 100
9; n=4 rats).
Moreover, coherence in the 3-30 Hz range between waveforms recorded via pairs
of EEG electrodes did
not change in these same control experiments.
In the present study, we used a relatively non-invasive EEG recording methods
in awake, freely
behaving rats to demonstrate that pain modulates on-going oscillations in
clinically relevant models and
that effective analgesic drugs reverse this modulation. These results suggest
that brain oscillations
predict spontaneous nociceptive states in rodents (Table 1).
CA 03062870 2019-10-29
WO 2017/190044
PCT/US2017/030178
Table 1. Summary of EEG results in different pain models (black cells
represent significant increases
compared to naïve rats).
Acut,.s.throrW.:
Pain model pajn
" Cap CFA CC1d7 CC1c114:
tE;
4)
PFC 1111111111111111111111111111111111111111i 1111111
Si -CSi
(D,
-PFC¨
CS1-PFC
Example 8. Increased PSD during pain states in humans
A wireless, 16-electrode, single-use EEG system (StatNetTM; BioSignal) was
used to determine
waveforms in brain tissue of healthy human subjects during a pain state of
distress-tolerance (FIG. 7).
Subjects were randomized to receive ice water or room temperature water for 20
second intervals.
Subjects submerged a hand in the bucket of water (ice water or room
temperature) and were then asked
to rate their pain score at various times (FIG. 8A). Subjects who received ice
water reported a lower pain
score during the first 10 seconds of submersion compared to the last 10
seconds of submersion. There
was an increase in power in the theta range (6-7 Hz) associated with the
higher pain score at the Fz
placement electrode (FIG. 8B). Source localization showed a prominent 6-7 Hz
increase in power
corresponding to Fz, which overlaps with frontal cortex in humans and PFC in
rats (FIG. 80). Subjects
who received room temperature water did not exhibit an increase in power
corresponding to the Fz and
did exhibit decreased PSD across multiple frequency bands (3-30 Hz) in caudal
brain regions.
Example 9. Determination of theta oscillations in somatosensory cortex and
thalamic bursts
following pain
Experiments were performed to investigate the relationship between pain
behavior, theta (4-8 Hz)
oscillations in somatosensory cortex, and burst firing in thalamic neurons in
vivo. Thalamic bursts are
triggered predominantly by GABAergic drive from the reticular thalamic nucleus
(TRN), a thin layer
overlaying the thalamus that receives strong input from limbic cortical areas.
To selectively induce
thalamic bursts, TRNs were optically stimulated in awake, unrestrained
transgenic mice co-expressing the
vesicular GABA transporter (VGAT) with Channelrhodopsin-2 (ChR2). In these
mice, ChR2 expression in
the thalamus is restricted to the TRN. Age-matched wild-type (057 BI\6J) non-
ChR2 expressing mice
were also used to control for non-specific optical stimulation effects. The
naïve state refers to normal
conditions prior to induction of the pain models.
A custom-made multi-channel system was used to record extracellularly from
putative single-units
in ventral posterolateral (VPL) thalamus and local field potential (LFP) in
the primary somatosensory
21
CA 03062870 2019-10-29
WO 2017/190044
PCT/US2017/030178
cortex (Si) hindlimb area (FIGS. 9A-96). For a description of the FlexDrive
system assembly see
www.open-ephys.orq/flexdrive. Drives were positioned over the right side of
the brain targeting the VPL
thalamus (Bregma -1.22 to -1.40, 1.75 to 2.00 lateral, 3 to 4 mm vertical) and
SI cortex (Bregma -0.86 to -
1.10, 1.5 to 1.8 lateral, <0.5 mm vertical). In each mouse, 3-4 tetrodes were
positioned in VPL or SI and
one tetrode in TRN, where an optical fiber was positioned over the
somatosensory TRN (Bregma -1.20 to
-1.34, 2.30 to 2.40 lateral, 3.5 mm vertical). FlexDrives were fixed to the
skull using C&B-METABOND
Quick! Adhesive (ParkeII). After 3 days postoperatively, tetrodes were lowered
incrementally (-500 pm
over 5-7 days) until auditory confirmation of typical neuronal responses as
expected in VPL and SI (e.g.,
increased multiunit firing) evoked by light brushing of the left hindpaw.
Tetrode positions were also
corroborated by stereotaxic coordinates. Additional criteria for identifying
VPL units included peak-to-
trough duration of the action potential and the observations that most VPL
neurons increase in firing rate
in response to gentle brushing and noxious pinch of the receptive field (i.e.
wide dynamic range type)
while TRN neurons are predominantly inhibited. Chronic implants were stable
over several weeks,
allowing longitudinal analysis of neuronal activity with behavioral testing of
mechanical sensitivity.
For electrophysiological recording in naturally behaving mice, mice were
briefly sedated (1%
isoflurane <2 min) to allow connection of the FlexDrive to two-16 channels
preamplifier (TDT RA16PA),
headstages (TDT LP16CH) and a fiber optic patch cord (200 pm). Unrestrained
mice later recovered
from sedation in a 3x3" PLEXIGLAS enclosure for at least 15 minutes prior to
the start of
electrophysiological recording using a TDT RZ2 BioAmp processor at 24.4 kHz
sampling rate per
channel. Two sequential notch filters (58-62 Hz) were applied to reduce
electrical interference. The
behavior of the animal was noted to determine alert rest periods, defined as
alertness with no vigorous
movements such as grooming or scratching. At the end of the final recording
session, electrolytic lesions
were performed for postmortem histological verification of recording sites,
whereby brains were removed,
immediately placed in cryogenic compound (OCT), and frozen at -80 C for
further cryosectioning. Serial
sections (25 pm) were treated with cresyl violet and hematoxylin for viewing
under light microscope.
For tonic and burst spike sorting, extracellular spike waveforms (action
potentials) in VPL were
detected and sorted from LFP waveforms, bandpass filtered at 300-3000 Hz,
using primarily template
matching and principle component algorithms in 5pike2 (CED 1401, Cambridge
Electronic Design, UK).
Sorted spikes were then screened visually and inspected for false-positive or
overlapping unitary
assignments. Only one electrode per tetrode was used for spike sorting to
minimize redundant
assignments from the same unit. Hence, 3-4 units were isolated from VPL per
mouse, whereas cortical
oscillations reflected the mean of 3-4 LFP measurements in SI. Moreover,
isolation of putative unitary
spikes also met the criterion of inter-spike interval (ISI)>2 ms (refractory
period). Burst analysis was
performed on sorted spikes and others related to thalamic bursting evoked
specifically by TRN
stimulation, whereby burst events were identified according to the following
parameters: maximum
interval signifying burst onset = 4 ms, offset = 8m5, longest increase in ISI
within a burst = 2 ms, and
minimum number of spikes within a burst = 2.
For optical stimulation of TRN, laser light pulses were generated using a 100
mW 473 nm laser
(MBL473 OptoEngine LLC) connected to the FlexDrive via fiber patch cord. Pulse
control was achieved
using an isolated pulsegenerator (A-M systems 2100) at a 10 Hz frequency, 0.5
ms pulse width, and total
duration of 5 sec during electrophysiological recording. For behavioral
testing of the mechanical
22
CA 03062870 2019-10-29
WO 2017/190044
PCT/US2017/030178
withdrawal threshold, optical stimulation was applied for 2 seconds during the
application of von Frey
filaments.
For acute and chronic pain models, capsaicin (0.1%, 10 pl, intradermal) was
injected into the
plantar aspect of the left hindpaw under sedation (1.5% isoflurane <2 min) to
prevent stress due to
restraining the hindpaw. A TRPV1 agonist, capsaicin causes increased neuronal
firing of nociceptors,
mainly polymodal C-fibers. Chronic constriction injury (CCI) was induced in
the same mice that
underwent capsaicin treatment at 3 days post-injection after verifying that
mechanical withdrawal returned
to normal. The sciatic nerve was exposed unilaterally after skin incision at
the midthigh level and blunt
dissection of the biceps femoris under deep anesthesia (isoflurane, 3.5%).
Four chromic gut (5-0)
ligatures were tied loosely around the nerve 1 mm apart and the overlying
muscles and skin were closed
in layers with 5-0 ETHILON sutures.
Fast Fourier transform function (FFT) was used to convert LFP waveform from
the time domain to
the frequency domain, yielding power spectral density (PSD) histograms using 5
sec time intervals during
awake resting state (no difference was found compared to the multi-taper
method). Values were
generated at 57 frequencies (0.47 Hz bins) between 3-30 Hz. For the pain
state, data were collected
within 15-20 min after capsaicin injection.
Mechanical sensitivity of the hindpaw was assessed by measuring the threshold
of withdrawal in
response to the application of calibrated von Frey filaments of different
bending forces to the plantar
aspect of the hindpaw according to the `up-down' method, whereby filaments of
different bending forces
were pressed against the paw until buckling for a maximum of 3 seconds or a
withdrawal reflex. This test
represents naturally-occurring stimulation to the hindpaw in the noxious and
non-noxious range evoking a
biologically-relevant state in mammals.
In the dual chamber conditioned place preference (CPP) test, FlexDrive-
implanted mice were
conditioned with unrestricted access to both chambers for three days, with
baseline preference
determined on the third day. On the fourth day, mice underwent 'pairing' by
being individually restricted
to one chamber and receiving optical stimulation (10 Hz, 0.5 ms pulse width)
for 30 sec, then 4 hours
later they were restricted to the opposite chamber for 30 min after receiving
optogenetic stimulation. On
the fifth day, mice were allowed free access to both chambers. Chamber
preference was video recorded
and analyzed off-line by an observer blinded to the animal's treatment.
The distribution of the number of bursts and spikes in VPL per bin, and the
magnitude of SI theta
power per bin were analyzed for 919 bins for each mouse (n=5, bin size 30 ms).
Regarding SI theta
power, the mean observed power of 3 consecutive bins was used as the
representative power of a bin
(e.g. the average of the observed power of the bini-1, the bini, and the
bini+1 was used as the
representative power of the bini) to satisfy the conditions of accurate power
estimation (100 ms bin size)
and fine temporal resolution (30 ms bin size). Analysis revealed that both the
number of bursts and
spikes per bin had Poisson distribution and more than one burst or two spikes
per bin were considered
significant events. SI theta power per bin had a lognormal distribution.
The relationship between fluctuation of SI theta power and spikes or bursts
was analyzed using
cross-correlation analysis as described previously. Briefly:
Q0) 1./(r t)
23
CA 03062870 2019-10-29
WO 2017/190044
PCT/US2017/030178
Where, in the case of burst, X(i) was 1 (if there were any bursts in the bini)
or 0 (if there was no
burst in the bini), and in the case of spikes, X(i) was 1 (if there were more
than two spikes and no burst in
the bini) or 0 (otherwise). Y(i+t) represented the fluctuation of theta power
with t bins lags from the bini,
and was calculated as follows:
Itt:0 = tfo +
Where f(i) represents "¨log transformed Si theta power at bini", and Ai is the
size of bini. If no
relationship is found between bursts or spikes in VPL and fluctuation in SI
power, Q(t) would have normal
distribution. Thus, Z value was calculated for each Q(t) as follows:
1(t) =
Where:
E[X1E[Y]
And
WM] 1.fir telX2161Y9 EXPED12)
Z(t) was calculated for each mouse, and then, the average of Z(t) and the 95%
confidence
interval of Z(t) were calculated.
Analysis of variance (ANOVA) and parametric tests were used for statistical
analysis. Two-way
ANOVA analysis followed by Bonferroni's correction, Student's t-test, or the z-
score method was used to
compute statistical significance. Bartlett's test was performed to compute
normal distribution and equal
variance. A P value <0.05 was considered significant (denoted with * in
figures). For behavioral and
power data, comparisons were made between animal groups and for spike and
burst activity data
comparisons were made between neuronal groups. All values are reported as
standard error of the
mean (SEM).
Example 10. Thalamic bursts down-regulate cortical theta and nociceptive
behavior
Histological analysis confirmed that ChR2 expression was limited to GABAergic
neurons in the
TRN (FIGS. 90-9D). Optical stimulation at 10 Hz, which is consistent with the
physiological 'baseline'
firing rate of TRNs, effectively reduced SI theta power in sedated mice (FIG.
10A). In particular, TRN
stimulation at 0.5, 10, and 50 Hz reduced SI theta power to 5.14x10⁻² 7 10x10-
2 mV2, 4.35x10⁻² 0.33x10-
2 mV2, and 4.45x10⁻² 0.36x10⁻² mV2, respectively, compared to the baseline SI
theta power of 5.48x10-
2 0.38 mV2. TRN stimulation at 10 Hz reduced power in awake, resting mice
within the theta range of
3.8-8.5 Hz from 4.70x10⁻² 0.25x10⁻²mV2 to 3.97x10⁻² 0.40x10⁻² mV2 (FIG. 10B;
P=0.033). Moreover,
TRN stimulation increased the burst firing rate of putative single-units in
VPL from 0.07 0.09 Hz to
1.01 0.31 Hz (FIG. 100, P=0.002). This stimulation also enhanced the threshold
of paw withdrawal to
von Frey stimuli from 3.38 0.52 g to 5.02 0.88 g (FIG. 10D; P=0.03). These
results show that rescue of
24
CA 03062870 2019-10-29
WO 2017/190044
PCT/US2017/030178
TRN function by selective optical stimulation releases thalamic neurons from
inhibition, and thus,
promotes thalamic bursting, reduces cortical theta, and reverses nociceptive
behavior.
Next, the effect of TRN stimulation on thalamic firing was investigated in a
pain model. SI power
increased significantly in the theta band within 15-20 minutes after
intradermal injection of capsaicin in the
hindpaw from 4.82x10⁻² 0.57 x10⁻² mV2 to 8.15x10⁻² 0.13x10⁻² mV2 at 3.8-6.2 Hz
(FIG. 11A; P=0.048). In
these mice, TRN stimulation effectively reversed the pain-related increase in
SI power to normal levels
from 8.15x10⁻² 0.13x10⁻² mV2 to 4.55x10⁻² 0.75x10⁻² mV2 (FIG. 3a; P=0.002).
The rate of spontaneous
burst firing in VPL neurons (0.02 0.02) increased after capsaicin injection
(0.64 0.11) and was further
enhanced during TRN stimulation (1.50 0.25) in the same neurons (FIG. 11B;
*P=0.00002, *P=0.001).
Paw withdrawal threshold decreased within 15-20 minutes after capsaicin
injection from 4.47 1.07 g to.
1.00 0.37 g suggesting mechanical allodynia, which is a hallmark of
neuropathic pain (FIG. 11C;
*P=0.011). Optical TRN stimulation, however, elevated withdrawal thresholds to
near pre-capsaicin
levels of 4.28 1.22 (FIG. 110; *P=0.023). Reversal of these anti-nociceptive
effects to 1.41 0.22
occurred within 5 min afterwards (FIG.110; *P=0.048). We further investigated
the longitudinal effects of
TRN stimulation on thalamic firing, theta power, and nociceptive behavior
following chronic constriction
injury (CCI) of the sciatic nerve in the same animals. The results of these
studies are comparable overall
to those obtained in the capsaicin pain model.
The temporal relationship between thalamic firing and cortical theta was then
investigated. As
shown in a representative example of a time series of SI spectrogram with
corresponding VPL burst rate,
epochs of high theta power and burst events do not coincide temporally (FIG.
11D). Dynamic, time-
lagged cross-correlation between burst or tonic firing rate versus theta power
revealed a significantly
negative correlation between theta amplitude and burst rate, which suggests
that bursts (but not tonic
firing) likely trigger the down-regulation of SI theta with a time lag of 120
ms (FIG. 11E).
Promotion of burst firing in thalamocortical neurons during naïve and pain
states is negatively
correlated with cortical theta and mechanical allodynia. Our data show that
optogenetically-induced
thalamic bursts attenuate pain-induced cortical oscillations and enhance
withdrawal threshold to
mechanical stimuli. These results indicate that thalamic bursts are an
adaptive response to pain that de-
synchronizes cortical theta and decreases sensory salience. Optogenetic
stimulation of the thalamic
reticular nucleus promotes burst firing in the thalamus while down-regulating
theta oscillations in the
somatosensory cortex and attenuating pain behavior.
OTHER EMBODIMENTS
Various modifications and variations of the described methods will be apparent
to those skilled in
the art without departing from the scope and spirit of the invention. Although
the invention has been
described in connection with specific embodiments, it will be understood that
it is capable of further
modifications and that the invention as claimed should not be unduly limited
to such specific
embodiments. Indeed, various modifications of the described modes for carrying
out the invention that
are obvious to those skilled in the art are intended to be within the scope of
the invention. This
application is intended to cover any variations, uses, or adaptations of the
invention following, in general,
the principles of the invention and including such departures from the present
disclosure come within
CA 03062870 2019-10-29
WO 2017/190044
PCT/US2017/030178
known customary practice within the art to which the invention pertains and
may be applied to the
essential features herein before set forth.
What is claimed is:
26