Note: Descriptions are shown in the official language in which they were submitted.
CA 03065562 2019-11-28
WO 2019/036604 PCT/US2018/046893
IMAGE CAPILLARY ISOELECTRIC FOCUSING TO ANALYZE PROTEIN VARIANTS
IN A SAMPLE MATRIX
CROSS-REFERENCE TO RELATED APPLICATIONS
[0001] This application claim priority to U.S. Provisional Application Serial
No. 62/547,602 filed
on August 18, 2017, which is hereby incorporated by reference in its entirety.
SEQUENCE LISTING
[0002] The instant application contains a Sequence Listing which has been
submitted in ASCII
format via EFS-Web and is hereby incorporated by reference in its entirety.
Said ASCII copy,
created on August 15, 2018 is named REGE-005 001WO 5T25.txt and is 4,214 bytes
in size.
FIELD OF THE DISCLOSURE
[0003] The field of the present disclosure is directed to methods and systems
for analyzing charge
variants of proteins such as VEGF Trap in a sample matrix.
BACKGROUND
[0004] The analysis of charge variants is often desirable for various proteins
used as
biopharmaceuticals because such changes can affect drug activity, stability,
and in some cases,
patient safety. Conventional methods employed in the industry for identifying
and characterizing
charge variants include ion-exchange chromatography, isoelectric focusing gel
electrophoresis, and
capillary isoelectric focusing. Image capillary isoelectric focusing has been
found to be useful due
to its high resolution, reduced sample volume, and fast run times.
Accordingly, methods and
systems using image capillary isoelectric focusing to determine charge
variants for proteins such as
VEGF Trap would be beneficial.
1
CA 03065562 2019-11-28
WO 2019/036604 PCT/US2018/046893
SUMMARY OF THE INVENTION
[0005] Described herein are methods and systems for charge variant analysis of
various proteins.
For example, the methods and systems can be used to analyze charge variants of
VEGF Trap.
Instead of reporting charge variant distribution by grouping bands 3-9 in an
isoelectric focusing gel,
which is the currently approved method for analyzing VEGF Trap, the methods
and systems
described here generally use image capillary isoelectric focusing to report
charge heterogeneity in
terms of percentages of charge variant isoforms, and groups them into three
different regions of the
electropherogram. This reporting approach may be more sensitive to changes
that occur in the
isoforms of VEGF Trap samples.
[0006] As noted above, embodiments of the present disclosure are directed to
methods, systems
and devices for determining charge variants of a protein, and in particular,
an image capillary
isoelectric focusing (iCIEF) assay to assess charge variance of proteins such
as vascular endothelial
growth factor (VEGF) blocker, hereinafter referred to as "VEGF-Trap." iCIEF is
an alternative for
the currently approved Isoelectric Focusing (IEF) method for VEGF-Trap charge
variant analysis.
[0007] Embodiments of iCIEF correspond to techniques which separate protein
charge variants
based upon their isoelectric point (pI). For example, in some embodiments, a
protein sample is
loaded onto a separation capillary comprising a mixture of carrier ampholyte
(e.g., PharmalyteTm),
methylcellulose, and a stabilizing additive (i.e. urea). A voltage is applied
for a predetermined
period of time resulting in the carrier ampholyte forming a pH gradient within
the capillary. In some
embodiments, the voltage is applied for a second, longer period of time
corresponding to a
"focusing" time. This results in the protein charge variants migrating within
the capillary until
reaching a point where the overall charge of the variants is neutral (i.e.,
their pI).
[0008] In such embodiments, the capillary tube (which is coated with
fluorocarbon (FC)) is
coupled to a digital (e.g., CCD) camera which enables direct detection and
quantitation of the
protein charge variants. Specifically, after the focusing time, the CCD camera
is configured to
image the capillary tube (preferably in real time) to detect the protein
within the capillary.
2
CA 03065562 2019-11-28
WO 2019/036604 PCT/US2018/046893
Detection, in some embodiments, occurs at a wavelength of approximately 280
nm. Parameters in
this technique include:
- brand and concentration of ampholyte,
- type and concentration of additives used, and
- focusing time and sample concentration.
[0009] Aggregation and precipitation of the protein within the capillary is
detrimental to the
reproducibility of the electropherogram. To this end, additives, such as urea,
may be used to help
stabilize and solubilize the protein as it is focused.
[0010] Accordingly, in some embodiments, a method for analyzing charge
variants of vascular
endothelial growth factor VEGF-Trap is provided and includes loading a protein
sample onto a
separation capillary having a mixture of at least a carrier ampholyte,
methylcellulose, and a
stabilizing additive, applying a first voltage for a first predetermined
period of time such that the
carrier ampholyte forms a pH gradient within the capillary, applying a second
voltage for a second
predetermined period of time to focus the migration of charge variants of the
protein to their
respective pI, and detecting and quantifying charge variants of the protein.
[0011] In such embodiments, detecting and quantifying charge variants
comprises measuring the
absorbance for a plurality of charge variant isoforms, segregating the
plurality of charge variant
isoforms into isolated regions comprising at least a first acid/acidic region
(R1), a second neutral
region (R2), and a third base/basic region (R3), and determining a percentage
of charge variant
isoforms falling within in each of regions R1, R2 and R3.
[0012] For such embodiments, image analysis for detecting and quantification
can be according to
conventional methods and systems (e.g., image analysis software.
[0013] In the embodiments summarized above, one and/or another of the
following additional
features/functionality may be included (resulting yet in further inventive
embodiments), however, it
should be pointed out that any one or more of these features may be different
and yet be within the
scope of the present invention ¨ the list provided below is but one
embodiment:
3
CA 03065562 2019-11-28
WO 2019/036604 PCT/US2018/046893
- detecting and quantifying of charge variants are performed;
- detection of charge variants occurs at a wavelength of approximately 280
nm;
- the concentration of protein loaded onto the capillary tube is
approximately 2.0 mg/ml;
- the stabilizing additive comprises urea;
- the amount of urea in the mixture comprises approximately 2M;
- the mixture includes approximately 0.35% methylcellulose;
- the first voltage comprises 1500 V;
- the first predetermined time is approximately 1 minute;
- the second voltage comprises 3000 V;
- the second predetermined time is approximately 7 minute;
- the concentration of protein loaded onto the capillary tube is between
approximately 1.0 and
8.0 mg/ml;
- the amount of urea in the mixture is greater than OM and less than
approximately 8M;
- the mixture includes between approximately 0.01% and approximately 0.35%
methylcellulose, or any intervening range;
- the first voltage is between approximately 1V and about 3000 V, or any
intervening range;
- the first predetermined time is between approximately 1 second and
approximately 5
minutes, or any intervening range;
- the second voltage is between about 1V and approximately 3000 V, or any
intervening
range; and/or
- the second predetermined time is between approximately 1 minute and
approximately 14
minutes, or any intervening range.
[0014] In some embodiments, an iCIEF capillary tube configured for use in a
charge variant
analysis of VEGF-Trap is provided and includes a capillary tube configured to
receive a protein,
and configured with a mixture of carrier ampholyte, methylcellulose, and a
stabilizing additive. The
capillary tube may also include a fluorocarbon coating.
[0015] In some embodiments, an iCIEF kit configured for use in a charge
variant analysis of
VEGF-Trap is provided and includes one or more capillary tubes configured to
receive a protein,
4
CA 03065562 2019-11-28
WO 2019/036604 PCT/US2018/046893
and configured with a mixture of carrier ampholyte, methylcellulose, and a
stabilizing additive,
wherein the capillary tube includes a fluorocarbon coating.
BRIEF DESCRIPTION OF THE DRAWINGS
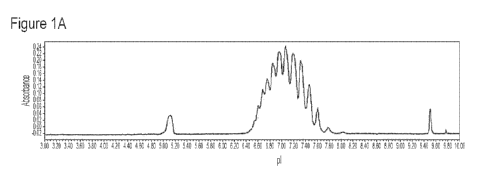
[0016] Figures 1A-1F depict electropherograms of VEGF Trap using different
ampholytes. In
Figure 1A, the ampholyte is PharmalyteTM having a pI ranging from 3-10; in
Figure 1B, the
ampholyte is a combination of PharmalyteTM with pI ranging from 5-8 and
PharmalyteTM having a
pI ranging from 8-10.5; in Figure 1C, the ampholyte is ServalytTM having a pI
ranging from 2-9; in
Figure 1D, the ampholyte is ServalytTM having a pI ranging from 4-9; in Figure
1E, the ampholyte is
BiolyteTM having a pI ranging from 3-10; and Figure 1F, the ampholyte is a
combination of
PharmalyteTM having a pI ranging from 3-10 and PharmalyteTM having a pI
ranging from 6.7 to 7.
[0017] Figure 2A-2E compare the electropherograms of VEGF Trap at varying urea
concentrations.
[0018] Figure 3 compares the electropherogram of VEGF Trap obtained using
isoelectric focusing
and image capillary isoelectric focusing methods.
[0019] Figures 4A-4G illustrate VEGF Trap OFFGEL fraction analysis (fractions
#5-#10) using
isoelectric focusing and image capillary isoelectric focusing methods.
[0020] Figures 5A-5F illustrate electropherograms of VEGF Trap RS spiked with
VEGF Trap
OFFGEL fractions (fractions #5-#10) analyzed in Figs. 4A-4G.
[0021] Figure 6 compares the electropherogram of a blank and VEGF Trap spiked
with an
independent marker.
[0022] Figure 7A shows the image capillary isoelectric focusing
electropherogram of a VEGF
Trap RS sample with Regions 1, 2, and 3 assigned.
[0023] Figure 7B illustrates the difference in electropherogram reporting
between the isoelectric
focusing method and image capillary isoelectric focusing method.
CA 03065562 2019-11-28
WO 2019/036604 PCT/US2018/046893
[0024] Figure 8 provides data obtained using image capillary isoelectric
focusing relating to
VEGF Trap stability.
[0025] Figure 9 provides stability data obtained using image capillary
isoelectric focusing
performed on forcibly degraded VEGF Trap samples.
[0026] Figures 10A-10C show the statistical analysis of image capillary
isoelectric focusing data
provided in Figure 9.
[0027] Figure 11 provides data relating to linearity of the image capillary
isoelectric focusing
method.
[0028] Figure 12 compares image capillary isoelectric electropherograms for
three samples of
ampholyte.
[0029] Figures 13A-13D show the statistical analysis of image capillary
isoelectric focusing data
obtained from historical VEGF Trap samples.
DETAILED DESCRIPTION OF THE INVENTION
[0030] Described herein are methods and systems for charge variant analysis of
various proteins
such as VEGF Trap. VEGF Trap is a fusion protein comprising the sequence shown
in Table 1
Instead of reporting charge variant distribution by grouping bands 3-9 in an
isoelectric focusing gel,
which is the currently approved method for analyzing VEGF Trap, the methods
and systems
described here generally use image capillary isoelectric focusing to report
charge heterogeneity in
terms of percentages of charge variant isoforms, and groups them into three
different regions of the
electropherogram. This reporting approach may be more sensitive to changes
that occur in the
isoforms of VEGF Trap samples, as previously mentioned.
6
CA 03065562 2019-11-28
WO 2019/036604 PCT/US2018/046893
Table 1¨ VEGF Trap sequence
Protein Sequence
SEQ ID NO
SD TGRPFVEMYSEIPEIIHM rEGRELVIPCRVTSPNITVTLK
KFPLDTLIPDGKRIIWDSRKGFIISNATYKEIGLLTCEATVN
GHLYKTNYLTHRQTNTIIDVVLSPSHGIELSVGEKLVLNC
TARTELNVGIDFNVVEYPSSKHQHKKLVNRDLKTQSGSEM
KKFLSTLTIDGVTRSDQGLYTCAASSGLMTKKNSTFVRV
VEGF Trap HEKDKTHTCPPCPAPELLGGPSVFLFPPKPKDTLMISRTPE 1
VTCVVVDVSHEDPEVKFNVVYVDGVEVHNAKTKPREEQ
YNSTYRVVSVLTVLHQDWLNGKEYKCKVSNKALPAPIE
KTISKAKGQPREPQVYTLPPSRDELTKNQVSLTCLVKGFY
PSDIAVEWESNGQPENNYKTTPPVLDSDGSFFLYSKLTVD
KSRWQQGNVFSCSVMHEALHNHYTQKSLSLSPG
[0031] The following acronyms are used throughout the present disclosure:
- iCIEF ¨ Imaging Capillary Isoelectric Focusing
- IEF ¨ Isoelectric Focusing
- pI ¨ Isoelectric point
- RS ¨ Reference Standard
- DS ¨ Drug substance
- DSI ¨ Drug Substance Intermediate
- FDS ¨ Formulated Drug Substance.
[0032] The methods for analyzing charge variants of VEGF Trap generally
include loading a
protein sample onto a separation capillary comprising a mixture of at least a
carrier ampholyte,
methylcellulose, and a stabilizing additive, applying a first voltage for a
first predetermined period
of time such that the carrier ampholyte forms a pH gradient within the
capillary, applying a second
voltage for a second predetermined period of time to focus the migration of
charge variants of the
protein within the capillary such that the overall charge of the variants is
neutral, and detecting and
quantifying charge variants of the protein.
7
CA 03065562 2019-11-28
WO 2019/036604 PCT/US2018/046893
[0033] The separation capillary may be loaded with VEGF Trap at a
concentration ranging from
about 0.5 mg/mL to about 2 mg/mL. For example, the separation capillary may be
loaded with
VEGF Trap at a concentration of about 0.5 mg/mL, about 1.0 mg/mL, about 1.5
mg/mL, or about 2
mg/mL. In some embodiments, the separation capillary is loaded with VEGF Trap
at a
concentration of about 1.0 mg/mL.
[0034] The amount of methylcellulose in the mixture may range from about 0.01%
to about
0.35%. For example, the amount of methylcellulose in the mixture may be about
0.01%, about
0.05%, about 0.10%, about 0.15%, about 0.20%, about 0.25%, about 0.30%, or
about 0.35%. In
some embodiments, the amount of methylcellulose in the mixture is about 0.35%.
[0035] With respect to the first voltage, it may range from approximately 1 V
to approximately
3000 V. For example, the first voltage may be about 1 V, about 100 V, about
500 V, about 1000 V,
about 1500 V, about 2000 V, about 2500 V, or about 3000 V. In some
embodiments, the first
voltage is about 1500 V.
[0036] The second voltage may also range from approximately 1 V to about 3000
V. For
example, the second voltage may be about 1 V, about 100 V, about 500 V, about
1000 V, about
1500 V, about 2000 V, about 2500 V, or about 3000 V. In some embodiments, the
second voltage is
about 3000 V.
[0037] The first predetermined time may range from about 1 second to about 5
minutes. For
example, the first predetermined time may be about 1 second, about 10 seconds,
about 20 seconds,
about 30 seconds, about 40 seconds, about 50 seconds, about 1 minute (60
seconds), about 1.5
minutes (90 seconds), about 2 minutes (120 seconds), about 2.5 minutes (150
seconds), about 3
minutes (180 seconds), about 3.5 minutes (210 seconds), about 4 minutes (240
seconds), about 4.5
minutes (270 seconds), or about 5 minutes (300 seconds). In some embodiments,
the first
predetermined time is about 1 minute (60 seconds).
[0038] The second predetermined time may range from about 1 minute to about 14
minutes. For
example, the second predetermined time may be about 1 minute, about 2 minutes,
about 3 minutes,
8
CA 03065562 2019-11-28
WO 2019/036604 PCT/US2018/046893
about 4 minutes, about 5 minutes, about 6 minutes, about 7 minutes, about 8
minutes, about 9
minutes, about 10 minutes, about 11 minutes, about 12 minutes, about 13
minutes, or about 14
minutes. In some embodiments, the second predetermined time is about 7
minutes.
[0039] Any suitable additive may be employed in the mixture. In some
embodiments, it may be
beneficial to use urea as the additive. For example, 2M urea may be beneficial
to include in the
mixture. Various reagents (ampholytes) may also be included in the mixture, as
further detailed
below. In one embodiment, VEGF Trap is loaded into a capillary at a
concentration of 1.0 mg/mL,
and analyzed using an image capillary isoelectric focusing method that employs
a mixture of 0.35%
methylcellulose, 2M urea, and 3% ampholyte having a pI of 3-10.
[0040] Reagents and Equipment. Table 2 below lists reagents (ampholytes) and
equipment used
according to some embodiments of the present disclosure. Examples performed
utilize an iCE3
(ProteinSimple0) charge variant analyzer. Unless otherwise indicated, VEGF-
Trap Reference
Standard (RSVITV-5), was used as a test article during method development and
characterization.
Table 2 - Example Reagents and other components used
Sample Reagent
PharmalyteTM 3-10
ServalytTM 4-9
ServalytTM 2-9
PharmalyteTM 5-8
PharmalyteTM 8-10.5
PharmalyteTM 6.7-7.7
BiolyteTM 3-10, 40%
Urea
Methylcellulose
9
CA 03065562 2019-11-28
WO 2019/036604 PCT/US2018/046893
Sample Reagent
pI marker (5.12, 7.05, 7.65)
ProteinSimple iCE3
Example for at least some of the embodiments:
[0041] Ampholyte screening was initially performed based upon a pI range and
source of
ampholytes. Four ampholytes, each covering a unique pI range, were procured
from three different
sources. The ampholytes were analyzed using the following starting:
- 2.0 mg/mL protein concentration,
- 2 M urea,
- 0.35% methylcellulose,
- 1 minute of pre-focusing at 1500 V, and
- 7 minutes of focusing at 3000 V.
[0042] Figures 1A-F illustrate the electropherogram obtained using six ranges
of ampholytes with
the iCE3 charge analyzer. The following ampholyte ranges were used:
Figure A ¨ 3-10 Pharmalyte Figure B ¨ 5-8/8-10.5 combo Pharmalyte
Figure C ¨ 2-9 Servalyt Figure D ¨ 4-9 Servalyt
Figure E ¨ Bio-Lyte 3-10, 40% Figure F ¨ 3-Blend of 3-10 and 6.7-7.7
Pharmalyte
[0043] Protein Selected. Ampholytes ranging from pI 3-10 were chosen as the
overall profile of
the iCIEF electropherogram since they most closely resembled the
electropherogram from the
currently approved charge variant analysis procedure for VEGF-Trap (see, e.g.,
IEF image shown in
Figure 3).
[0044] Urea optimization. Method optimization, according to some embodiments,
also included
varying urea concentration (from absence of urea up to 8M). Figures 2A-2E
illustrate the effect of
such varying urea concentration on the VEGF-Trap RSVITV-5 sample
electropherogram. While
CA 03065562 2019-11-28
WO 2019/036604 PCT/US2018/046893
reduction in urea concentration typically improves resolution, it was found
that increased urea (8M)
lead to a decrease in resolution. However, VEGF-Trap resolved under native
conditions (no urea)
had similar issues of decreased resolution and lacked reproducibility.
Accordingly, the overall peak
pattern and resolution was comparable to each other for VEGF-Trap when
separated using 1-3 M
urea concentration.
[0045] Further experiments were conducted using 2 M urea to optimize the
ampholyte 3-10
concentration and protein concentration. Figure 3 illustrates the
electropherograms obtained using
2 M Urea, 0.35% Methyl Cellulose and 3% 3-10 ampholyte at 1.0 mg/mL protein
concentration.
The iCIEF electropherogram was compared to another electropherogram and a
tentative peak
assignment was made (Figure 3).
[0046] Method Characterization. The overall charge profile and the pattern of
peaks obtained
using the iCIEF, assay method was comparable to the IEF band profile (as shown
in Figures 2A-
2E). However, to further understand and bridge the banding pattern of the IEF
assay method to the
peak pattern obtained using iCIEF analysis, OFFGEL fractionation of VEGF-Trap
sample was
undertaken. The individual charge variant fractions obtained from the OFFGEL
electrophoresis
were analyzed using IEF and iCIEF assay methods. An Agilent 3100 OFFGEL
Fractionator was
used to fractionate VEGF-Trap Reference Standard according to its isoelectric
points, and the
separated isoforms recovered as liquid fractions were analyzed using the two
methods, IEF and
iCIEF. VEGF-Trap RS was fractionated using Immobilized pH Gradient strips (IPG
strips) with a
pH 6-9 that covers the pI range of charge variants observed for VEGF-Trap. A
detailed set up of the
experiment and separation is as follows:
[0047] 1) A stock solution was prepared by combining 2.3 mL 50% glycerol,
230.4 IA of IPG buffer
(pH 6-11), and 16.64 ml water to produce a total volume of 19.2 ml.
[0048] 2) VEGF Trap solution was prepared by adding 73 lig VEGF (4.2 mg) to 12
mL stock
solution and 3 mL water.
11
CA 03065562 2019-11-28
WO 2019/036604 PCT/US2018/046893
[0049] 3) IPG strip rehydration solution was prepared in excess by combining
1.15 mL of water
with 4.6 mL of stock solution.
[0050] 4) IPG gel strips, pH range of 6-9 (24 cm), were arranged in every
other lane of the two
instrument trays, and 24 well frames were snapped in place over them. The
standard OFFGEL
kit protocol (see OFFGEL user manual: Agilent 3100 OFF GEL Fractionator Kit
quick Start
Guide, 5th Edition Sep 2010) was used for strip rehydration, antibody loading,
and loading of
the trays onto the instrument.
[0051] 5) A platform temperature of 20 C was used. The standard instrument
protein focusing
method for a 24 well setup was run using a constant current of 50 nA with a
max voltage setting
of 8000 V and a max power setting of 200 mW.
[0052] 6) After 34 h of fractionation, the run was stopped and like well
numbers from each lane for
wells 3 to 12 were pooled, then exchanged into water, and concentrated
approximately 5-fold
prior to analysis.
[0053] 7) Antibody quantities in each fraction were determined by measuring
the absorbance at 280
nm with extinction coefficient of 1.15 on a Nanodrop. One instrument to
determine the
concentration of the fraction and then multiplying the volume of the fraction
by the
concentration.
[0054] Briefly, 4.2 mg of VEGF-Trap RS was fractionated using 12 IPG strips
for 32 hours; the
individual fractions from each strip corresponding to the same pI range were
pooled and quantified
after dialysis. From the fractionation, a total of seven fractions (Fractions
4-10) which had sufficient
recovery were analyzed using IEF and iCIEF. The fractions were analyzed two
ways: Individual
analysis of OFFGEL fractions (4-10) using IEF and iCIEF assay methods (see
Figure 4) and spiking
of the OFFGEL fractions (5-10) into the VEGF-Trap RS followed by analysis of
the spiked samples
using IEF and iCIEF (Figure 5). Table 3 lists the fractions and the
corresponding amount recovered
from the OFFGEL Fractionation study.
12
CA 03065562 2019-11-28
WO 2019/036604 PCT/US2018/046893
Table 3
OFF GEL Protein Cone. Volume Recovered
fraction No. (mg/mL) (.IL)
3* 1.229 15
4 1.628 98
1.884 104
6 2.909 113
7 3.498 124
8 3.56 124
9 3.326 124
2.098 110
11* 1.235 94
12* 2.574 15
[0055] In addition to analyzing the OFFGEL fractions independently using IEF
and iCIEF,
fractions (5-10) which yielded higher recovery were spiked at a ratio of 1:0.1
(VEGF-Trap RS :
Fraction) and analyzed by the two charge variant analysis methods. Figure 5
illustrates a panel of
electropherograms of VEGF-Trap RS spiked with the VEGF-Trap OFFGEL fractions
(5-10)
analyzed using iCIEF (Top Panel) and IEF (Bottom panel) assay methods. For
each of the OFFGEL
fractions spiked into the RS, the corresponding control RS (Unspiked) is
overlaid for the IEF and
iCIEF assay methods. The overlay of the spiked and unspiked (RS+OFFGEL and RS)
samples helps
in visualizing and understanding the correlation in pattern of peaks between
the IEF and iCIEF
assay methods. In each panel, the enhancement of charge species corresponding
to the fraction
spiked is highlighted using an arrow beginning from the acidic fractions
(Figure 5A) to the basic
fractions (Figure 5F).
[0056] Correlation between the gel based IEF band pattern and the capillary
based iCIEF peak
pattern was evident from the analysis of OFFGEL fractions. From Figures 4 and
5 (individual
fraction analysis together with spiked fractions) it can be inferred that the
charge isoform separation
achieved by the currently approved IEF gel method is comparable and similar to
the pattern of
peaks obtained using capillary based iCIEF method for VEGF-Trap.
[0057] Reporting charge variant distribution using the iCIEF method. The
currently
approved IEF method for VEGF-Trap charge variant distribution reports the
percentage charge
13
CA 03065562 2019-11-28
WO 2019/036604 PCT/US2018/046893
variance by grouping bands 3-9 in the IEF gel. The area percentages of bands 3-
9 are summed and
reported using, e.g., Myoglobin (an independent protein marker) as a guide to
identify the band
numbers based on the pI of Myoglobin. The current specification acceptance
criterion (SPEC) for
the IEF method is 82% (Bands 3-9).
[0058] A similar approach was adopted for the new iCIEF assay method where an
independent
marker from ProteinSimple, pI 7.05 Marker Cat# 102226 is spiked into the iCIEF
master mix (2 M
urea, 0.35% Methyl Cellulose, 3% 3-10 ampholyte). The iCIEF electropherogram
of the marker
7.05 spiked into the master mix is shown in Figure 6 (Top panel), the
bracketing pI 5.12 and pI 9.50
markers in the master mix are used for calibration purposes. The bottom panel
of Figure 5 shows the
iCIEF electropherogram of the VEGF-Trap RS overlaid with the blank containing
the spiked 7.05
marker that will be used for identifying Peak 5 in the VEGF-Trap iCIEF sample
profile. The marker
peak 7.05 migrates at a pI in between peaks 4 and 5 and this will serve to
identify the principal peak
6 in the cluster of principal isoforms for VEGF-Trap (Peaks 5, 6 and 7).
[0059] Rather than report peaks 3-9 like the IEF method, the iCIEF method
(according to some
embodiments) reports the charge heterogeneity of the VEGF-Trap sample in terms
of percentages of
charge variant isoforms grouped as Region 1 (Acidic), Region 2 (Neutral) and
Region 3 (Basic).
The cluster of three principal peaks (Peak numbers 5, 6 and 7) in the VEGF-
Trap iCIEF
electropherogram that migrate around the neutral pI range and which are the
most prominent
isoforms will be grouped as Region 2 (Neutral). Among the cluster of three
peaks, a distinct isoform
corresponding to principal peak 5 that migrates to a specific pI is identified
using an independent pI
7.05 marker spiked in the blank injection as shown in Figure 7. Region 1
(Acidic) in the VEGF-
Trap iCIEF sample is reported as the group of peaks that are relatively acidic
compared to the
cluster of three principal peaks (Peaks 5, 6 and 7) in the VEGF-Trap
electropherogram. Region 3
(Basic) in the VEGF-Trap iCIEF sample is reported as the group of peaks that
are relatively Basic
compared to the cluster of three principal peaks (Peaks 5, 6 and 7) in the
VEGF-Trap
electropherogram.
[0060] The reporting approach using the Region 1, 2 and 3 offers an advantage
of allowing tighter
control over the charge variant isoforms by means of monitoring three regions
(Regions 1, 2 and 3)
14
CA 03065562 2019-11-28
WO 2019/036604 PCT/US2018/046893
as opposed to the traditional IEF gel based method's grouping of bands 3-9.
Figure 7B illustrates the
differences between IEF reporting and reporting according to embodiments of
the iCIEF method of
the present disclosure. In addition, the reporting in terms of Regions 1, 2
and 3 offers the iCIEF
assay method an unique advantage in its sensitivity to changes in charge
variant isoforms much
earlier than the traditional approach. This makes the iCIEF assay much more
sensitive in its read out
and a better stability indicating assay than the previous IEF assay procedure.
Table 4 below gives an
example of the stability indicating ability of the new grouping approach
adopted for the iCIEF assay
method as opposed to the traditional 3-9 reporting of the IEF assay.
Accelerated VEGF-Trap
stability samples were analyzed using the new iCIEF assay by two reporting
approaches - Regional
grouping and peaks 3-9 similar to the IEF assay method and compared to the
historical results from
the IEF assay method.
[0061] In Table 4 (below), it can be seen that the Region 1, 2 and 3 grouping
approach is much
more sensitive and indicative of the changes in the charge variant
distribution of the VEGF-Trap
sample. The IEF method showed a change in overall charge distribution with a
decrease of 2 % for
the bands 3-9 and this change was comparable to the results from the iCIEF
assay method when
grouped using the 3-9 peak approach. However, it is evident from Table 4 that
for the 25 C
accelerated stressed sample of VEGF-Trap, a 5% increase in Region 1 (or acidic
variants) and a
concomitant decrease of around 5% for Region 3 (Basic variants) was observed
using the iCIEF
assay. This trend observed in the VEGF-Trap charge distribution in the iCIEF
assay is an accurate
reflection of the nature of changes to occur in the VEGF-Trap sample based on
its structure and
complexity of charge pattern attributable to its varying degree of
sialylation. The increase in Acidic
variants (Region 1 - high degree of sialylated species) of VEGF-Trap sample
using the iCIEF assay
method under accelerated thermal stress is reflective of possible deamidation
coupled with
aggregation. On the other hand, grouping using the traditional 3-9 bands by
the IEF method masks
the subtle changes occurring in the VEGF-Trap charge isoforms and leaves
little room to control the
different charge species making it not as sensitive a method to detect the
subtle changes in the
charge heterogeneity of VEGF-Trap sample.
CA 03065562 2019-11-28
WO 2019/036604 PCT/US2018/046893
[0062] VEGF-Trap has ten glycosylation sites. The glycan chains attached to
these sites are
branched and each branch may or may not end with the negatively charged sugar
monomer, sialic
acid. The natural variation in the presence of sialic acid groups at the
termini of the glycan chains
leads to an ensemble of VEGF-Trap charge variant having a range in net charge.
The proportion of
these bands varies depending on the abundance of the charged species present.
Thus the new
reporting approach of grouping the various charge species based on Regions 1
(heavily sialylated), 2
(moderately sialylated) and 3 (least sialylated) makes the iCIEF assay more
responsive to the
changes that occur in the sialylforms of VEGF-Trap sample.
Table 4
iCIEF IEF iCIEF
Stress Condition % R1 % R2 % R3 % 3-9 Bands %
3-9 Peaks
VEGF 25 C 1 month 31.90 43.09 25.01 82.94
87.48
VEGF 25 C 3 months 33.85 43.28 22.87 82.11 87.86
VEGF 25 C 6 months 37.25 42.47 20.28 80.42 85.15
Difference (%) 5.35 -0.62 -4.73 -2.52 -2.33
[0063] Stability Indicating Ability of the iCIEF assay method. Real time
stability samples of
VEGF-Trap DP sample (held at 2-8 C) were analyzed using 7 independent time
points spanning a
time period of 24 months; Table 5 (below) shows the data corresponding to this
study. The
historical IEF data for these VEGF-Trap samples is provided for reference and
compared to VEGF-
Trap iCIEF data from regional grouping and 3-9 peak reporting. At the real
time storage condition
of 2-8 C little to no significant change was observed for the VEGF-Trap sample
based on historical
IEF data, a similar trend was observed when reported using the iCIEF 3-9 peak
approach.
Table 5 - Real time VEGF-Trap sample analyzed using iCIEF
IEF
iCIEF
Condition Time %RI_ %R2 %R3
(003-9) ( 03-9)
C 3 months 33.67 46.49 19.84 89.21 85.45
5 C 6 months 32.90 47.14 19.96 87.09
85.26
5 C 9 months 33.20 46.99 19.81 88.78
85.23
5 C 12 months 33.71 47.05 19.24 91.37
85.12
5 C 15 months 33.71 46.80 19.49 89.92
85.05
5 C 18 months 33.89 47.00 19.11 88.27
85.25
16
CA 03065562 2019-11-28
WO 2019/036604 PCT/US2018/046893
IEF
iCIEF
Condition Time %R2 %R3
(003-9)
(003-9)
C 24 months 34.14 46.87 18.99 89.79 85.03
[0064] Figure 8 shows the Linear fit of the % Regions 1, 2 and 3 of the VEGF-
Trap over the 24
month time period using iCIEF. A small but steady increase in Region 1 with a
decrease in Region 3
is evident from the plots.
[0065] Additional analysis using forcibly degraded VEGF-Trap DS sample was
performed using
the new iCIEF assay method. For this study, thermally degraded VEGF DS sample
diluted and
stressed at 45 C for over a period of 15 days was analyzed at 0, 3, 9 and 15
day time points using
the iCIEF method (Regional and 3-9). It is evident from Table 6 (below), that
a subtle increase in
acidic charge variants (Region 1) is observed for the iCIEF assay method when
grouped using the
Regional approach as compared to the 3-9 peak reporting at a much earlier time
point for the
forcibly degraded VEGF-Trap sample. While the % 3-9 reporting showed a 2%
change in overall
charge distribution across the 3-9 peaks, the Region 1 under the same
conditions showed a 7%
increase while Region 3 showed a concomitant decrease of 8% with time. Figure
9 shows the
electropherogram of the forcibly degraded VEGF-Trap sample using the iCIEF
assay method; an
increase in Acidic species is evident from the profile.
Table 6 - Percentage distribution of forcibly degraded VEGF-Trap sample
analyzed using
iCIEF (thermal stress)
iCIEF iCIEF
Stress Condition % R1 % R2 % R3 % 3-9 Peaks
VEGF DS 45 C Day 0 28.66 44.30 27.04 84.54
VEGF DS 45 C Day 3 29.47 44.60 25.93 83.90
VEGF DS 45 C Day 9 31.83 45.88 22.29 83.56
VEGF DS 45 C Day 15 35.65 45.35 19.00 82.44
Difference (%) 6.99 1.05 -8.04 -2.10
[0066] Statistical analysis of the % distribution of the three regions for the
VEGF-Trap stress
sample was performed by comparing against the respective peak percentage for
the VEGF non-
stressed sample. Figures 10A-10C show the statistical analysis of the
thermally stressed VEGF-Trap
17
CA 03065562 2019-11-28
WO 2019/036604 PCT/US2018/046893
sample for the iCIEF data. A statistical significant change was observed for
Regions 1 and 3
respectively.
[0067] Based on the iCIEF assay method characterization and optimization data,
assay parameters
were derived and is tabulated in Table 7 (below). These method conditions were
assessed for
linearity, accuracy, precision and intermediate precision.
Table 7 - Critical Method Parameters Derived From Development and Optimization
Experiments
Urea 2M
Methylcellulose 0.35%
ampholyte 3-10 3%
VEGF-Trap 1.0 mg/mL
Pre-focusing 1 min @ 1500 V
Focusing 7 min @ 3000 V
[0068] iCIEF Assay Method Qualification. Linearity of iCIEF assay method.
Method linearity
was evaluated by a single analyst. Sample solutions were prepared using VEGF-
Trap reference
standard at varying protein concentrations of 0.5 mg/mL, 1.0 mg/mL, 1.5 mg/mL
and 2.0 mg/mL. In
this experiment, the protein concentration in the sample matrix was varied
from 0.5 to 2 mg/mL
while keeping other matrix components constant at 3% ampholyte 3-10 and 0.35%
methylcellulose.
The focusing time was also kept constant at 1+7 minutes. Table 8 summarizes
the percentage
distribution of Regions 1, 2 and 3 for the VEGF-Trap sample across the linear
range of 0.5 to 2.0
mg/mL. The Linearity plot of concentration as a function of Area counts for
the VEGF-Trap sample
is provided in Figure 11.
Table 8 - Linearity of the iCIEF assay method
VEGF-Trap RS
% R1 % R2 % R3
(mg/mL)
0.5 29.51 46.44 24.05
0.5 29.79 46.38 23.84
1 29.66 45.88 24.46
18
CA 03065562 2019-11-28
WO 2019/036604 PCT/US2018/046893
VEGF-Trap RS
% R1 % R2 % R3
(mg/mL)
1 30.03 45.94 24.02
1.5 30.27 45.83 23.91
1.5 29.68 45.95 24.37
2 29.54 46.31 24.15
2 29.57 46.26 24.17
[0069] The assay demonstrated acceptable linearity over a protein
concentration range of 0.5
mg/mL to 2.0 mg/mL with R2 > 0.99 based on the regression analysis. In
addition, the isoform
distribution remained consistent over this same concentration range. This
indicates that the assay is
capable of providing consistent results in both peak area and isoform
distribution over the protein
concentration range of 0.5 to 2.0 mg/mL.
[0070] Accuracy of iCIEF assay method. Method accuracy was evaluated based on
dilutional
proportionality using the linearity data by comparing to Nominal concentration
of 1.0 mg/mL. The
dilutional recovery based on Linearity data is shown in Table 9 below. Percent
recovery was
calculated using = (Measured area percentage / Nominal area percentage) x
100%.
Table 9 - Accuracy of the VEGF-Trap iCIEF assay based on dilutional
proportionality
% Average % Recovery
VEGF-Trap RS
(mg/mL) % R1 % R2 % R3 % R1 % R2 % R3
0.5 29.65 46.41 23.95 99.35 101.09 98.78
1 29.85 45.91 24.24 Nominal
1.5 29.98 45.89 24.14 100.44 99.96 99.59
2 29.56 46.29 24.16 99.03 100.82 99.67
[0071] The recovery based on dilutional proportionality in the range of 0.5 to
2.0 mg/mL protein
concentration for the VEGF-Trap sample was within 98%401% for the three
regions.
[0072] Intermediate Precision Analysis of iCIEF method. Intermediate precision
was evaluated by
two separate analysts (A, B) using their respective reagent preparations and
using two iCE3 charge
variant analyzer instruments across four days for the VEGF-Trap RS sample. The
results of the
analysis are listed in Table 10 below.
19
CA 03065562 2019-11-28
WO 2019/036604 PCT/US2018/046893
Table 10 - Results of Intermediate Precision analysis
Analyst %Region 1 %Region 2 %Region 3
29.44 45.87 24.69
A 30.53 45.08 24.39
29.71 45.83 24.46
29.91 45.98 24.11
A 29.50 46.18 24.31
29.76 46.14 24.10
28.78 46.65 24.57
29.40 46.22 24.38
29.61 45.85 24.54
29.56 46.10 24.34
30.01 45.85 24.15
29.50 45.89 24.61
Overall Average 29.64 45.97 24.39
Std Dev 0.42 0.37 0.20
%RSD 1.40 0.80 0.81
[0073] The proposed VEGF-Trap iCIEF test method demonstrated acceptable
precision when
executed by different analysts using different reagent preparations. The
overall % RSD was
calculated and was within an RSD of 2% for all three Regions.
[0074] Robustness of iCIEF assay method. Several elements of assay method
robustness were
evaluated by various experiments. These experiments are listed in Table 11.
Table 11 - Summary of Method Robustness Experiments
Robustness Experiment Performance Evaluated
Prepared solution stability
Consistency of isoform distribution over 24
hours compared to time T=0
Evaluation other samples of ampholyte 3-10 Consistency in overall profile
and %
distribution across the three Regions
Evidence of stability indication Effect of stress exposure on
isoform
distribution
[0075] Prepared Solution Stability in machine. Solution stability was
evaluated by preparing a
sample of reference standard in the sample matrix and analyzing the sample
using iCIEF. The
sample was stored in the iCE3 instrument after analysis at 10 C in the matrix
consisting of 3%
CA 03065562 2019-11-28
WO 2019/036604 PCT/US2018/046893
ampholyte 3-10, 0.35% methylcellulose and 2 M urea. The sample was analyzed
again
approximately 24 hours later. The isoform distribution for each analysis is
presented below in Table
12 below.
Table 12 - Results of prepared iCIEF sample Stability in machine
Sample Name %Region 1 %Region 2 %Region 3
VEGF RS at time 0 injection 1 29.49 45.72 24.80
VEGF RS at time 0 injection 2 29.88 45.62 24.50
VEGF RS at time 24 hours injection 1 29.52 45.92 24.56
VEGF RS at time 24 hours injection 2 29.95 45.74 24.31
% Difference 0.46 0.30 0.49
[0076] The absolute difference between the sample analyzed at T=0 and again at
T=24 hours was
calculated based on the range (Maximum and Minimum) observed at each time
point. The absolute
difference was equal to or less than 0.5% for the three Regions. This
indicates the sample is stable
in the matrix for up to 24 hours when stored at 10 C in the iCE3 Charge
Variant analyzer.
[0077] Evaluation of Samples of ampholyte (3-10). Several samples of the 3-10
ampholyte from
one source were analyzed. The overall charge variant profile of the VEGF-Trap
sample analyzed
using different samples were comparable. Minor differences in electropherogram
profile in terms of
peak pattern were observed in Region 1 for some ampholyte samples however, the
percentage
distribution were similar and within assay variability. Representative
electropherograms from three
samples of ampholyte are shown in Figure 12.
[0078] Example - Analysis of historical VEGF-Trap release samples (DS, FDS and
DSI)
using the new iCIEF assay method
[0079] In order to further establish the robustness of the iCIEF assay method,
a total of 37 unique
historical VEGF-Trap samples that are not related in their genealogy were
analyzed using iCIEF
using two samples of ampholytes. The analysis included, 15 VEGF-Trap DSI (Drug
Substance
Intermediate, Aqueous buffered solution, pH 6.2, comprising 5 mM sodium
phosphate, 5 mM
sodium citrate and 100 mM sodium chloride), 10 VEGF-Trap DS samples (Drug
substance SPEC
C701, Aqueous buffered solution, pH 6.2, containing 10 mM sodium phosphate)
and 12 VEGF-
21
CA 03065562 2019-11-28
WO 2019/036604 PCT/US2018/046893
Trap FDS samples (Formulated Drug Substance, SPEC C713 Aqueous buffered
solution, pH 6.2,
comprising 10 mM, Sodium phosphate, 40 mM sodium chloride, 0.03% (w/v)
polysorbate 20 and
5% (w/v) surcrose). These VEGF-Trap samples were analyzed using the iCIEF
assay method.
[0080] Ampholytes are a mixture of different homologues of amphoteric
compounds with a
spectrum of isoelectric points between 3 and 10 that help establish the pH
gradient under the
influence of the electric field. The ampholyte 3-10 used in the iCIEF assay
method was purchased
from one source which are typically produced in batches. Based on the
recommendation from the
vendor together with our working knowledge on the iCIEF assay for other
proteins, slight variations
between the different samples has been observed and is inevitable. Hence, in
order to establish the
robustness of the new iCIEF assay across the different ampholyte sample, two
samples of
ampholytes were analyzed. The VEGF samples from DS, DSI and FDS products stage
were
analyzed using the proposed Regional grouping approach (R1, R2 and R3) and
also based on 3-9
peak grouping similar to the IEF assay method. Figures 13A-13C show the
statistical analysis of the
ampholyte samples as a function of % Region 1, 2 and 3 and peaks 3-9 for VEGF-
Trap DS, DSI and
FDS samples. The data corresponding to the 37 VEGF-Trap samples is provided in
Table 13 for one
of the ampholyte samples. Tables 14-16 provide the complete data set for 37
samples.
Table 13 - Historical VEGF-Trap DSI, DS and FDS Samples analyzed using iCIEF
assay
procedure
VEGF-Trap
%R1 %R2 %R3 %
3 to 9 peaks
DSI Sample
1 29.7 43.6 26.7 82.7
2 28.5 43.6 28.0 83.5
3 28.0 44.3 27.7 84.2
4 28.1 44.2 27.8 83.9
28.7 44.9 26.4 84.6
6 27.6 44.2 28.2 84.0
7 23.7 41.8 34.6 81.7
8 26.8 43.1 30.1 82.9
9 28.5 45.2 26.4 85.0
27.2 44.1 28.7 84.0
11 28.5 45.2 26.4 85.0
12 27.9 44.3 27.8 84.4
13 28.0 43.7 28.3 83.7
22
CA 03065562 2019-11-28
WO 2019/036604 PCT/US2018/046893
VEGF-Trap
%R1 %R2 %R3 %
3 to 9 peaks
DSI Sample
14 27.8 42.9 29.3 83.3
15 29.2 44.7 26.1 84.3
16 29.0 44.0 27.0 84.2
17 28.9 43.7 27.4 83.8
18 30.6 44.3 25.1 84.1
19 29.7 43.9 26.4 83.8
20 29.9 43.7 26.4 83.3
21 29.1 43.9 27.1 84.1
22 27.1 44.8 28.1 85.3
23 30.4 44.7 24.9 84.8
24 28.3 43.7 28.1 83.2
25 27.3 43.3 29.5 83.2
26 28.0 42.3 29.6 81.8
27 27.2 45.2 27.6 85.8
28 30.1 43.4 26.5 84.1
29 29.2 44.1 26.7 84.0
30 29.8 43.4 26.8 83.3
31 29.7 44.7 25.7 84.6
32 32.3 45.3 22.4 84.5
33 33.4 44.4 22.2 83.8
34 33.6 45.2 21.1 84.5
35 31.0 45.2 23.8 85.3
36 33.8 42.1 24.1 81.3
37 29.2 42.2 28.6 82.2
38 28.2 41.9 29.9 81.8
39 28.7 42.9 28.4 82.8
Table 14 - DSI lots analyzed by Pharmalyte Samples
% 3 to 9
VEGF Trap DSI Samples %R1 %R2 %R3 peaks
1 30.2 43.1 26.7 87.9
2 27.8 44.4 27.8 88.8
3 28.0 44.5 27.6 88.9
4 27.9 44.4 27.8 88.7
28.8 44.8 26.4 85.3
6 27.5 44.3 28.2 87.1
7 23.7 41.4 34.9 89.7
8 26.9 42.9 30.2 88.4
23
CA 03065562 2019-11-28
WO 2019/036604
PCT/US2018/046893
9 28.5 45.1 26.4 89.3
27.6 43.9 28.4 88.7
11 28.3 44.9 26.8 88.3
12 28.1 44.6 27.3 87.8
13 28.2 43.7 28.1 87.8
14 27.6 43.5 28.9 87.9
29.3 44.7 26.0 89.2
Table 15 - DS lots analyzed by Pharmalyte Samples
% 3 to 9
VEGF Trap DS Samples %R1 %R2 %R3 peaks
1 28.8 44.7 26.4 89.3
2 29.4 44.3 26.3 89.2
3 29.2 44.5 26.2 88.9
4 27.3 43.4 29.2 88.2
5 29.6 44.0 26.4 88.9
6 28.3 43.8 27.9 88.8
7 26.7 45.3 28.1 89.8
8 30.2 45.1 24.7 90.1
9 30.5 44.5 25.0 89.3
10 29.1 43.9 27.0 89.3
11 27.9 42.5 29.5 87.5
Table 16 - FDS lots analyzed by Pharmalyte Samples
% 3 to 9
VEGF Trap FDS Samples %R1 %R2 %R3 peaks
1 27.5 45.0 27.5 90.0
2 30.0 43.5 26.5 88.7
3 29.1 43.7 27.2 89.1
4 30.2 43.0 26.7 88.4
5 29.8 44.6 25.6 89.8
6 32.5 45.4 22.1 90.3
7 33.3 44.7 22.0 89.6
8 33.6 45.4 21.0 90.9
9 30.7 45.5 23.8 90.1
24
CA 03065562 2019-11-28
WO 2019/036604 PCT/US2018/046893
34.2 41.7 24.2 87.2
11 29.0 42.4 28.6 87.2
12 28.4 41.3 30.3 86.5
13 28.5 42.5 29.1 87.6
[0081] A Matched Pair analysis (Figure 13D) was performed based on the data
collected for
samples of ampholyte for the Region 1, 2 and 3 and 3-9 grouping approach. The
data from the
matched pairs analysis was used to compare the means between the two
ampholytes and to assess
any difference in reporting of the assay that may be observed due to inherent
differences in
ampholyte samples. Based on the data, it can be inferred that the maximum
observed Mean
difference between samples for the three regions R1, R2 and R3 is less than
0.1% when reported in
terms of Regions. In addition, based on the p- value it can be concluded that
the % distribution
across Region 1, 2 and 3 are not statistically significant between the two
ampholyte samples using
the Regional approach.
[0082] However, when the VEGF-Trap data set for DS, DSI and FDS samples was
analyzed
using the 3-9 peaks grouping approach similar to the IEF assay method, a
statistical significant
difference is noticed between the some ampholyte samples. For example, between
some samples, a
mean difference as high as 4.8% when reported in terms of peaks 3-9 for the
iCIEF assay method.
Figures 13A-13D show the iCIEF profiles obtained using the different ampholyte
samples and it is
evident from the images that the variability observed between ampholyte
samples is restricted to the
acidic region and by grouping Regions 1, 2 and 3 that variability is masked.
This makes the regional
approach of reporting for the iCIEF assay a robust and reproducible approach.
[0083] The data from the DSI, DS and FDS sample analysis using the ampholyte
samples based
on %Regions 1, 2 and 3 grouping makes the iCIEF assay a more robust assay
method.
[0084] Accordingly, the iCIEF system, methods and devices presented in this
disclosure quantify
the charge variant profile of VEGF-Trap drug substance, drug substance
intermediate, formulated
drug substance, and drug product. Such embodiments may serve to replace the
currently approved
gel based IEF method for charge heterogeneity analysis of VEGF-Trap.
CA 03065562 2019-11-28
WO 2019/036604 PCT/US2018/046893
[0085] The VEGF-Trap charge variants fractionated using OFFGEL 3100
fractionator enabled
demonstration of a correlation between the peaks obtained in the capillary
based iCIEF assay
method to the bands resolved in the gel based IEF assay procedure. By
analyzing the OFFEGEL
electrophoresed VEGF-Trap fractions individually and through spike in studies
a direct comparison
of individual iCIEF peaks to IEF bands of the VEGF-Trap charge variants was
achieved. The
studies confirmed that the new iCIEF assay procedure is capable of resolving
all the charge variant
isoforms previously resolved using the gel based IEF method with equal and a
more precise manner.
[0086] Accordingly, some embodiments of this reporting approach based on
percentage
distribution of Regions 1, 2 and 3 disclosed herein allow for control over all
VEGF-Trap isoforms
and makes the assay more sensitive, enabling it to be a robust stability
indicating assay.
[0087] Capillary tubes for use with the iCEF methods are also described
herein. In general, the
iCIEF capillary tube is configured for use in a charge variant analysis of
VEGF-Trap and includes a
capillary tube configured to receive a protein, and configured with a mixture
of carrier ampholyte,
methylcellulose, and a stabilizing additive. The capillary tube may also
include a fluorocarbon
coating.
[0088] In some embodiments, an iCIEF kit configured for use in a charge
variant analysis of
VEGF-Trap is provided and includes one or more capillary tubes configured to
receive a protein,
and configured with a mixture of carrier ampholyte, methylcellulose, and a
stabilizing additive,
wherein the capillary tube includes a fluorocarbon coating.
[0089] While various inventive embodiments have been described and illustrated
herein, those of
ordinary skill in the art will readily envision a variety of other means
and/or structures for
performing the function and/or obtaining the results and/or one or more of the
advantages described
herein, and each of such variations and/or modifications is deemed to be
within the scope of the
inventive embodiments described herein. More generally, those skilled in the
art will readily
appreciate that all parameters, amounts, percentages, concentrations,
dimensions, materials, and
configurations described herein are meant to be an example and that the actual
parameters, amounts,
percentages, concentrations, dimensions, materials, and/or configurations will
depend upon the
26
CA 03065562 2019-11-28
WO 2019/036604 PCT/US2018/046893
specific application or applications for which the inventive teachings is/are
used. Those skilled in
the art will recognize, or be able to ascertain using no more than routine
experimentation, many
equivalents to the specific inventive embodiments described herein. It is,
therefore, to be understood
that the foregoing embodiments are presented by way of example only. Inventive
embodiments
disclosed herein may be practiced otherwise than as specifically described and
claimed. Inventive
embodiments of the present disclosure also include individual features,
system, article, material, kit,
and methods described herein. In addition, any combination of two or more such
features, systems,
articles, materials, kits, and methods are also inventive (if such are not
mutually inconsistent). Some
embodiments may be distinguishable from the prior art for specifically lacking
one or more
features/elements/functionality (i.e., claims directed to such embodiments may
include negative
limitations).
[0090] In addition, as noted, various inventive concepts may be embodied as
one or more
methods. The acts performed as part of the method may be ordered in any
suitable way.
Accordingly, embodiments may be constructed in which acts are performed in an
order different
than illustrated, which may include performing some acts simultaneously, even
though shown as
sequential acts in illustrative embodiments.
[0091] Any and all references to publications or other documents presented
anywhere in the
present application, are herein incorporated by reference in their entirety.
Moreover, all definitions,
as defined and used herein, should be understood to control over dictionary
definitions, definitions
in documents incorporated by reference, and/or ordinary meanings of the
defined terms.
27