Note: Descriptions are shown in the official language in which they were submitted.
CA 03071626 2020-01-30
WO 2019/028080 PCT/US2018/044703
APOLIPOPROTEIN E ISOTYPE DETECTION BY MASS SPECTROMETRY
FIELD OF THE INVENTION
[0001] The invention relates to the detection or quantitation of
apolipoprotein E. In a
particular aspect, the invention relates to methods for detecting
apolipoprotein E or alleles
thereof by mass spectrometry.
BACKGROUND OF THE INVENTION
[0002] Alzheimer's disease is the most common form of dementia affecting the
elderly
population. Alzheimer's disease is characterized by a progressive decay of
cognitive
abilities, in particular, memory and learning. Apolipoprotein E (APOE) is
associated with a
marked increase in developing Alzheimer's disease. The human APOE gene has
three
polymorphic alleles, 62, 63 and 64 that result in six different phenotypes:
62/62, 62/63, 63/63,
62/ 64, 63/64 and 64/64.
[0003] The accuracy and sensitivity of current clinical diagnostic methods to
predict or
diagnose Alzheimer's disease is low. An accurate and sensitive assay for
detecting
apolipoprotein E is needed. In particular, an accurate and sensitive assay for
detecting
various isoforms is needed.
SUMMARY OF THE INVENTION
[0004] Provided herein are methods for detecting or determining the amount of
apolipoprotein E (APOE) in a sample by mass spectrometry, including tandem
mass
spectrometry.
[0005] In certain embodiments, the methods provided herein are for detecting
or
determining the amount of apolipoprotein E comprises (a) purifying
apolipoprotein E in the
sample; (b) ionizing apolipoprotein E in the sample; and (c) detecting or
determining the
amount of the apolipoprotein E ion(s) by mass spectrometry; wherein the amount
of the
apolipoprotein E ion(s) is related to the amount of apolipoprotein E in the
sample.
[0006] In certain embodiments, the methods provided herein are for determining
the
apolipoprotein E (ApoE) phenotype in a sample, said method comprising:(a)
purifying ApoE
in the sample; (b) ionizing ApoE in the sample to produce one or more ion(s)
of ApoE; (c)
detecting the ion(s) from step (b) by mass spectrometry; wherein the ApoE
allele(s) present in
the sample is determined from the identity of the ions detected in step (c).
1
CA 03071626 2020-01-30
WO 2019/028080 PCT/US2018/044703
[0007] In some embodiments, purifying provided herein comprises liquid
chromatography.
In some embodiments, the liquid chromatography comprises high performance
liquid
chromatography (HPLC).
[0008] In some embodiments, ApoE in the samples is digested. In some
embodiments,
ApoE is digested by trypsin. In some embodiments, the digested ApoE is
microwaved. In
some embodiments, ApoE is digested by rapid enzyme digest microwave
technology.
[0009] In some embodiments, purifying provided herein comprises solid phase
extraction
(SPE).
[0010] In some embodiments, the ionization comprises electrospray ionization
(ESI). In
some embodiments, the ionization comprises ionizing in positive mode. In some
embodiments, the ionization comprises ionizing in negative mode.
[0011] In some embodiments, methods provided herein further comprise adding an
internal
standard. In some embodiments, the internal standard is isotopically labeled.
[0012] In some embodiments, the phenotype determined by the method provided
herein is
ApoE2/ApoE2. In some embodiments, the phenotype is ApoE2/ApoE3. In some
embodiments, the phenotype is ApoE2/ApoE4. In some embodiments, the phenotype
is
ApoE3/ApoE3. In some embodiments, the phenotype is ApoE3/ApoE4. In some
embodiments, the phenotype is ApoE4/ApoE4.
[0013] In some embodiments, the ApoE2/ApoE2 is determined by the presence of a
precursor ion(s) having a mass/charge ratio of 555.15 0.5. In some
embodiments, the
ApoE2/ApoE2 is determined by the presence of a precursor ion(s) having a
mass/charge ratio
of 612.19 0.5. In some embodiments, the ApoE2/ApoE2 is determined by the
presence of a
fragment ion(s) having a mass/charge ratio selected from the group consisting
of 665.72 0.5
and 835.93 0.5. In some embodiments, the ApoE2/ApoE2 is determined by the
presence of
fragment ions having mass/charge ratios of 665.72 0.5 and 835.93 0.5. In some
embodiments, the ApoE2/ApoE2 is determined by the presence of a fragment
ion(s) having a
mass/charge ratio selected from the group consisting of 866.99 0.5 and 982.08
0.5. In some
embodiments, the ApoE2/ApoE2 is determined by the presence of fragment ions
having
mass/charge ratios of 866.99 0.5 and 982.08 0.5. In some embodiments, the
ApoE2/ApoE2
is determined by the presence of a fragment ion(s) having a mass/charge ratio
selected from
the group consisting of 665.72 0.5, 835.93 0.5, 866.99 0.5 and 982.08 0.5. In
some
2
CA 03071626 2020-01-30
WO 2019/028080 PCT/US2018/044703
embodiments, the ApoE2/ApoE2 is determined by the presence of fragment ions
haying
mass/charge ratios of 665.72 0.5, 835.93 0.5, 866.99 0.5 and 982.08 0.5.
[0014] In some embodiments, the ApoE2/ApoE3 is determined by the presence of a
precursor ion(s) haying a mass/charge ratio of 555.15 0.5. In some
embodiments, the
ApoE2/ApoE3 is determined by the presence of a precursor ion(s) haying a
mass/charge ratio
of 612.19 0.5. In some embodiments, the ApoE2/ApoE3 is determined by the
presence of a
precursor ion(s) haying a mass/charge ratio of 475.05 0.5. In some
embodiments, the
ApoE2/ApoE3 is determined by the presence of a fragment ion(s) haying a
mass/charge ratio
selected from the group consisting of 665.72 0.5 and 835.93 0.5. In some
embodiments, the
ApoE2/ApoE3 is determined by the presence of fragment ions haying mass/charge
ratios of
665.72 0.5 and 835.93 0.5. In some embodiments, the ApoE2/ApoE3 is determined
by the
presence of a fragment ion(s) haying a mass/charge ratio selected from the
group consisting
of 866.99 0.5 and 982.08 0.5. In some embodiments, the ApoE2/ApoE3 is
determined by
the presence of fragment ions haying mass/charge ratios of 866.99 0.5 and
982.08 0.5. In
some embodiments, the ApoE2/ApoE3 is determined by the presence of a fragment
ion(s)
haying a mass/charge ratio selected from the group consisting of 374.42 0.5
and 502.55 0.5.
In some embodiments, the ApoE2/ApoE3 is determined by the presence of fragment
ions
haying mass/charge ratios of 374.42 0.5 and 502.55 0.5. In some embodiments,
the
ApoE2/ApoE3 is determined by the presence of a fragment ion(s) haying a
mass/charge ratio
selected from the group consisting of 374.42 0.5, 502.55 0.5, 665.72 0.5,
835.93 0.5,
866.99 0.5 and 982.08 0.5. In some embodiments, the ApoE2/ApoE3 is determined
by the
presence of fragment ions haying mass/charge ratios of 374.42 0.5, 502.55 0.5,
665.72 0.5,
835.93 0.5, 866.99 0.5 and 982.08 0.5.
[0015] In some embodiments, the ApoE2/ApoE4 is determined by the presence of a
precursor ion(s) haying a mass/charge ratio of 555.15 0.5. In some
embodiments, the
ApoE2/ApoE4 is determined by the presence of a precursor ion(s) haying a
mass/charge ratio
of 612.19 0.5. In some embodiments, the ApoE2/ApoE4 is determined by the
presence of a
precursor ion(s) haying a mass/charge ratio of 475.05 0.5. In some
embodiments, the
ApoE2/ApoE4 is determined by the presence of a precursor ion(s) haying a
mass/charge ratio
of 503.56 0.5. In some embodiments, the ApoE2/ApoE4 is determined by the
presence of a
fragment ion(s) haying a mass/charge ratio selected from the group consisting
of 665.72 0.5
and 835.93 0.5. In some embodiments, the ApoE2/ApoE4 is determined by the
presence of
fragment ions haying mass/charge ratios of 665.72 0.5 and 835.93 0.5. In some
3
CA 03071626 2020-01-30
WO 2019/028080 PCT/US2018/044703
embodiments, the ApoE2/ApoE4 is determined by the presence of a fragment
ion(s) haying a
mass/charge ratio selected from the group consisting of 866.99 0.5 and 982.08
0.5. In some
embodiments, the ApoE2/ApoE4 is determined by the presence of fragment ions
haying
mass/charge ratios of 866.99 0.5 and 982.08 0.5. In some embodiments, the
ApoE2/ApoE4
is determined by the presence of a fragment ion(s) haying a mass/charge ratio
selected from
the group consisting of 374.42 0.5 and 502.55 0.5. In some embodiments, the
ApoE2/ApoE4 is determined by the presence of fragment ions haying mass/charge
ratios of
374.42 0.5 and 502.55 0.5. In some embodiments, the ApoE2/ApoE4 is determined
by the
presence of a fragment ion(s) haying a mass/charge ratio selected from the
group consisting
of 649.74 0.5 and 892.96 0.5. In some embodiments, the ApoE2/ApoE4 is
determined by
the presence of fragment ions haying mass/charge ratios of 649.74 0.5 and
892.96 0.5. In
some embodiments, the ApoE2/ApoE4 is determined by the presence of a fragment
ion(s)
haying a mass/charge ratio selected from the group consisting of 374.42 0.5,
502.55 0.5,
649.74 0.5, 665.72 0.5, 835.93 0.5, 866.99 0.5, 892.96 0.5, and 982.08 0.5. In
some
embodiments, the ApoE2/ApoE4 is determined by the presence of fragment ions
haying
mass/charge ratios of 374.42 0.5, 502.55 0.5, 649.74 0.5, 665.72 0.5, 835.93
0.5,
866.99 0.5, 892.96 0.5, and 982.08 0.5.
[0016] In some embodiments, the ApoE3/ApoE3 is determined by the presence of a
precursor ion(s) haying a mass/charge ratio of 612.19 0.5. In some
embodiments, the
ApoE3/ApoE3 is determined by the presence of a precursor ion(s) haying a
mass/charge ratio
of 475.05 0.5. In some embodiments, the ApoE3/ApoE3 is determined by the
presence of a
fragment ion(s) haying a mass/charge ratio selected from the group consisting
of 866.99 0.5
and 982.08 0.5. In some embodiments, the ApoE3/ApoE3 is determined by the
presence of
fragment ions haying mass/charge ratios of 866.99 0.5 and 982.08 0.5. In some
embodiments, the ApoE3/ApoE3 is determined by the presence of a fragment
ion(s) haying a
mass/charge ratio selected from the group consisting of 374.42 0.5 and 502.55
0.5. In some
embodiments, the ApoE3/ApoE3 is determined by the presence of fragment ions
haying
mass/charge ratios of 374.42 0.5 and 502.55 0.5. In some embodiments, the
ApoE3/ApoE3
is determined by the presence of a fragment ion(s) haying a mass/charge ratio
selected from
the group consisting of 374.42 0.5, 502.55 0.5, 866.99 0.5 and 982.08 0.5. In
some
embodiments, the ApoE3/ApoE3 is determined by the presence of fragment ions
haying
mass/charge ratios of 374.42 0.5, 502.55 0.5, 866.99 0.5 and 982.08 0.5.
4
CA 03071626 2020-01-30
WO 2019/028080 PCT/US2018/044703
[0017] In some embodiments, the ApoE3/ApoE4 is determined by the presence of a
precursor ion(s) haying a mass/charge ratio of 612.19 0.5. In some
embodiments, the
ApoE3/ApoE4 is determined by the presence of a precursor ion(s) haying a
mass/charge ratio
of 475.05 0.5. In some embodiments, the ApoE3/ApoE4 is determined by the
presence of a
precursor ion(s) haying a mass/charge ratio of 503.56 0.5. In some
embodiments, the
ApoE3/ApoE4 is determined by the presence of a fragment ion(s) haying a
mass/charge ratio
selected from the group consisting of 866.99 0.5 and 982.08 0.5. In some
embodiments, the
ApoE3/ApoE4 is determined by the presence of fragment ions haying mass/charge
ratios of
866.99 0.5 and 982.08 0.5. In some embodiments, the ApoE3/ApoE4 is determined
by the
presence of a fragment ion(s) haying a mass/charge ratio selected from the
group consisting
of 374.42 0.5 and 502.55 0.5. In some embodiments, the ApoE3/ApoE4 is
determined by
the presence of fragment ions haying mass/charge ratios of 374.42 0.5 and
502.55 0.5. In
some embodiments, the ApoE3/ApoE4 is determined by the presence of a fragment
ion(s)
haying a mass/charge ratio selected from the group consisting of 649.74 0.5
and 892.96 0.5.
In some embodiments, the ApoE3/ApoE4 is determined by the presence of fragment
ions
haying mass/charge ratios of 649.74 0.5 and 892.96 0.5. In some embodiments,
the
ApoE3/ApoE4 is determined by the presence of a fragment ion(s) haying a
mass/charge ratio
selected from the group consisting of 374.42 0.5, 502.55 0.5, 649.74 0.5,
866.99 0.5,
892.96 0.5, and 982.08 0.5. In some embodiments, the ApoE3/ApoE4 is determined
by the
presence of fragment ions haying mass/charge ratios of 374.42 0.5, 502.55 0.5,
649.74 0.5,
866.99 0.5, 892.96 0.5, and 982.08 0.5.
[0018] In some embodiments, the ApoE3/ApoE4 is determined by the presence of a
precursor ion(s) haying a mass/charge ratio of 475.05 0.5. In some
embodiments, the
ApoE3/ApoE4 is determined by the presence of a precursor ion(s) haying a
mass/charge ratio
of 503.56 0.5. In some embodiments, the ApoE3/ApoE4 is determined by the
presence of a
fragment ion(s) haying a mass/charge ratio selected from the group consisting
of 374.42 0.5
and 502.55 0.5. In some embodiments, the ApoE3/ApoE4 is determined by the
presence of
fragment ions haying mass/charge ratios of 374.42 0.5 and 502.55 0.5. In some
embodiments, the ApoE3/ApoE4 is determined by the presence of a fragment
ion(s) haying a
mass/charge ratio selected from the group consisting of 649.74 0.5 and 892.96
0.5. In some
embodiments, the ApoE3/ApoE4 is determined by the presence of fragment ions
haying
mass/charge ratios of 649.74 0.5 and 892.96 0.5. In some embodiments, the
ApoE3/ApoE4
is determined by the presence of a fragment ion(s) haying a mass/charge ratio
selected from
CA 03071626 2020-01-30
WO 2019/028080 PCT/US2018/044703
the group consisting of 374.42 0.5, 502.55 0.5, 649.74 0.5, and 892.96 0.5. In
some
embodiments, the ApoE3/ApoE4 is determined by the presence of fragment ions
having
mass/charge ratios of 374.42 0.5, 502.55 0.5, 649.74 0.5, and 892.96 0.5.
[0019] In some embodiments, the presence of ApoE4 allele indicates increased
risk of
developing Alzheimer's disease. In some embodiments, the presence of
ApoE4/ApoE4
alleles indicates increased risk of developing Alzheimer's disease.
[0020] In some embodiments, quantitation of total ApoE comprises measuring a
precursor
ion having a mass/charge ratio of 485.06 0.5. In some embodiments,
quantitation of total
ApoE comprises measuring a fragment ion(s) with a mass/charge ratio selected
from
489.51 0.5 and 588.64 0.5.
[0021] In certain embodiments, the limit of quantitation of the methods is
less than or equal
to 10 ng/mL. In some embodiments, the limit of quantitation of the methods is
less than or
equal to 5 ng/mL. In some embodiments, the limit of quantitation of the
methods is less than
or equal to 4 ng/mL. In some embodiments, the limit of quantitation of the
methods is less
than or equal to 3 ng/mL. In some embodiments, the limit of quantitation of
the methods is
less than or equal to 2 ng/mL. In some embodiments, the limit of quantitation
of the methods
is less than or equal to 1 ng/mL. In some embodiments, the limit of
quantitation of the
methods is less than or equal to 0.5 ng/mL. In some embodiments, the limit of
quantitation of
the methods is less than or equal to 0.2 ng/mL. In some embodiments, the limit
of
quantitation of the methods is less than or equal to 0.1 ng/mL.
[0022] In some embodiments, the limit of detection of the methods is less than
or equal to 5
ng/mL. In some embodiments, the limit of detection of the methods is less than
or equal to 1
ng/mL. In some embodiments, the limit of detection of the methods is less than
or equal to
0.5 ng/mL. In some embodiments, the limit of detection of the methods is less
than or equal
to 0.1 ng/mL. In some embodiments, the limit of detection of the methods is
less than or
equal to 0.05 ng/mL. In some embodiments, the limit of detection of the
methods is less than
or equal to 0.01 ng/mL.
[0023] In some embodiments, ApoE is not derivatized prior to mass
spectrometry.
[0024] In some embodiments, ApoE is derivatized prior to mass spectrometry.
[0025] In certain embodiments, the sample is a body fluid. In some
embodiments, the
sample is cerebrospinal fluid (CSF). In some embodiments, the sample is plasma
or serum.
6
CA 03071626 2020-01-30
WO 2019/028080 PCT/US2018/044703
In some embodiments, the sample is whole blood. In some embodiments, the
sample is
saliva or urine.
[0026] In some embodiments, the methods may include adding an agent to the
sample in an
amount sufficient to deproteinate the sample.
[0027] As used herein, unless otherwise stated, the singular forms "a," "an,"
and "the"
include plural reference. Thus, for example, a reference to "a protein"
includes a plurality of
protein molecules.
[0028] As used herein, the term "purification" or "purifying" does not refer
to removing all
materials from the sample other than the analyte(s) of interest. Instead,
purification refers to
a procedure that enriches the amount of one or more analytes of interest
relative to other
components in the sample that may interfere with detection of the analyte of
interest.
Samples are purified herein by various means to allow removal of one or more
interfering
substances, e.g., one or more substances that would interfere with the
detection of selected
ApoE parent and daughter ions by mass spectrometry.
[0029] As used herein, the term "test sample" refers to any sample that may
contain ApoE.
As used herein, the term "body fluid" means any fluid that can be isolated
from the body of
an individual. For example, "body fluid" may include blood, plasma, serum,
bile, saliva,
urine, tears, perspiration, and the like.
[0030] As used herein, the term "derivatizing" means reacting two molecules to
form a new
molecule. Derivatizing agents may include isothiocyanate groups, dinitro-
fluorophenyl
groups, nitrophenoxycarbonyl groups, and/or phthalaldehyde groups, and the
like.
[0031] As used herein, the term "chromatography" refers to a process in which
a chemical
mixture carried by a liquid or gas is separated into components as a result of
differential
distribution of the chemical entities as they flow around or over a stationary
liquid or solid
phase.
[0032] As used herein, the term "liquid chromatography" or "LC" means a
process of
selective retardation of one or more components of a fluid solution as the
fluid uniformly
percolates through a column of a finely divided substance, or through
capillary passageways.
The retardation results from the distribution of the components of the mixture
between one or
more stationary phases and the bulk fluid, (i.e., mobile phase), as this fluid
moves relative to
the stationary phase(s). Examples of "liquid chromatography" include reverse
phase liquid
7
CA 03071626 2020-01-30
WO 2019/028080 PCT/US2018/044703
chromatography (RPLC), high performance liquid chromatography (HPLC), and high
turbulence liquid chromatography (HTLC).
[0033] As used herein, the term "high performance liquid chromatography" or
"HPLC"
refers to liquid chromatography in which the degree of separation is increased
by forcing the
mobile phase under pressure through a stationary phase, typically a densely
packed column.
[0034] As used herein, the term "high turbulence liquid chromatography" or
"HTLC" refers
to a form of chromatography that utilizes turbulent flow of the material being
assayed
through the column packing as the basis for performing the separation. HTLC
has been
applied in the preparation of samples containing two unnamed drugs prior to
analysis by mass
spectrometry. See, e.g., Zimmer et at., I Chromatogr. A 854: 23-35 (1999); see
also, U.S.
Patents No. 5,968,367, 5,919,368, 5,795,469, and 5,772,874, which further
explain HTLC.
Persons of ordinary skill in the art understand "turbulent flow". When fluid
flows slowly and
smoothly, the flow is called "laminar flow". For example, fluid moving through
an HPLC
column at low flow rates is laminar. In laminar flow the motion of the
particles of fluid is
orderly with particles moving generally in straight lines. At faster
velocities, the inertia of
the water overcomes fluid frictional forces and turbulent flow results. Fluid
not in contact
with the irregular boundary "outruns" that which is slowed by friction or
deflected by an
uneven surface. When a fluid is flowing turbulently, it flows in eddies and
whirls (or
vortices), with more "drag" than when the flow is laminar. Many references are
available for
assisting in determining when fluid flow is laminar or turbulent (e.g.,
Turbulent Flow
Analysis: Measurement and Prediction, P.S. Bernard & J.M. Wallace, John Wiley
& Sons,
Inc., (2000); An Introduction to Turbulent Flow, Jean Mathieu & Julian Scott,
Cambridge
University Press (2001)).
[0035] As used herein, the term "gas chromatography" or "GC" refers to
chromatography in
which the sample mixture is vaporized and injected into a stream of carrier
gas (as nitrogen or
helium) moving through a column containing a stationary phase composed of a
liquid or a
particulate solid and is separated into its component compounds according to
the affinity of
the compounds for the stationary phase.
[0036] As used herein, the term "large particle column" or "extraction column"
refers to a
chromatography column containing an average particle diameter greater than
about 35 [tm.
As used in this context, the term "about" means 10%. In a preferred
embodiment the
column contains particles of about 60 [tm in diameter.
8
CA 03071626 2020-01-30
WO 2019/028080 PCT/US2018/044703
[0037] As used herein, the term "analytical column" refers to a chromatography
column
having sufficient chromatographic plates to effect a separation of materials
in a sample that
elute from the column sufficient to allow a determination of the presence or
amount of an
analyte. Such columns are often distinguished from "extraction columns", which
have the
general purpose of separating or extracting retained material from non-
retained materials in
order to obtain a purified sample for further analysis. As used in this
context, the term
"about" means 10%. In a preferred embodiment the analytical column contains
particles of
about 4 [tm in diameter.
[0038] As used herein, the term "on-line" or "inline", for example as used in
"on-line
automated fashion" or "on-line extraction" refers to a procedure performed
without the need
for operator intervention. In contrast, the term "off-line" as used herein
refers to a procedure
requiring manual intervention of an operator. Thus, if samples are subjected
to precipitation,
and the supernatants are then manually loaded into an autosampler, the
precipitation and
loading steps are off-line from the subsequent steps. In various embodiments
of the methods,
one or more steps may be performed in an on-line automated fashion.
[0039] As used herein, the term "mass spectrometry" or "MS" refers to an
analytical
technique to identify compounds by their mass. MS refers to methods of
filtering, detecting,
and measuring ions based on their mass-to-charge ratio, or "m/z". MS
technology generally
includes (1) ionizing the compounds to form charged compounds; and (2)
detecting the
molecular weight of the charged compounds and calculating a mass-to-charge
ratio. The
compounds may be ionized and detected by any suitable means. A "mass
spectrometer"
generally includes an ionizer and an ion detector. In general, one or more
molecules of
interest are ionized, and the ions are subsequently introduced into a mass
spectrographic
instrument where, due to a combination of magnetic and electric fields, the
ions follow a path
in space that is dependent upon mass ("m") and charge ("z"). See, e.g.,U U.S.
Patent Nos.
6,204,500, entitled "Mass Spectrometry From Surfaces;" 6,107,623, entitled
"Methods and
Apparatus for Tandem Mass Spectrometry;" 6,268,144, entitled "DNA Diagnostics
Based On
Mass Spectrometry;" 6,124,137, entitled "Surface-Enhanced Photolabile
Attachment And
Release For Desorption And Detection Of Analytes;" Wright et at., Prostate
Cancer and
Prostatic Diseases 2:264-76 (1999); and Merchant and Weinberger,
Electrophoresis
21 : 1164-67 (2000).
[0040] As used herein, the term "operating in negative ion mode" refers to
those mass
spectrometry methods where negative ions are generated and detected. The term
"operating
9
CA 03071626 2020-01-30
WO 2019/028080 PCT/US2018/044703
in positive ion mode" as used herein, refers to those mass spectrometry
methods where
positive ions are generated and detected.
[0041] As used herein, the term "ionization" or "ionizing" refers to the
process of generating
an analyte ion having a net electrical charge equal to one or more electron
units. Negative
ions are those having a net negative charge of one or more electron units,
while positive ions
are those having a net positive charge of one or more electron units.
[0042] As used herein, the term "electron ionization" or "El" refers to
methods in which an
analyte of interest in a gaseous or vapor phase interacts with a flow of
electrons. Impact of
the electrons with the analyte produces analyte ions, which may then be
subjected to a mass
spectrometry technique.
[0043] As used herein, the term "chemical ionization" or "CI" refers to
methods in which a
reagent gas (e.g. ammonia) is subjected to electron impact, and analyte ions
are formed by the
interaction of reagent gas ions and analyte molecules.
[0044] As used herein, the term "fast atom bombardment" or "FAB" refers to
methods in
which a beam of high energy atoms (often Xe or Ar) impacts a non-volatile
sample,
desorbing and ionizing molecules contained in the sample. Test samples are
dissolved in a
viscous liquid matrix such as glycerol, thioglycerol, m-nitrobenzyl alcohol,
18-crown-6
crown ether, 2-nitrophenyloctyl ether, sulfolane, diethanolamine, and
triethanolamine. The
choice of an appropriate matrix for a compound or sample is an empirical
process.
[0045] As used herein, the term "matrix-assisted laser desorption ionization"
or "MALDI"
refers to methods in which a non-volatile sample is exposed to laser
irradiation, which
desorbs and ionizes analytes in the sample by various ionization pathways,
including photo-
ionization, protonation, deprotonation, and cluster decay. For MALDI, the
sample is mixed
with an energy-absorbing matrix, which facilitates desorption of analyte
molecules.
[0046] As used herein, the term "surface enhanced laser desorption ionization"
or "SELDI"
refers to another method in which a non-volatile sample is exposed to laser
irradiation, which
desorbs and ionizes analytes in the sample by various ionization pathways,
including photo-
ionization, protonation, deprotonation, and cluster decay. For SELDI, the
sample is typically
bound to a surface that preferentially retains one or more analytes of
interest. As in MALDI,
this process may also employ an energy-absorbing material to facilitate
ionization.
[0047] As used herein, the term "electrospray ionization" or "ESI," refers to
methods in
which a solution is passed along a short length of capillary tube, to the end
of which is
CA 03071626 2020-01-30
WO 2019/028080 PCT/US2018/044703
applied a high positive or negative electric potential. Solution reaching the
end of the tube is
vaporized (nebulized) into a jet or spray of very small droplets of solution
in solvent vapor.
This mist of droplets flows through an evaporation chamber, which is heated
slightly to
prevent condensation and to evaporate solvent. As the droplets get smaller the
electrical
surface charge density increases until such time that the natural repulsion
between like
charges causes ions as well as neutral molecules to be released.
[0048] As used herein, the term "atmospheric pressure chemical ionization" or
"APCI,"
refers to mass spectroscopy methods that are similar to ESI; however, APCI
produces ions by
ion-molecule reactions that occur within a plasma at atmospheric pressure. The
plasma is
maintained by an electric discharge between the spray capillary and a counter
electrode.
Then ions are typically extracted into the mass analyzer by use of a set of
differentially
pumped skimmer stages. A counterflow of dry and preheated N2 gas may be used
to improve
removal of solvent. The gas-phase ionization in APCI can be more effective
than ESI for
analyzing less-polar species.
[0049] The term "Atmospheric Pressure Photoionization" or "APPI" as used
herein refers to
the form of mass spectroscopy where the mechanism for the photoionization of
molecule M
is photon absorption and electron ejection to form the molecular ion M+.
Because the photon
energy typically is just above the ionization potential, the molecular ion is
less susceptible to
dissociation. In many cases it may be possible to analyze samples without the
need for
chromatography, thus saving significant time and expense. In the presence of
water vapor or
protic solvents, the molecular ion can extract H to form MH+. This tends to
occur if M has a
high proton affinity. This does not affect quantitation accuracy because the
sum of M+ and
MH+ is constant. Drug compounds in protic solvents are usually observed as
MH+, whereas
nonpolar compounds such as naphthalene or testosterone usually form M+. Robb,
D.B.,
Covey, T.R. and Bruins, A.P. (2000): See, e.g., Robb et at., Atmospheric
pressure
photoionization: An ionization method for liquid chromatography-mass
spectrometry. Anal.
Chem. 72(15): 3653-3659.
[0050] As used herein, the term "inductively coupled plasma" or "ICP" refers
to methods in
which a sample interacts with a partially ionized gas at a sufficiently high
temperature such
that most elements are atomized and ionized.
11
CA 03071626 2020-01-30
WO 2019/028080 PCT/US2018/044703
[0051] As used herein, the term "field desorption" refers to methods in which
a non-volatile
test sample is placed on an ionization surface, and an intense electric field
is used to generate
analyte ions.
[0052] As used herein, the term "desorption" refers to the removal of an
analyte from a
surface and/or the entry of an analyte into a gaseous phase.
[0053] As used herein, the term "limit of quantification", "limit of
quantitation" or "LOQ"
refers to the point where measurements become quantitatively meaningful. The
analyte
response at this LOQ is identifiable, discrete and reproducible with a
precision of 20% and an
accuracy of 80% to 120%.
[0054] As used herein, the term "limit of detection" or "LOD" is the point at
which the
measured value is larger than the uncertainty associated with it. The LOD is
defined
arbitrarily as 2 standard deviations (SD) from the zero concentration.
[0055] As used herein, an "amount" of ApoE in a body fluid sample refers
generally to an
absolute value reflecting the mass of ApoE detectable in volume of body fluid.
However, an
amount also contemplates a relative amount in comparison to another ApoE
amount. For
example, an amount of ApoE in a body fluid can be an amount which is greater
than or less
than a control or normal level of ApoE normally present.
[0056] The term "about" as used herein in reference to quantitative
measurements not
including the measurement of the mass of an ion, refers to the indicated value
plus or minus
10%. Mass spectrometry instruments can vary slightly in determining the mass
of a given
analyte. The term "about" in the context of the mass of an ion or the
mass/charge ratio of an
ion refers to +/- 0.5 atomic mass unit.
[0057] The summary of the invention described above is non-limiting and other
features and
advantages of the invention will be apparent from the following detailed
description of the
invention, and from the claims.
BRIEF DESCRIPTION OF THE DRAWINGS
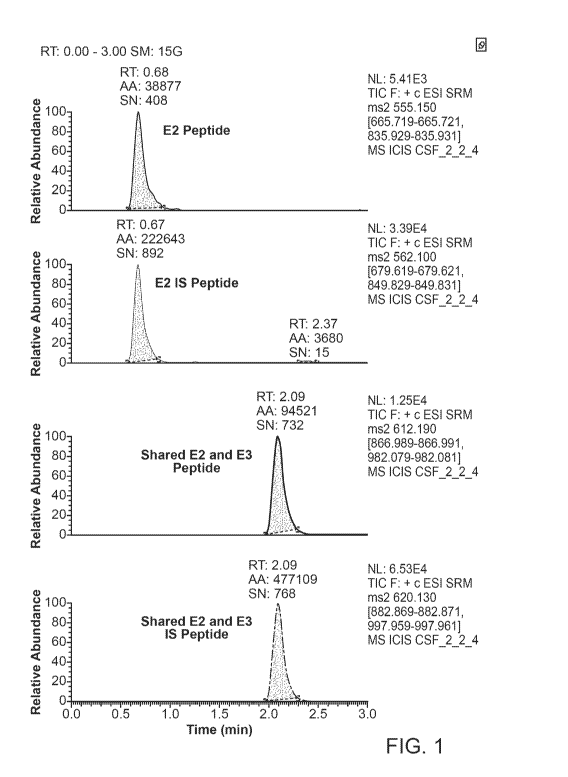
[0058] Figure 1 shows example chromatograms of ApoE2/E2 phenotype which has a
frequency of about 0.2%.
[0059] Figure 2 shows example chromatograms of ApoE2/E3 phenotype which has a
frequency of about 9.4%.
12
CA 03071626 2020-01-30
WO 2019/028080
PCT/US2018/044703
[0060] Figure 3 shows example chromatograms of ApoE2/E4 phenotype which has a
frequency of about 2.2%.
[0061] Figure 4 shows example chromatograms of ApoE3/E3 phenotype which has a
frequency of about 66%.
[0062] Figure 5 shows example chromatograms of ApoE3/E4 phenotype which has a
frequency of about 20%.
[0063] Figure 6 shows example chromatograms of ApoE4/E4 phenotype which has a
frequency of about 2.5%.
[0064] Figure 7 shows ApoE allele frequency based on 319 individual serum
samples
determined by LC-MS/MS.
[0065] Figure 8 shows the contribution of each Alzheimer's disease biomarker
to the Risk
Assessment Model. Formula for calculating the linear predictor (score) for MCI
or
Alzheimer's disease given: Af342 (pg/mL) /Af340 (pg/mL) ratio; ApoE4 allele
count; Total
ApoE (ug/mL). Score = 2.8336 - 9.9026 x Ratio + 0.7358 x ApoE4 ¨ 0.2183 x
Total ApoE.
Risk is categorized into three groups: Low risk; Average risk; High risk.
[0066] Figure 9 shows the disease probability plots for Af342/40 ratio model
vs. allele
number.
[0067] Figure 10 shows the disease risk plots for Af342/40 ratio + total ApoE
model vs.
ApoE4 allele number.
[0068] Figure 11 shows the risk assessment score vs. number of ApoE4 alleles.
[0069] Figure 12 shows logistic regression model vs. ADMark.
[0070] Figure 13 shows a graphic representation of ApoE isotype phenotyping by
mass
spectrometry. ApoE2/E2 phenotype is determined by detecting an ion(s)
associated with
unique E2 and
DETAILED DESCRIPTION OF THE INVENTION
[0071] Apolipoprotein E (ApoE) is a well-defined genetic risk factor for late-
onset
Alzheimer disease (AD). The human APOE gene has three polymorphic alleles, 62,
63 and
64 that result in six different phenotypes: 62/62, 62/63, 63/63, 62/ 64, 63/64
and 64/64. About
half of AD patients carry the 64 allele (compared with 14% in the general
population), with
the majority being heterozygotes (63/64). The number of inherited 64 alleles
is associated
13
CA 03071626 2020-01-30
WO 2019/028080 PCT/US2018/044703
with both increased disease risk and decreased average age of onset compared
with
inheritance of the 62 or 63 alleles. The differences between the three ApoE
isoforms are
based on two amino acids that affect its structure and hence the interaction
and binding of the
protein with various lipids and beta-amyloid (A13). ApoE and AP can co-
localize in the brain,
and therefore their complementary roles in AD have been studied extensively.
Circulating
plasma and CSF ApoE levels were recently found to be potential biomarkers for
AD. In
addition, increased CSF Apo-E2 or -E3 levels might represent a protective
response to injury
in AD and may have neuroprotective effects by decreasing neuronal damage
independent of
tau and amyloid deposition in addition to its effects on amyloid clearance.
Lower ApoE
levels may also be associated with multiple sclerosis and other
neurodegenerative diseases
that affect brain lipid metabolism.
[0072] In certain embodiments, the methods provided herein are for determining
the
apolipoprotein E (ApoE) phenotype in a sample, said method comprising:(a)
purifying ApoE
in the sample; (b) ionizing ApoE in the sample to produce one or more ion(s)
of ApoE; (c)
detecting the ion(s) from step (b) by mass spectrometry; wherein the ApoE
allele(s) present in
the sample is determined from the identity of the ions detected in step (c).
[0073] In some embodiments, purifying provided herein comprises liquid
chromatography.
In some embodiments, the liquid chromatography comprises high performance
liquid
chromatography (HPLC).
[0074] In some embodiments, purifying provided herein comprises solid phase
extraction
(SPE).
[0075] In some embodiments, the ionization comprises electrospray ionization
(ESI). In
some embodiments, the ionization comprises ionizing in positive mode. In some
embodiments, the ionization comprises ionizing in negative mode.
[0076] In some embodiments, methods provided herein further comprise adding an
internal
standard. In some embodiments, the internal standard is isotopically labeled.
[0077] In some embodiments, the phenotype determined by the method provided
herein is
ApoE2/ApoE2. In some embodiments, the phenotype is ApoE2/ApoE3. In some
embodiments, the phenotype is ApoE2/ApoE4. In some embodiments, the phenotype
is
ApoE3/ApoE3. In some embodiments, the phenotype is ApoE3/ApoE4. In some
embodiments, the phenotype is ApoE4/ApoE4.
14
CA 03071626 2020-01-30
WO 2019/028080 PCT/US2018/044703
[0078] In some embodiments, the presence of ApoE4 allele indicates increased
risk of
developing Alzheimer's disease. In some embodiments, the presence of
ApoE4/ApoE4
alleles indicates increased risk of developing Alzheimer's disease.
[0079] In certain embodiments, the limit of quantitation of the methods is
less than or equal
to 10 ng/mL. In some embodiments, the limit of quantitation of the methods is
less than or
equal to 5 ng/mL. In some embodiments, the limit of quantitation of the
methods is less than
or equal to 4 ng/mL. In some embodiments, the limit of quantitation of the
methods is less
than or equal to 3 ng/mL. In some embodiments, the limit of quantitation of
the methods is
less than or equal to 2 ng/mL. In some embodiments, the limit of quantitation
of the methods
is less than or equal to 1 ng/mL. In some embodiments, the limit of
quantitation of the
methods is less than or equal to 0.5 ng/mL. In some embodiments, the limit of
quantitation of
the methods is less than or equal to 0.2 ng/mL. In some embodiments, the limit
of
quantitation of the methods is less than or equal to 0.1 ng/mL.
[0080] In some embodiments, the limit of detection of the methods is less than
or equal to 5
ng/mL. In some embodiments, the limit of detection of the methods is less than
or equal to 1
ng/mL. In some embodiments, the limit of detection of the methods is less than
or equal to
0.5 ng/mL. In some embodiments, the limit of detection of the methods is less
than or equal
to 0.1 ng/mL. In some embodiments, the limit of detection of the methods is
less than or
equal to 0.05 ng/mL. In some embodiments, the limit of detection of the
methods is less than
or equal to 0.01 ng/mL.
[0081] In some embodiments, ApoE is not derivatized prior to mass
spectrometry.
[0082] In some embodiments, ApoE is derivatized prior to mass spectrometry.
[0083] In certain embodiments, the sample is a body fluid. In some
embodiments, the
sample is cerebrospinal fluid (CSF). In some embodiments, the sample is plasma
or serum.
In some embodiments, the sample is whole blood. In some embodiments, the
sample is
saliva or urine.
[0084] In some embodiments, the methods may include adding an agent to the
sample in an
amount sufficient to deproteinate the sample.
[0085] Suitable test samples include any test sample that may contain the
analyte of interest.
In some preferred embodiments, a sample is a biological sample; that is, a
sample obtained
from any biological source, such as an animal, a cell culture, an organ
culture, etc. In certain
preferred embodiments samples are obtained from a mammalian animal, such as a
dog, cat,
CA 03071626 2020-01-30
WO 2019/028080 PCT/US2018/044703
horse, etc. Particularly preferred mammalian animals are primates, most
preferably male or
female humans. Particularly preferred samples include blood, plasma, serum,
hair, muscle,
urine, saliva, tear, cerebrospinal fluid, or other tissue sample. Such samples
may be obtained,
for example, from a patient; that is, a living person, male or female,
presenting oneself in a
clinical setting for diagnosis, prognosis, or treatment of a disease or
condition. The test
sample is preferably obtained from a patient, for example, blood serum.
Sample Preparation for Mass Spectrometry
[0086] Methods that may be used to enrich in ApoE relative to other components
in the
sample (e.g. protein) include for example, filtration, centrifugation, thin
layer
chromatography (TLC), electrophoresis including capillary electrophoresis,
affinity
separations including immunoaffinity separations, extraction methods including
ethyl acetate
extraction and methanol extraction, and the use of chaotropic agents or any
combination of
the above or the like.
[0087] Protein precipitation is one preferred method of preparing a test
sample. Such
protein purification methods are well known in the art, for example, Polson et
at., Journal of
Chromatography B 785:263-275 (2003), describes protein precipitation
techniques suitable
for use in the methods. Protein precipitation may be used to remove most of
the protein from
the sample leaving ApoE in the supernatant. The samples may be centrifuged to
separate the
liquid supernatant from the precipitated proteins. The resultant supernatant
may then be
applied to liquid chromatography and subsequent mass spectrometry analysis. In
certain
embodiments, the use of protein precipitation such as for example,
acetonitrile protein
precipitation, obviates the need for high turbulence liquid chromatography
(HTLC) or other
on-line extraction prior to HPLC and mass spectrometry. Accordingly in such
embodiments,
the method involves (1) performing a protein precipitation of the sample of
interest; and (2)
loading the supernatant directly onto the HPLC-mass spectrometer without using
on-line
extraction or high turbulence liquid chromatography (HTLC).
[0088] In some preferred embodiments, HPLC, alone or in combination with one
or more
purification methods, may be used to purify ApoE prior to mass spectrometry.
In such
embodiments samples may be extracted using an HPLC extraction cartridge which
captures
the analyte, then eluted and chromatographed on a second HPLC column or onto
an
analytical HPLC column prior to ionization. Because the steps involved in
these
chromatography procedures can be linked in an automated fashion, the
requirement for
16
CA 03071626 2020-01-30
WO 2019/028080 PCT/US2018/044703
operator involvement during the purification of the analyte can be minimized.
This feature
can result in savings of time and costs, and eliminate the opportunity for
operator error.
[0089] It is believed that turbulent flow, such as that provided by HTLC
columns and
methods, may enhance the rate of mass transfer, improving separation
characteristics. HTLC
columns separate components by means of high chromatographic flow rates
through a packed
column containing rigid particles. By employing high flow rates (e.g., 3-5
mL/min),
turbulent flow occurs in the column that causes nearly complete interaction
between the
stationary phase and the analyte(s) of interest. An advantage of using HTLC
columns is that
the macromolecular build-up associated with biological fluid matrices is
avoided since the
high molecular weight species are not retained under the turbulent flow
conditions. HTLC
methods that combine multiple separations in one procedure lessen the need for
lengthy
sample preparation and operate at a significantly greater speed. Such methods
also achieve a
separation performance superior to laminar flow (HPLC) chromatography. HTLC
allows for
direct injection of biological samples (plasma, urine, etc.). Direct injection
is difficult to
achieve in traditional forms of chromatography because denatured proteins and
other
biological debris quickly block the separation columns. HTLC also allows for
very low
sample volume of less than 1 mL, preferably less than .5 mL, preferably less
than .2 mL,
preferably .1 mL.
[0090] Examples of HTLC applied to sample preparation prior to analysis by
mass
spectrometry have been described elsewhere. See, e.g., Zimmer et al., I
Chromatogr. A
854:23-35 (1999); see also, U.S. Patents Nos. 5,968,367; 5,919,368; 5,795,469;
and
5,772,874. In certain embodiments of the method, samples are subjected to
protein
precipitation as described above prior to loading on the HTLC column; in
alternative
preferred embodiments, the samples may be loaded directly onto the HTLC
without being
subjected to protein precipitation. The HTLC extraction column is preferably a
large particle
column. In various embodiments, one of more steps of the methods may be
performed in an
on-line, automated fashion. For example, in one embodiment, steps (i)-(v) are
performed in
an on-line, automated fashion. In another, the steps of ionization and
detection are performed
on-line following steps (i)-(v).
[0091] Liquid chromatography (LC) including high-performance liquid
chromatography
(HPLC) relies on relatively slow, laminar flow technology. Traditional HPLC
analysis relies
on column packings in which laminar flow of the sample through the column is
the basis for
separation of the analyte of interest from the sample. The skilled artisan
will understand that
17
CA 03071626 2020-01-30
WO 2019/028080 PCT/US2018/044703
separation in such columns is a diffusional process. HPLC has been
successfully applied to
the separation of compounds in biological samples but a significant amount of
sample
preparation is required prior to the separation and subsequent analysis with a
mass
spectrometer (MS), making this technique labor intensive. In addition, most
HPLC systems
do not utilize the mass spectrometer to its fullest potential, allowing only
one HPLC system
to be connected to a single MS instrument, resulting in lengthy time
requirements for
performing a large number of assays.
[0092] Various methods have been described for using HPLC for sample clean-up
prior to
mass spectrometry analysis. See, e.g., Taylor et at., Therapeutic Drug
Monitoring 22:608-12
(2000); and Salm et al., Clin. Therapeutics 22 Supl. B:B71-B85 (2000).
[0093] One of skill in the art may select HPLC instruments and columns that
are suitable for
use with ApoE. The chromatographic column typically includes a medium (i.e., a
packing
material) to facilitate separation of chemical moieties (i.e., fractionation).
The medium may
include minute particles. The particles include a bonded surface that
interacts with the
various chemical moieties to facilitate separation of the chemical moieties.
One suitable
bonded surface is a hydrophobic bonded surface such as an alkyl bonded
surface. Alkyl
bonded surfaces may include C-4, C-8, C-12, or C-18 bonded alkyl groups,
preferably C-18
bonded groups. The chromatographic column includes an inlet port for receiving
a sample
and an outlet port for discharging an effluent that includes the fractionated
sample. In one
embodiment, the sample (or pre-purified sample) is applied to the column at
the inlet port,
eluted with a solvent or solvent mixture, and discharged at the outlet port.
Different solvent
modes may be selected for eluting the analyte(s) of interest. For example,
liquid
chromatography may be performed using a gradient mode, an isocratic mode, or a
polytyptic
(i.e. mixed) mode. During chromatography, the separation of materials is
effected by
variables such as choice of eluent (also known as a "mobile phase"), elution
mode, gradient
conditions, temperature, etc.
[0094] In certain embodiments, an analyte may be purified by applying a sample
to a
column under conditions where the analyte of interest is reversibly retained
by the column
packing material, while one or more other materials are not retained. In these
embodiments,
a first mobile phase condition can be employed where the analyte of interest
is retained by the
column, and a second mobile phase condition can subsequently be employed to
remove
retained material from the column, once the non-retained materials are washed
through.
Alternatively, an analyte may be purified by applying a sample to a column
under mobile
18
CA 03071626 2020-01-30
WO 2019/028080 PCT/US2018/044703
phase conditions where the analyte of interest elutes at a differential rate
in comparison to
one or more other materials. Such procedures may enrich the amount of one or
more analytes
of interest relative to one or more other components of the sample.
[0095] In one preferred embodiment, the HTLC may be followed by HPLC on a
hydrophobic column chromatographic system. In certain preferred embodiments, a
TurboFlow Cyclone P polymer-based column from Cohesive Technologies (601.tm
particle
size, 50 x 1.0 mm column dimensions, 100A pore size) is used. In related
preferred
embodiments, a Synergi Polar-RP ether-linked phenyl, analytical column from
Phenomenex Inc (4 1.tm particle size, 150 x 2.0 mm column dimensions, 80A pore
size) with
hydrophilic endcapping is used. In certain preferred embodiments, HTLC and
HPLC are
performed using HPLC Grade Ultra Pure Water and 100% methanol as the mobile
phases.
[0096] By careful selection of valves and connector plumbing, two or more
chromatography
columns may be connected as needed such that material is passed from one to
the next
without the need for any manual steps. In preferred embodiments, the selection
of valves and
plumbing is controlled by a computer pre-programmed to perform the necessary
steps. Most
preferably, the chromatography system is also connected in such an on-line
fashion to the
detector system, e.g., an MS system. Thus, an operator may place a tray of
samples in an
autosampler, and the remaining operations are performed under computer
control, resulting in
purification and analysis of all samples selected.
[0097] In certain preferred embodiments, ApoE or fragments thereof in a sample
may be
purified prior to ionization. In particularly preferred embodiments the
chromatography is not
gas chromatography.
Detection and Quantitation by Mass Spectrometry
[0098] In various embodiments, ApoE or fragments thereof may be ionized by any
method
known to the skilled artisan. Mass spectrometry is performed using a mass
spectrometer,
which includes an ion source for ionizing the fractionated sample and creating
charged
molecules for further analysis. For example ionization of the sample may be
performed by
electron ionization, chemical ionization, electrospray ionization (ESI),
photon ionization,
atmospheric pressure chemical ionization (APCI), photoionization, atmospheric
pressure
photoionization (APPI), fast atom bombardment (FAB), liquid secondary
ionization (LSI),
matrix assisted laser desorption ionization (MALDI), field ionization, field
desorption,
thermospray/plasmaspray ionization, surface enhanced laser desorption
ionization (SELDI),
19
CA 03071626 2020-01-30
WO 2019/028080 PCT/US2018/044703
inductively coupled plasma (ICP) and particle beam ionization. The skilled
artisan will
understand that the choice of ionization method may be determined based on the
analyte to be
measured, type of sample, the type of detector, the choice of positive versus
negative mode,
etc.
[0099] In preferred embodiments, ApoE or a fragment thereof is ionized by
heated
electrospray ionization (HEST) in positive or negative mode. In alternative
embodiments,
ApoE or a fragment thereof is ionized by electrospray ionization (ESI) or
atmospheric
pressure chemical ionization (APCI) in positive or negative mode.
[00100] After the sample has been ionized, the positively charged or
negatively charged ions
thereby created may be analyzed to determine a mass-to-charge ratio. Suitable
analyzers for
determining mass-to-charge ratios include quadrupole analyzers, ion traps
analyzers, and
time-of-flight analyzers. The ions may be detected using several detection
modes. For
example, selected ions may be detected i.e., using a selective ion monitoring
mode (SIM), or
alternatively, ions may be detected using a scanning mode, e.g., multiple
reaction monitoring
(MRM) or selected reaction monitoring (SRM). Preferably, the mass-to-charge
ratio is
determined using a quadrupole analyzer. For example, in a "quadrupole" or
"quadrupole ion
trap" instrument, ions in an oscillating radio frequency field experience a
force proportional
to the DC potential applied between electrodes, the amplitude of the RF
signal, and the
mass/charge ratio. The voltage and amplitude may be selected so that only ions
having a
particular mass/charge ratio travel the length of the quadrupole, while all
other ions are
deflected. Thus, quadrupole instruments may act as both a "mass filter" and as
a "mass
detector" for the ions injected into the instrument.
[00101] One may enhance the resolution of the MS technique by employing
"tandem mass
spectrometry," or "MS/MS". In this technique, a precursor ion (also called a
parent ion)
generated from a molecule of interest can be filtered in an MS instrument, and
the precursor
ion is subsequently fragmented to yield one or more fragment ions (also called
daughter ions
or product ions) that are then analyzed in a second MS procedure. By careful
selection of
precursor ions, only ions produced by certain analytes are passed to the
fragmentation
chamber, where collisions with atoms of an inert gas produce the fragment
ions. Because
both the precursor and fragment ions are produced in a reproducible fashion
under a given set
of ionization/fragmentation conditions, the MS/MS technique may provide an
extremely
powerful analytical tool. For example, the combination of
filtration/fragmentation may be
CA 03071626 2020-01-30
WO 2019/028080 PCT/US2018/044703
used to eliminate interfering substances, and may be particularly useful in
complex samples,
such as biological samples.
[00102] The mass spectrometer typically provides the user with an ion scan;
that is, the
relative abundance of each ion with a particular mass/charge over a given
range (e.g., 100 to
1000 amu). The results of an analyte assay, that is, a mass spectrum, may be
related to the
amount of the analyte in the original sample by numerous methods known in the
art. For
example, given that sampling and analysis parameters are carefully controlled,
the relative
abundance of a given ion may be compared to a table that converts that
relative abundance to
an absolute amount of the original molecule. Alternatively, molecular
standards may be run
with the samples, and a standard curve constructed based on ions generated
from those
standards. Using such a standard curve, the relative abundance of a given ion
may be
converted into an absolute amount of the original molecule. In certain
preferred
embodiments, an internal standard is used to generate a standard curve for
calculating the
quantity of ApoE. Methods of generating and using such standard curves are
well known in
the art and one of ordinary skill is capable of selecting an appropriate
internal standard. For
example, an isotope of ApoE may be used as an internal standard. Numerous
other methods
for relating the amount of an ion to the amount of the original molecule will
be well known to
those of ordinary skill in the art.
[00103] One or more steps of the methods may be performed using automated
machines. In
certain embodiments, one or more purification steps are performed on-line, and
more
preferably all of the purification and mass spectrometry steps may be
performed in an on-line
fashion.
[00104] In certain embodiments, such as MS/MS, where precursor ions are
isolated for
further fragmentation, collision activation dissociation is often used to
generate the fragment
ions for further detection. In CAD, precursor ions gain energy through
collisions with an
inert gas, and subsequently fragment by a process referred to as "unimolecular
decomposition". Sufficient energy must be deposited in the precursor ion so
that certain
bonds within the ion can be broken due to increased vibrational energy.
[00105] In particularly preferred embodiments, ApoE is detected and/or
quantified using
MS/MS as follows. The samples are subjected to liquid chromatography,
preferably HPLC,
the flow of liquid solvent from the chromatographic column enters the heated
nebulizer
interface of an MS/MS analyzer and the solvent/analyte mixture is converted to
vapor in the
21
CA 03071626 2020-01-30
WO 2019/028080 PCT/US2018/044703
heated tubing of the interface. The analyte is ionized by the selected
ionizer. The ions, e.g.
precursor ions, pass through the orifice of the instrument and enter the first
quadrupole.
Quadrupoles 1 and 3 (Q1 and Q3) are mass filters, allowing selection of ions
(i.e.,
"precursor" and "fragment" ions) based on their mass to charge ratio (m/z).
Quadrupole 2
(Q2) is the collision cell, where ions are fragmented. The first quadrupole of
the mass
spectrometer (Q1) selects for molecules with the mass to charge ratios of
ApoE. Precursor
ions with the correct mass/charge ratios of ApoE are allowed to pass into the
collision
chamber (Q2), while unwanted ions with any other mass/charge ratio collide
with the sides of
the quadrupole and are eliminated. Precursor ions entering Q2 collide with
neutral argon gas
molecules and fragment. This process is called collision activated
dissociation (CAD). The
fragment ions generated are passed into quadrupole 3 (Q3), where the fragment
ions of ApoE
are selected while other ions are eliminated.
[00106] The methods may involve MS/MS performed in either positive or negative
ion mode.
Using standard methods well known in the art, one of ordinary skill is capable
of identifying
one or more fragment ions of a particular precursor ion of ApoE that may be
used for
selection in quadrupole 3 (Q3).
[00107] If the precursor ion of ApoE includes an alcohol or amine group,
fragment ions are
commonly formed that represent dehydration or deamination of the precursor
ion,
respectfully. In the case of precursor ions that include an alcohol group,
such fragment ions
formed by dehydration are caused by a loss of one or more water molecules from
the
precursor ion (i.e., where the difference in mass to charge ratio between the
precursor ion and
fragment ion is about 18 for the loss of one water molecule, or about 36 for
the loss of two
water molecules, etc.). In the case of precursor ions that include an amine
group, such
fragment ions formed by deamination are caused by a loss of one or more
ammonia
molecules (i.e. where the difference in mass to charge ratio between the
precursor ion and
fragment ion is about 17 for the loss of one ammonia molecule, or about 34 for
the loss of
two ammonia molecules, etc.). Likewise, precursor ions that include one or
more alcohol and
amine groups commonly form fragment ions that represent the loss of one or
more water
molecules and/or one or more ammonia molecules (i.e., where the difference in
mass to
charge ratio between the precursor ion and fragment ion is about 35 for the
loss of one water
molecule and the loss of one ammonia molecule). Generally, the fragment ions
that represent
dehydrations or deaminations of the precursor ion are not specific fragment
ions for a
particular analyte. Accordingly, in preferred embodiments of the invention,
MS/MS is
22
CA 03071626 2020-01-30
WO 2019/028080 PCT/US2018/044703
performed such that at least one fragment ion of ApoE is detected that does
not represent only
a loss of one or more water molecules and/or a loss of one or more ammonia
molecules from
the precursor ion.
[00108] As ions collide with the detector they produce a pulse of electrons
that are converted
to a digital signal. The acquired data is relayed to a computer, which plots
counts of the ions
collected versus time. The resulting mass chromatograms are similar to
chromatograms
generated in traditional HPLC methods. The areas under the peaks corresponding
to
particular ions, or the amplitude of such peaks, are measured and the area or
amplitude is
correlated to the amount of the analyte of interest. In certain embodiments,
the area under the
curves, or amplitude of the peaks, for fragment ion(s) and/or precursor ions
are measured to
determine the amount of ApoE. As described above, the relative abundance of a
given ion
may be converted into an absolute amount of the original analyte, using
calibration standard
curves based on peaks of one or more ions of an internal molecular standard.
[00109] The following examples serve to illustrate the invention. These
examples are in no
way intended to limit the scope of the methods.
EXAMPLES
Example 1: ApoE phenotype determination by mass spectrometry
[00110] Reagent summary: Table 1
Reagents Supplier & Catalog Number Quantity
Apolipoprotein E2 Abcam, 30R-AA019 0.5mg
Apolipoprotein E3 Abcam, 30R-2382 0.5mg
Apolipoprotein E4 Abcam, 003002 0.5mg
Formic Acid Millipore, FX0440-S 1 L
Water Burdick & Jackson, 365-4 4 L
Acetonitrile Burdick & Jackson, 015-4 4 L
Sodium Deoxycholate Fisher Scientific, PI89905 25g
Dithiothreitol Sigma, 43819-25G 25gg
Iodoacetamide Sigma, I1149-25G 25g
Trypsin Sigma, T1426-100MG 0.5 mg
23
CA 03071626 2020-01-30
WO 2019/028080 PCT/US2018/044703
New England Peptide, Custom
Apolipoprotein E2 IS 2mg
Synthesis
New England Peptide, Custom
Apolipoprotein E2/3 IS 2mg
Synthesis
New England Peptide, Custom
Apolipoprotein E3/4 IS 2mg
Synthesis
New England Peptide, Custom
Apolipoprotein E4 IS 2mg
Synthesis
New England Peptide, Custom
Apolipoprotein E total IS 2mg
Synthesis
Bovine Serum Albumin Sigma, A2153-500G 500g
Phosphate Buffered Saline
Fisher, 003002 100 tablets
Tablets
Ammonium Bicarbonate
Sigma, A6141-500G 500 g
(AmBic)
Bovine Cerebrospinal Fluid Bioreclaimation IVT, custom
250 mL
(BC SF) Not stripped, pooled
Methanol Fisher Scientific, A454-4 4 L
Fisher Scientific,
Activated Charcoal 2.5 kg
AC134370025
Agilent BondElut C18 25mg Agilent, A4960125 1 plate
Agilent Poroshell 120 Bonus
Agilent, 695768-901
1 column
RP 2.1 x 100 2.7um
[00111] The Identification of CSF Apolipoprotein E (ApoE) Isoforms by LC-MS/MS
assay
measures three distinct isoforms for ApoE, which can then be used to infer a
phenotype.
There are three alleles that encode for the apolipoprotein E protein, ApoE2,
ApoE3, and
ApoE4, which are expressed codominantly yielding six unique phenotypes;
ApoE2/E2,
ApoE2/E3, ApoE2/E4, ApoE3/E3, ApoE3/E4, and ApoE4/E4.
[00112] In order to measure each ApoE phenotype, a tryptic protein digestion
is performed
and a unique peptide is used as a surrogate to identify each protein isoform.
There is a unique
peptide for both the ApoE2 isoform and the ApoE4 isoform. The ApoE3isoform is
24
CA 03071626 2020-01-30
WO 2019/028080 PCT/US2018/044703
determined by using a shared peptide between the ApoE2 and ApoE3 isoform, and
a shared
peptide between the ApoE3 and ApoE4 isoform. Internal standards for each
isoform are
spiked into each sample to serve as retention time reference points.
[00113] CSF ApoE samples are analyzed using tandem mass spectrometry with a
Thermo
Aria Cohesive TLX-4 high flow LC coupled with a Thermo Fisher Quantiva Triple
Quadrupole mass spectrometer. The data is monitored by multiple reaction
monitoring
(MRIVI) and analyzed using Thermo Fisher LC Quan data analysis software.
[00114] All mass-to-charge ratios (m/z) that identify the various ApoE alleles
are described
in the figures and summarized in Table 2 below.
Compound
Precursor (m/z) Product (m/z) Collision Energy (V) RF Lens (V)
ApoE3/4: LAVYQAGAR 475.05 374.42 21 55
ApoE3/4: LAVYQAGAR 475.05 502.55 21 55
ApoE3/4 IS: LAVYQAGAN13c 1SN) 482 516.45 21 55
ApoE3/4 IS: LAVYQAGAN13c 1SN) 482 679.62 21 55
ApoE4: LGADMEDVR 503.56 649.74 20 56
ApoE4: LGADMEDVR 503.56 892.96 19 56
ApoE4 IS: LGADMEDVN13C, nN) 511.5 665.63 20 56
ApoE4 IS: LGADMEDVN13C, nN) 511.5 908.84 20 56
ApoE2: C[+57.1]LAVYQAGAR 555.15 665.72 21 54
ApoE2: C[+57.1]LAVYQAGAR 555.15 835.93 21 54
ApoE2 IS: C[+57.1]LAVYQAGAR(13Cs nN) 562.1 679.62 21 54
ApoE2 IS: C[+57.1]LAVYQAGAR(13Cs nN) 562.1 849.83 21 54
ApoE2/3: LGADMEDVC[+57.1]G R 612.19 866.99 22 89
ApoE2/3: LGADMEDVC[+57.1]G R 612.19 982.08 22 89
ApoE2/3 IS: LGADMEDVC[+57.1]GR(13C, 1SN) 620.13 882.87 22 89
ApoE2/3 IS: LGADMEDVC[+57.1]G ROM: nN) 620.13 997.96 22 89
[00115] Expected values: Apolipoprotein E in CSF: 2.84-7.24 ug/mL;
Apolipoprotein E in
Serum: 20.07- 101.68 ug/mL.
[00116] Five technical replicates of each quality control level were run in
order of low,
medium and high over the course of five separate days.
[00117] CSF Low Quality Control: 1.2ug/mL
Apolipoprotein E:
MEAN: 1.16 to 1.37
SD: 0.03 to 0.12
%CV: 2.27 to 10.35%
%Recovery: 97.00 to 104.00%
[00118] CSF Medium Quality Control: 3.0ug/mL
CA 03071626 2020-01-30
WO 2019/028080
PCT/US2018/044703
Apolipoprotein E:
MEAN: 2.68 to 3.37
SD: 0.05 to 0.33
%CV: 1.74 to 10.59%
%Recovery: 89.27 to 112.40%
[00119] CSF High Quality Control: 15.0ug/mL
Apolipoprotein E:
MEAN: 13.38 to 16.54
SD: 0.40 to 1.65
%CV: 4.71 to 11.36%
%Recovery: 89.20 to 110.29%
[00120] Accuracy: Twenty patient samples with known APOE genotypes (analysis
method:
restriction length polymorphism (RLPM)) were analyzed by LC-MS/MS. ApoE
phenotypes
were then compared to the known genotypes. There was 100% concordance between
the
genotype and phenotype for each patient sample as shown in Table 3 below.
RLPM (Genotyping) LC-MS/MS (Phenotyping)
Patient 1 E3/E3 E3/E3
Patient 2 E3/E3 E3/E3
Patient 3 E3/E3 E3/E3
Patient 4 E3/E4 E3/E4
Patient 5 E3/E4 E3/E4
Patient 6 E3/E3 E3/E3
Patient 7 E2/E3 E2/E3
Patient 8 E3/E4 E3/E4
Patient 9 E3/E3 E3/E3
Patient 10 E3/E3 E3/E3
Patient 11 E3/E3 E3/E3
Patient 12 E4/E4 E4/E4
Patient 13 E3/E3 E3/E3
Patient 14 E2/E4 E2/E4
Patient 15 E3/E4 E3/E4
Patient 16 E4/E4 E4/E4
Patient 17 E3/E3 E3/E3
Patient 18 E3/E3 E3/E3
Patient 19 E3/E4 E3/E4
Patient 20 E3/E4 E3/E4
26
CA 03071626 2020-01-30
WO 2019/028080
PCT/US2018/044703
[00121] Freeze-Thaw Stability: Freeze thaw analysis was conducted by analyzing
six spiked
phenotpyes which were divided into four even aliquots. All four aliquots for
each phenotype
were frozen at -90 to -60 C. Aliquots two through four were thawed to ambient
temperature
of 18-25 C and frozen, for one freeze-thaw. Aliquots three and four were
thawed to ambient
temperature of 18-25 C and frozen, for two freeze-thaws. Aliquot four was then
thawed to
ambient temperature 18-25 C and frozen, for three freeze-thaws.
[00122] All aliquots were thawed a final time to ambient temperature 18-25 C
and analyzed
in technical triplicate. Freeze thaw analysis contains data across three
freeze thaw cycles.
ApoE phenotype has acceptable stability up to three freeze thaw cycles. Table
4:
Phenotype I Phenot ype
Baseline 1 FT 2 FT 3 FT ......... Baseline 1 FT Z FT
3 FT
Run t EWE EWE E2 /E Run 3i EZ/E3 EWE E2 /B
E2/E3
Run Z E2/E2 El 52 EVE ...... E2/E2. Run 2 E2/E3 E2/E3
E2/E3 E21E3
Run 3 E2/E2 E2/E2 EVE ...... E2/E2 Run 3 E2/E3 EVE
EWE E2./E3
Accuracy 10C% 300K ICOS lOCK Mean 100K 100% 100% 1064
Phenotype 3 Phenotype 4
Baseline 1 FT 2 FT 3 FT Baseline 1 FT 2 FT
3 FT
t E2/E4 ElE4 EVE4 E2/E4 .. Run 1 E3/E3 E3/E3 E3/E3
E3/E3
Run 2 E2/E4 E2/E4 E2/E4 E2/E4 Run 2 E3IE3 E3/E3
E3/E3 EBIE3
Run 3 EZ/E4 E/E4 E2/E4 ElE4 Run 3 E3/E3 E3/E5 E3/E3
E3/E3
Mean 1.0M 100% ICC% 100% Mean lf,t3,6 WO% taD5i-
; 11.06%
Phenotype 5 Phenotype 6
BaseEin e 1 FT 2 FT 3 FT Baseline 1 FT 2 FT
3 FT
RunL E3,,E4 E3/E4 E3IE,1 ... H1E4 Run 1 E4/E4 4f
E4/E4 E4/E4
Run Z EVE4 3/E4 E3/E4 E3/E4 .. Run 2 E4/E4 E4/E4 E4/E4
E4/E4
Ron 3 E5/E4 E3/' E4 E31E4 BlE4 Run 3 E4/E4 E4/E4
E4/E4 E4/E4
Mean 'Mk, 366K 1LXY:1, 10L% Mean 1X LQU 1QU 1tYjK,
[00123] Extracted Sample Stability: Ten samples were analyzed the same day as
sample
extraction for a baseline value. The next day, the same samples were re-
injected for analysis
against the baseline values. This assay yields enough sample for two
injections. ApoE shows
extracted sample stability of at least 1 day at 2 to 8 C in the C-stack of the
CTC Autosampler.
Table 5:
27
CA 03071626 2020-01-30
WO 2019/028080 PCT/US2018/044703
Baseline 1 Day Extracted Sample Stability % Accuracy
Patient 1 3/4 3/4 100%
Patient 2 3/3 3/3 100%
Patient 3 3/4 3/4 100%
Patient 4 2/3 2/3 100%
Patient 5 3/4 3/4 100%
Patient 6 3/4 3/4 100%
Patient 7 3/3 3/3 100%
Patient 8 3/4 3/4 100%
Patient 9 3/4 3/4 100%
Patient 10 2/4 2/4 100%
[00124] Room Temperature Stability: Samples are stable up to 7 days at 18 to
25 C. Table 6:
RT Phenotype 1 RT Phenotype 2
Baseline 1 Day 3 Days 5 Days 7 Days Baseline 1 Day
3 Days 5 Days 7 Days
Run 1 E2/E2 E2/E2 E2/E2 .. E2/E2 E2/E2 Run 1
E2/E3 E2/E3 E2/E3 E2/E3 E2/E3
Run 2 E2/E2 E2/E2 E2/E2 -- E2/E2 E2/E2 Run 2
E2/E3 E2/E3 E2/E3 E2/E3 E2/E3
Run 3 E2/E2 E2/E2 E2/E2 E2/E2 E2/E2 Run 3 E2/E3
E2/E3 E2/E3 E2/E3 E2/E3
Accuracy 100% 100% 100% 100% 100% Accuracy 100%
100% 100% 100% 100%
RT Phenotype 3 RT Phenotype 4
Baseline 1 Day 3 Days 5 Days 7 Days Baseline 1 Day
3 Days 5 Days 7 Days
Run 1 E2/E4 E2/E4 E2/E4 .. E2/E4 E2/E4 Run 1
E3/E3 E3/E3 E3/E3 E3/E3 E3/E3
Run 2 E2/E4 E2/E4 E2/E4 E2/E4 E2/E4 Run 2 E3/E3
E3/E3 E3/E3 E3/E3 E3/E3
Run 3 E2/E4 E2/E4 E2/E4 E2/E4 E2/E4 Run 3 E3/E3
E3/E3 E3/E3 E3/E3 E3/E3
Accuracy 100% 100% 100% 100% 100%
Accuracy 100% 100% 100% 100% 100%
RT Phenotype 5 RT Phenotype 6
Baseline 1 Day 3 Days ............... 5 Days 7 Days Baseline 1 Day
3 Days 5 Days 7 Days
Run 1 E3/E4 E3/E4 E3/E4 -- E3/E4 E3/E4 Run 1
E4/E4 E4/E4 E4/E4 E4/E4 E4/E4
Run 2 E3/E4 E3/E4 E3/E4 .. E3/E4 E3/E4 Run 2
E4/E4 E4/E4 E4/E4 E4/E4 E4/E4
Run 3 E3/E4 E3/E4 E3/E4 E3/E4 E3/E4 Run 3 E4/E4
E4/E4 E4/E4 E4/E4 E4/E4
Accuracy 100% 100% 100% 100% 100% Accuracy 100%
100% 100% 100% 100%
[00125] Refrigerated Stability: Samples are stable up to 7 days at 2 to 8 C.
Table 7:
28
CA 03071626 2020-01-30
WO 2019/028080 PCT/US2018/044703
C Phenotype 3 4'C Phanatype 2
5Z5411frte. 1 Day .................... 5 Eitalir 5 Days 7 Days
Dasel 143 1 Day 3 Days 3 Days 7 Days
Run 1 EZ:fEZ =Z2/ L72 EVE L': 412 E-412 Run 1 E215
EZIE-3 EZfEE EZ/E3 =E.VEs.
Run Z EZ:fEZ =Z2/ L72 EVE L': 412 E-412 Run Z E215
EZIE-3 EZfEE EZ/E3 =E.VEs.
'WU WEL' E2.1.-".2 5.25. 2 Run a E2,16 1'.21E5 1-21E1.4
ELIE,
Acwracy 1;7.)% 1DX IDO% 1..c.e?=i 100,Z, Az-curacy
1.0c,.. 3.Sg:`.f.: 'IDDX, 'a".:C% 1QC%
. . ,
4µC Phenotype 3 ..S'C PtisnaApi. 4
Baseline. 2 Day a Dap 6 Days 7 Days Baseline. 3. Day 3.
Days 5 Days 7 Days
Run 1 af E4 :4E21E4 E2,14 5.2.14 1'.211:. 4. Run 3.
E.5z1.-5 E.3.,e.f3 E3,12 BIE, Eli/ iE3
Run Z E4 E2IE4 E2,14 5.2.14 .. 1'.211:. 4. Run Z
E.5z1.-5 E.3.,e.f3 E3,12 BIE, Eli/ iE3
Run 3 EVE4 E21E4 E2.14 ...... .,..., 444 E-21E 4- Run 3
Ea.la ug-a E3,43 Eatla EVE5
Accutagy 107.% 10N 100% ID,:% 104,?µ Xeuracy
3..::c% KAN IOC% L'COiN EC%
4µC P ha naty pa 5 t PllanoWpis 6
,=
Ease I ha 2 Day a Da vs 6 Days 7 Days Basil hi I Day 3. Days 5
Days 7 Days
Run 1 E31E4 EIVE4 EVE4 ... E6/14 ESE 4 Run I E4$
E4?.1=4 E44 E4,14 5;-/5.4
Run Z E514 E6/E4 115(114, ... E3/1-.-4 U:14 Run Z
E44 ligif.-4, EiVE4 .14,14
Run 3 E.3,14 534S1 EQ,14 E aif.4. E-311,11. Run 3
E.%.,õ..s., EaeSa E4,7E4 E4.14
ACT:UMW 1CO'Fi 11.3.15i 'IOC% ii.",k) 1..rsX. Asc craw
la% 1C,M 1DM :Ør.N. 14,2R,
[00126] Frozen Stability: Samples are stable for at least 31 days at -30 to -
10 C. Table 8:
29
CA 03071626 2020-01-30
WO 2019/028080
PCT/US2018/044703
-20T Phenotype 1
Baseline 1 Day 3 Days 5 Days 7 Days 14 Days 21 Days 31 Days
Run 1 E21E2 E2/E2 E2/E2 E2/E2 E2/S2 EV E2
E2/E2 E2/E2
Run2 E2/E2 E2/E2 E2/E2 E2/E2 E2/E2 E2/E2
E2/E2 E2/E2.
Run 3 E2/E2 E2/E2 E 21E2 E-2/E2 E2/E2 E2/E2
E2/E2 EVE2
Accuracy 100% 100% 100% 100% 1.00y. 100% 100% 100%
-20T Phenotype 2
Base iin e 1 Day 3 Days 5 Days 7 Days 14 Days 21 Days 31 Days
Run 1 E2/E3 EVE3 E2/E3 E2/E3 EVE3 E2/E3
E2/E3 E2/E3
Run 2 E2/E3 E21E3 E2/E3 E2/E3 E2/E3 E2/E3
E21E3 E2/E3
Run 3 E2/E3 E2/E3 E2/E3 E21E3 E2/E3 E2/E3
E2/E3 E2/E3
Accuracy 100% 100% 100% 100% 100% 100% 100% Iota%
-2TC Phenotype 3
Baseline 1 Day a Days 5 Days 7 Days 14 Days 21 Days al Days
Run 1 E2/E4 E2/E4 E2/E4 E2/E4 E2/04 EV E4
E2/E4 E2/E4
Run 2 E2/E4 E2tE4 E2/E4 E2/E4 E2/E4 E2/E4
E2/E4 E2/E4
Run 3 E2/E4 E2/E4 E 21E4 E2/E4 E2JE4 2/E4
E2/E4 E2/E4
Accuracy 100% 100% 100% 100% 100K. 100% 100% 100%
-20T Phenotype 4
Baseline 1 Day 3 Days 5 Days 7 Days 14 Days 21 Days 31 Days
Run 1 E3/E3 E3/E3 E3/E3 E3/E3 E3/E3 E3/E3
E3/E3 E3/E3
Run 2 E3/E3 E3/E 3 E3/E3 E-.3/E3 E3/23 3/E3
3/E3 E3/E3
Run 3 E3/E3 E3/E3 E3/E3 E3/E3 E3/E3 E3/E3
E3/E3 E3/E3
Accuracy 100% 100% 100% 100% 100% 100% 100% 100%
-Nrt Phenotype 5
Baseline 1 Day 3 Days 5 Days 7 Days 14 Days 21 Days 31 Days
Run 1 E3/E4 E3/E4 E3/E4 E3/E4 E3/E4 E3/E4
E3/E4 E3/E4
Run 2 3/E4 E-.3/E4 E3/E4 E3/E4 E-3/E4 E3/E4
E3/E4 E3/E4
Run 3 E3/E4 E3/E4 E3/E4 E3/E4 E3/E4 E3/E4
E3/E4 E3/E4
Accuracy 100% 100% 100% 100% 100y., 100% 100% 100%
-200C Phenotype 6
Baseline 1 Day a Days 5 Days 7 Days 14 Days 21 Days 31 Days
Run 1 4/04 E 4/C4 E4/C4 C4/C4 E4/04 04/C4
E4/C4 4/E4
Run2 E4/E4 E4/E4 E4/E4 E4/E4 E4/E4 E4/E4
E4/ E4 E4/E4
Run 3 E4/E4 E41E4 E4/E4 E4/E4 E4/E4 E4/E$
E4/E4 E4/E4
Accuracy 100% 100% 100% 100% 100% 100% 100% 100%
1001271 Interference Study: Acceptability criteria: The difference due to a
potential
interfering substance should be <2SD or 20 /0CV to be considered acceptable.
CA 03071626 2020-01-30
WO 2019/028080 PCT/US2018/044703
[00128] Hemolysis Interference: Six patient pools were spiked with hemoglobin
(Sigma Cat.
#H7379) and analyzed in triplicate for a baseline, slight, moderate and gross
hemolysis
interference. A 10 mg/mL solution of hemoglobin was used for "gross"
interference. The 10
mg/mL solution was diluted with 10 mM BS 1:10 and 1:20 for moderate and slight
interference, respectively.
[00129] All levels of hemolysis are unacceptable due to the possible
contamination of serum-
derived Apolipoprotein E. Table 9:
Hemolysis
2/2 I Baseline I Lite 'Moderate' Gross
Expected 2/2 2/2 2/2 2/2
Run 1 2/2 2/2 2/2 2/2
Run 2 2/2 2/2 2/2 2/2
Run 3 2/2 2/2 2/2 2/2
Accuracy 100% 100% 100% 100%
Hemolysis
2/3 I Baseline I Lite 'Moderate' Gross
Expected 2/3 2/3 2/3 2/3
Run 1 2/3 2/3 2/3 2/3
Run 2 2/3 2/3 2/3 2/3
Run 3 2/3 2/3 2/3 2/3
Accuracy 100% 100% 100% 100%
Hemolysis
2/4 I Baseline I Lite 'Moderate' Gross
Expected 2/4 2/4 2/4 2/4
Run 1 2/4 2/4 2/4 2/4
Run 2 2/4 2/4 2/4 2/4
Run 3 2/4 2/4 2/4 2/4
Accuracy 100% 100% 100% 100%
31
CA 03071626 2020-01-30
WO 2019/028080 PCT/US2018/044703
Hemolysis
3/3 I Baseline I Lite 'Moderate' Gross
Expected 3/3 3/3 3/3 3/3
Run 1 3/3 3/3 3/3 3/3
Run 2 3/3 3/3 3/3 3/3
Run 3 3/3 3/3 3/3 3/3
Accuracy 100% 100% 100% 100%
Hemolysis
3/4 I Baseline Lite Moderate' Gross
Expected 3/4 3/4 3/4 3/4
Run 1 3/4 3/4 3/4 3/4
Run 2 3/4 3/4 3/4 3/4
Run 3 3/4 3/4 3/4 3/4
Accuracy 100% 100% 100% 100%
Hemolysis
4/4 I Baseline I Lite 'Moderate' Gross
Expected 4/4 4/4 4/4 4/4
Run 1 4/4 4/4 4/4 4/4
Run 2 4/4 4/4 4/4 4/4
Run 3 4/4 4/4 4/4 4/4
Accuracy 100% 100% 100% 100%
1001301 Lipemia Interference: Six patient pools were spiked with intralipid
(Sigma Cat. #
1141) and analyzed in triplicate for a baseline, slight, moderate and gross
lipemic
interference. A 1:5 dilution (intralipid:10mM PBS) was used for "gross"
interference. The 1:5
solution was diluted with 10 mM PBS 1:10 and 1:20 for moderate and slight
interference,
respectively. ApoE is acceptable for all degrees of lipemia CSF samples. Table
10:
32
CA 03071626 2020-01-30
WO 2019/028080
PCT/US2018/044703
Li pimic
2/2 I Baseline I Lite I Moderate I Gross
Expected 2/2 2/2 2/2 2/2
Run 1 2/2 2/2 2/2 2/2
Run 2 2/2 2/2 2/2 2/2
Run 3 2/2 2/2 2/2 2/2
Accuracy 100% 100% 100% 100%
Li pimic
2/3 Baseline I Lite I Moderate Gross
Expected 2/3 2/3 2/3 2/3
Run 1 2/3 2/3 2/3 2/3
Run 2 2/3 2/3 2/3 2/3
Run 3 2/3 2/3 2/3 2/3
Accuracy 100% 100% 100% 100%
Li pimic
2/4 I Baseline I Lite I Moderate I Gross
Expected 2/4 2/4 2/4 2/4
Run 1 2/4 2/4 2/4 2/4
Run 2 2/4 2/4 2/4 2/4
Run 3 2/4 2/4 2/4 2/4
Accuracy 100% 100% 100% 100%
33
CA 03071626 2020-01-30
WO 2019/028080 PCT/US2018/044703
Li pimic
3/3 I Baseline I Lite I Moderate I Gross
Expected 3/3 3/3 3/3 3/3
Run 1 3/3 3/3 3/3 3/3
Run 2 3/3 3/3 3/3 3/3
Run 3 3/3 3/3 3/3 3/3
Accuracy 100% 100% 100% 100%
Li pimic
3/4 Baseline I Lite I Moderate Gross
Expected 3/4 3/4 3/4 3/4
Run 1 3/4 3/4 3/4 3/4
Run 2 3/4 3/4 3/4 3/4
Run 3 3/4 3/4 3/4 3/4
Accuracy 100% 100% 100% 100%
Li pimic
4/4 I Baseline I Lite I Moderate I Gross
Expected 4/4 4/4 4/4 4/4
Run 1 4/4 4/4 4/4 4/4
Run 2 4/4 4/4 4/4 4/4
Run 3 4/4 4/4 4/4 4/4
Accuracy 100% 100% 100% 100%
[00131] Bilirubin Interference: Six patient pools were spiked with bilirubin
(Sigma Cat. #
B4126) and analyzed in triplicate for a baseline, slight, moderate and gross
icteric
interference. A 1 mg/mL solution of bilirubin was used for "gross"
interference. The 1
mg/mL solution was diluted with 10 mM PBS 1:10 and 1:20 for moderate and
slight
interference, respectively. ApoE is acceptable for any degree of icteric CSF
samples. Table
11:
34
CA 03071626 2020-01-30
WO 2019/028080
PCT/US2018/044703
Icteric
2/2 I Baseline I Lite I Moderate'
Gross
Expected 2/2 2/2 2/2 2/2
Run 1 2/2 2/2 2/2 2/2
Run 2 2/2 2/2 2/2 2/2
Run 3 2/2 2/2 2/2 2/2
Accuracy 100% 100% 100% 100%
Icteric
2/3 I Baseline I Lite I Moderate'
Gross
Expected 2/3 2/3 2/3 2/3
Run 1 2/3 2/3 2/3 2/3
Run 2 2/3 2/3 2/3 2/3
Run 3 2/3 2/3 2/3 2/3
Accuracy 100% 100% 100% 100%
,
Icteric
2/4 Baseline I Lite Moderate Gross
Expected 2/4 2/4 2/4 2/4
Run 1 2/4 2/4 2/4 2/4
Run 2 2/4 2/4 2/4 2/4
Run 3 2/4 2/4 2/4 2/4
Accuracy 100% 100% 100% 100%
CA 03071626 2020-01-30
WO 2019/028080 PCT/US2018/044703
lcteric
3/3 I Baseline I Lite I Moderate'
Gross
Expected 3/3 3/3 3/3 3/3
Run 1 3/3 3/3 3/3 3/3
Run 2 3/3 3/3 3/3 3/3
Run 3 3/3 3/3 3/3 3/3
Accuracy 100% 100% 100% 100%
lcteric
3/4 I Baseline I Lite I Moderate'
Gross
Expected 3/4 3/4 3/4 3/4
Run 1 3/4 3/4 3/4 3/4
Run 2 3/4 3/4 3/4 3/4
Run 3 3/4 3/4 3/4 3/4
Accuracy 100% 100% 100% 100%
lcteric
4/4 I Baseline I Lite I Moderate'
Gross
Expected 4/4 4/4 4/4 4/4
Run 1 4/4 4/4 4/4 4/4
Run 2 4/4 4/4 4/4 4/4
Run 3 4/4 4/4 4/4 4/4
Accuracy 100% 100% 100% 100%
1001321 Ion Suppression: Ten patient samples were extracted. The ten samples
were injected
through the analytical column while the digested peptide mix of ApoE was
infused post-
column. If the total ion chromatogram (TIC) for ApoE showed a decrease of >15%
of signal
intensity when the internal standard for ApoE eluted, then ion suppression
would be
determined to be present in the assay. The TIC of the digested peptides ApoE
showed no
suppression in the gradient when the analyte is eluting. The TIC signal
intensity is a flat line
and shows <15% difference in signal intensity which is within the acceptable
parameters of
the assay.
1001331 Quantitative analysis of Total ApoE: The CSF Apolipoprotein E (ApoE)
by LC-
MS/MS assay measures total levels of ApoE in CSF. In order to measure total
ApoE, a tryptic
protein digestion is performed and a unique peptide to all three isoforms
(ApoE2, ApoE3, and
ApoE4) is used as surrogate to measure the total ApoE protein concentration.
CSF ApoE
samples are analyzed using tandem mass spectrometry with a Thermo Aria
Cohesive TLX-4
36
CA 03071626 2020-01-30
WO 2019/028080 PCT/US2018/044703
high flow LC coupled with a Thermo Fisher Quantiva Triple Quadrupole mass
spectrometer.
The data is monitored in multiple reaction monitoring (MRM) and analyzed using
Thermo
Fisher LC Quant data analysis software. The following ions were measured:
Compound
Precursor (m/z) Product (m/z) Collision Energy (V) RF Lens (V)
Total ApoE: LGPLVEQGR 485.06 489.51 18 55
Total ApoE: LGPLVEQGR 485.06 588.64 18 55
Total ApoE IS: LQAEAFQAR(13C, SN 522.54 602.6 18 55
Total ApoE IS: LQAEAFQAR 1.3C, ) 522.54 731.71 18
55
[00134] Limit of detection (LOD) for CSF ApoE: 0.33 1.tg/mL. The limit of
quantitation for
CSF ApoE is determined to be 1.0 ug/mL. LOB for CSF ApoE: 0.3 ug/mL.
[00135] The contents of the articles, patents, and patent applications, and
all other documents
and electronically available information mentioned or cited herein, are hereby
incorporated
by reference in their entirety to the same extent as if each individual
publication was
specifically and individually indicated to be incorporated by reference.
Applicants reserve
the right to physically incorporate into this application any and all
materials and information
from any such articles, patents, patent applications, or other physical and
electronic
documents.
[00136] The methods illustratively described herein may suitably be practiced
in the absence
of any element or elements, limitation or limitations, not specifically
disclosed herein. Thus,
for example, the terms "comprising", "including," containing", etc. shall be
read expansively
and without limitation. Additionally, the terms and expressions employed
herein have been
used as terms of description and not of limitation, and there is no intention
in the use of such
terms and expressions of excluding any equivalents of the features shown and
described or
portions thereof. It is recognized that various modifications are possible
within the scope of
the invention claimed. Thus, it should be understood that although the present
invention has
been specifically disclosed by preferred embodiments and optional features,
modification and
variation of the invention embodied therein herein disclosed may be resorted
to by those
skilled in the art, and that such modifications and variations are considered
to be within the
scope of this invention.
[00137] The invention has been described broadly and generically herein. Each
of the
narrower species and subgeneric groupings falling within the generic
disclosure also form
part of the methods. This includes the generic description of the methods with
a proviso or
37
CA 03071626 2020-01-30
WO 2019/028080 PCT/US2018/044703
negative limitation removing any subject matter from the genus, regardless of
whether or not
the excised material is specifically recited herein.
[00138] Other embodiments are within the following claims. In addition, where
features or
aspects of the methods are described in terms of Markush groups, those skilled
in the art will
recognize that the invention is also thereby described in terms of any
individual member or
subgroup of members of the Markush group.
38