Note: Descriptions are shown in the official language in which they were submitted.
CA 03103661 2020-12-11
WO 2019/217552
PCT/US2019/031314
PARTICLES FOR SPATIOTEMPORAL RELEASE OF AGENTS
CROSS REFERENCE TO RELATED APPLICATIONS
This application claims benefit of U.S. Provisional Application No.
62/669,242, filed May 9, 2018, hereby incorporated herein by reference in its
entirety.
FIELD OF THE INVENTION
The invention is generally directed to nanoscale particles containing
agents and providing spatial and/or temporal release of the agents, especially
for optimal induction of tolerance.
BACKGROUND OF THE INVENTION
Controlled drug delivery technology represents one of the most
rapidly advancing areas of science in which chemists and chemical engineers
are contributing to human health care. Such delivery systems offer numerous
advantages compared to conventional dosage forms including improved
efficacy, reduced toxicity, and improved patient compliance and
convenience. Such systems often use synthetic polymers as carriers for the
drugs. By so doing, treatments that would not otherwise be possible are now
in conventional use.
All controlled release systems aim to improve the effectiveness of
drug therapy. This improvement can take the form of increasing therapeutic
activity compared to the intensity of side effects, reducing the number of
drug administrations required during treatment, or eliminating the need for
specialized drug administration (e.g., repeated injections). Two types of
control over drug release can be achieved, temporal and distribution control.
Bulk- and surface-eroding polymeric devices can serve as
programmable biomolecule delivery systems to generate pulsatile release of
one protein or sequential release of multiple biomolecules. Effective multi-
pulse drug delivery system has been demonstrated using materials based on
resorbable polyesters, polyanhydride-based laminates and crosslinked hydro
gels. Microspheres have been developed for spatiotemporal bone
morphogenic protein 2 (BMP2) release, which use macrophages to improve
1
CA 03103661 2020-12-11
WO 2019/217552
PCT/US2019/031314
microsphere degradation and BMP2 release (Annamalai et al, Biomaterials.
161:216-227 (2018)).
Spatial control of drugs is typically achieved through the selection of
the particle composition, the type, location and amount of loading, targeting
and masking of delivery. Temporal control of release is typically obtained
through many of the same mechanisms, including use of biodegradable
polymers, inclusion of excipients, control of porosity, and exposure to
stimuli such as pH, enzymes and external stimuli such as light or ultrasound.
There are few options to control the spatiotemporal release of agents,
such as drugs, immunogenic agents, and immunomodulatory agents. There
remains a need for controlled drug delivery systems tuned to release agents
at times and locations at or within cells best suited to improve treatment
efficacy.
Therefore, it is the object of the present invention to provide particles
with spatial and/or temporal release of agents maximizing treatment efficacy
in a subject.
It is another object of the present invention to provide compositions
containing particles with spatial and/or temporal release of agents to
maximize treatment efficacy in a subject.
It is yet another object of the present invention to provide methods of
making and using the particles with precise spatial and/or temporal release of
agents.
SUMMARY OF THE INVENTION
It has been discovered that it is possible to enhance the induction of
tolerance to an antigen, such as a food, insect, drug or self-antigen, by
exposing the targeted dendritic cells ("DCs") first with immunomodulatory
agent such as rapamycin, then the antigen to which tolerance is to be
induced. Conversely, a vaccine response can be enhanced by exposing the
targeted dendritic cells first to the antigen to which the response is to be
induced, then to an immunostimulatory agent. In both situations, it is
critical
to treat the same cells with both the antigen and the immunomodulatory
agent, within a short time frame, and for a defined duration, to enhance the
2
CA 03103661 2020-12-11
WO 2019/217552
PCT/US2019/031314
response compared to that which is obtained by simultaneous administration
of antigen and immunomodulatory agent, whether administered and released
together in a single particle or by systemic intravenous administration of one
agent, antigen or immunomodulatory agent, in combination with
administration of a particle containing the other agent.
Based on this discovery, which recognizes the need not only to
deliver agent to specific targeted cells ("spatial criticality") as well as
the
timing of the delivery ("temporal criticality"), spatiotemporally tuned
particles (STPs) have been developed to have targeted delivery and distinct
release kinetics for at least two agents, which can enhance treatment in a
subject, especially induction of tolerance or immunostimulation where it is
critical the antigen and immunomodulatory agent be introduced to the same
cell in a critical order and time. Specifically, it is critical to provide to
the
same cell the tolerance inducing agent prior to the antigen, in order to
maximize the response. Conversely, it is critical to provide to the same cell
the antigen prior to the immunostimulant/adjuvant.
These particles are not limited to delivery of antigen and
immunomodulatory agent. Targeting of the particle, which agents are
encapsulated/bound where, within or on the particles, and the kinetics of
release, are determined based on the disease or disorder to be treated
A single STP typically includes a core polymeric particle containing
at least a first agent; a tethering moiety such as avidin-biotin or a covalent
linker attached to the core particle and at least a second agent, which is
encapsulated, dispersed or complexed within a carrier such as a polymer,
dendrimer or dextran/cyclodextrin. The agents may be therapeutic or
prophylactic, optionally also including imaging agents. In preferred
embodiments for inducing tolerance, the agents are an antigen such as a
food, insect, self-, or drug that induces undesirable responses in the
individual and a tolerogenic agent such as rapamycin. In preferred
embodiments for inducing an immune response, the agents are antigen(s) and
an immunostimulatory agent. The STPs may be formulated with a
3
CA 03103661 2020-12-11
WO 2019/217552
PCT/US2019/031314
physiologically acceptable excipient or carrier for administration, typically
by injection.
Generally, the release of the first agent and the release of the second
agent, are complete within a time period between about minutes and weeks.
In some aspects, the release of the first agent and the release of the second
agent are complete within a time period of a few minutes, a few hours, a day,
a few days, a week, two weeks, a month, two months or three months.
Methods of making the STPs have also been developed. Typically,
the core particle of STP is a polymeric particle with a natural or a synthetic
polymer, preferably biodegradable, such as a polyhydroxy acid like
polylactic acid, polyglycolic acid, or copolymer thereof. Typically, the STP
has a tethering moiety such as avidin-biotin or covalent linkage, which may
include an extender, which is cleaved or dissociates at the site of delivery,
for example, by enzymes present at the site of delivery. Generally, the STPs
have an average particle size between 10 nm and 1000 nm, more preferably
between 60 and 500 nm, more preferably between 60 and 400 nm for
delivery to dendritic cells. The STPs may be administered directly or in a
composition, to treat a disease, such as cancer, modulate epigenetic
transcription, modulate an immune response, or deliver other agents to the
subject.
An STP for immune modulation typically includes the core particle
with a polymer and an antigen or an immunomodulator; and a tethered
particle with an immunomodulator or an antigen. Typically, STPs for
inducing immune tolerance to an antigen in a subject include STPs with the
core particles containing an antigen and the tethered particles containing an
immunomodulator. Typically, particles for inducing immune stimulation to
an antigen in a subject include particles with the core particle containing an
immunomodulator and the tethered particle containing an antigen. The
antigen may be a B-cell antigen and/or a T cell antigen. The
immunomodulator may be an immunosuppressant or an immunostimulant.
STP is a nanoparticle platform that can be used for application in
many diseases, especially in cancer and autoimmune diseases. In cancer,
4
CA 03103661 2020-12-11
WO 2019/217552
PCT/US2019/031314
combinatory delivery can be enhanced using STP. For example, delivering
IL-2 (an immunostimulatory cytokine that stimulates growth, activation, and
function of immune cells such as tumor infiltrating lymphocytes (TILs)) and
checkpoint inhibitors, one would want to first mitigate the
immunosuppressive tumor microenvironment and Tregs by delivering
checkpoint inhibitors first, and then IL-2 so that IL-2s can be more
effectively delivered to TILs rather than to the immunosuppressive Tregs. To
do so requires the right spatiotemporal conditions (checkpoint inhibitors
first,
then IL-2) and to the same spatial location (same cells and environment).
Given that STPs are designed to deliver multiple agents at a different rate to
the same space, STPs can be very potent in cancer immunotherapy. An STP
for reducing one or more symptoms of a disease such as cancer, may include
a particle with the core particle containing a cytokine for stimulating an
immune response, and the tethered particle containing an inhibitor, such as a
checkpoint inhibitor (such as inhibitors of PD-1/PD-L1 and CTLA-4/B7-
1/B7-2, including atezolizumab, avelumab, durvalumab, pembrolizumab, or
nivolumab), anti-neoplastic agents (such as doxorubicin, or paclitaxel),
and/or cancer antigens.
An STP particle for modulating epigenetic transcription may include,
in the core particle, proteins that activate the transcription factors, and
demethylating transferases, such as Aza-5-cytidine, in the tethered particle.
The STP may maximize disease treatment efficacy by providing
transcription factors, which can properly bind to the DNA sites of interest at
maximal efficiency. With these STPs, the aza-5-cytidine and activating
proteins are delivered in the most effective spatiotemporal manner.
Typically, the compositions are used to deliver to specific cells the
first agent and the second agent at an amount and timing of release effective
to treat a disease or reduce one or more symptoms of a disease. When the
composition is formulated for inducing immune tolerance to an antigen, the
STPs may be designed to release into the targeted cells an effective amount
of the immunomodulator first (first release), and, later, the effective amount
of the antigen (second release), to tolerize the immune system to the antigen.
5
CA 03103661 2020-12-11
WO 2019/217552
PCT/US2019/031314
BRIEF DESCRIPTION OF THE DRAWINGS
Figures 1A and 1B are graphs showing relative expression (Mean
Fluorescent Intensity (MFI) Relative to Untreated BMDCs) of PD-L1,
CD80, CD86, and MHCII in bone marrow-derived dendritic cells (BMDCs)
treated with Rapamycin (RAPA, for 72 hours or 24 hours, Figure 1A),
Ovalbumin (OVA, for 72 hours or 24 hours, Figure 1B). Isolated and
cultured BMDCs were treated with either rapamycin (100 ng/ml) or whole
OVA protein (10 pg/ml) for either 72 hours or 24 hours. Cells were then
harvested and surface markers of DCs were analyzed by FACS. Graphs show
the relative MFI of BMDC surface markers, normalized to MFI of untreated
BMDCs. Untreated BMDCs or cells treated with Blank Nanoparticles show
no change in the surface expression of PD-L1, CD80, CD86, and MHCII.
(Figure 1E).BMDC5 have been treated with either PBS or blank PLGA
nanoparticles (100 ug/m1). Three days later, BMDCs were harvested and DC
surface markers were analyzed by flow cytometry (N=3).*** p < 0.01
Figure 1C is a diagram showing the experimental timeline for early
(E) and late (L) treatments of BMDCs with either OVA, or RAPA, or Both
OVA and RAPA. BMDCs were either first treated with rapamycin then
OVA 48 hours after (RAPAE/OVAL), OVA then RAPA 48 hours later
(RAPAL/OVAE), RAPA and OVA for 72 hours (RAPAE/OVAE), or RAPA
and OVA for 24 hours (RAPAL/OVAL). BMDCs were harvested 24 hours
later and analyzed by FACS. Figure 1D is a diagram showing relative
expression (MFI Relative to Untreated BMDCs) of PD-L1, CD80, CD86,
and MHCII in BMDCs treated with conditions presented in Figure 1C.
Results are representative of two or more experiments.
Figures 2A and 2B are graphs showing the temporal effect of RAPA
or OVA on relative expression (MFI Relative to Blank NP-treated BMDCs)
of PD-L1, CD80, CD86, and MHCII in BMDCs treated with RAPA
nanoparticles (Figure 2A) or OVA nanoparticles (Figure 2B) (100 pg/ml of
particles) for either 72 hrs or 24 hrs. *** p <0.0i, **** p < 0.001.
Figure 3A is a bar graph showing relative expression (MFI Relative
to Blank NP BMDCs) of PD-L1, CD80, CD86, and MHCII in BMDCs when
6
CA 03103661 2020-12-11
WO 2019/217552
PCT/US2019/031314
the cells were treated with PLGA NPs at different time points: either first
treated with rapamycin then OVA 48 hours after (RAPAE/OVAL), OVA then
RAPA 48 hours later (RAPAL/OVAE), RAPA and OVA for 72 hours
(RAPAE/OVAE), or RAPA and OVA for 24 hours (RAPAL/OVAL). Figure
3B is a bar graph showing the change in tolerogenic DCs (fold increase
relative to untreated) with the different treatments. DCs treated with
nanoparticles at different timepoints were analyzed and gated by the
expression levels of their surface markers. Tolerogenic DCs were defined as
CD11c+MHCP0MHCIP0PDL1h'CD80-CD86- DCs. Figures 3C and 3D are
bar graphs showing the amount of IL-10 (pg/ml, Figure 3C) and TGF-r3
(pg/ml, Figure 3D) secreted by the DCs treated with nanoparticles at
different timepoints, as described for Figure 3A. Supernatants from DCs
treated with nanoparticles (untreated is the treatment with Blank NPs in
Figure 3D), at different timepoints were collected and the level of IL-10 and
TGF-r3 were measured by ELISA. Results are representative from two
independent experiments. LPS was used as a positive control.
Figure 4A is a bar graph showing the change in percent Tregs of CD4
T cells after nanoparticle-pulsed DCs were isolated, washed in PBS, and co-
cultured with naïve CD4 OT-II T cells at a 1:5 ratio for 72 hours. After 72
hours of co-culture, cells were collected and analyzed by FACS. The FACS
data were obtained from live, CD3+CD4+ cells. Figure 4B is a bar graph
showing proliferation (% CFSEl Tregs) of induced Tregs by nanoparticle-
pulsed DCs as analyzed by CFSE dilution. The FACS data were obtained
from live, CD3+CD4+CD25+Foxp3+ cells. Figure 4C is a line graph
showing percent suppression (% Suppression) of proliferation in CFSE-
stained OT-II T cells co-cultured with CD25+ T cells compared to control
(No CD25 T cells). DCs pulsed with RAPA and OVA nanoparticles at
different timepoints or just OVA for 72 hours (OVAE) were co-cultured with
non-CFSE stained naive CD4 OT-II T cells for 72hrs. CD25+ Tregs were
then sorted and added at a known ratio to splenic DCs pulsed with 0VA323_
339 peptide and co-cultured with CFSE-stained OT-II T cells at a 1:5 ratio.
CD25+ T cell-mediated suppression was measured by the proliferation
7
CA 03103661 2020-12-11
WO 2019/217552
PCT/US2019/031314
decrease of CFSE-stained OT-II T cells compared to control (No CD25 T
cells). Proliferation suppression of CFSE-stained T cells at a 1:1 ratio of
CD25+ Tregs to CFSE-stained OT-II T cells is shown.
Figures 5A and 5B are bar graphs showing relative expression (MFI
Relative to Vehicle) of PD-Li in F4/80+ macrophages (Figure 5A), or in
CD11c+CD11b+ DCs (Figure 5B) obtained from spleens of mice treated
with NPs containing either rapamycin then OVA 48 hours after
(RAPAE/OVAL), OVA then RAPA 48 hours later (RAPAL/OVAE), RAPA
and OVA for 72 hours (RAPAE/OVAE), or RAPA and OVA for 24 hours
(RAPAL/OVAL). Mice were injected with nanoparticles (i.p.) (2mg/mouse)
at different timepoints (E=72 hours prior to harvest; L=24 hours prior to
harvest). Mice were sacrificed and collected splenocytes were analyzed by
FACS. PD-Li expression on macrophages (CD11b+F4/80+) or CD11b+
DCs (CD11c+CD11b+) is shown, (N=4).
Figures 6A-6C are diagrams showing the different effector outcomes
based on the temporal delivery of an antigen and rapamycin to the same
dendritic cell (DC). A model of how temporal control of release induces
tolerance is shown. In Figure 6A, antigen and rapamycin are delivered to the
same immature DC at the same time (RAPAE/OVAE or RAPAL/OVAL),
resulting in the formation of semi-mature DC and effector T cells. When
rapamycin and antigen are delivered to DCs at the same time, there is slight
production of IL-10 and TGF-0. Effector T cells and Tregs are both
generated as a result of presentation of antigen to antigen-specific T cells.
In
Figure 6B, antigen is delivered prior to rapamycin (RAPAL/OVAE) to the
same DC cell, resulting in the formation of semi-mature DC and effector T
cells. When antigen is delivered earlier than rapamycin to DCs, there is
slight
production of IL-10 and TGF-0. Effector T cells and Tregs are both
generated as a result of presentation of antigen to antigen-specific T cells.
In
Figure 6C, rapamycin is delivered prior to the delivery of the antigen
(RAPAE/OVAL) to the same DC, resulting in a tolerogenic DC and an
expansion or de novo production of regulatory T cells. When rapamycin is
delivered prior to antigen to DCs, PD-L1+ tolerogenic DCs are generated and
8
CA 03103661 2020-12-11
WO 2019/217552
PCT/US2019/031314
there is a higher production of IL-10 and TGF-0. In this scenario, there is a
higher production of Tregs and a greater tolerance effect. Figures 6A-6C
demonstrate one of the temporal aspect of directing the immune response
with STPs.
Figures 7A-7E are graphs showing the differences in regulatory T
cell expansion (Figure 7A), IL-2 secretion (Figure 7B), or T cell division
(Figures 7C, 7D, and 7E) when DC and T cells in co-culture are incubated
with a mix of nanoparticles (NP) containing either antigen ovalbumin (OVA)
or rapamycin (RAPA) (Mix), or with NP containing both OVA and RAPA in
the same NP (Co). Figure 7A shows percent expansion of
CD4+CD25+FoxP3+ regulatory T cells in the presence of soluble
OVA+RAPA in solution, or Mix, or Co, over incubation time (h). Figure 7B
is a graph showing secretion of mouse IL-2 (mIL-2) by CD4 OT-II T cells
over time (h) when the cells are incubated with OVA NP, Mix, or Co.
Figures 7C and 7D show the cell division plots for CD4 OT-II T cells
incubated with Mix or Co over incubation time (h), and Figure 7E is a graph
of the percent divided (% Divided) CD4 OT-II T cells from Figures 7C and
7D. Figures 7A-7E demonstrate one of the spatial aspects of directing the
immune response with STP.
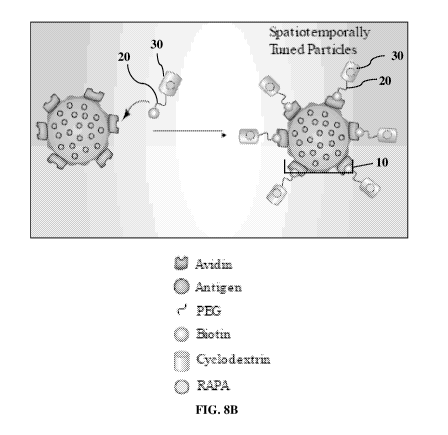
Figures 8A and 8B are diagrams showing the steps in forming the
tethering moiety and the tethered particle of STP (Figure 8A) and the
structure of STP with the core particle 10, the tethering moiety 20, and the
tethered particles 30 (Figure 8B). Figures 8C and 8D are graphs showing the
percent (%) Total Release of Rapamycin (Figure 8C) and Ovalbumin (Figure
8D) from PLGA NP containing the antigen OVA and RAPA (1), or STP
containing OVA in the core particle and RAPA in the tethered particle (2).
Particles were incubated in PBS at 37 C, and supernatant was collected to
measure the level of OVA and RAPA at each timepoint. (N=3; p-values
calculated by student t-test for each timepoint). Figures 8E and 8F are graphs
showing the percent (%) cumulative rapamycin release (Figure 8E) or
percent (%) cumulative OVA release (Figure 8F) over time (days) from co-
encapsulating particles (Co NP) or OVA or RAPA particles. The particles
9
CA 03103661 2020-12-11
WO 2019/217552
PCT/US2019/031314
were incubated in PBS at 37 C, and supernatant was collected to measure the
level of RAPA (top) and OVA (bottom) at each timepoint (N=3; p-values
calculated by student t-test for each timepoint).
Figures 9A and 9B are graphs showing percent IFN-gamma
producing (% IFN-g+) CD4+ T cells in vitro when the cells are incubated
with Blank NP (PLGA NP only), OVA NP (PLGA NP containing OVA),
OVA/RAPA NP (PLGA NP containing OVA and RAPA in the same NP), or
STP (containing OVA in the core particle and RAPA in the tethered particle)
alone (Figure 9A), or in the presence of PLGA NP containing TGF-beta and
IL-2 in the same NP (TI) (Figure 9B). Splenocytes from OT-II mice were
collected and treated with particles for 3 days. (N=3). Figure 9C is a graph
showing percent Foxp3 and CD25 expressing cells (gated on CD4 T cells).
OT-II splenocytes were harvested and treated with particles, in addition to
TGFb (10 ng/ml) and IL-2 (5,000 IU/ml) for 3 days (N=3; p-values were
calculated by student t-test). Figure 9D is a graph showing the percentage of
Valpha2 and Vbeta5 TCR expressing cells (gated on CD4+ Tregs). Valpha2
and Vbeta5 TCR positive cells are TCR-specific to OVA, showing that
proportion of antigen-specific Tregs has not changed by STP and that Treg
expansion is not skewed towards polyclonal Tregs.
Figure 10A is a bar graph showing percent (%) DiR positive cells ¨
cellular distribution of splenocytes that take up DiR+ nanoparticles in vivo.
DiR+ nanoparticles were injected, and splenocytes were harvested one day
after and percentages of cell subsets uptaking DiR nanoparticles are obtained
by FACS (N=3). Figure 10B is a phylogenic tree denoting cell population
lineage of each clusters, demonstrating that the clusters can be more loosely
grouped according to their transcriptome.
Figure 11A is a diagram showing the experimental setup used to
obtain the data in Figure 11B. Mice were injected daily with nanoparticles
for four days. Treatment was with blank NP (PLGA NP only), OVA NP
(PLGA NP containing OVA), OVA/RAPA NP (PLGA NP containing OVA
and RAPA in the same NP), or STP (containing OVA in the core particle and
RAPA in the tethered particle) Splenocytes were harvested on day 7 and
CA 03103661 2020-12-11
WO 2019/217552
PCT/US2019/031314
treated with mitomycin C (10 ug/m1). They were then co-cultured with
purified CD4 T cells from OT-II mice for three days in the presence of TI
NPs (N=4), after which they were analyzed by flow cytometry for Foxp3
expression.
Figure 12A is a diagram showing the experimental setup used to
obtain the data in Figures 12B-12G. Figures 12B-12G are graphs showing
the systemic expansion of Tregs in response to STPs in steady state in the
spleen (Figures 12B-12D) and in the mesenteric lymph nodes (mLN)
(Figures 12E-12G). The change in total Tregs as a change in percent Foxp3+
cells in the spleen (Figure 12B) and mLN (Figure 12E), the change in
induced Tregs (iTregs) as a change in percent Foxp3+Helios- cells in the
spleen (Figure 12C) and mLN (Figure 12F), and the change in natural Tregs
(nTregs) as a change in percent Foxp3+Helios+ cells in the spleen (Figure
12D) and mLN (Figure 12G), with the different treatments are shown. No
change in other T cell subsets and innate cells, specifically in neutrophils,
natural killer (NK) cells, GATA3+ cells, and RORgt+ cells in the spleen or
mLN was detected. Figure 12H is a bar graph showing percent (%) CD71+
cells, gated on Lin:- (TCRb-, B220-) (N>3; p-values were determined by
student t-test). Figure 121 is a bar graph showing percent (%) CD71+ cells,
gated on T cells (N>4; p-values were determined by student t-test). For
Figures 12H and 121, the OT-II mice were injected with particles, and
splenocytes were harvested and analyzed by FACS.
Figure 13A is a diagram showing the particle injection scheme for
STP-induced tolerance in vivo, and representative FACS plots for Helios and
Foxp3 expressing cells (gated on CD4 T cells) were analyzed and the results
are shown in Figures 13B-13G by percentage and in Figure 13H by counts of
(N>3; data was pooled from three or more independent experiments).
Figure 14A is a diagram showing the Foxp3 3' UTR locus
arrangement of genetically modified mice (details provided in Rubstov et al.,
Science, 329(5999):1667-1671 (2010)) used in the experimental setup shown
in Figure 14B. A mouse with a triple-transgene cassette (EGFP, CRE, and
Ert2) harbored in Foxp3 locus is crossed with another mouse with stop codon
11
CA 03103661 2020-12-11
WO 2019/217552
PCT/US2019/031314
flanked by loxP sites upstream of YFP in ROSA26 locus. Progenies are
crossed to F2 generation and genotyped homozygous mutants are selected.
Upon tamoxifen administration, Tregs (GFP+) express YFP, marking them
as pre-existing nTregs in the spleen. Figure 14B shows the experimental
setup for determining the source of the systemic expansion of nTregs.
Figures 14C, 14D, and 14E are graphs showing the change in Treg
population with the different treatments shown in Figure 14B. Figure 14C
shows the percent change in YFP+ cells from the CD4+ GFP+ T cells when
the animals (genotype shown in Figure 14A) received control or STP with
TGF-beta/IL-2/Butyrate in the same NP (as shown in Figure 14B), p =
0.0248. Figure 14D shows the change in the number (#) of YFP+ GFP+
CD4+ T cells when the animals (genotype shown in Figure 14A) received
control or STP with TGF-beta/IL-2/Butyrate in the same NP (as shown in
Figure 14B), p = 0.1365. Figure 14E shows the change in the percent (%) of
YFP+ GFP+ CD4+ T cells when the animals (genotype shown in Figure
14A) received control or STP with TGF-beta/IL-2/Butyrate in the same NP
(as shown in Figure 14B), p = 0.0914. N>4; p-value was calculated by
student t-test.
Figure 15A is a diagram showing the experimental setup used to
obtain the data in Figures 15B and 15C. Figure 15B is a graph showing the
change in EAE Disease Score over time (days) in mice prophylactically
treated with Mock injection, PLGA NPs containing RAPA, MOG35_55
(MOG), MOG35_55 and RAPA (MOG/RAPA), or STP (containing MOG35_55
in the core particle and RAPA in the tethered particle, STP), at 2 mg. Figure
15C is a graph showing the change in mass (g) over time (days) for mice that
prophylactically received Mock injection, PLGA NPs containing RAPA,
MOG35_55 (MOG), MOG35_55 and RAPA (MOG/RAPA), or STP (containing
MOG35_55 in the core particle and RAPA in the tethered particle, STP), at 2
mg. Error bars represent standard deviation between each group (N>5)
(statistical significance determined by student t-test). Particles were
injected
one week before induction of disease. Mice were monitored and scored daily
12
CA 03103661 2020-12-11
WO 2019/217552
PCT/US2019/031314
until 28 days post disease induction. (N>8; p-values were determined by
student t-test on day 28).
Figure 16A is a diagram showing the experimental setup used to
obtain the data in Figures 16B and 16C. Figure 16B is a graph showing the
change in EAE Disease Score over time (days) in mice therapeutically
treated with Mock injection, PLGA NPs containing RAPA, MOG35_55
(MOG), MOG35-55 and RAPA (MOG/RAPA), or STP (containing MOG35-55
in the core particle and RAPA in the tethered particle, STP), at 2 mg. EAE
disease score of mice treated with higher dose of particles (2 mg) at the peak
of disease (day 13). Statistical significance is determined by comparison of
each group's corresponding day to Mock by student t-test. (N=5). Figure
16C is a graph showing the change in mass (g) over time (days) for mice that
therapeutically received Mock injection, PLGA NPs containing RAPA,
MOG35_55 and RAPA (MOG/RAPA, or STP (containing MOG35_55 in the
core particle and RAPA in the tethered particle, STP), at 2 mg.
Figures 17A-17F are graphs showing the change in CD4+ T cell
populations (Figures 17A-17C), pathogenic cytokine producing CD4+T cells
(Figures 17D and 17E), and neutrophil cell populations (Figure 17F) in the
CNS of mice prophylactically treated with i.p. injected MOG35-55/RAPA NP
when compared to those in the CNS of control mice treated with mock i.p.
injection. The data show that MOG35_55/RAPA NP expand Tregs (Figures
17B and 17C), while the overall CD4+ T cell population in the CNS is
reduced (Figure 17A), suppress pathogenic cytokine producing cells (Figures
17D and 17E), and neutrophil trafficking (Figure 17F) when compared to
those in the CNS of control mice.
Figures 18A-18D are graphs showing percent population of cells
from spleen (Figures 18A and 18B) and mesenteric lymph nodes (Figures
18C and 18D) that are GATA3+ and RORgt+ (gated from CD4 T cells)
(statistical significance was determined by student t-test). OT-II mice were
injected with particles for four times every two days, and cells were
harvested on day 14 after the initial injection (Figure 13A).
13
CA 03103661 2020-12-11
WO 2019/217552
PCT/US2019/031314
Figures 19A-19D are graphs showing percent population of
neutrophils (Ly6G+) and NK cells (NK1.1+) from spleen (Figures 19A and
19B) and mesenteric lymph nodes (Figures 19C and 19D) (gated from Lin:-)
(statistical significance was determined by student t-test). Cells were
harvested as described for Figures 18A-18D.
Figure 20A is a diagram showing the scheme of OVA NP or STP
injection in adoptively transferred CD4 T cells in RAG14- mice. Figure 20B
is a bar graph showing the analysis of representative FACS plots of
Foxp3+Helios+ or Foxp3+Helios- splenocytes (gated from CD45.2+ CD4+
T cells). Percentage of Foxp3+ cells is shown (N=4; p-values were
determined by student t-test).
Figure 21 is a graph showing analysis of FACS data on a population
of cells from the lamina propia of large intestine that are Foxp3+Helios+ or
Foxp3+Helios- (gated from CD4 T cells) (statistical significance was
determined by student t-test). OT-II mice injected with particles as described
for Figures 18A-18D were sacrificed and harvested cells from the lamina
propia were analyzed by FACS. Percentage of Foxp3+ cells is shown.
Figure 22A is a graph showing analysis of FACS plots of
Foxp3+Helios+ or Foxp3+Helios- splenocytes from 2D2 mice (MOG35_55
TCR specific transgenic mice), gated on CD4 T cells (p-values were
determined by student t-test). Percentage of Foxp3+ cells is shown. Figures
22B-22D are graphs showing CD44+ CD4 T cells (Figure 22B), NK1.1+
cells (Figure 22C), and RORgt+ CD4 T cells (Figure 22D) from splenocytes
of 2D2 mice after injection.
Figures 23A-23F are graphs showing the counts of CD4+ T cells,
harvested from draining lymph nodes of mice described in Figure 15B.
Draining lymph nodes were harvested and cytokine producing cells were
analyzed by FACS through intracellular cytokine staining.
Figures 24A-24F are graphs showing counts of inflammatory
immune cells and percentages of Tregs from the CNS 14 days post disease
induction. Immune cells from brain and spinal cord were isolated from each
mice, and were analyzed by FACS.
14
CA 03103661 2020-12-11
WO 2019/217552
PCT/US2019/031314
Figures 25A-25F are graphs showing counts of inflammatory
immune cells and percentages of Tregs from the CNS 28 days post disease
induction. Immune cells from brain and spinal cord were isolated from each
mice, and were analyzed by FACS.
Figure 26 is a graph showing EAE disease score of mice with
therapeutic treatment of nanoparticles (200 lig of particles per mouse).
Treatments were: Mock, NPs with MOG, NPs with MOG and RAPA
(MOG/RAPA), and STP. Particles were injected at the peak of disease (day
12) and scores were monitored until day 30. (N>8; p-values were determined
by student t-test on day 28).
Figure 27 is a bar graph representing number of cells found in each
sample for three groups: Naïve (1), OVA/RAPA (2), and STP (3) from the
single-cell RNAseq analysis. Labels 123 are shown for every other cell type,
but the order of groups 123 applies to all the cell types shown.
Figure 28A is a graph showing percentage of Foxp3 expressing cells
(gated on CD4 T cells). OT-II mice, with or without depletion of
macrophages by clodronate liposomes, were injected with STP, and
splenocytes were harvested and analyzed by FACS (N>4, p-values were
determined by student t-test). Figure 28B is a graph showing percentage of
CD206 expressing cells (gated on Lin:-, CD11c-, CD11b+, F4/80+ cells).
Nanoparticles were injected into OT-II mice as described in Figure 13A, and
the percentage of M2 macrophages (CD206+ macrophages) analyzed (N>8,
p-values were determined by student t-test). Figure 28C is a graph showing
the percentage of PD-Li expressing M2 cells from mice as described in
Figure 28B (N>8, p-values were determined by student t-test). Figure 28D is
a bar graph showing PD-Li expression of mice injected with control or PD-
Li neutralizing antibody. Harvested splenocytes from mice treated with
control or PD-Li antibody and PD-Li expression was analyzed by FACS.
(N=5; p-value was determined by student t-test). Figures 28E and 28F are
graphs showing analysis of representative FACS plots of OT-II mice with or
without depletion of PD-Li. Splenocytes or cells from mesenteric lymph
CA 03103661 2020-12-11
WO 2019/217552
PCT/US2019/031314
node were harvested after treatment of STP with or without PD-Li
neutralizing antibody (N>4, p-values were determined by student t-test).
Figure 29 is a bar graph showing the ratio of 33D1+ DCs to XCR1+
DCs (N=3; p-value was determined by student t-test) from representative
FACS plot showing XCR1 expressing DCs (CD8a+ DCs) and 33D1
expressing DCs (CD11b+ DCs) (gated on Lin:-, CD11c+ MHCII+ cells).
Splenocytes from mice that have been injected with STP (as described in
Figure 13A) were harvested and analyzed by FACS.
DETAILED DESCRIPTION OF THE INVENTION
I. Definitions
As used herein, the term "particle" generally refers to STP, which is a
nanoscale particle, i.e., nanoparticle, having overall dimensions below one
micrometer. The particle is typically a combination of a plurality of tethered
particles tethered to, attached to, or associated with, a single core
particle.
The attachment may be through a tethering moiety.
As used herein, the term "spatial" in the context of release refers to
spatially separated release of one, two, or more agents from the same
particle. Spatially separated release of agents may be a release from two or
more separate regions of a particle. Spatially separated release of agents may
be a release at two or more anatomical regions in a subject. Spatially
separated release of agents may be a release from two or more separate
regions of a particle and a release at two or more anatomical regions in a
subject from the same particle.
As used herein, the term "temporal" or "timing" in the context of
release refers to a timing of release of one, two, or more agents from the
same particle. The timing of release of the one, two, or more agents from the
same particle may overlap with each other, may not overlap with each other,
or may be separated from each other with a time gap, the time gap lasting
seconds, minutes, hours, days, or weeks.
As used herein, the terms "biocompatible" and "biologically
compatible" generally refer to materials that are, along with any metabolites
or degradation products thereof, generally non-toxic to the recipient, and do
16
CA 03103661 2020-12-11
WO 2019/217552
PCT/US2019/031314
not cause any significant adverse effects to the recipient. Generally
speaking,
biocompatible materials are materials which do not elicit a significant
inflammatory or immune response when administered to a patient.
As used herein, the term "biodegradable Polymer" generally refers to
a polymer that will degrade or erode by enzymatic action and/or hydrolysis
under physiologic conditions to smaller units or chemical species that are
capable of being metabolized, eliminated, or excreted by the subject. The
degradation time is a function of polymer composition, morphology, such as
porosity, particle dimensions, and environment.
As used herein, the term "amphiphilic" refers to a property where a
molecule has both a hydrophilic portion and a hydrophobic portion. Often,
an amphiphilic compound has a hydrophilic portion covalently attached to a
hydrophobic portion. In some forms, the hydrophilic portion is soluble in
water, while the hydrophobic portion is insoluble in water. In addition, the
hydrophilic and hydrophobic portions may have either a formal positive
charge, or a formal negative charge. However, overall they will be either
hydrophilic or hydrophobic. An amphiphilic compound can be an
amphiphilic polymer, such that the hydrophilic portion can be a hydrophilic
polymer, and the hydrophobic portion can be a hydrophobic polymer.
As used herein, the term "hydrophilic" refers to the property of
having affinity for water. For example, hydrophilic polymers (or hydrophilic
polymer segments) are polymers (or polymer segments) that are primarily
soluble in aqueous solutions and/or have a tendency to absorb water. In
general, the more hydrophilic a polymer is, the more that polymer tends to
dissolve in, mix with, or be wetted by water. Hydrophilicity can be
quantified by measuring its partition coefficient between water (or a buffered
aqueous solution) and a water-immiscible organic solvent, such as octanol,
methylene chloride, or methyl tert-butyl ether. If after equilibration a
greater
concentration of the compound is attained in water than in the organic
solvent, then the compound is considered hydrophilic. For example, if the
organic solvent is octanol, then a negative log P value indicates that the
compound is hydrophilic. "Hydrophilic" may also refer to a material that
17
CA 03103661 2020-12-11
WO 2019/217552
PCT/US2019/031314
when applied to a surface, such as glass, forms a contact angle with water,
which is less than the contact angle of water on a surface of glass without
the
material.
As used herein, the term "hydrophobic" refers to the property of
lacking affinity for or repelling water. For example, the more hydrophobic a
polymer (or polymer segment), the more that polymer (or polymer segment)
tends to not dissolve in, not mix with, or not be wetted by water.
Hydrophobicity can be quantified by measuring its partition coefficient
between water (or a buffered aqueous solution) and a water-immiscible
organic solvent, such as octanol, methylene chloride, or methyl tert-butyl
ether. If after equilibration a greater concentration of the compound is
attained in the organic solvent than in water, the compound is considered
hydrophobic. For example, if the organic solvent is octanol, then a positive
log P value indicates that the compound is hydrophobic. "Hydrophobic" may
also refer to a material that when applied to a surface, such as glass, forms
a
contact angle with water, which is greater than the contact angle of water on
a surface of glass without the material.
Hydrophilicity and hydrophobicity can also be quantitated in relative
terms, such as, but not limited to, a spectrum of
hydrophilicity/hydrophobicity within a group of polymers or polymer
segments. In some forms wherein two or more polymers are being discussed,
the term "hydrophobic polymer" can be defined based on the polymer's
relative hydrophobicity when compared to another, more hydrophilic
polymer.
As used herein, the terms "average particle size" or "mean particle
size," refer to the statistical mean particle size (diameter) of the particles
in a
population of particles. The diameter of an essentially spherical particle may
refer to the physical or hydrodynamic diameter. The diameter of a non-
spherical particle may refer preferentially to the hydrodynamic diameter. As
used herein, the diameter of a non-spherical particle may refer to the largest
linear distance between two points on the surface of the particle. Mean
18
CA 03103661 2020-12-11
WO 2019/217552
PCT/US2019/031314
particle size can be measured using methods known in the art, such as
dynamic light scattering.
As used herein, the term "pharmaceutically acceptable" refers to
compounds, carriers, excipients, compositions, and/or dosage forms which
are, within the scope of sound medical judgment, suitable for use in contact
with the tissues of human beings and animals without excessive toxicity,
irritation, allergic response, or other problem or complication, commensurate
with a reasonable benefit/risk ratio.
As used herein, the terms "encapsulated" and "incorporated" are art-
recognized when used in reference to one or more agents, or other materials,
into a polymeric composition. In certain embodiments, these terms include
incorporating, formulating, or otherwise including such agent into a
composition that allows for release, such as sustained release, of such agent
in the desired application. The terms contemplate any manner by which an
agent or other material is incorporated into a polymeric particle, including
for example: attached to a monomer of such polymer (by covalent, ionic, or
other binding interaction), physical admixture, enveloping the agent in a
coating layer of polymer, and having such monomer be part of the
polymerization to give a polymeric formulation, distributed throughout the
polymeric matrix, appended to the surface of the polymeric matrix (by
covalent or other binding interactions), encapsulated inside the polymeric
matrix, etc. The term "co-incorporation" or "co-encapsulation" refers to the
incorporation of more than one active agent or other material and at least one
other agent or other material in a subject composition.
As used herein, the terms "inhibit" and "reduce" refer to reducing or
decreasing activity, expression, or a symptom. This can be a complete
inhibition or reduction of in activity, expression, or a symptom, or a partial
inhibition or reduction. Inhibition or reduction can be compared to a control
or to a standard level. Inhibition can be 1 to 100%, or any value
therebetween, reduction in activity, expression, or a symptom relative to a
control.
19
CA 03103661 2020-12-11
WO 2019/217552
PCT/US2019/031314
As used herein, the terms "treatment" or "treating" refer to
administering a composition to a subject or a system to treat one or more
symptoms of a disease. The effect of the administration of the composition to
the subject can be, but is not limited to, the cessation of a particular
symptom
of a condition, a reduction or prevention of the symptoms of a condition, a
reduction in the severity of the condition, the complete ablation of the
condition, a stabilization or delay of the development or progression of a
particular event or characteristic, or minimization of the chances that a
particular event or characteristic will occur.
As used herein, the terms "prevent", "preventing", "prevention", and
"prophylactic treatment" refer to the administration of an agent or
composition to a clinically asymptomatic individual who is at risk of
developing, susceptible, or predisposed to a particular adverse condition,
disorder, or disease, and thus relates to the prevention of the occurrence of
symptoms and/or their underlying cause.
As used herein, the term "agent" refers to a physiologically or
pharmacologically active substance that acts locally and/or systemically in
the body. An active agent is a substance that is administered to a patient for
the treatment (e.g., therapeutic agent), prevention (e.g., prophylactic
agent),
nutrition supply (e.g., nutraceutical), or diagnosis (e.g., diagnostic agent)
of a
disease or disorder. The term also encompasses pharmaceutically acceptable,
pharmacologically active derivatives of agents, including, but not limited to,
salts, esters, amides, prodrugs, active metabolites, and analogs.
As used herein, the term "small molecule" generally refers to an
organic molecule that is less than about 2000 g/mol in molecular weight, less
than about 1500 g/mol, less than about 1000 g/mol, less than about 800
g/mol, or less than about 500 g/mol. In some forms, small molecules are non-
polymeric and/or non-oligomeric.
As used herein, the terms "subject," "individual," and "patient" refer
to any individual who is the target of treatment using the disclosed particles
and compositions. The subject can be a vertebrate, for example, a mammal.
Thus, the subject can be a human. The subjects can be symptomatic or
CA 03103661 2020-12-11
WO 2019/217552
PCT/US2019/031314
asymptomatic. The term does not denote a particular age or sex. Thus, adult
and newborn subjects, whether male or female, are intended to be covered.
A subject can include a control subject or a test subject.
As used herein, the term "immunomodulator" refers to an agent that
modulates an immune response to an antigen but is not the antigen or derived
from the antigen. "Modulate", as used herein, refers to inducing, enhancing,
suppressing, tolerizing, directing, or redirecting an immune response.
Immunomodulator may be a therapeutic agent, a prophylactic agent, or a
nutraceutical agent.
As used herein, the terms "effective amount" and "therapeutically
effective amount," are used interchangeably, as applied to the nanoparticles,
therapeutic agents, and pharmaceutical compositions described herein, and
refer to the quantity necessary to render the desired therapeutic result. For
example, an effective amount is a level effective to treat, cure, or alleviate
the symptoms of a disease for which the composition and/or therapeutic
agent, or pharmaceutical composition, is/are being administered. Amounts
effective for the particular therapeutic goal sought will depend upon a
variety
of factors including the disease being treated and its severity and/or stage
of
development/progression; the bioavailability and activity of the specific
compound and/or antineoplastic, or pharmaceutical composition, used; the
route or method of administration and introduction site on the subject.
Recitation of ranges of values herein are merely intended to serve as a
shorthand method of referring individually to each separate value falling
within the range, unless otherwise indicated herein, and each separate value
is incorporated into the specification as if it were individually recited
herein.
Use of the term "about" is intended to describe values either above or
below the stated value in a range of approximately +/- 10%, +/- 5%; +/- 2%;
or +/- 1%.
Particles and Compositions
The spatiotemporally tuned particles (STPs) provide an efficient
platform that can be applied in different settings with modifications to
21
CA 03103661 2020-12-11
WO 2019/217552
PCT/US2019/031314
incorporate different agents, such as therapeutics, antigens, or
immunomodulatory factors as needed.
The development of a single platform that delivers agents at a
different rate could be universally used in any disease treatments. This would
reduce the need to localize the therapeutics for the combined therapies to the
same anatomical location, as well as frequency of administration of the
therapeutics. The efficacy of the treatment may be enhanced because of the
tuning of the STPs' spatiotemporal release profile with the required therapy.
As the Examples show, the technical advantages of the STPs include:
a. realization of the kinetics of delivery in antigen-specific
tolerance induction and maintenance,
b. realization that the spatial localization is important to achieve
effective antigen-specific tolerance,
c. the ability to stagger the release of multiple agents from a
single nanoparticle platform,
d. the ability to deliver a combination of factors to the same cell
(e.g., APC),
e. the ability to tune the temporal and spatial release,
f. the ability to expand the use of STPs to all drugs, biologics,
and macromolecules etc., and
g= mutli-valency: this factor highlights the importance of the
platform. Typically, molecules that are guests in cyclodextrins have a low
guest-host affinity on the order of K¨pM or mM interactions, making it
especially challenging for the drug to stay intact with the platform as it
navigates though bodily fluids. However, because hundreds of cyclodextrins
coat the biodegradable or non-biodegradable particle the affinity of the guest
to its target is significantly increased due to avidity made possible by the
many copies of the loaded cyclodextrin on the surface. Further cyclodextrins
enhance the stability of other cyclodextrins through non-covalent
interactions, making it possible to achieve higher stability of the host on
particles versus individual hosts without particles. Because the affinity is
high, a smaller dose of the drug is required for efficacy, such as a reduction
22
CA 03103661 2020-12-11
WO 2019/217552
PCT/US2019/031314
by a factor of 10 to 1000 in the drug concentration needed to achieve
efficacy compared to the soluble drug.
Preferably, the STPs have one or more agents in the core of the
particle and one or more agents guest-hosted by complexes, such as
cyclodextrin complexes, attached to the surface of the core particles. This
allows the cyclodextrin complex guest to be delivered to the same space or
cell but at a faster rate than the encapsulant in the core, which requires
biodegradation or diffusion to release to the outside environment.
A. Spatiotemporally Tuned Particles
The particles for spatial and/or temporal release of agents include a
core particle having a plurality of one or more agents bound thereto via a
tethering moiety such as avidin-biotin, a covalent linkage or a covalent
linker, where the agents are encapsulated in, dispersed within, bound to, or
complexed within a carrier such as a polymeric particle, dendrimer, ionic
complex such as a dextran or cyclodextrin, or agent such as carbon
nanotubes (collectively referred to herein as "tethered particles"). A
schematic of an exemplary particle is presented in Figure 8B. The
spatiotemporally tuned particles (STP) include a core particle 10, the
tethering moiety 20, and the tethered particles 30 (Figure 8B).
Generally, the particles including tethered agents have an average
diameter between about 10 nm and about 1000 nm, such as between about 50
nm and about 950 nm, between about 100 nm and about 800 nm, between
about 100 nm and about 850 nm, between about 100 nm and about 750 nm,
between about 100 nm and about 700 nm, between about 100 nm and about
650, between about 100 nm and about 600 nm, between about 100 nm and
about 550 nm, between about 100 nm and about 500 nm, between about 100
and about 450 nm, between about 100 nm and about 400 nm, between about
100 nm and about 350 nm, or between about 100 nm and about 300 nm. In
some aspects, the particles have an average diameter between about 100 nm
and about 500 nm, between about 100 and about 450 nm, between about 100
nm and about 400 nm, between about 100 nm and about 350 nm, or between
23
CA 03103661 2020-12-11
WO 2019/217552
PCT/US2019/031314
about 100 nm and about 300 nm, such as about 150 nm, about 200 nm, about
250 nm, about 300 nm, or about 350 nm.
The particle size may be measured with any suitable method.
Suitable methods include dynamic light scattering (DLS), cryogenic-
transmission electron microscopy (cryo-TEM), small angle x-ray scattering
(SAXS), or small angle neutron scattering (SANS).
1. Core Particle
Typically, the core particle is a polymeric particle containing at least
one agent encapsulated and/or dispersed therein. The core particle may also
include crosslinking moieties to link the core particle with the tethering
moiety, or the core particle with the tethered particle. Generally, the core
particle is a sphere, or any other regular or irregular three-dimensional
nanoscale-shaped object with an overall average diameter between about 10
nm and about 900 nm, similar to the size of the particle including the
tethered agent. The diameter may be a hydrodynamic diameter or a physical
diameter.
The average diameter of a plurality of core particles may be between
about 10 nm and about 900 nm, such as between about 100 nm and about
850 nm, between about 100 nm and about 750 nm, between about 100 nm
and about 700 nm, between about 100 nm and about 650 nm, between about
100 nm and about 600 nm, between about 100 nm and about 550 nm,
between about 100 nm and about 500 nm, between about 100 nm and about
450 nm, between about 100 nm and about 400 nm, between about 100 nm
and about 350 nm, or between about 100 nm and about 300 nm. In some
aspects, the particles have an average diameter between about 100 nm and
about 450 nm, between about 100 nm and about 400 nm, between about 100
nm and about 350 nm, or between about 100 nm and about 300 nm, such as
about 100 nm, about 150 nm, about 200 nm, about 250 nm, or about 300 nm.
The size of the core particle may be measured with any suitable
method prior to attachment of the tethering moiety and/or the tethered
particle. Suitable methods include dynamic light scattering (DLS),
24
CA 03103661 2020-12-11
WO 2019/217552
PCT/US2019/031314
cryogenic-transmission electron microscopy (cryo-TEM), small angle x-ray
scattering (SAXS), or small angle neutron scattering (SANS).
a. Polymers
The polymeric matrix of the core particle may be formed from one or
more polymers, copolymers or blends. By varying the composition and
morphology of the polymeric matrix, one can achieve a variety of controlled
release characteristics, permitting the delivery of moderate constant doses of
one or more active agents over prolonged periods of time. Preferably, the
polymeric matrix is biodegradable. The polymeric matrix can be selected to
degrade within a time period between one day and one year, more preferably
between one day and 26 weeks, more preferably between one days and 20
weeks, most preferably between one day and 4 weeks. In some aspects, the
polymeric matrix can be selected to degrade within a time period between
few hours and 5 weeks, more preferably between one day and 3 weeks, more
preferably between one day and 15 days, most preferably between one day
and seven days.
In general, synthetic polymers are preferred, although natural
polymers may be used. Representative polymers include polyhydroxy acids
(poly(lactic acid), poly(glycolic acid), poly(lactic acid-co-glycolic acids)),
polyhydroxyalkanoates such as p01y3-hydroxybutyrate or p01y4-
hydroxybutyrate; polycaprolactones; poly(orthoesters); polyanhydrides;
poly(phosphazenes); poly(lactide-co-caprolactones); poly(glycolide-co-
caprolactones); polycarbonates such as tyrosine polycarbonates; polyamides
(including synthetic and natural polyamides), polyvinyl alcohols,
polyvinylpyrrolidone; poly(alkylene oxides) such as polyethylene glycol
(PEG) and pluronics (polyethylene oxide polypropylene glycol block
copolymers), polyacrylic acids, as well as derivatives, copolymers, and
blends thereof.
As used herein, "derivatives" include polymers having substitutions,
additions of chemical groups and other modifications to the polymeric
backbones described above routinely made by those skilled in the art.
Natural polymers, including proteins such as albumin, collagen, gelatin,
CA 03103661 2020-12-11
WO 2019/217552
PCT/US2019/031314
prolamines, such as zein, and polysaccharides such as alginate and pectin,
may also be incorporated into the polymeric matrix. In certain cases, when
the polymeric matrix contains a natural polymer, the natural polymer is a
biopolymer which degrades by hydrolysis.
In some aspects, the polymeric matrix of the core particle may
contain one or more crosslinkable polymers. The crosslinkable polymers
may contain one or more photo-polymerizable groups, allowing for the
crosslinking of the polymeric matrix following particle formation. Examples
of suitable photo-polymerizable groups include vinyl groups, acrylate
groups, methacrylate groups, and acrylamide groups. Photo-polymerizable
groups, when present, may be incorporated within the backbone of the
crosslinkable polymers, within one or more of the sidechains of the
crosslinkable polymers, at one or more of the ends of the crosslinkable
polymers, or combinations thereof.
The polymeric matrix of the core particle may be formed from
polymers having a variety of molecular weights, so as to form particles
having properties, including drug release rates, effective for specific
applications.
In some embodiments, the polymeric matrix is formed from an
aliphatic polyester or a block copolymer containing one or more aliphatic
polyester segments. Preferably the polyester or polyester segments are
poly(lactic acid) (PLA), poly(glycolic acid) PGA, or poly(lactide-co-
glycolide) (PLGA). The degradation rate of the polyester segments, and
often the corresponding drug release rate, can be varied from days (in the
case of pure PGA) to months (in the case of pure PLA), and may be readily
manipulated by varying the ratio of PLA to PGA in the polyester segments.
In addition, PGA, PLA, and PLGA have been established as safe for use in
humans; these materials have been used in human clinical applications,
including drug delivery system, for more than 30 years.
Examples of preferred natural polymers include proteins such as
albumin, collagen, gelatin and prolamines, for example, zein, and
polysaccharides such as alginate, chitosan, cellulose, carboxymethyl
26
CA 03103661 2020-12-11
WO 2019/217552
PCT/US2019/031314
cellulose (CMC), cellulose derivatives, and polyhydroxyalkanoates, for
example, polyhydroxybutyrate. The in vivo stability of the particles can be
adjusted during the production by using polymers such as poly(lactide-co-
glycolide) copolymerized with polyethylene glycol (PEG). If PEG is exposed
on the external surface, it may increase the time these materials circulate
due
to the hydrophilicity of PEG.
Examples of preferred non-biodegradable polymers include ethylene
vinyl acetate, poly(meth)acrylic acid, polyamides, copolymers and mixtures
thereof. Examples of preferred biodegradable polymers include polyester or
polyester segments poly(lactic acid) (PLA), poly(glycolic acid) PGA, or
poly(lactide-co-glycolide) (PLGA).
2. Tethering Moieties, Covalent Linkages and Linkers
a. First Agent and Second Agent
The core particles and the tethered particle may include one or more
pharmaceutical agents listed above in any combination.
The amount of each agent in the particle may be between 0.00001%
by weight and 50% by weight, between 0.0001% by weight and 50% by
weight, between 0.001% by weight and 50% by weight, or between 0.01%
by weight and 50% by weight of the particle.
Any agent, or any combination of the agents may be included in the
core particle, in the tethered particle, or both in the core particle and in
the
tethered particle.
For example, particles suitable for inducing antigen-specific tolerance
may incorporate one or more immunomodulators, such as one or more
immunosuppressants, in the tethered particle, and one or more antigens, self-
antigens, xenoantigens, allergens, etc., against which an immune tolerance is
desired, in the core particle. In particles for cancer treatment, the
particles
may be for combinatorial delivery of agents (such as checkpoint inhibitors)
and cytokine (such as IL-2) in cancer immunotherapy. The particles may be
used to deliver checkpoint inhibitors first and IL-2 at a later time to the
same
spatial location. The earlier release of checkpoint inhibitors would inhibit
27
CA 03103661 2020-12-11
WO 2019/217552
PCT/US2019/031314
suppressive Tregs in the tumor microenvironment and increase IL-2
availability specifically to tumor-infiltrating lymphocytes (TILs).
3. Linking Moieties
The core particle may include one or more linking moieties for
linking the tethered particle, the tethering moiety, or linking the tethering
moiety attached to the tethered particle to the core particle.
Examples of linking moieties include avidin, neutravidin,
streptavidin, biotin, and any one of the crosslinking molecules described in
Tables 1 and 2.
Suitable crosslinking agents on the tethering moieties are disclosed in
Tables 1 and 2 below. Other suitable crosslinking agents include avidin,
neutravidin, streptavidin, and biotin.
The particles may be functionalized using any suitable chemical
modifications of the additives in the continuous matrix. An example is a
copper-free click chemistry that can be used to functionalize the surface of
the particles to bind any ligand or moiety of interest, including linkers,
peptides, antibodies, and fluorescent or radiolabeled reporter molecules.
In preferred embodiments, particles containing a tethering moiety
and/or a tethered particle, may have linking moieties on the surface to link
the tethering moiety to the core particle, the tethered particle to the core
particle, the tethering moiety to the tethered particle, or the tethering
moiety
and the tethered particle to the core particle. The linking moieties may be
proteins, peptides, or small molecules or short polymers. The linking
moieties may be crosslinking agents. Crosslinking agents are categorized by
their chemical reactivity, spacer length, and materials.
28
CA 03103661 2020-12-11
WO 2019/217552
PCT/US2019/031314
Table 1: Reactive groups of crosslinking agents
Reactivity Class (Reactive Chemical Group of Crosslinking
group) Agent
Carboxyl-to-amine Carbodiimide (e.g. EDC)
Amine NHS ester, Imidoester,
Pentafluorophenyl ester,
Hydroxymethyl phosphine
Sulfhydryl Maleimide, Haloacetyl (Bromo- or
Iodo-) Pyridyldisulfide,
Thiosulfonate, Vinylsulfone
Aldehyde Hydrazide, Alkoxyamine
(i.e. oxidized sugars, carbonyls)
Photoreactive groups Diazine, Aryl Azide
(i.e. nonselective, random
insertion)
Hydroxyl (non-aqueous) Isocyanate
29
CA 03103661 2020-12-11
WO 2019/217552
PCT/US2019/031314
Table 2: Hetero-bi-functional cross-linkers
Linker Reactive Toward Advantages
SMPT Primary amines Great stability
Sulfhydryls
SPDP Primary amines Thiolation
Sulfhydryls Cleavable cross-linker
LC-SPDP Primary amines Extended spacer arm
Sulfhydryls
Sulfo-LC- Primary amines Extended spacer arm;
SPDP Sulfhydryls water soluble
SMCC Primary amines Stable maleimide
Sulfhydryls reactive group;
Sulfo-SMCC Primary amines Stable maleimide
Sulfhydryls reactive group; water
soluble
MBS Primary amines
Sulfhydryls
Sulfo-MBS Primary amines Water soluble
Sulfhydryls
SIAB Primary amines
Sulfhydryls
Sulfo-SIAB Primary amines Water soluble
Sulfhydryls
SMPB Primary amines Extended spacer arm
Sulfhydryls
Sulfo-SMPB Primary amines Extended spacer arm;
Sulfhydryls water soluble
EDC/Sulfo- Primary amines
NHS Carboxyl groups
ABH Carbohydrates Reactive with sugar
Nonselective groups
4. Tethered Particle
The particle typically includes a tethered particle for initial release of
agent, with the core particle being used for later release of a different
agent.
The tethered particle typically includes an agent in association with a
compound that readily dissolves or dissociates in an aqueous environment,
releasing the agent. The association of the agent with the compound in the
tethered particle may be a guest-host relationship.
Typically, the tethered particle has a size between about 0.1 nm and
about 200 nm, such as between about 0.1 nm and about 175 nm, between
about 0.1 nm and about 150 nm, between about 0.1 nm and about 125 nm,
CA 03103661 2020-12-11
WO 2019/217552
PCT/US2019/031314
between about 0.1 nm and about 100 nm, between about 0.1 nm and about
75 nm, or between about 0.1 nm and about 50 nm. Suitable smaller ranges
include between about 10 nm and about 200 nm, between about 10 nm and
about 175 nm, between about 10 nm and about 150 nm, between about 10
nm and about 125 nm, between about 10 nm and about 100 nm, between
about 10 nm and about 75 nm, between about 1 nm and about 50 nm,
between about 5 nm and about 50 nm, or between about 10 nm and about 50
nm.
Generally, the tethered particle may have an irregular globular or
spherical shape, or may be presented as an aggregate of a plurality of
globular or spherical shapes.
The size of the tethered particle may be measured with any suitable
method. Suitable methods include dynamic light scattering (DLS),
cryogenic-transmission electron microscopy (cryo-TEM), small angle x-ray
scattering (SAXS), or small angle neutron scattering (SANS).
The particles may be polymeric particles, complexes of materials
such as cyclodextrin and dendrimers, or carbon nanotubes.
a. Polymeric Particles
Polymeric particles can be used for delivery of the initial agent.
These may be made with the same or different polymers as the polymer core,
preferably with high loading of the agent for rapid release, either on the
surface or within a porous particle. The particles may also be formed of the
agent for initial delivery.
b. Cyclodextrins and Guest-Host Complexes
and Carbon Nanotubes
In certain embodiments, the host molecule is a cyclodextrin.
Cyclodextrins are cyclic oligosaccharides containing six (a-cyclodextrin),
seven (0-cyclodextrin), eight (y-cyclodextrin), or more a-(1,4)- linked
glucose residues. The hydroxyl groups of the cyclodextrins are oriented to
the outside of the ring while the glucosidic oxygen and two rings of the non-
exchangeable hydrogen atoms are directed towards the interior of the cavity.
As a result, cyclodextrins possess a hydrophobic inner cavity combined with
31
CA 03103661 2020-12-11
WO 2019/217552
PCT/US2019/031314
a hydrophilic exterior. Upon combination with a hydrophobic active agent,
the active agent (i.e., the guest) inserts into the hydrophobic interior of
the
cyclodextrin (i.e., the host).
The cyclodextrin may be chemically modified such that some or all of
the primary or secondary hydroxyl groups of the macrocycle, or both, are
functionalized with one or more pendant groups. The pendant groups may be
reactive functional groups that can react with the polymeric matrix, such as
methacrylates, acrylates, vinyl groups, epoxides, thiiranes, azides, alkynes,
and combinations thereof. The pendant groups may also serve to modify the
solubility of the cyclodextrin. Exemplary groups of this type include
sulfinyl,
sulfonyl, phosphate, acyl, and Ci-C12 alkyl groups optionally substituted with
one or more (e.g., 1, 2, 3, or 4) hydroxy, carboxy, carbonyl, acyl, oxy, and
oxo groups. Methods of modifying these alcohol residues are known in the
art, and many cyclodextrin derivatives are commercially available.
Examples of suitable cyclodextrins include a-cyclodextrin; 13-
cyclodextrin; y-cyclodextrin; methyl a-cyclodextrin; methyl 0-cyclodextrin;
methyl y-cyclodextrin; ethyl 0-cyclodextrin; butyl a-cyclodextrin; butyl 1-
cyclodextrin; butyl y-cyclodextrin; pentyl y-cyclodextrin; hydroxy ethyl 1-
cyclodextrin; hydroxyethyl y-cyclodextrin; 2-hydroxypropyl a-cyclodextrin;
2-hydroxypropyl 0-cyclodextrin; 2-hydroxypropyl y-cyclodextrin; 2-
hydroxybutyl 0-cyclodextrin; acetyl a-cyclodextrin; acetyl 0-cyclodextrin;
acetyl y-cyclodextrin; propionyl 0-cyclodextrin; butyryl 0-cyclodextrin;
succinyl a-cyclodextrin; succinyl 0-cyclodextrin; succinyl y-cyclodextrin;
benzoyl 0-cyclodextrin; palmityl 0-cyclodextrin; toluenesulfonyl 13-
cyclodextrin; acetyl methyl 0-cyclodextrin; acetyl butyl 0-cyclodextrin;
glucosyl a-cyclodextrin; glucosyl 0-cyclodextrin; glucosyl y-cyclodextrin;
maltosyl a-cyclodextrin; maltosyl 0-cyclodextrin; maltosyl y-cyclodextrin; a-
cyclodextrin carboxymethylether; 0-cyclodextrin carboxymethylether; y-
cyclodextrin carboxymethylether; carboxymethylethyl 0-cyclodextrin;
phosphate ester a-cyclodextrin; phosphate ester 0-cyclodextrin; phosphate
ester y-cyclodextrin; 3-trimethylammonium-2-hydroxypropyl 0-cyclodextrin;
sulfobutyl ether 0-cyclodextrin; carboxymethyl a-cyclodextrin;
32
CA 03103661 2020-12-11
WO 2019/217552
PCT/US2019/031314
carboxymethyl 0-cyc1odextrin; carboxymethyl y-cyclodextrin, and
combinations thereof.
Preferred cyclodextrins include a-cyclodextrins, 0-cyclodextrins, and
y-cyclodextrins functionalized with one or more pendant acrylate or
methacrylate groups. In a particular embodiment, the host molecule is a (3-
cyclodextrin functionalized with multiple methacrylate groups. An
exemplary host molecule of this type is illustrated below, wherein R
represents a Ci-C6 alkyl group.
:=.;,,,,,,
.:.,
-:.
..
e
',i . = -,, ¨ 14,:w
.==!===kr., ::$i ,,,:.
'W. e
.,
= -* .:, .
.s, =ke \ ps: ', e
L. ' .,
,S : e4s.? .',
..,µ""' ,' '
\i,,,,,
W. :'
As a further example, the host molecule may also be a material that
temporarily associates with an active agent via ionic interactions. For
example, conventional ion exchange resins known in the art for use in
controlled drug release may serve as host molecules. See, for example, Chen,
et al., J. Pharm. Pharmacol. 44(3):21 1-215 (1992) and Farag, et al., J.
Pharm. Sci. 77(10):872-875(1988).
When the active agent being delivered is a cationic species, suitable
ion exchange resins may include a sulfonic acid group (or modified sulfonic
acid group) or an optionally modified carboxylic acid group on a
physiologically acceptable scaffold. Similarly, where the active agent is an
anionic species, suitable ion exchange resins may include amine-based
groups (e.g., trimethylamine for a strong interaction, or
dimethylethanolamine for a weaker interaction).
33
CA 03103661 2020-12-11
WO 2019/217552
PCT/US2019/031314
In some cases, the host molecule is a molecule that forms an inclusion
complex with an agent. Inclusion complexes are formed when an active
agent (i.e., the guest), or portion of an active agent, inserts into a cavity
of
another molecule, group of molecules, or material (i.e., the host). Typically,
the guest molecule associates with the host molecule without affecting the
framework or structure of the host. For example, in the case of inclusion
complexes, the size and shape of the available cavity in the host molecule
remain substantially unaltered as a consequence of complex formation.
The host molecule may be a small molecule, an oligomer, a polymer,
or combinations thereof. Exemplary hosts include polysaccharides such as
amyloses, cyclodextrins, and other cyclic or helical compounds containing a
plurality of aldose rings, for example, compounds formed through 1,4 and
1,6 bonding of monosaccharides (such as glucose, fructose, and galactose)
and disaccharides (such as sucrose, maltose, and lactose). Other exemplary
host compounds include cryptands, cryptophanes, cavitands, crown ethers,
dendrimers, ion-exchange resins, calixarenes, valinomycins, nigericins,
catenanes, polycatenanes, carcerands, cucurbiturils, and spherands.
In other embodiments, organic host compounds or materials include
carbon nanotubes, fullerenes, and/or graphene-based host materials. Carbon
nanotubes (CNTs) are allotropes of carbon with a cylindrical nanostructure.
Nanotubes are members of the fullerene structural family, which also
includes the spherical buckyballs, and the ends of a nanotube may be capped
with a hemisphere of the buckyball structure. Their name is derived from
their long, hollow structure with the walls formed by one-atom-thick sheets
of carbon, called graphene. These sheets are rolled at specific and discrete
("chiral") angles, and the combination of the rolling angle and radius decides
the nanotube properties. Nanotubes can be categorized as single-walled
nanotubes (SWNTs) and multi-walled nanotubes (MWNTs). Nanotubes
and/or fullerenes can serve as hosts, for example, by encapsulating or
entrapping the material to be delivered (i.e., the guest) within the tubes or
fullerenes. Alternatively, the exterior and/or interior of the tubes and/or
fullerenes can be functionalized with functional groups which can complex
34
CA 03103661 2020-12-11
WO 2019/217552
PCT/US2019/031314
to the guest to be delivered. Complexations include, but are not limited to,
ionic interactions, hydrogen bonding, Van der Waals interactions, and pi-pi
interactions, such as pi-stacking.
Graphenes are also an allotrope of carbon. The structure of graphene
is a one-atom-thick planar sheet of sp2 -bonded carbon atoms that are densely
packed in a honeycomb crystal lattice. Graphene is the basic structural
element of some carbon allotropes including graphite, charcoal, carbon
nanotubes and fullerenes. The guest to be delivered can associate with and/or
complex to graphene or functionalized graphene as described above for
nanotubes and fullerenes.
The host material can also be an inorganic material, including but not
limited to, inorganic phosphates and silica.
In order to form a complex with the active agent being delivered, the
host molecule is generally selected to be complimentary to the active agent
both in terms of sterics (size) and electronics (charge and polarity). For
example, in the case of host molecules that form inclusion complexes with
the active agent to be delivered, the host molecule will typically possess an
appropriately-sized cavity to incorporate the active agent. In addition, the
host molecule typically possesses a cavity of appropriate
hydrophobicity/hydrophilicity to promote complex formation with the active
agent. The strength of the guest-host interaction will influence the release
profile of the agent from the tethered particle, with stronger guest-host
interactions generally producing more prolonged drug release.
Cationic polymers, such as polyethyleneimine (PEI), can function as
host molecules for complex oligonucleotides such as siRNA. In some
embodiments the host molecule is a dendrimer conjugated to a cyclodextrin.
In some embodiments, the cyclodextrin(s) shields primary amines of
dendrimer.
c. Dendrimers
The term "dendrimer" as used herein includes, but is not limited to, a
molecular architecture with an interior core, interior layers (or
"generations")
of repeating units regularly attached to this initiator core, and an exterior
CA 03103661 2020-12-11
WO 2019/217552
PCT/US2019/031314
surface of terminal groups attached to the outermost generation. Examples of
dendrimers include, but are not limited to, PAMAM, polyester, polylysine,
and PPI. The PAMAM dendrimers can have carboxylic, amine and hydroxyl
terminations and can be any generation of dendrimers including, but not
limited to, generation 1 PAMAM dendrimers, generation 2 PAMAM
dendrimers, generation 3 PAMAM dendrimers, generation 4 PAMAM
dendrimers, generation 5 PAMAM dendrimers, generation 6 PAMAM
dendrimers, generation 7 PAMAM dendrimers, generation 8 PAMAM
dendrimers, generation 9 PAMAM dendrimers, or generation 10 PAMAM
dendrimers. Dendrimers suitable for use include, but are not limited to,
polyamidoamine (PAMAM), polypropylamine (POPAM), polyethylenimine,
polylysine, polyester, iptycene, aliphatic poly(ether), and/or aromatic
polyether dendrimers. Each dendrimer of the dendrimer complex may be of
similar or different chemical nature than the other dendrimers (e.g., the
first
dendrimer may include a PAMAM dendrimer, while the second dendrimer
may comprise a POPAM dendrimer). In some embodiments, the first or
second dendrimer may further include an additional agent. The multi-arm
PEG polymer includes a polyethylene glycol having at least two branches
bearing sulfhydryl or thiopyridine terminal groups; however, embodiments
are not limited to this class and PEG polymers bearing other terminal groups
such as succinimidyl or maleimide terminations can be used. The PEG
polymers in the molecular weight 10 kDa to 80 kDa can be used.
A dendrimer complex includes multiple dendrimers. For example, the
dendrimer complex can include a third dendrimer; wherein the third-
dendrimer is complexed with at least one other dendrimer. Further, a third
agent can be complexed with the third dendrimer. In another embodiment,
the first and second dendrimers are each complexed to a third dendrimer,
wherein the first and second dendrimers are PAMAM dendrimers and the
third dendrimer is a POPAM dendrimer. Additional dendrimers can be
incorporated without departing from the spirit of the invention. When
multiple dendrimers are utilized, multiple agents can also be incorporated.
This is not limited by the number of dendrimers complexed to one another.
36
CA 03103661 2020-12-11
WO 2019/217552
PCT/US2019/031314
As used herein, the term "PAMAM dendrimer" means
poly(amidoamine) dendrimer, which may contain different cores, with
amidoamine building blocks. The method for making them is known to
those of skill in the art and generally, involves a two-step iterative
reaction
sequence that produces concentric shells (generations) of dendritic 0-alanine
units around a central initiator core. This PAMAM core-shell architecture
grows linearly in diameter as a function of added shells (generations).
Meanwhile, the surface groups amplify exponentially at each generation
according to dendritic-branching mathematics. They are available in
generations GO - 10 with 5 different core types and 10 functional surface
groups. The dendrimer-branched polymer may consist of polyamidoamine
(PAMAM), polyglycerol, polyester, polyether, polylysine, or polyethylene
glycol (PEG), polypeptide dendrimers.
In some embodiments, the dendrimers are in nanoparticle form and
are described in detail in international patent publication No.
W02009/046446.
5. Agents
The agents are generally suitable as first agent(s) as well as second
agent(s). The agents may be included in the core particle, in the tethered
particles, or in both the core particle and in tethered particles.
The core particles typically include at least one agent, such as a first
agent. The particle typically includes at least one first agent and at least
one
second agent. The first agent and the second agent may be the same agent,
different agents, or combinations of different agents. The agent may be a
therapeutic and prophylactic, optionally further including diagnostic and
imaging agent. These agents are pharmaceutical agents useful in preventing,
treating, or diagnosing a disease or condition.
Therapeutic agents include synthetic and natural proteins (including
enzymes, peptide-hormones, receptors, growth factors, antibodies, signaling
molecules), and synthetic and natural nucleic acids (including RNA, DNA,
anti-sense RNA, triplex DNA, inhibitory RNA (RNAi), and
oligonucleotides), and biologically active portions thereof. Suitable agents
37
CA 03103661 2020-12-11
WO 2019/217552
PCT/US2019/031314
include small molecule agents with molecular weight less than 1000 g/mol.
Suitable protein agents have a size greater than about 1,000 Da for small
peptides and polypeptides, more typically at least about 5,000 Da and often
10,000 Da or more for proteins. Nucleic acids are more typically listed in
terms of base pairs or bases (collectively "bp"). Nucleic acids with lengths
above about 10 bp, such as in the range from about 20 bp (probes; inhibitory
RNAs, etc.) to tens of thousands of bp for genes and vectors, may be
included as agents. The agents may also be hydrophilic molecules,
preferably having a low molecular weight.
General classes of agents include those to induce tolerance or
stimulate immunity to an antigen, and those for treatment of a disease or
disorder such as cancer.
a. Antigens
Antigens include antigenic materials, such as infectious agents,
pathogenic bacterial, viral, fungal, or self-antigens, or allergens. The
antigens
may be delivered to antigen presenting cells to induce immunological
responses to, or suppress or tolerize an immunological response towards, the
antigen in a subject in need thereof.
The antigens may be B-cell or T-cell antigens. Unlike T cells that
recognize digested peptides, B cells recognize their cognate antigen in its
native form. The B cell receptor used in recognition can also be secreted to
bind to antigens and initiate multiple effector functions such as
phagocytosis,
complement activation, or neutralization of receptors. While B cells can
interact with soluble antigens, the presentation of membrane-bound antigen
plays an important role in B cell activation, and in particular during
affinity-
maturation, the process during which high-affinity B cells are selected
(Balthasar et al., Trends in Immunology, 37(12):844-854 (2016)).
T cell antigens are usually peptides, with four to seven amino acid
epitopes. B cell antigens can be proteins, peptides, or other molecules
including metal, sugars and drugs, usually bound to a protein hapten.
38
CA 03103661 2020-12-11
WO 2019/217552
PCT/US2019/031314
Antigens to Induce Tolerance To
Autoimmune disease antigens include, but are not limited to,
degenerative disease antigen, atopic disease antigen, autoimmune disease
antigen, alloantigen, xenoantigen, allergens, drugs include addictive
substances such as nicotine, metabolic disease enzymes, enzymatic products,
anti-drug antibody, and vector antigens. Self-antigens include Rh blood
group antigens, I antigen, Platelet integrin GpIIb:IIIa, noncollagenous
domain of basement membrane collagen type IV, epidermal cadherin,
streptococcal cell-wall antigens, antibodies cross-reacting with cardiac
muscle, Rheumatoid factor IgG complexes with or without Hep C antigens,
DNA, histones, ribosomes, snRNP, scRNP, pancreatic beta-cell antigen,
synovial joint antigen, myelin basic protein, proteolipid protein, myelin
oligodendrocyte glycoprotein, and thyroid peroxidase.
Anti-drug antibodies (ADA) may be generated against therapeutic
monoclonal antibodies, glycosylated or PEGylated therapeutics, and
therapeutic macromolecules with complex quaternary structure forming
aggregates, DNA drugs, and vectors delivering drugs, such as adenoviral
vectors.
ADA may neutralize the therapeutic effects of the drug and/or alter
its pharmacokinetics. B cells are certainly involved in this immune response
when IgG class ADA are observed, because antibody isotype switching is a
hallmark of B-dependent antigens. Examples of adverse ADA responses
include autoimmune thrombocytopenia (ITP) following exposure to
recombinant thrombopoietin, and pure red cell aplasia, which was associated
with a particular formulation of erythropoietin (Eprex).
Antigens to which an immune response should be induced to
Exemplary antigens include cancer antigens, infectious disease
antigens such antigens from hepatitis, influenza, and polio, and protozoans
such as Plasmodium (malaria) and Leishmania.
Cellular antigens include tumor antigens, abnormal cellular proteins,
and mammalian cellular components produced by viral, bacterial, or
protozoan infected cells.
39
CA 03103661 2020-12-11
WO 2019/217552
PCT/US2019/031314
Cancer antigens include Melan-A/MART-1, Dipeptidyl peptidase IV
(DPPIV), adenosine deaminase-binding protein (ADAbp), cyclophilin b,
Colorectal associated antigen (CRC)-0017-1A/GA733, Carcinoembryonic
Antigen (CEA) and its immunogenic epitopes CAP-1 and CAP-2, etv6,
amll, Prostate Specific Antigen (PSA) and its immunogenic epitopes PSA-1,
PSA-2, and PSA-3, prostate-specific membrane antigen (PSMA), T-cell
receptor/CD3-zeta chain, MAGE-family of tumor antigens (e.g., MAGE-AL
MAGE-A2, MAGEA3, MAGE-A4, MAGE-A5, MAGE-A6, MAGE-A7,
MAGE-A8, MAGE-A9, MAGE-A10, MAGE-All, MAGEA12, MAGE-
Xp2 (MAGE-B2), MAGE-Xp3 (MAGE-B3), MAGE-Xp4 (MAGE-B4),
MAGE-C1, MAGE-C2, MAGEC3, MAGE-C4, MAGE-05), GAGE-family
of tumor antigens (e.g., GAGE-1, GAGE-2, GAGE-3, GAGE-4, GAGE-5,
GAGE-6, GAGE-7, GAGE-8, GAGE-9), BAGE, RAGE, LAGE-1, NAG,
GnT-V, MUM-1, CDK4, tyrosinase, p53, MUC family, HER2/neu, p2lras,
RCAS1, a-fetoprotein, E-cadherin, a-catenin, 0-catenin and y-catenin,
p120ctn, gpl00Pme1117, PRAME, NY-ESO-1, brain glycogen
phosphorylase, SSX-1, SSX-2 (HOM-MEL-40), SSX-1, SSX-4, SSX-5,
SCP-1, CT-7, cdc27, adenomatous polyposis coli protein (APC), fodrin,
HA, Connexin 37, Ig-idiotype, p15, gp75, GM2 and GD2 gangliosides, viral
products such as human papilloma virus proteins, Smad family of tumor
antigens, linp-1, EBV-encoded nuclear antigen (EBNA)-1, or c-erbB-2.
b. Immunomodulators
Tolerance
As reported by Kishimoto and Maldonado, Front. Immunol., 20
February 2018 I https://doi.org/10.3389/fimmu.2018.00230 "Nanoparticles
for the Induction of Antigen-Specific Immunological Tolerance",
pharmacological agents targeting at least two different signaling pathways
have been used to induce antigen-specific tolerance in vivo.
NF-KB Inhibitors
NF kappa B is a master regulator of a broad array of genes
controlling inflammation and cell survival. Thomas and colleagues have
demonstrated that co-delivery of antigen with various NF--03 inhibitors, such
CA 03103661 2020-12-11
WO 2019/217552
PCT/US2019/031314
as curcumin, quercetin, and Bay 11-07082, in liposomes suppressed
inflammatory arthritis in an antigen-specific manner (Capini et al. J Immunol
(2009) 182(6):3556-65. doi:10.4049/jimmuno1.0802972).
mTOR Inhibitors
The mammalian target of rapamycin is a conserved serine/threonine
kinase that integrates environmental signals to regulate cell metabolism and
survival. Rapamycin is a natural product derived from Streptomyces
hygroscopicus, which binds to the FK506-binding protein to form a complex
that acts as an allosteric inhibitor of the mTOR complex-1 pathway.
Rapamycin promotes Treg expansion and differentiation. In vitro treatment
of DC induces a tolerogenic phenotype (Turnquist et al. J Immunol (2007)
178(11):7018-31. doi:10.4049/jimmuno1.178.11.7018; Fischer et al. Handb
Exp Pharmacol (2009) 18:215-32. doi:10.1007/978-3-540-71029-5_10).
As reported by Kishimoto and Maldonado, Front. Immunol., 20
February 2018Ihttps://doi.org/10.3389/fimmu.2018.00230, rapamycin-
loaded nanoparticles show potent tolerogenic activity in vivo. NPs containing
rapamycin induced durable antigen-specific immune tolerance when
coadministered with various encapsulated or free protein and peptide
antigens. In addition, rapamycin-containing NPs inhibited B cell activation
and differentiation into effector cells, germinal center formation and
antibody production. These rapamycin-containing tNPs were effective in
preventing IgE-mediated anaphylaxis in models of allergy, IgG-mediated
anaphylaxis associated with repeated intravenous challenges with antigen,
and the formation of anti-drug antibodies (ADAs) to a wide range of biologic
drugs. Coadministration of tNPs containing rapamycin with free biologic
drugs was effective in preventing ADAs against coagulation FVIII
(ADVATECI) in a model of hemophilia A; human TNFa-blocking antibody
adalimumab (HUMIRACI) in a model of inflammatory arthritis, acid-a-
glucosidase (LUMIZYMECI) in a model of Pompe disease, recombinant
immunotoxin in a model of mesothelioma, adeno-associated virus gene
therapy vectors and pegylated uricase (pegsiticase) in uricase-deficient mice
and non-human primates. Currently the combination of tNP-rapamycin and
41
CA 03103661 2020-12-11
WO 2019/217552
PCT/US2019/031314
pegsiticase (SEL-212) is in Phase 2 clinical trials (NCT02959918) in patients
with symptomatic gout and hyperuricemia.
In some embodiments, the immunomodulator is TGF-0, rapamycin,
or retinoic acid, and other agents that induce regulatory T cells.
Rapamycin (also known as SIROLIMUS ) has a structure according
to Formula I, or a derivative prodrug or functional analog of rapamycin.
HOyaL.
0
OH
Oz-L.
HO
*) 410'
Formula I: SIROLIMUS
SIROLIMUS is a macrolide compound produced by the bacterium
Streptomyces hygroscopicus and was first isolated in 1972, from samples of
Streptomyces hygroscopicus found on Easter Island. SIROLIMUS has
Empirical Formula Csil-179N013, and a molecular weight of 914.17 Da (CAS
Number: 53123-88-9). It is thought SIROLIMUS inhibits activation of T
cells and B cells by reducing the production of interleukin-2 (IL-2).
SIROLIMUS is a member of the class of compounds that inhibit
the mechanistic target of rapamycin (mTOR) molecule (i.e., mTOR
inhibitors). SIROLIMUS (rapamycin) has been shown to have
immunosuppressant functions through regulation of T cell activities and has
been shown to be useful in preventing the rejection of organ transplants, as
well as inhibiting neointimal hyperplasia in arterial and vein grafts (Suzuki,
et al., Circulation 104, 1188-1193 (2001); Araki, et al., Nature, 460, 108-
112 (2009)).
Variants, derivatives and functional analogues of rapamycin are
known, including the structural analog everolimus (also known under the
trade names ZORTRESS , CERTICAN , AFINITOR , and
42
CA 03103661 2020-12-11
WO 2019/217552
PCT/US2019/031314
VOTUBIA ,) temsirolimus (pro-drug analog of rapamycin, also known as
CCI-779), as well as deforolimus or ridaforolimus. Rapamycin and its
variants, derivatives, and functional analogues are described in WO
95122972, WO 95116691, WO 95104738, U.S. Pat. No. 6,015,809;
5,989,591 ; U.S. Pat. No. 5,567,709; 5,559, 112; 5,530,006; 5,484,790;
5,385,908; 5,202,332; 5, 162,333; 5,780,462; 5,120,727.
Immunostimulation
The immunomodulators include interleukins (IL-), interferons (IFN-),
or cytokines, such as IFN-y, IL-4, IL-2, IL-10, IL-17 and/or TNF-a. In some
embodiments, the immunostimulatory agent is a toll-like receptor (TLR)
agonist, cytokine receptor agonist, CD40 agonist, Fc receptor agonist, CpG-
containing immunostimulatory nucleic acid, complement receptor agonist, or
an adjuvant. In some embodiments, the TLR agonist is a TLR-1, TLR-2,
TLR-3, TLR-4, TLR-5, TLR-6, TLR-7, TLR-8, TLR-9, or TLR-10 agonist.
In some embodiments, the Fc receptor agonist is an Fc-gamma receptor
agonist. In some embodiments, the complement receptor agonist binds to
CD21 or CD35.
Examples of immunological adjuvants that can be associated with the
particles include, but are not limited to, TLR ligands, C-Type Lectin
Receptor ligands, NOD-Like Receptor ligands, RLR ligands, and RAGE
ligands. TLR ligands can include lipopolysaccharide (LPS) and derivatives
thereof, as well as lipid A and derivatives there of including, but not
limited
to, monophosphoryl lipid A (MPL), glycopyranosyl lipid A, PET-lipid A,
and 3-0-desacy1-4'-monophosphoryl lipid A, TLR3 ligands (e.g.,
polyinosinic-polycytidylic acid (poly(I:C)), TLR7 ligands (e.g., imiquimod
and resiquimod), and TLR9 ligands.
c. Therapeutic Agents
Therapeutic agents include anti-infectives, general
immunomodulatory agents, neuroactive agents, hormones and
chemotherapeutic agents, as well as prophylactic agents.
Antimicrobial agents include agents effect in treating or alleviating
the symptoms of viral, bacterial or fungal infection. These can be small
43
CA 03103661 2020-12-11
WO 2019/217552
PCT/US2019/031314
molecules (2000 D, 1500 D, and 1000 D), proteins, peptides, or
combinations thereof.
Representative anti-cancer agents include, but are not limited to,
alkylating agents (such as cisplatin, carboplatin, oxaliplatin,
mechlorethamine, cyclophosphamide, chlorambucil, dacarbazine, lomustine,
carmustine, procarbazine, chlorambucil and ifosfamide), antimetabolites
(such as fluorouracil (5-FU), gemcitabine, methotrexate, cytosine
arabinoside, fludarabine, and floxuridine), antimitotics (including taxanes
such as paclitaxel and decetaxel, epothilones A-F, and vinca alkaloids such
as vincristine, vinblastine, vinorelbine, and vindesine), anthracyclines
(including doxorubicin, daunorubicin, valrubicin, idarubicin, and epirubicin,
as well as actinomycins such as actinomycin D), cytotoxic antibiotics
(including mitomycin, plicamycin, and bleomycin), topoisomerase inhibitors
(including camptothecins such as camptothecin, irinotecan, and topotecan as
well as derivatives of epipodophyllotoxins such as amsacrine, etoposide,
etoposide phosphate, and teniposide), and combinations thereof. Other
suitable anti-cancer agents include angiogenesis inhibitors including
antibodies to vascular endothelial growth factor (VEGF) such as
bevacizumab (AVASTINCI), other anti-VEGF compounds; thalidomide
(THALOMIDC)) and derivatives thereof such as lenalidomide
(REVLIMIDC)); endostatin; angiostatin; receptor tyrosine kinase (RTK)
inhibitors such as sunitinib (SUTENTC)); tyrosine kinase inhibitors such as
sorafenib (NEXAVARCI), erlotinib (TARCEVACI), pazopanib, axitinib, and
lapatinib; transforming growth factor-a or transforming growth factor-0
inhibitors, and antibodies to the epidermal growth factor receptor such as
panitumumab (VECTIBIX ) and cetuximab (ERBITUX ).
Other suitable anti-neoplastic agents include cyclophosphamide,
actinomycin, bleomycin, daunorubicin, doxorubicin, epirubicin, mitomycin,
methotrexate, fluorouracil, carboplatin, carmustine (BCNU), methyl-CCNU,
cisplatin, etoposide, camptothecin and derivatives thereof, phenesterine,
paclitaxel and derivatives thereof, docetaxel and derivatives thereof,
vinblastine, vincristine, tamoxifen, piposulfan, altretamine, asparaginase,
44
CA 03103661 2020-12-11
WO 2019/217552
PCT/US2019/031314
bleomycin, busulfan, carboplatin, carmustine, chlorambucil, cisplatin,
cladribine, cyclophosphamide, cytarabine, dacarbazine, diethylstilbestrol,
ethinyl estradiol, etoposide, mitomycin, mitotane, mitoxantrone, paclitaxel,
pentastatin, pipobroman, plicamycin, prednisone, procarbazine, streptozocin,
tamoxifen, teniposide, vinblastine, and vincristine.
Imaging Agents
The particles may also include imaging agent such as radionuclide-
labeled small molecules, such as Technetium99 (99mTc), F-18
fluorodeoxyglucose, fluorinated compounds, such as fluorinated silicon oil,
perfluorocarbon, or perfluoropolyether containing 19F, superparamagnetic
iron oxide (SPIO), gadolinium, europium, diethylene triamine pentacetic
acid (DTPA), 1,4,7,10-tetraazacyclododecane-1,4,7,10-tetraacetic acid
(DOTA) and their derivatives, gas, and fluorescent tracers. Suitable
modalities with respective tracers are known in the art (Baum et AL.,
The ranostics, 2(5)437-447 (2012)).
Exemplary radioisotopes include, but are not limited to Molybdenum-
99, Technetium-99m, Chromium-51, Cobalt-60, Copper-64, Ytterbium-169,
Iodine-131, Iridium-192, Iron-59, Xenon-133, Xenon-127, Phosphorus-32,
Potassium-42, Samarium-153 (and Strontium-89, Selenium-75, Sodium-24,
Yttrium-90, Gallium-67, Fluorodeoxyglucose-18, and combinations thereof.
6. Targeting Moiety
The particles may include a targeting moiety. The targeting moiety
may be present on the core particle, on the tethered particle, or both on the
core particle and on the tethered particle.
The particles can be targeted to a specific tissue or organ in vivo with
a surface ligand or moiety. The targeting moiety can be covalently or non-
covalently associated with the particles. The targeting moiety may be an
antibody or antigen-binding fragment thereof. The targeting moiety can be
an RNA or protein shaped to specifically interact with the target (e.g., an
RNA- or peptide-aptamer). The targeting moiety can be a small molecule or
element with specific binding affinity (e.g., biotin which binds streptavidin,
or iron which is bound by the transferrin receptor). The targeting moieties
CA 03103661 2020-12-11
WO 2019/217552
PCT/US2019/031314
should have an affinity for a cell-surface receptor, cell-surface antigen, or
other ligand that is specific to the target tissue.
The targeting moiety can specifically recognize and bind to a target
molecule specific for a cell type, a tissue type, or an organ. The target
molecule can be a cell surface polypeptide, lipid, or glycolipid. The target
molecule can be a receptor that is selectively expressed on a specific cell
surface, a tissue or an organ. Cell specific markers can be for specific types
of cells including, but not limited to stem cells, skin cells, blood cells,
immune cells, muscle cells, nerve cells, cancer cells, virally infected cells,
and organ specific cells. The cell markers can be specific for endothelial,
ectodermal, or mesenchymal cells. Representative cell specific markers
include, but are not limited to cancer specific markers, immune-cell specific
markers, and skin-cell specific markers. The STPs with the targeting
moieties may be delivered to specific tissues, such as liver tissue,
pancreatic
tissue, heart tissue, lung tissue, intestinal tissue, spleen tissue, kidney
tissue,
bladder tissue, muscle tissue, bone tissue, cartilage, neural tissue, the
blood,
lymphatic tissues, or sensory tissues, such as skin, eye, ear and nasal
passages.
The targeting moiety can be covalently associated with the STP, and
the covalent association can be mediated by a linker.
In some aspects, the targeting moiety is a peptide. Specifically, the
peptide can be, but is not limited to, one or more of the following: Epidermal
growth factor (EGF), hepatocyte growth factor, and a4 integrin (which is
bound by vascular cell adhesion molecule-1), or the targets of various
integrins (e.g. integrin ligands, matrikines and matricryptins).
The targeting moiety can be an antibody or an antigen-binding
fragment thereof. The antibody can be any type of immunoglobulin that is
known in the art. For instance, the antibody can be of any isotype, e.g., IgA,
IgD, IgE, IgG, IgM, etc. The antibody can be monoclonal or polyclonal. The
antibody can be a naturally-occurring antibody, e.g., an antibody isolated
and/or purified from a mammal, e.g., mouse, rabbit, goat, horse, chicken,
hamster, human, etc. Alternatively, the antibody can be a genetically-
46
CA 03103661 2020-12-11
WO 2019/217552
PCT/US2019/031314
engineered antibody, e.g., a humanized antibody or a chimeric antibody. The
antibody can be in monomeric or polymeric form. The antigen binding
portion of the antibody can be any portion that has at least one antigen
binding site, such as Fab, F(ab')2, dsFv, sFv, diabodies, and triabodies. In
certain embodiments, the antibody is a single chain antibody.
Aptamers are oligonucleotide or peptide sequences with the capacity
to recognize virtually any class of target molecules with high affinity and
specificity. Aptamers bind to targets such as small organics, peptides,
proteins, cells, and tissues. Unlike antibodies, some aptamers exhibit
stereoselectivity. The aptamers can be designed to bind to specific targets
expressed on cells, tissues or organs.
B. Spatiotemporal Agent Release
The STP are designed so that they release agents within the same
cells, but not at the same time, with the tethered agents being released
first,
then the core agents, to achieve the required spatial and temporal
requirements for efficacy.The linker or tether as well as particle composition
can be used to determine when the agent is released relative to release of
agent from the core.
1. Spatial Aspect of Release
The spatial aspect of release refers to spatially separated release of
one, two, or more agents from the same particle within the same targeted
cells. Spatially separated release of agents may be a release from two or
more separate regions of the same particle. Spatially separated release of
agents may be a release at two or more anatomical regions in a subject from
the same particle. Spatially separated release of agents may be a release from
two or more separate regions of a particle and a release at two or more
anatomical regions in a subject from the same particle. For example, the
particle may be injected subcutaneously and engulfed by Langerhans cell,
delivered to a local lymph node by the same Langerhans cell, wherein the
particle releases the first agent from one part of the particle in Langerhans
cell positioned subcutaneously, and releases the second agent from another
47
CA 03103661 2020-12-11
WO 2019/217552
PCT/US2019/031314
part of the particle in the same Langerhans cell now positioned in the lymph
node.
2. Temporal Aspect of Release
The temporal aspect of release refers to timing of release of one, two,
or more agents from the same particle. Timing of release of an agent may be
a first release and a second release of the agent separated in time. The first
release of the agent may or may not overlap in time with the second release.
For example, the first release of the agent may overlap with the second
release such that the first release may be at about 50%, at about 60%, at
about 70%, at about 80%, at about 90%, or at about 100% of the total release
of the agent, before the second release is at about 10%, at about 20%, or at
about 30% of the total release of the agent. The first release of the agent
and
the second release of the agent may not overlap, such that the first release
may be at about 100% of the total release of the agent, before the second
release is at about 1% or at about 10% of the total release of the agent.
There
may be a time delay between the first release, for example, after about 100%
of the total release of the agent, before the second release is initiated. The
time delay may be in minutes, hours, or days. The time delay may be
between 1 minute and 60 minutes, between 1 hour and 24 hours, or between
24 hours and 168 hours. The first release may be a release of a first agent
and
the second release may be a release of the second agent, where the first agent
and the second agent are the same agent or are different agents.
The release of the first agent and the release of the second agent may
occur within a time period between minutes and hours, a day, two days, three
days, a week, two weeks, three weeks, a month or more.
C. Compositions
The particles may be formulated into pharmaceutical compositions
with suitable excipients, in suitable dosage forms, to provide effective
amounts of the one or more agents in the compositions. Typically the
particles will be administered by injection, intravenously, subcutaneously,
intramuscularly, although there may be embodiments where they are
48
CA 03103661 2020-12-11
WO 2019/217552
PCT/US2019/031314
administered topically to tissue or mucosal surface (nasal, vaginal, buccal,
rectal, pulmonary, oral).
Excipients may include suspending agents such as sterile water,
phosphate buffered saline, saline, or a non-aqueous solution such as glycerol.
The STPs may be stored in any suitable storage medium. The storage
can be at temperatures at or below 0 C (e.g., -20 C, -80 C, or -165 C), at
or
above 0 C, such as at refrigeration temperature (about 4 C), at about 10 C,
at room temperature and standard pressure (about 20 C, 1 atm), or at
physiological temperature (about 37 C). Storage may be in any suitable
vessel for ease of utilizing the STPs in future applications. Suitable storage
vessels include, but are not limited to, capsules, vials, packets, pouches,
syringes, tubes, tubs, cans, and lyophilized containers.
III. Methods of Making the Particles and Compositions
A. Methods of Making the Core Particles
The core particles described herein can be prepared by a variety of
methods. The preferred method is an emulsion method as described in the
examples.
1. Solvent Evaporation
In this method the polymer is dissolved in a volatile organic solvent,
such as methylene chloride. The drug (either soluble or dispersed as fine
particles) is added to the solution, and the mixture is suspended in an
aqueous solution that contains a surface active agent such as poly(vinyl
alcohol). The resulting emulsion is stirred until most of the organic solvent
evaporated, leaving solid nanoparticles. The resulting nanoparticles are
washed with water and dried overnight in a lyophilizer. The nanoparticles
with different sizes and morphologies can be obtained by this method. This
method is useful for relatively stable polymers like PBA, polyesters and
polystyrene.
2. Interfacial polycondensation
Interfacial polycondensation is used to encapsulate a core material
in the following manner. One monomer and the core material are dissolved
in a solvent. A second monomer is dissolved in a second solvent (typically
49
CA 03103661 2020-12-11
WO 2019/217552
PCT/US2019/031314
aqueous) which is immiscible with the first. An emulsion is formed by
suspending the first solution through stirring in the second solution. Once
the emulsion is stabilized, an initiator is added to the aqueous phase causing
interfacial polymerization at the interface of each droplet of emulsion.
3. Solvent Evaporation Microencapsulation
In solvent evaporation microencapsulation, the polymer is typically
dissolved in a water immiscible organic solvent and the material to be
encapsulated is added to the polymer solution as a suspension or solution in
an organic solvent. An emulsion is formed by adding this suspension or
solution to a beaker of vigorously stirring water (often containing a surface
active agent, for example, polyethylene glycol or polyvinyl alcohol, to
stabilize the emulsion). The organic solvent is evaporated while continuing
to stir. Evaporation results in precipitation of the polymer, forming solid
nanoparticles containing core material.
The solvent evaporation process can be used to entrap a liquid core
material in a polymer such as PBA, PLA, PLA/PGA copolymer, or
PLA/PCL copolymer microcapsules. The polymer or copolymer is dissolved
in a miscible mixture of solvent and nonsolvent, at a nonsolvent
concentration which is immediately below the concentration which would
produce phase separation (i.e., cloud point). The liquid core material is
added to the solution while agitating to form an emulsion and disperse the
material as droplets. Solvent and nonsolvent are vaporized, with the solvent
being vaporized at a faster rate, causing the polymer or copolymer to phase
separate and migrate towards the surface of the core material droplets. This
phase-separated solution is then transferred into an agitated volume of
nonsolvent, causing any remaining dissolved polymer or copolymer to
precipitate and extracting any residual solvent from the formed membrane.
The result is a nanoparticle composed of polymer or copolymer shell with a
core of liquid material.
Solvent evaporation microencapsulation can result in the
stabilization of insoluble active agent particles in a polymeric solution for
a
period of time ranging from 0.5 hours to several months. Stabilizing an
CA 03103661 2020-12-11
WO 2019/217552
PCT/US2019/031314
insoluble pigment and polymer within the dispersed phase (typically a
volatile organic solvent) can be useful for most methods of
microencapsulation that are dependent on a dispersed phase, including film
casting, solvent evaporation, solvent removal, spray drying, phase inversion,
and many others.
The stabilization of insoluble active agent particles within the
polymeric solution could be critical during scale-up. By stabilizing
suspended active agent particles within the dispersed phase, the particles can
remain homogeneously dispersed throughout the polymeric solution as well
as the resulting polymer matrix that forms during the process of
microencapsulation.
Solvent evaporation microencapsulation (SEM) have several
advantages. SEM allows for the determination of the best polymer-solvent-
insoluble particle mixture that will aid in the formation of a homogeneous
suspension that can be used to encapsulate the particles. SEM stabilizes the
insoluble particles or pigments within the polymeric solution, which will
help during scale-up because one will be able to let suspensions of insoluble
particles or pigments sit for long periods of time, making the process less
time-dependent and less labor intensive. SEM allows for the creation of
microparticles or nanoparticles that have a more programmable release of the
encapsulated material.
4. Solvent Removal Microencapsulation
In solvent removal microencapsulation, the polymer is typically
dissolved in an oil miscible organic solvent and the material to be
encapsulated is added to the polymer solution as a suspension or solution in
organic solvent. The agents can be added to improve the dispersion of the
material to be encapsulated. An emulsion is formed by adding this
suspension or solution to vigorously stirring oil, in which the oil is a
nonsolvent for the polymer and the polymer/solvent solution is immiscible in
the oil. The organic solvent is removed by diffusion into the oil phase while
continuing to stir. Solvent removal results in precipitation of the polymer,
forming solid particles containing core material.
51
CA 03103661 2020-12-11
WO 2019/217552
PCT/US2019/031314
5. Phase Separation Microencapsulation
In phase separation microencapsulation, the material to be
encapsulated is dispersed in a polymer solution with stirring. While
continually stirring to uniformly suspend the material, a nonsolvent for the
polymer is slowly added to the solution to decrease the polymer's solubility.
Depending on the solubility of the polymer in the solvent and nonsolvent, the
polymer either precipitates or phase separates into a polymer rich and a
polymer poor phase. Under proper conditions, the polymer in the polymer
rich phase will migrate to the interface with the continuous phase,
encapsulating the core material in a droplet with an outer polymer shell.
6. Spontaneous Emulsification
Spontaneous emulsification involves solidifying emulsified liquid
polymer droplets by changing temperature, evaporating solvent, or adding
chemical cross-linking agents. The physical and chemical properties of the
encapsulant, and the material to be encapsulated, dictates the suitable
methods of encapsulation. Factors such as hydrophobicity, molecular
weight, chemical stability, and thermal stability affect encapsulation.
7. Spray-Drying
In this method, the polymer is dissolved in organic solvent. A known
amount of the active drug is suspended (insoluble drugs) or co-dissolved
(soluble drugs) in the polymer solution. The solution or the dispersion is
then spray-dried. Typical process parameters for a mini-spray drier (Buchi)
are as follows: polymer concentration = 0.04 g/mL, inlet temperature = -
24 C, outlet temperature = 13-15 C, aspirator setting = 15, pump setting =
10 mL/minute, spray flow = 600 Nl/hr, and nozzle diameter = 0.5 mm.
Microp articles ranging between 1-10 microns are obtained with a
morphology which depends on the type of polymer used.
B. Methods of Making the Tethered Particle
Techniques and reagents are commercially available for coupling
avidin-biotin or by using Click Chemistry. The tethered particles are formed
as described above.
52
CA 03103661 2020-12-11
WO 2019/217552
PCT/US2019/031314
IV. Methods of Using the Particles and Compositions
Spatiotemporally tuned particles (STP) provide for the delivery of
agents to the same cells in a preferred order. The release kinetics of STP
have been validated, and STP has shown enhanced tolerogenic effects both
in vitro and in vivo (see Examples). STP can be used to deliver any
combination of agents, in a desired temporal release profile, to be applied
for
treatment of cancer, autoimmune diseases, allergies, epigenetic
manipulations, or other diseases that require spatiotemporal considerations
for treatment.
In current formulations involving administration of multiple agents, it
is assumed that the activity kinetics of the multiple agents are the same. In
the case of co-delivery of antigens and immunomodulators, the antigen will
display on an APC at the same time as the cell itself is being reprogrammed
to become tolerogenic. By administering such agents at the same time either
subcutaneously, intradermal or intravenously, it is assumed that the
combination of factors will localize to the same affected or diseased region.
However, these therapies have a limited efficacy. With standard
formulations, the efficacy is only a fraction of what it can be if the spatial
and temporal aspects of administration are properly determined during
administration of the drug combinations.
As such, many diseases can be treated with greater efficacy if drugs
or immunological agents can be locally delivered in the preferred sequence.
For example, combinatorial delivery of drugs (such as checkpoint inhibitors)
and cytokine (such as IL-2) in cancer immunotherapy can be staggered such
that checkpoint inhibitors and IL-2 are delivered to the same spatial
location,
the earlier release of checkpoint blockade inhibiting suppressive Tregs in the
tumor microenvironment and therefore increasing IL-2 availability
specifically to TILs. Unfortunately, to date, there is no single technology
that
can achieve this "Spatiotemporal" aspect in any therapy. To overcome the
issue, several regimens require unlocalized injections at different time
points,
or different frequencies. The expected effects are the usual toxicity, limited
efficacy, and adverse short and long-term side effects.
53
CA 03103661 2020-12-11
WO 2019/217552
PCT/US2019/031314
The Examples below demonstrate that by employing temporal
staggering of agent release and spatial localization, antigen-specific
tolerance
induction can be achieved. The particles may be used to form programmable
formulations that facilitate localization and required temporal release of
agents for improving treatment outcomes in diverse diseases requiring
combined therapies.
Because STP is a single platform that delivers multiple agents with
the desired kinetics, treatment regimens are better fine-tuned with greater
efficacy. Efficacy is enhanced with logarithmically lower drug
concentrations. This in turn reduces adverse side-effects, and the prolonged
hospitalization of patients and expense of monitoring and treatment is
significantly lowered. The STP may be better vaccine platforms as they may
accommodate both adjuvant and antigen in a single vehicle with proper
release features making them more efficacious.
1. Inhibition of Epitope Spreading and Induction of
Tolerance
Many DCs are present in the periphery, where they constantly sense
the environment by endocytosis. Once activated by pathogen-associated
molecular pattern molecules (PAMPs) or damage-associated molecular
pattern molecules (DAMPs), they rapidly produce early proinflammatory
signals such as NO, TNF-a, or type I interferons (IFNs) to combat the
infection or tissue danger. Mammalian target of rapamycin complex 1
(mTORC1) and mTORC2 are activated by TLR ligands and usually support
these responses. Therefore, inhibition of mTOR at this time point is
considered anti-inflammatory.
Later, these DCs upregulate CCR7 and migrate to lymph nodes to activate T
cells. They shut down antigen uptake, optimize antigen presentation, and
increase the expression of the costimulatory molecule CD86, while
inhibitory PD-Li is also induced to prevent excessive T cell activation.
Moreover, immunomodulatory cytokines such as IL-12 and IL-10 are
maximally expressed at these late time points to guide T helper cell
activation and differentiation. Inhibition of mTOR at this time point usually
54
CA 03103661 2020-12-11
WO 2019/217552
PCT/US2019/031314
enhances antigen presentation and CCR7, CD86, and IL-12 production and
blocks PD-Li and IL-10 expression, which in total promotes T cell
activation. See Figures 6A-6C.
In the lymph node, limiting the amount of nutrients downregulates
mTOR in DCs, which may act as an intrinsic signal to support their T cell-
stimulatory capacities. Pharmacological inhibition of mTOR thus
exacerbates a response that is physiologically occurring in lymph nodes to
support T cell activation.
Epitope spreading refers to the ability of B and T cell immune
response to diversify both at the level of specificity, from a single
determinant to many sites on an auto antigen, and at the level of V gene
usage (Monneaux, F. et al., Arthritis & Rheumatism, 46(6): 1430-1438
(2002). Epitope spreading is not restricted to systemic autoimmune disease.
It has been described in T cell dependent organ specific diseases such as
insulin dependent diabetes mellitus (IDDM) and multiple sclerosis in
humans and EAE induced experimental animals with a variety of myelin
proteins.
Epitope spreading involves the acquired recognition of new epitopes
in the same self molecule as well as epitopes residing in proteins that are
associated in the same macromolecular complex. Epitope spreading can be
assessed by measuring delayed-type hypersensitivity (DTH) responses,
methods of which are known in the art.
Therefore, in some embodiments, a method for inhibiting or reducing
epitope spreading in a subject includes administering to the subject an
effective amount of particles. In a preferred embodiment the particle
formulation inhibits epitope spreading in the subject.
a. Antigen-Specific Tolerance
Co-administration of antigen with immunosuppressive agents such as
Rapamycin is a promising approach for induction of antigen-specific
tolerance. The direct priming of antigen presenting cells, such as Dendritic
Cells (DCs), with antigen and immunosuppressives or tolerogenic agents is
understood as a potentially powerful new "anti-vaccination" approach that
CA 03103661 2020-12-11
WO 2019/217552
PCT/US2019/031314
induces a tolerant immunity against the antigen of choice as opposed to
priming an immune response against an antigen. The therapeutic
applications range from autoimmune disease states to transplantation, allergy
and asthma. This strategy, termed "antigen-specific tolerance" is of
significant interest and seeks methods to tune immunity against specific
antigens such pancreatic B cell antigens for diabetes, nuclear antigens for
lupus, new antigenic sequences and epitopes for inflammatory bowel
disease, Crohn's disease, collagen-based antigens for rheumatoid arthritis,
white matter and dark matter antigens for multiple sclerosis, donor antigenic
sequences in transplants, food allergens and other diseases.
Currently, all strategies focus on administering the antigen together
with the tolerance adjuvant at the same time as a bolus or injectable. The
platform in nanoparticle design and production exploits the understandings
in disease pathogenesis and molecular interactions within and between cells
to create a powerful new methodology that addresses antigen-specific
tolerance.
The particles are formed to modulate antigen-specific tolerance,
which can be significantly enhanced or reduced through sequential timing of
delivery of an antigen and a tolerogenic agent (such as an immunomodulator,
or an immunosuppressive agent). The particles simultaneously enable the
control of the localization of agent release and the timing of the agent
release
by staggering release of the antigen and the tolerogenic agent.
By temporally staggering the delivery of the antigen and the
immunomodulatory agent, one can significantly enhance or reduce the
quality and magnitude of antigen-specific tolerance. That is, the sequence of
delivery of antigen and the immunomodulatory agent matters for tuning and
enhancing antigen-specific induction and maintenance of tolerance.
Temporal staggering of the agents is described as a "tuning knob" for
controlling the levels of immunological tolerance.
The spatial localization of the immunomodulator and antigen is
important for antigen-specific tolerance induction. The requirement for co-
encapsulation of both agents in one particle supports the use of the particles
56
CA 03103661 2020-12-11
WO 2019/217552
PCT/US2019/031314
to deliver the immunomodulator and antigen to the same antigen-presenting
cell (APC), as the same APC needs to be primed to display antigen and be
phenotypically tolerant. In other words, a subset of cells displaying antigen
and another subset exhibiting tolerogenic behavior is not sufficient nor
efficient for inducting maintenance of tolerance to the antigen in a safe
manner. Tolerant cells alone may display other antigens (promoting long-
term adverse/safety issues) and cells displaying antigen without being
phenotypically tolerogenic may induce a pro-inflammatory response against
the displayed antigen (worsening the disease) or ineffectual. Thus, spatial
localization of both agents to the same APC is needed for the effective
tolerance induction and prevention of adverse effects due to immunization.
i. Allergies
A similar methodology can be used to treat allergies, substituting the
allergen of interest for the autoimmune stimulus. Typically, particles are
administered to a subject in an effective amount to reduce or inhibit an
allergy or allergic reaction.
Allergies are abnormal reactions of the immune system that occur in
response to otherwise harmless substances. Allergies are among the most
common of medical disorders. It is estimated that 60 million Americans, or
more than one in every five people, suffer from some form of allergy, with
similar proportions throughout much of the rest of the world. Allergy is the
single largest reason for school absence and is a major source of lost
productivity in the workplace.
An allergy is a type of immune reaction. Normally, the immune
system responds to foreign microorganisms or particles by producing
specific proteins called antibodies. These antibodies are capable of binding
to identifying molecules, or antigens, on the foreign particle. This reaction
between antibody and antigen sets off a series of chemical reactions designed
to protect the body from infection. Sometimes, this same series of reactions
is triggered by harmless, everyday substances such as pollen, dust, and
animal dander. When this occurs, an allergy develops against the offending
substance (an allergen.)
57
CA 03103661 2020-12-11
WO 2019/217552
PCT/US2019/031314
Mast cells, one of the major players in allergic reactions, capture and
display a particular type of antibody, called immunoglobulin type E (IgE)
that binds to allergens. Inside mast cells are small chemical-filled packets
called granules. Granules contain a variety of potent chemicals, including
histamine.
Immunologists separate allergic reactions into two main types:
immediate hypersensitivity reactions, which are predominantly mast cell-
mediated and occur within minutes of contact with allergen; and delayed
hypersensitivity reactions, mediated by T cells (a type of white blood cells)
and occurring hours to days after exposure.
Inhaled or ingested allergens usually cause immediate
hypersensitivity reactions. Allergens bind to IgE antibodies on the surface of
mast cells, which spill the contents of their granules out onto neighboring
cells, including blood vessels and nerve cells. Histamine binds to the
surfaces of these other cells through special proteins called histamine
receptors. Interaction of histamine with receptors on blood vessels causes
increased leakiness, leading to the fluid collection, swelling and increased
redness. Histamine also stimulates pain receptors, making tissue more
sensitive and irritable. Symptoms last from one to several hours following
contact. In the upper airways and eyes, immediate hyper-sensitivity
reactions cause the runny nose and itchy, bloodshot eyes typical of allergic
rhinitis. In the gastrointestinal tract, these reactions lead to swelling and
irritation of the intestinal lining, which causes the cramping and diarrhea
typical of food allergy. Allergens that enter the circulation may cause hives,
angioedema, anaphylaxis, or atopic dermatitis.
Allergens on the skin usually cause delayed hypersensitivity reaction.
Roving T cells contact the allergen, setting in motion a more prolonged
immune response. This type of allergic response may develop over several
days following contact with the allergen, and symptoms may persist for a
week or more.
Allergens enter the body through four main routes: the airways, the
skin, the gastrointestinal tract, and the circulatory system. Airborne
58
CA 03103661 2020-12-11
WO 2019/217552
PCT/US2019/031314
allergens cause the sneezing, runny nose, and itchy, bloodshot eyes of hay
fever (allergic rhinitis). Airborne allergens can also affect the lining of
the
lungs, causing asthma, or conjunctivitis (pink eye). Exposure to cockroach
allergens has been associated with the development of asthma. Airborne
allergens from household pets are another common source of environmental
exposure. Allergens in food can cause itching and swelling of the lips and
throat, cramps, and diarrhea. When absorbed into the bloodstream, they may
cause hives (urticaria) or more severe reactions involving recurrent, non-
inflammatory swelling of the skin, mucous membranes, organs, and brain
(angioedema). Some food allergens may cause anaphylaxis, a potentially
life-threatening condition marked by tissue swelling, airway constriction, and
drop in blood pressure. Allergies to foods such as cow's milk, eggs, nuts,
fish, and legumes (peanuts and soybeans) are common. Allergies to fruits
and vegetables may also occur. In contact with the skin, allergens can cause
reddening, itching, and blistering, called contact dermatitis. Skin reactions
can also occur from allergens introduced through the airways or
gastrointestinal tract. This type of reaction is known as atopic dermatitis.
Dermatitis may arise from an allergic Dermatitis may arise from an allergic
response (such as from poison ivy), or exposure to an irritant causing
nonimmune damage to skin cells (such as soap, cold, and chemical agents).
Injection of allergens, from insect bites and stings or drug administration,
can introduce allergens directly into the circulation, where they may cause
system-wide responses (including anaphylaxis), as well as the local ones of
swelling and irritation at the injection site.
These can be treated by administration of anti-inflammatories, or by
inducing tolerance to the antigen.
Inflammatory Bowel Disease
Inflammatory bowel disease (IBD) is a broad term that describes
conditions with chronic or recurring immune response and inflammation of
the gastrointestinal tract. The two most common inflammatory bowel
diseases are ulcerative colitis and Crohn's disease. Inflammation affects the
entire digestive tract in Crohn's disease and only the large intestine in
59
CA 03103661 2020-12-11
WO 2019/217552
PCT/US2019/031314
ulcerative colitis. Both illnesses are characterized by an abnormal response
to the body's immune system.
Crohn's disease is treated with medications designed to suppress the
immune system's abnormal inflammatory response that causes the
symptoms. Suppressing inflammation offers relief from common symptoms
like fever, diarrhea, and pain, and healing of the intestinal tissues.
Combination therapy could include the addition of a biologic to an
immunomodulator. As with all therapies, there are risks and benefits of
combination therapies. Combining medications with immunomodulatory
therapies can increase the effectiveness of IBD treatment.
Examples of agents used to treat IBD symptoms include, but are not
limited to, sulfasalazine, mesalamine, olsalazine, and balsalazide that
contain
5-aminosalicylate acid (5-ASA), corticosteroids, immunomodulators,
antibiotics, and biologic therapies. Examples of disease specific antigens
include bacterial flagellin, and other components of gut bacteria, including
commensal bacteria.
Multiple Sclerosis
Multiple sclerosis is an unpredictable disease of the central nervous
system. Multiple sclerosis (MS) can range from relatively benign to
somewhat disabling to devastating, as communication between the brain and
other parts of the body is disrupted. MS may be an autoimmune disease.
Most people experience their first symptoms of MS between the ages
of 20 and 40; the initial symptom of MS is often blurred or double vision,
red-green color distortion, or even blindness in one eye. Most MS patients
experience muscle weakness in their extremities and difficulty with
coordination and balance. These symptoms may be severe enough to impair
walking or even standing. In the worst cases, MS can produce partial or
complete paralysis. Most people with MS also exhibit paresthesias,
transitory abnormal sensory feelings such as numbness, prickling, or "pins
and needles" sensations. Some may also experience pain. Speech
impediments, tremors, and dizziness are other frequent complaints.
Approximately half of all people with MS experience cognitive impairments
CA 03103661 2020-12-11
WO 2019/217552
PCT/US2019/031314
such as difficulties with concentration, attention, memory, and poor
judgment, but such symptoms are usually mild and are frequently
overlooked. Depression is another common feature of MS.
Currently there is no cure for MS. Three forms of beta interferon
(AVONEX , Biogen, Inc., Cambridge, MA; BETASERON , Bayer
Intellectual Property GMBH, Monheim Am Rhein, Germany; and REBIF ,
Ares Trading S.A., Aubonne, Switzerland) have been approved by the Food
and Drug Administration for treatment of relapsing-remitting MS. The FDA
has also approved ocrelizumab (OCREVUS , Genentech, Inc., San
Francisco, CA) to treat adults with relapsing forms of MS and primary
progressive MS. Beta interferon has been shown to reduce the number of
exacerbations and may slow the progression of physical disability. When
attacks do occur, they tend to be shorter and less severe. The FDA also has
approved a synthetic form of myelin basic protein, called copolymer I
(COPAXONE , Teva Pharmaceutical Industries LTD., Jerusalem, Israel),
for the treatment of relapsing-remitting MS. Copolymer I has few side
effects, and studies indicate that the agent can reduce the relapse rate by
almost one third. Other FDA approved drugs to treat relapsing forms of MS
in adults include teriflunomide and dimethyl fumarate. An
immunosuppressant treatment, Novantrone (mitoxantrone), is approved by
the FDA for the treatment of advanced or chronic MS. The FDA has also
approved dalfampridine (AMPYRA , Acorda Therapeutics, Inc., Ardsley,
NY) to improve walking in individuals with MS.
One monoclonal antibody, natalizumab (TYSABRI , Elan Pharma
International Limited, Shannon, Ireland), was shown in clinical trials to
significantly reduce the frequency of attacks in people with relapsing forms
of MS and was approved for marketing by the U.S. Food and Drug
Administration (FDA) in 2004. However, in 2005 the drug's manufacturer
voluntarily suspended marketing of the drug after several reports of
significant adverse events. In 2006, the FDA again approved sale of the drug
for MS but under strict treatment guidelines involving infusion centers where
patients can be monitored by specially trained physicians.
61
CA 03103661 2020-12-11
WO 2019/217552
PCT/US2019/031314
STP containing myelin basic protein (MBP), myelin oligodendrocyte
glycoprotein (MOG), truncated MBP, truncated MOG, analogues of MBP or
its truncated peptides, analogues of MOG or its truncated peptides, or any
combination thereof, may be used to induce tolerance in a subject against
these antigens. The STPs may include one or more of these antigens in the
core particle, and an immunomodulator in the tethered particle, to induce
antigen-specific tolerance in the subject. In some aspects, these STPs may
also include additional pharmaceutical agents in the core particle or the
tethered particle. Additional pharmaceutical agents include beta interferon,
ocrelizumab, copolymer I, dalfampridine, natalizumab, steroids, non-
steroidal anti-inflammatory agents, and any combinations thereof.
The STPs may be used in compositions to provide the
immunomodulator and the antigen at an effective amount and at an effective
time to induce antigen-specific tolerance in the subject.
2. Cancer
An STP for reducing one or more symptoms of a disease, such as
cancer, may include a particle with the core particle containing a cytokine
for
stimulating an immune response, and the tethered particle containing an
inhibitor, such as a checkpoint inhibitor, an anti-proliferative cancer
therapeutic, and/or a cancer antigen. Exemplary cancer antigens are listed
above.
3. Diabetes
Diabetes, or diabetes mellitus, is due to either the pancreas not
producing enough insulin or the cells of the body not responding properly to
the insulin produced. There are three main types of diabetes mellitus:
Type 1 Diabetes results from the pancreas failure to produce enough
insulin or active insulin; this form was previously referred to as "insulin-
dependent diabetes mellitus" (IDDM) or "juvenile diabetes",
Type 2 Diabetes begins with insulin resistance, a condition in which
cells fail to respond to insulin properly. As the disease progresses a lack of
insulin may also develop; this form was previously referred to as "non
insulin-dependent diabetes mellitus" (NIDDM) or "adult-onset diabetes"; and
62
CA 03103661 2020-12-11
WO 2019/217552
PCT/US2019/031314
Gestational diabetes, the third main form, occurs when pregnant
women, without a previous history of diabetes, develop a high blood sugar
level.
Type 1 diabetes must be managed with insulin injections. Type 2
diabetes may be treated with medications with or without insulin.
Gestational diabetes usually resolves after the birth of the baby.
People with type 1 diabetes need insulin therapy to survive. Many
people with type 2 diabetes or gestational diabetes also need insulin therapy.
Medications used for treating T2D include over 20 types of injectable
insulin, and orally administered drugs such as meglitinides, sulfonylureas,
metformin, canagliflozin, dapagliflozin, thiazolidinediones, pioglitazone,
rosiglitazone, acarbose, pramlintide, exenatide, liraglutide, long-acting
exenatide, albiglutide, dulaglutide, and dipeptidyl peptidase-4 (DPP-IV)
inhibitors (sitagliptin, saxagliptin, linagliptin). These agents are
collectively
referred to as "anti-diabetics".
STPs containing anti-diabetics and/or insulin may be used to better
manage diabetes. The STPs may be used to provide timed and sequential
release of these therapeutics following single administration, may be used to
better manage diabetes.
In other embodiments, the methods of using the STP compositions
may include methods of non-invasively imaging the target organ as a whole,
or distinct microenvironments within the target organ, such as pockets of
inflammation, leaky vasculature, or neoplasms. In these embodiments, the
methods include administering to a subject in need thereof a dosage unit of
the STP composition containing an effective amount of an imaging agent,
optionally with a therapeutic or prophylactic agent; delivering the effective
amount of the imaging agent to target tissue, such as skin, breast, brain,
bone, heat, lung, kidney, spleen, pancreas, liver, stomach, or colon;
optionally, releasing the effective amount of the imaging agent from the
nanoparticles at the target tissues; which results in enhanced detection of
target tissue, or a distinct microenvironment within the target tissue, via
non-
invasive imaging.
63
CA 03103661 2020-12-11
WO 2019/217552
PCT/US2019/031314
Imaging modalities suitable for detecting the STPs, and/or the agents
released from the STPs, include positron-emission tomography (PET),
computed tomography (CT), magnetic resonance imaging (MRI), ultrasound
imaging (US), and optical imaging. Suitable imaging agents (tracers)
include radionuclide-labeled small molecules, such as F-18
fluorodeoxyglucose, superparamagnetic iron oxide (SPIO), gadolinium,
europium, diethylene triamine pentacetic acid (DTPA), 1,4,7,10-
tetraazacyclododecane-1,4,7,10-tetraacetic acid (DOTA) and their
derivatives, gas, and fluorescent tracers. Such suitable modalities with
respective tracers are known in the art (Baum et al., Theranostics, 2(5)437-
447 (2012)).
The present invention will be further understood by reference to the
following non-limiting examples.
Examples
Dendritic cells exposed to different sequences of the model antigen,
OVA, and the mTOR inhibitor, rapamycin, loaded separately in
nanoparticles, exhibit different potencies in tolerance induction. DCs
exposed first to RAPA, then to antigen, expressed lower levels of positive
co-stimulatory markers, higher levels of negative co-stimulatory markers,
produced more anti-inflammatory cytokines, and induced a more potent
tolerogenic response overall compared to other sequences of administration.
DCs exposed to antigen prior to RAPA, or exposed to both agents
simultaneously were less tolerogenic. The results showed that, for effective
vaccine design, the temporal sequence of administration of antigen and
tolerogenic adjuvant plays a critical role in efficacy. The data show efficacy
of the particles for effective tolerogenic immunization or immunostimulatory
immunization.
Of the main professional antigen-presenting cells (APCs), the
dendritic cell (DC) is the most potent and is pivotal in initiating antigen-
specific immune responses. Through interactions with T lymphocytes, DCs
bridge innate and adaptive immunity and are key players in the development
64
CA 03103661 2020-12-11
WO 2019/217552
PCT/US2019/031314
of immunogenicity against pathogens and the maintenance of tolerance
towards self-antigen. The priming conditions under which DCs encounter
antigen greatly influences the elicited response. Effective immunogenic
vaccines rely on the inclusion of stimulatory adjuvant to serve as an
activation signal and initiate the process of DC maturation. This promotes
migration to the draining lymph nodes, facilitation of antigen presentation,
upregulation of costimulatory markers, and changes in cytokine expression
that are all critical to inducing a potent T cell response and enhancing
vaccine efficacy. Changes to any of these parameters alter the environment
in which antigen presentation occurs, influencing both the quality and
magnitude of the elicited T cell response. The choice of adjuvant can play a
vital role in shaping this environment by skewing the immature DC towards
a stimulatory or tolerogenic phenotype.
Examples show that co-delivery in a preferred sequence by
nanocarriers enhanced the magnitude and quality of the tolerogenic response.
Biotin-attached RAPA-cyclodextrin complexes (RAPA-CD) were
synthesized to decorate the surface of avidin-coated PLGA nanoparticles, as
the looser association of RAPA with cyclodextrin resulted in earlier release
compared to the antigen inside the core of the nanoparticles. The physical
characteristics of the resultant, STP, was similar to that of the other
conventional nanoparticles. Both in vitro and in vivo use showed that STP
induced tolerance through expansion of Tregs to the greatest extent. nTregs
or pre-existing Tregs in particular were selectively expanded, rather than
induction of iTregs de novo. Evaluation of STP in murine autoimmune
disease models revealed that STP was able to both prevent and reverse the
disease. Single-cell RNAseq suggested that APCs, particularly M2
macrophages, were most widely affected and presented antigen in the early
stages of STP injection. Depletion of macrophages and PD-Li completely
reversed the expansion of Tregs and tolerance, emphasizing the importance
of macrophages and overall selective targeting of APCs by STP as a
mechanism of action. Described is a unique platform that provides a path
CA 03103661 2020-12-11
WO 2019/217552
PCT/US2019/031314
forward for multivariable drug delivery applications that are effective due to
their spatiotemporal configuration.
Example 1. Spatial and temporal considerations in inducing antigen-
specific tolerance.
Dendritic cells (DCs) are professional antigen presenting cells that
are essential in developing an immune response to pathogens and tolerance
to self-antigens (Merad et al., Annual review of immunology, 31:563-604
(2013)). In the immune system, DCs are key players that bridge innate to
adaptive immunity through their interactions with T lymphocytes
(Maldonado and von Andrian. Advances in immunology, 108:111-65
(2010)). For a robust immune response, T cells require three signals from
DCs for activation and prolonged survival: (1) Interaction of the T cell
receptor (TCR) with processed antigen presented on the major
histocompatibility complex (MHC) I or II; (2) Activation of a co-stimulatory
marker on T cells, such as CD28; and (3) Secretion of cytokines that can
program T cells to be developed into a certain subset, such as TH1, TH2,
TH17, or Tregs (Sallusto and Lanzavecchia. Arthritis Research & Therapy,
4:S127-S132 (2002); Kapsenber. . Nature Reviews Immunology, 3:984
(2003)). DC's multifaceted ability to provide all required signals for T cell
function has attracted the use of DC vaccination for cancer immunotherapy
and induction of tolerance (Gross and Wiendl, Current opinion in
rheumatology, 25:268-74 (2013); Palucka and Banchereau. Nature Reviews
Cancer, 12:265 (2012)).
Immature DCs that have not been activated through phagocytosis of
an antigen express low levels of co-stimulatory markers, such as CD80 or
CD86 (Merad et al. Annual review of immunology, 31:563-604 (2013);
Dudek et al., Frontiers in Immunology, 4:438 (2013)). Some studies have
shown that tolerogenic DCs, despite having a similar surface marker profile
to immature DCs, are a distinct subset through production of anti-
inflammatory cytokines, such as IL-10, retinoic acid, and TGF-0. Several
methods of generating tolerogenic DCs have been proposed, such as
treatment of DCs with aryl hydrocarbon receptor ligand (Harden et al.,
66
CA 03103661 2020-12-11
WO 2019/217552
PCT/US2019/031314
Immunological investigations 41, 738-764 (2012); Quintana et al.,
Proceedings of the National Academy of Sciences, 107:20768-20773 (2010)),
IL-10, or rapamycin (Maldonado and von Andrian. Advances in immunology,
108:111-65 (2010); Bonifaz et al., J Exp Med, 196:1627-38 (2002); Raker et
al., Frontiers in Immunology, 6:569 (2015)).
Tolerogenic DCs are potent generators of CD4+ CD25+ Foxp3+ Tregs
(Maldonado and von Andrian. Advances in immunology, 108:111-65
(2010)), which suppress inflammation and establish self-tolerance
(Josefowicz et al., Annual review of immunology, 30:531-564 (2012)). Tregs
suppress inflammatory T cells in a cell-cell contact-dependent context (Sojka
et al., Immunology, 124:13-22 (2008), and cytokines TGF-r3 and IL-2 are
required for their maintenance. Adoptive transfers of Foxp3+ Tregs have
been efficacious in treatment of autoimmune diseases, such as type-1
diabetes, multiple sclerosis, and inflammatory bowel disease (Roncarolo et
al., Nature Reviews Immunology, 7:585 (2007)). Induction and expansion of
Tregs have been the overlapping goal for almost all immunotherapy for
autoimmune diseases.
Combinatory delivery of immunomodulatory agents and antigen,
such as RAPA and antigen, to the same DCs is now a well-established mode
of developing a tolerogenic response (Look et al., The Journal of clinical
investigation, 123, 1741-9 (2013)). Since biodegradable nanoparticles can
encapsulate the immunosuppressive agent and the antigen together,
nanoparticles have been considered as promising vehicles for treatment of
cancer (Gregory et al., Frontiers in cellular and infection microbiology, 3:13
(2013)), and autoimmune diseases (Maldonado et al., Proceedings of the
National Academy of Sciences, 112:E156-E165 (2015)).
Therefore, direct delivery of antigen and tolerogenic agent to antigen
presenting cells is a promising modality for induction of antigen-specific
tolerance needed for the treatment of autoimmune disease. In this modality,
antigen presentation by dendritic cells (DCs) is required for robust
stimulation and skewing of the antigen-specific T cell response. A central
67
CA 03103661 2020-12-11
WO 2019/217552
PCT/US2019/031314
question with this combinatorial approach is the timing and the location of
antigen delivery.
Materials and methods
Nanoparticle synthesis
Either OVA or RAPA was encapsulated in poly-lactic-co-glycolic
acid nanoparticles (50:50 monomer ratio) using water/oil/water double
emulsion method described by Fahmy et al. Biomaterials, 26:5727-5736
(2005). For RAPA encapsulation, 10% of the total PLGA polymer mass
(8mg of RAPA per 80mg of PLGA) was added directly to the polymer
dissolved in chloroform. For OVA encapsulation, 1.5 mg of OVA dissolved
in 200 pL of water was added drop-by-drop while PLGA in chloroform was
being vortexed. The primary emulsion containing dissolved RAPA or OVA
was sonicated, which was added drop-by-drop to 3 ml of water containing
5% poly-vinyl-alcohol (Sigma-Aldrich). The resulting double-emulsion was
sonicated to yield nano-sized droplets with encapsulated RAPA or OVA.
Solvent was removed by stirring at room temperature for 4 hours.
Nanoparticles were then washed three times in MilliQ water and lyophilized
for long-term storage. For each experiment, nanoparticles were prepared
fresh from lyophilized stocks and dissolved in PBS at a concentration of 10
mg/ml for in vitro experiments or in vivo injections.
PLGA nanoparticles were also prepared as follows. 60 mg of PLGA
(50:50, Durect Corp.) were dissolved in 3 mL of chloroform in a glass test
tube. For RAPA encapsulating NPs, 3 mg of RAPA (>99%, LC
Laboratories) was added directly to the polymer solution. A primary
emulsion was generated by adding 200 pL of water dropwise while
continuously vortexing the polymer solution. For OVA encapsulating NPs,
this water solution contained 2 mg of dissolved OVA. The primary emulsion
was sonicated using an Ultrasonic Processor GEX600 model probe at 38%
amplitude for a 10 s pulse, and then added dropwise to a continuously
vortexed glass tube containing 4 mL of a 4.7% PVA solution with 0.3125
mg/mL avidin-palmitate conjugate. The resulting double emulsion was
further sonicated with three 10 s pulses with 20 s breaks in an ice bath in
68
CA 03103661 2020-12-11
WO 2019/217552
PCT/US2019/031314
between, before being transferred to a beaker containing 200 mL of 0.25%
PVA. This solution was stirred at room temperature for 3 hours, after which
the hardened particles were washed tree times by cycles of pelleting at
18,000 r.c.f. and resuspension in MilliQ water. Washed NPs were flash-
frozen in liquid nitrogen and lyophilized for multiple days to enable long-
term storage. NPs were stored at -20 C until use and prepared from
lyophilized stocks for each experiment.
Characterization of nanoparticles
Nanoparticle size was quantified using the NANOSIGHT particle
tracking system (Nanosight, Ltd., Wiltshire, UK). Particle morphology was
captured by scanning electron microscopy (SEM). RAPA loading in
nanoparticles was calculated by dissolving RAPA nanoparticles in DMSO at
1 mg/ml, then adding 1N NaOH at a 50:50 ratio to degrade RAPA and yield
its ring-opened isomer. The formulation of the ring-opened isomer resulted
in a yellow solution, the intensity being dependent on the concentration of
RAPA. The absorbance was measured on the spectrometer and the
concentration of RAPA per mg of particle was calculated based on the
standard curve. Rapa loading was measured by diluting the DMSO solution
10-fold in 1 N NaOH to generate the degradation product, seco-RAPA,
which was then measured by its absorbance at 400 nm. OVA loading in
nanoparticles was calculated by dissolving OVA nanoparticles in DMSO,
then by performing a microBCA protein assay.
Animals and nanoparticle injections
Female C57BL/6J and OT-II mice were purchased from Jackson
Labs, at the age of 8-10 weeks. All animal work was performed under
protocols that have been approved by the Yale Institute of Animal Care and
Use Committee. For injections, nanoparticles were freshly prepared at 10
mg/ml concentration and each OT-II mouse was injected with either 2 mg of
empty PLGA nanoparticles or RAPA and OVA nanoparticles.
Cell culture
All isolated BMDCs or T cells were cultured in RPMI -1640 (Life
Technologies) supplemented with 10% FBS (Gibco), Pen/Strep, MEM
69
CA 03103661 2020-12-11
WO 2019/217552
PCT/US2019/031314
Vitamin solution, pyruvate, non-essential amino acids, and beta-
mercaptoethanol (Life Technologies).
Generation and isolation of BMDCs and OT-II T cells
Bone marrow-derived dendritic cells (BMDCs) were generated as
described by Zanoni et al. Generation of mouse bone marrow-derived
dendritic cells (BM-DCs) (2009). Briefly, bone marrow progenitor cells were
isolated from the femur of C57BL/6J mouse and cultured with media
containing 20 ng/ml of GM-CSF. Cells were replenished with fresh media
after 5 days of culture and collected after 48 hours of media replenishment.
Naïve CD4 T cells and T cells were collected from OT-II splenocytes by
using naïve CD4 T cell or CD3 T cell isolation kit (STEMCELL
Technologies), respectively.
Flow cytometry and analysis
When ready for flow cytometry (FACS) analysis, cells were
transferred to a 96-well U-bottom plate and spun at 500g for 5 minutes. Cells
were then washed with PBS and stained with LiveDead Zombie NIR
(Thermo Fisher) at 1:1000 dilution for 15 minutes in the dark. Cells were
washed two times with FACS buffer (PBS with 10% 1-BS) and then treated
with Fc block at 1:500 dilution for 15 minutes in the dark at 4 C. Cells were
then stained with fluorescent antibodies (eBiosciences or Biolegends) diluted
at 1:100 or 1:200 in FACS buffer for 15 minutes in the dark at 4C. After
staining, cells were washed twice and fixed in 1% PFA.
For intracellular staining, cells were fixed and permeabilized with
Fix/Perm buffer (Intracellular Fixation and Permeabilization Kit,
eBiosciences) overnight in 4 C. Cells were washed with Perm/Wash buffer
and then stained with Foxp3 antibody (eBioscience) for 45 minutes in the
dark. After washing with Perm/Wash, cells were placed in PBS for up to
24hrs before FACS analysis.
FACS was performed by either LSR-II (Becton Dickinson) or Attune
NxT flow cytometer. Sorting was performed on FACSAria (Becton
Dickinson). All FACS data was analyzed on FlowJo software (Tree Star Inc.,
Ashland, OR).
CA 03103661 2020-12-11
WO 2019/217552
PCT/US2019/031314
ELISA
Supernatants from cultured DCs were collected to measure TGF-r3
and IL-10 secretion by using ELISA kits (Becton Dickinson), following the
manufacturer's instructions. TGF-r3 was first activated by adding 0.4N HC1
for 1 hr in 37 C and then neutralizing with 1 M NaOH.
In vitro Treg suppressive assay
CD25+ Tregs were generated by culturing nanoparticle-treated
BMDCs with OT-II naïve CD4 T cells for 72 hours. CD25+ cells (suppressor
cells) were sorted on FACSAria and added to the mixture of DCs pulsed
with 0VA323-339 peptide and CFSE-stained OT-II T cells (responder cells).
The ratio of responder cells and suppressor cells were titrated. After 72hrs,
suppression was analyzed by gating out the suppressor cells and by
measuring the degree of CFSE dilutions, which showed proliferation of
responder cells. Percent suppression was calculated by dividing CFSE1
population of responder cells from the positive control (no suppressor cells)
and subtracting the resultant from 1. Results
Duration of soluble RAPA treatment,
but not soluble OVA, impacts DC phenotype
DCs are one of the best antigen presenting cells that express
costimulatory molecules and present antigens, which are modulated by
mTOR signaling and antigen processing, respectively. The duration of DC
exposure to RAPA and OVA affected the phenotype of DCs. DCs from the
bone marrow (BMDCs) were harvested and treated with 100 ng/ml of free
RAPA or 2 pg/ml of free OVA for either 72 hours or for 24 hours and
analyzed by FACS. In all following experiments, BMDCs were gated on
CD11c+, live cells, and surface markers of BMDCs were analyzed by flow
cytometry. Compared to BMDCs treated with RAPA for 24 hours (RAPA 24
hrs), BMDCs treated with 72 hours of RAPA (RAPA 72 hrs) showed
diminished expression of surface markers, such as PD-L1, CD80, CD86, and
MHC II (Figure 1A). However, no differences were observed for BMDCs
treated with OVA for various times (Figure 1B), showing that duration of
71
CA 03103661 2020-12-11
WO 2019/217552
PCT/US2019/031314
RAPA exposure to DCs is a crucial aspect in downregulation of the
costimulatory molecules and antigen presentation.
Both OVA and RAPA are expected to interact with DCs through the
antigen processing and presentation pathways, and through mTOR signaling,
respectively, and its subsequent effects on costimulatory marker expression
and cytokine production. BMDCs were treated with soluble agents (100
ng/ml of RAPA or 2 jig/ml of OVA) for 24 or 72 hours. The phenotypic
profile, as assessed by expression of canonical DC maturation markers (PD-
L1, CD80, CD86, and MHC II) was analyzed by flow cytometry analysis
(Gating strategy for analysis was on live, CD11c+ dendritic cells). Extended
duration of BMDC exposure to RAPA (RAPA 72 hrs vs RAPA 24hr5)
resulted in reduced expression of all markers (Figure 1A). In contrast,
irrespective of the exposure duration, no differences in marker expression
were observed for BMDCs treated with the antigen (OVA) alone (Figure
1B).
Sequence matters: Treatment with free RAPA prior to free OVA is
preferred for downregulation of DC surface markers
The kinetics of mTOR inhibition by RAPA and OVA presentation on
MHC II are quite different, emphasizing that there is a need for fine tuning
of RAPA and OVA exposure kinetics for maximal tolerogenic response.
While RAPA is a highly potent immunosuppressant, presence of an antigen
and its loading can upregulate costimulatory markers and weakly activate
DCs, suggesting that two modulators required for antigen-specific tolerance
counterbalance each other in DC physiology. The importance of sequential
RAPA and OVA delivery was investigated by comparing BMDCs treated
with RAPA or OVA for 72 hrs and OVA or RAPA for 24 hrs, respectively.
RAPAE/OVAL BMDCs expressed the lowest levels of PD-Li (co-inhibitory
surface marker), CD80, CD86 (co-stimulatory surface markers), and MHC II
(Figure 1D). There were no statistically significant differences between free
RAPAE/OVAE versus free RAPAL/OVAL (Figures 1C and 1D), showing that
a preferred sequential release of RAPA and OVA exists for most effective
tolerance. These results show that free RAPA treatment followed by free
72
CA 03103661 2020-12-11
WO 2019/217552
PCT/US2019/031314
OVA treatment is most preferred for lower expression of co-
stimulatory/inhibitory molecules and antigen presentation.
Synthesis of PLGA nanoparticles containing RAPA or OVA,
characterization, and in vitro validation
A nanoparticle platform to deliver RAPA and OVA with sustained
release was developed and their functionalities characterized. Nanoparticles
were approximately 250 nm in diameter, with or without RAPA or OVA
encapsulation. The nanoparticles were evenly spherical overall by SEM.
Loading of OVA and RAPA were approximately 26.7 lig and 9.8 lig per mg
of particle, which yielded around 53.4% and 19.6% encapsulation efficiency,
respectively (Table 3). In proceeding in vitro experiments, nanoparticles
were added at a concentration of 100 jig/m1 to normalize to free
concentration of 100 ng/ml and 2 jig/ml of free RAPA and free OVA.
The dynamic light scattering (DLS)-generated size distributions of
OVA and RAPA nanoparticles, and showed Z-average of 250.3 nm, standard
deviation of 3.72, and polydispersity index of 0.12.
Table 3. Loading of PLGA nanoparticles containing OVA or RAPA.
OVA Loading RAPA Loading
(ng/mg NP) (pg/mg NP)
OVA 26.7 4.03 0
RAPA 0 9.8 0.20
To ascertain that the observed effects are not due to PLGA
nanoparticles alone, DCs were treated with either PBS or blank PLGA
nanoparticles. DCs treated with empty nanoparticles showed no difference in
expression of PD-L1, CD80, CD86, and MHC II, indicating that PLGA
nanoparticles by themselves have no intrinsic effect on BMDC phenotype
(Figure 1E).
73
CA 03103661 2020-12-11
WO 2019/217552
PCT/US2019/031314
Treatment of DCs with RAPA nanoparticles prior to OVA nanoparticles
increases PD-Li expression, but decreases co-stimulatory molecules
Validated RAPA and OVA nanoparticles were added to BMDCs for
either 72 hrs or 24 hrs, and expression of surface markers was analyzed by
FACS. RAPA 72 hr-pulsed BMDCs expressed lower levels of co-stimulatory
molecules CD80 and CD86 compared to DCs treated with blank
nanoparticles (Figures 2A and 2B), which was consistent with observations
from Figures 1A-1D that prolonged exposure to RAPA decreases CD80,
CD86, and MHC II. Co-inhibitory molecule PD-Li was increased by longer
exposure to RAPA nanoparticles (Figures 2A and 2B). Similarly to free
OVA, prolonged OVA nanoparticle exposure had no major effect on BMDC
surface markers (Figures 2A and 2B), showing that prolonged RAPA
nanoparticle delivery upregulates PD-Li while lowering expression of co-
stimulatory markers and antigen presentation. Because prolonged RAPA
delivery by nanoparticles increased PD-L1, contrary to free RAPA, this
suggested that RAPA nanoparticles could be more potent than free RAPA in
induction of tolerance.
The influence of sequential delivery of RAPA and OVA by
nanoparticles on DC phenotype was investigated. BMDCs were treated with
either RAPA or OVA nanoparticles, followed by OVA or RAPA
nanoparticles, respectively. RAPAE/OVAL group demonstrated considerably
lower expression of costimulatory molecules, CD80 and CD86, than
RAPAL/OVAE, RAPAE/OVAE, or RAPAL/OVAL (Figure 3A). However,
most importantly, RAPAE/OVAL had more PD-L1' BMDC population
compared to RAPAL/OVAE, RAPAE/OVAE, and RAPAL/OVAL (Figure 3A).
Similarly to the free RAPA and OVA experiment, no changes were seen in
RAPA E/OVAE and RAPAL/OVAL DCs, implying that sequence of RAPA
and OVA delivery by nanoparticles can be a key determinant in DC
phenotype. In addition, RAPAE/OVAL showed a slight increase in MHC
population (Figure 3A), which suggests that more efficient antigen
presentation and induction of T cells could be expected.
74
CA 03103661 2020-12-11
WO 2019/217552
PCT/US2019/031314
Delivery of RAPA nanoparticle followed by OVA
nanoparticle generates PD-Llhi tolerogenic DCs
Tolerogenic DCs are a subset of DCs that exhibit immunoregulatory
functions and induce tolerance by fostering Treg development. Tolerogenic
DC's importance in immune tolerance has been accentuated in several
autoimmune disease models, including Graft vs. Host Disease (Stenge et al.,
Blood, 119:5088-103 (2012)). These immunoregulatory DCs are defined as
DCs that express lower levels of MHC and co-stimulatory molecules, while
producing high levels of co-inhibitory molecules, such as PD-Li (Mildner
and Jung, immunity.40(5):642-656 (2014)).
Gating on CD11c+MHC Ib0MHC Ir0pp-L1111CD8010CD8610 DC
populations revealed that RAPAE/OVAL DCs induced the development of
tolerogenic DCs (Figure 3B). In addition, nanoparticle RAPAE/OVAL
showed superiority over free RAPAE/OVAL (Figure 3B), showing that
nanoparticle delivery of RAPA and OVA is superior in developing
tolerogenic DCs through upregulation of PD-Li. It was reported that
tolerogenic DCs share similar surface marker profiles to immature DCs;
however, in addition to low levels of MHC II and co-stimulatory molecules,
a well-noted characteristic of tolerogenic DCs is secretion of anti-
inflammatory cytokines, such as TGF-r3 and IL-10 (Raker et al., Frontiers in
Immunology, 6, 569 (2015)). Nanoparticle RAPAE/OVAL DCs produced the
highest levels of TGF-r3 and IL-10 (Figure 3C-3D), indicating that
tolerogenic DCs produced by earlier delivery of RAPA nanoparticles are
anti-inflammatory.
Consistent with results from the soluble agents, early exposure to
RAPA NPs led to the most significant decreases in CD80 and CD86.
However, with nanoparticle-mediated delivery, these lower levels of
costimulatory receptors were paired with the highest upregulation of the co-
inhibitory receptor, PD-Li. Defining a tolerogenic DC as a PD-Li high,
CD80/86 low population, both soluble and NP treatment, priming with
RAPA prior to OVA exposure (RAPAE/OVAL) was best at inducing this DC
phenotype (Figures 3A and 3B).
CA 03103661 2020-12-11
WO 2019/217552
PCT/US2019/031314
This result was far more pronounced when RAPA and OVA were
delivered by nanoparticles. The RAPAE/OVAL group was the only group that
yielded significant tolerogenic profile enhancements, supporting that
delivery sequence of adjuvant and antigen is an important determinant of DC
response. This was further supported by the observation that this delivery
sequence also promoted DCs to secrete the highest levels of the anti-
inflammatory cytokines, IL-10 and TGF-r3 (Figures 3C-3D).
Tolerogenic DCs produced by preferential, earlier release of RAPA
nanoparticles induce development of highly suppressive antigen-specific
Tregs
CD4+ Tregs are major players of immune modulation and suppress
inflammatory effector T cells. Tolerogenic DCs are major inducers of Tregs
through production of anti-inflammatory cytokines such as TGF-r3 and IL-10
(Maldonado and von Andrian. Advances in immunology, 108:111-65
(2010)). To test this, nanoparticle-pulsed DCs were co-cultured with
transgenic T cells that express T cell receptors specific for MHC II-loaded
OVA (0T-II). After three days of co-culture, OT-II T cells were collected
and analyzed for CD25 Foxp3+ expression by FACS for identification of
Tregs.
Nanoparticle RAPAE/OVAL DCs increased the frequency of Tregs by
two-fold compared to RAPAE/OVAE or RAPAL/OVAE DCs (Figure 4A). No
difference was observed in Treg induction between RAPAE/OVAE and
RAPAL/OVAL, emphasizing the importance of sequential delivery of RAPA
and OVA. Only a modest increase of Treg proliferation was observed in
RAPAE/OVAL DCs (Figure 4B). Therefore the preferred sequential delivery
of RAPA and OVA can also generate antigen-specific CD25 Foxp3+ Tregs,
which are essential for induction of immune tolerance.
The suppressive ability of Tregs can be measured by the decrease of
effector T cell proliferation when co-cultured with Tregs (Collison and
Vignali, In Vitro Treg Suppression Assays. Methods in Molecular Biology
(Clifton, N.J.), 707:21-37 (2011)). To quantitate the antigen-specific
suppression mediated by OVA-specific Tregs generated by nanoparticle-
76
CA 03103661 2020-12-11
WO 2019/217552
PCT/US2019/031314
pulsed DCs, CD25+ T cells were sorted after generating Tregs, as described
for Figure 4A. Sorted CD25+ T cells were transferred to 0VA323-339 peptide
pulsed splenic CD11c DCs cultured with CFSE-stained OT-II T cells. The
inhibitory effect of transferred CD25+ T cells on OT-II T cell proliferation
was measured by quantifying CFSE dilution of OT-II T cells. Only a subset
of CD25+ T cells are suppressive, as CD25 is also a marker for T cell
activation after experiencing an antigen. As a result, CD25+ T cells
generated by OVA nanoparticle-pulsed DCs were added as a baseline
control. It was found that Tregs generated by RAPA and OVA nanoparticle-
pulsed DCs were much more suppressive compared to Tregs generated by
OVA nanoparticle-pulsed DCs (Figure 4C). Altogether, these results show
that nanoparticle-pulsed DCs induced development of highly suppressive
antigen-specific Tregs.
The tolerogenic DCs generated by the RAPAE/OVAL NP delivery
were tested for inducing functionally suppressive, OVA-specific Tregs. To
test this, NP-treated DCs were co-cultured sequentially with transgenic T
cells expressing OVA-specific T cell receptors (0T-II cells). After three
days, all co-cultures were observed to have expansion of CD25+ Foxp3+
Tregs, with exception of a control group, in which the DCs were primed with
empty nanoparticles (Figure 4A). This expansion was significantly greater in
the RAPAE/OVAL co-culture group (Figure 4A). No significant differences
in Treg expansion were observed between cases where DCs were treated
simultaneously with antigen and adjuvant (RAPAE/OVAE, RAPAL/OVAL)
or when OVA exposure preceded RAPA treatment (RAPAL/OVAE). An
increase of Treg proliferation was observed with the RAPAE/OVAL co-
culture (Figure 4B). Given that Tregs are major player in immune
modulation that function to suppress inflammatory effector cells, the impact
of sequential DC treatment on Treg induction translated to an enhanced
effect in suppression of the inflammatory response. To explore the effects on
antigen-specific suppressive capacity introduced by temporally staggering
antigen and adjuvant, the decrease of effector T cell proliferation when co-
cultured with the induced Tregs was assessed. CD25+ Tregs were sorted
77
CA 03103661 2020-12-11
WO 2019/217552
PCT/US2019/031314
after Treg induction in the initial co-culture and then added to a secondary
co-culture containing both splenic CD11c DCs pulsed with the 0VA323-339
peptide and freshly isolated, CFSE-labeled OT II T cells. CD25+ Tregs
generated by RAPA and OVA NP-pulsed DCs displayed about four times
more suppressive function than CD25+ Tregs generated by only OVA NP-
pulsed DCs (Figure 4C). However, with the normalization in suppressor to
effector ratio contained within the in vitro Treg functional assay protocol,
it
became clear that while sequence of delivery may affect the amplitude of the
promoted Treg expansion, the Tregs generated have potent suppressive
capacity regardless of the DC priming sequence.
Preferred sequential delivery of RAPA and OVA in vivo
highly increases PD-L1"d antigen presenting cells
While co-delivery of RAPA and OVA in vivo has been described in
many studies, the relevance of sequential delivery of RAPA and OVA on
tolerance induction has not been fully elucidated in mice. It was verified
whether earlier delivery of RAPA would enhance PD-L1' antigen presenting
cells in vivo.
Animals were vaccinated with RAPA and OVA NPs according to the
staggered sequences used in all in vitro studies. PD-Li expression in
RAPAE/OVAL macrophages and DCs was increased more than five-fold
compared to control (Figures 5A and 5B), showing that mice receiving
RAPA nanoparticles prior to OVA nanoparticles develop the highest levels
of tolerogenic antigen presenting cells, consistent with the in vitro results.
Although the differences in co-stimulatory markers CD80 and CD86
were not statistically significant between the groups, PD-Li expression in
RAPAE/OVAE macrophages and DCs were increased by more than five-fold
compared to control (Figures 5A and 5B). Increased PD-L1' antigen
presenting cells suggested that mice receiving RAPA nanoparticles prior to
OVA nanoparticles develop tolerogenic antigen presenting cells, consistent
with in vitro results, and could program a tolerogenic response in vivo.
These results show that in a combinatory delivery system of RAPA
and OVA, RAPA (immunomodulatory agent causing tolerance) delivery
78
CA 03103661 2020-12-11
WO 2019/217552
PCT/US2019/031314
prior to OVA (antigen) is preferred for induction of tolerance, and that
sequential delivery of immunosuppressive agent and antigen should be
considered for most effective tolerogenic priming of DCs and T cells for
treatment of autoimmune diseases.
Colocalizing antigen and adjuvant to the same DC is essential for
qualitative control over the nature of the immune response and the desired
vaccination outcome. This has led to the emergence of nanocarrier
technologies in vaccine development. Such carriers afford enhanced
accumulation of antigen in APCs, cellular colocalization of antigen and
adjuvant, and, ultimately, the potential to skew the DC response in an
immunogenic or tolerogenic manner depending on the choice of adjuvant.
The combination of a tolerogenic adjuvant, such as rapamycin
(RAPA), with antigen is a promising strategy for the induction of antigen-
specific tolerance. However, an appreciation for the different mechanisms of
action of the two primary vaccine components highlights that simply meeting
the "spatial colocalization criterion" may be insufficient for achieving an
effective tolerogenic response. That is, simple co-delivery of both agents
may not harmonize with the kinetic differences in the cellular responses to
antigen and adjuvant. While antigen processing and presentation begins
within minutes of antigen exposure, the tolerogenic effects of an agent like
RAPA involve integrated changes of intracellular signaling and gene
expression that require significant time. Within the context of this
kinetically-staggered response, the temporal order of exposure was adjusted
to yield maximal responses.
Consistent with previous results, the nanoparticle-mediated delivery
of RAPA and OVA was superior to delivery of the soluble agents. Earlier
delivery of RAPA by nanoparticles increased the tolerogenic DC population,
through upregulation of PD-L1, decreased expression of the co-stimulatory
molecules CD80 and CD86, and increased secretion of the
immunosuppressive cytokines IL-10 and TGF-0. The earlier delivery of
RAPA to DCs also provided increased production of functionally
suppressive Tregs.
79
CA 03103661 2020-12-11
WO 2019/217552
PCT/US2019/031314
Use of nanoparticles in vaccine formulation is largely fueled by the
ability of such systems to facilitate the co-localization of multiple
therapeutic
agents at the cellular level. The ability of a vaccine to initiate a desired T
cell
response, whether immunogenic or tolerogenic, is dependent on cis-priming
of the APC that will engage with the responding T cell at the immunological
synapse. An optimal outcome will be realized only when the APC that
encounters, engulfs, processes and presents the antigen of interest also
encounters the adjuvant that has been included to skew the immunological
response in a particular direction. Multiple reports have demonstrated the
efficacy in the generation of antigen-specific tolerance of nanoparticle
systems that co-encapsulate antigen with the tolerogenic adjuvant, RAPA.
These studies highlight the immunosuppressive properties of the mTOR
inhibitor, showing that RAPA treatment of APCs causes these cells to
assume a tolerogenic phenotype through the downregulation of positive
costimulatory markers, upregulation of negative costimulatory markers,
inhibition of antigen processing and presentation, and the increased
production of immunosuppressive cytokines. When antigen is co-delivered
in this context, this results in an antigen presentation interaction and
environment that favor the differentiation and proliferation of Tregs over
effector T cells.
With the ability to execute selective dampening of immune system
function, antigen-specific Tregs are widely believed to be the therapeutic
target for intervention in autoimmune disease and avoidance of transplant
rejection. While the antigen-RAPA NP has demonstrated efficacy in multiple
animal models of autoimmune disease, it was unknown whether the kinetics
of delivery of the two encapsulated agents could be tuned to yield an
effective tolerogenic response. It is shown here that staggered delivery, in
which DCs are exposed to RAPA before OVA, results in enhanced
generation of tolerogenic DCs and subsequent antigen-specific T cell
induction (Figures 6A-6C).
CA 03103661 2020-12-11
WO 2019/217552
PCT/US2019/031314
Example 2. Synthesis of STP with spatial and temporal release of agents.
Spatiotemporally-Tuned Particles (STP), which achieve the
preferential sequential release of co-localized rapamycin and antigen, were
superior to the co-encapsulated antigen/RAPA and antigen-only
nanoparticles in development of CD4+ regulatory T cells (Tregs). In mice,
STP also enhanced tolerance through expansion of naturally occurring Tregs
(nTregs). STP prevented and cured mice from EAE. Furthermore, single-cell
RNAseq revealed that macrophage type-2 (M2) was systemically increased
as a result of STP administration in mice. Depletion of macrophages and PD-
Li expressing cells diminished the expansion of nTregs in STP-treated mice,
highlighting the importance of STP-uptaking macrophages and the co-
inhibitory biomarker PD-Li.
Materials and methods
The STP containing OVA in the core particle and rapamycin (RAPA)
in the tethered particle were prepared as follows. OVA was encapsulated in
poly-lactic-co-glycolic acid nanoparticles as described in Example 1. For
OVA encapsulation, 1.5 mg of OVA dissolved in 200 uL of water was added
drop-by-drop while PLGA in chloroform was being vortexed. The primary
emulsion containing dissolved RAPA or OVA was sonicated, which was
added drop-by-drop to 3 ml of water containing 5% poly-vinyl-alcohol
(Sigma-Aldrich) and 250 uL of 5 mg/ml avidin-palmitate. The resulting
double-emulsion was sonicated to yield nano-sized droplets with
encapsulated RAPA or OVA. Solvent was removed by stirring at room
temperature for 4 hours. Nanoparticles were then washed three times in
MilliQ water and lyophilized for long-term storage.
The resulting nanoparticles were attached to biotin-PEG-
Cyclodextrin-RAPA complex by avidin-biotin interaction. Specifically, STP
was synthesized through binding of avidin coated nanoparticles with biotin-
RAPA-cyclodextrin complex. Biotin-RAPA-cyclodextrin (RAPA-CD)
complex was formed by mixing of Biotin-PEG-NHS (EZ-link, Thermo
Fisher Scientific) with amino-P-cyclodextrin (6-monodeoxy-6-monoamino
hydrochloride) at 1:1 molar ratio, overnight at 4 C. The stable product,
81
CA 03103661 2020-12-11
WO 2019/217552
PCT/US2019/031314
biotin-PEG-0-cyclodextrin was dialyzed overnight to remove any unreacted
byproducts. Purified product was then mixed with RAPA at a 1:1 molar
ratio, filtering out excess, unbound RAPA through a 40-um strainer, and was
lyophilized again and added to avidin-palmitate-coated nanoparticles. The
amount of RAPA incorporated into cyclodextrin was quantified by reading
the product dissolved in DMSO at 400 nm wavelength. The amount of
RAPA-CD added to particles was always normalized to the amount of
RAPA loaded in antigen/RAPA particles.
For each experiment, nanoparticles were prepared fresh from
lyophilized stocks and dissolved in PBS at a concentration of 10 mg/ml for
in vitro experiments or in vivo injections. The general method steps for
forming the STP is presented in Figures 8A and 8B.
Nanoparticle size was quantified using the NANOSIGHT
(NanoSight Ltd, London, U.K.) particle tracking system (NanoSight, Ltd.,
Wiltshire, UK). Particle morphology was captured by scanning electron
microscopy (SEM). RAPA loading in nanoparticles was calculated by
dissolving RAPA nanoparticles in DMSO at lmg/ml, then adding 1N NaOH
at a 50:50 ratio to degrade RAPA and yield its ring-opened isomer. The
formulation of the ring-opened isomer resulted in a yellow solution, the
intensity being dependent on the concentration of RAPA. The absorbance
was measured on the spectrometer ( 400 nm wavelength on a
spectrophotometer (Bio-rad)) and the concentration of RAPA per mg of
particle was calculated based on the standard curve. OVA loading in
nanoparticles was calculated by dissolving OVA nanoparticles in DMSO,
then by performing a microBCA protein assay.
The release profiles for nanoparticles were obtained by dissolving
nanoparticles in PBS and leaving in 37 C for the duration of each timepoints.
The supernatant was collected and antigen was quantified by microBCA. For
RAPA, the supernatant was further mixed with Tween-80 and PEG400 to
fully dissolve the RAPA.
82
CA 03103661 2020-12-11
WO 2019/217552
PCT/US2019/031314
Results
The STP (OVA-RAPA) showed spatial and temporal release of both
agents, as shown in Figures 7A-7E, 8C, and 8D.
Figures 7A-7E are graphs showing the differences in regulatory T
cell expansion (Figure 7A), IL-2 secretion (Figure 7B), or T cell division
(Figures 7C, 7D, and 7E) when DC are incubated with a mix of nanoparticles
(NP) containing either antigen ovalbumin (OVA) or rapamycin (RAPA)
(Mix), or with NP containing both OVA and RAPA in the same NP (Co).
Figure 7A shows percent expansion of CD4+CD25+FoxP3+ regulatory T
cells in the presence of soluble OVA+RAPA in solution, or Mix, or Co, over
incubation time (h). Figure 7B is a graph showing secretion of mouse IL-2
(mIL-2) by CD4 OT-II T cells over time (h) when the cells are incubated
with OVA NP, Mix, or Co. Figures 7C and 7D show the cell division plots
for CD4 OT-II T cells incubated with Mix or Co over incubation time (h),
and Figure 7D is a graph of the percent divided (% Divided) CD4 OT-II T
cells from Figures 7C and 7D. Figures 7A-7E demonstrate one of the spatial
aspects of directing the immune response with STP.
Figures 8C and 8D are graphs showing the percent (%) Total Release
of Rapamycin (Figure 8C) and Ovalbumin (Figure 8D) from PLGA NP
containing the antigen OVA and RAPA (1), or STP containing OVA in the
core particle and RAPA in the tethered particle (2).
The spatiotemporal configuration of RAPA and antigen was as
follows: (1) the preferred sequential release of RAPA (early) and antigen
(late); (2) the co-spatial distribution of RAPA and antigen in a single
particle
(Figures 8A and 8B). To ensure normalization of RAPA and antigen loading,
RAPA-CD added to STP was equivalent to the amount of RAPA loaded in
antigen/RAPA co-loaded nanoparticles (OVA/RAPA). The nanoparticles,
including STP, were similar in size, zeta potential, loading, and shape to
each
other (Table 4). STP released RAPA faster than OVA/RAPA nanoparticles,
which contain both OVA and RAPA encapsulated in the core of the PLGA
nanoparticles (Figures 8C and 8D). The release rate of OVA in STP and
OVA/RAPA was the same (Figure 8D), showing that STP fully satisfied the
83
CA 03103661 2020-12-11
WO 2019/217552
PCT/US2019/031314
favorable spatiotemporal condition through earlier release of RAPA from a
single particle.
The release rate of RAPA and OVA being different in single veresus.
co-encapsulated particles due to steric hindrance caused when two agents are
both released from the core of the particle was investigated. No discernable
difference of RAPA and OVA release between single-encapsulated RAPA or
OVA particles and co-loaded OVA/RAPA particles was detected (Figures
8E and 8F).
Table 4. Size, zeta potential, loading of the nanoparticles and STP.
Blank OVA OVA/RAPA STP
Size 217.4 7.86 245.4 1.45 206.03 3.13 271.3
4.99
Zeta
-26.76 5.99 -22.43 5.45 -22.13 5.39 -17.93 3.82
Potential
Antigen
Loading 0 28.76 22.47 28.76
(rig/mg NP)
RAPA
Loading 0 0 8.69 8.69
(rig/mg NP)
Example 3. STP (OVA-RAPA) suppress IFN-gamma producing cells in
vitro.
Materials and methods
PLGA particles without agent (blank NP), with OVA only (OVA
NP), with OVA and RAPA incorporated in the same PLGA particles
(OVA/RAPA NP), and STP containing OVA in the core particle and RAPA
in the tethered particle, were generated as described in Examples 1 and 2.
PLGA particles containing TGF-beta and IL-2 in the same particle were
generated by a similar method.
Results
The results are presented in Figures 9A and 9B.
Figures 9A and 9B are graphs showing percent IFN-gamma
producing (% IFN-g+) CD4+ T cells in vitro when the cells are incubated
with Blank NP (PLGA NP only), OVA NP (PLGA NP containing OVA),
OVA/RAPA NP (PLGA NP containing OVA and RAPA in the same NP), or
STP (containing OVA in the core particle and RAPA in the tethered particle)
84
CA 03103661 2020-12-11
WO 2019/217552
PCT/US2019/031314
alone (Figure 9A), or in the presence of PLGA NP containing TGF-beta and
IL-2 in the same NP (Figure 9B).
The tolerogenic effect of STP in vitro was investigated. OT-II
splenocytes treated with STP for three days had the highest percentage of
Tregs, but the lowest population of IFNg producing cells (Figures 9A and
9C), showing that delivery of RAPA and antigen in an effective
spatiotemporal configuration can enhance induction of tolerance. Previous
literatures implied that induced Tregs are generally polyclonal and not
antigen-specific (Adair et al., Front Immunol, 8:1117 (2017)), suggesting
that STP-generated Tregs in vitro are not antigen-specific. To address the
possibility of STP favoring expansion of polyclonal Tregs, the T cell
receptor (TCR) of Tregs was investigated. The proportion of Va2+\1135+ T
cells was similar in STP-induced Tregs compared to Tregs in OT-II, showing
that STP-induced development of Tregs was not biased exclusively to
polyclonal Tregs and also can establish antigen-specific tolerance (Figure
9D).
Example 4. STP (OVA-RAPA) enhance Treg development in vitro
Materials and methods
Methods for studies in Examples 4-9:
Mice. All mice were bred at Yale University in accordance with the
guidelines of the Institutional Animal Care and Use Committee (IACUC).
The following mice breeding pairs of were purchased from Jackson
Laboratory: C57BL/6J, CD45.1, OT-II, RAG1-/-, and TCRImG. Foxp3 fate
mapping mice were generated. All mice were genotyped by suggested
primers on Jackson Laboratory. Females of 8-14 weeks of age were used in
all experimental procedures unless otherwise stated.
Isolation of cells from harvested animal tissues. Spleens and lymph
nodes were dissociated and filtered through a 40-um strainer. Large
intestines (LI) were isolated by incisions, manually inverted to expose the
inner lumen and the lamina propia, and washed with DTT and EDTA for 15
mins in 37 C. Supernatant was separated for analysis of intestinal epithelial
cells. LIs were then digested by Collagenase Type II (Gibco) and Dispase
CA 03103661 2020-12-11
WO 2019/217552
PCT/US2019/031314
(Gibco) for 45 mins in 37 C. Digested Us were filtered through 100-um and
40-um strainer, and then stained by antibodies for analysis by flow
cytometry. For isolation of the central nervous system (CNS), brain and
spinal cord was isolated from mice. Harvested CNS were passed through 40-
um strainer and lymphocytes/neutrophils were collected by Percoll gradient
(Sigma). Isolated cells were stained by antibodies and analyzed by flow
cytometry.
Flow cytometry and sorting. Harvested cells were spun down and
washed with flow cytometry buffer (2% FBS in PBS). Fc receptors of cells
were blocked with Fc block (Biolegends) at 1:500 dilution on ice for 10
minutes. After washing, cells were incubated on ice for 10 minutes with
fluorophore-labelled antibodies for staining of cell surface markers. All cell
surface markers were stained at 1:200 dilution in flow cytometry buffer.
Intracellular staining was performed by fixation and permeabilization of cells
with the eBioscience Foxp3/Transcription Factor Staining kit at a 1:100
dilution. The following antibodies from BioLegends were used: CD45.1,
CD45.2, CD45RB, CD4, TCRO, NK1.1, 5T2, CD103, Valpha2, Vbeta5,
CD71, CD44, CD11c, CD11b, F4/80, Ly6G, CD8a, CD205, CD206, IFNg,
IL-17A, Helios, Foxp3, RORgt, GATA3, GM-CSF. Stained cells were
analyzed on LSRII flow cytometer (BD Biosciences, San Jose, CA) and
FlowJo software (Tree Star, Ashland, OR). Cell sorting was performed on
Aria II cytometer (BD Biosciences) after staining cells with the
abovementioned antibodies.
DC and T Cell culture in vitro. Harvested primary splenocytes were
cultured in complete medium, which was made in RPMI (Gibco) with 10%
FBS (Gibco), 2% Penicillin/Streptomycin (Thermo Fisher Scientific), 1X
MEM Non-Essential Amino Acid Solution (Gibco) and 1X pyruvate
(Gibco). For co-culture in vitro experiments, isolated DCs were pulsed with
indicated nanoparticles for overnight. Nanoparticles were washed off by
centrifugation, and DCs were cultured with T cells at 1:5 ratio. TGF-0/IL-2
nanoparticles were added to the co-culture at 100 ug/ml. After 72 hours,
cells were washed and prepared for analysis by flow cytometry.
86
CA 03103661 2020-12-11
WO 2019/217552
PCT/US2019/031314
Statistical analysis. Statistical significance was determined by
performing unpaired t-test, provided by Prism 7 (Graphpad; La Jolla, CA). P-
values less than 0.05 were determined significant.
PLGA particles without agent (blank NP), with OVA only (OVA
NP), with OVA and RAPA incorporated in the same PLGA particles
(OVA/RAPA NP), and STP containing OVA in the core particle and RAPA
in the tethered particle, were generated as described in Example 1. PLGA
particles containing TGF-beta and IL-2 (TGFb/IL2 NP) in the same particle
were generated by a similar method.
The BMDCs pulsed with particles, activated with LPS for 4 hours,
washed, co-cultured with OT-II cells. The co-culture was incubated with
Blank NP (PLGA NP only), OVA NP (PLGA NP containing OVA),
OVA/RAPA NP (PLGA NP containing OVA and RAPA in the same NP), or
STP (containing OVA in the core particle and RAPA in the tethered particle)
in the presence of PLGA NP containing TGF-beta and IL-2 in the same NP.
The cells were then analyzed by flow cytometry gating on
CD4+CD44+CD69+ OT-II cells and detecting CD25+ and Foxp3+ cells.
Results
The results are presented in Figure 9C. The percent increase in
CD25+Foxp3+ T reg cells is shown.
Example 5. STP (OVA-RAPA) enhance Treg population in vivo.
Materials and methods
At day 0, C57BL6/J mice were injected four times with either PLGA
NP containing OVA and RAPA in the same particle (OVA/RAPA), or STP
(containing OVA in the core particle and RAPA in the tethered particle) at 2
mg. On day 7, the mice were sacrificed, spleens extracted, and
splenocytes co-cultured with naive CD+0T-II cells in the presence of 10 pg
OVA and PLGA NP containing TGF-beta/IL-2/Butyrate in the same NP. On
day 10, the cells were harvested and analyzed by FACS for the percent of
Foxp3+ cells (%Foxp3+) among the CD4+0T-II T cells.
87
CA 03103661 2020-12-11
WO 2019/217552
PCT/US2019/031314
On day 7, the isolated cells were splenocytes incubated with
mitomycin C (25ug/m1), co-cultured with CFSE-stained with CD4 OT-II in
ug/m1 OVA peptide media, with or without TI.
Results
5 The results from the FACS analysis are shown in Figure 11B.
Example 6. Systemic expansion of CD4+nTreg population in vivo in
response to STP in steady state.
Materials and methods
Figure 12A is a diagram showing the experimental setup used to
10 obtain the data in Figures 12B-12G. At days 0, 2, 4, and 6 CD45.2 OT-II
mice were injected i,p, with either PLGA NP containing OVA and RAPA in
the same particle (OVA/RAPA), or STP (containing OVA in the core
particle and RAPA in the tethered particle) at 2 mg. On day 7, some of the
mice were injected with PLGA NP containing TGF-beta/IL-2/Butyrate in the
same NP (at 2 mg intraperitonealy (i.p.)), others were sacrificed and the
spleens and lymph nodes were harvested for further analyses. On day 12, the
remaining mice were sacrificed and the spleens and lymph nodes were
harvested for further analyses.
Results
Figures 12B-12G demonstrate the systemic expansion of CD4+
nTregs in response to STOs in steady state in the spleen (Figures 12B-12D)
and in the mesenteric lymph nodes (mLN) (Figures 12E-12G). The change in
total Tregs as a change in percent Foxp3+ cells in the spleen (Figure 12B)
and mLN (Figure 12E), the change in induced Tregs (iTregs) as a change in
percent Foxp3+Helios- cells in the spleen (Figure 12C) and mLN (Figure
12F), and the change in natural Tregs (nTregs) as a change in percent
Foxp3+Helios+ cells in the spleen (Figure 12D) and mLN (Figure 12G),
with the different treatments are shown. No change in other T cell subsets
and innate cells, specifically in neutrophils, natural killer (NK) cells,
GATA3+ cells, and RORgt+ cells in the spleen or mLN, was detected.
88
CA 03103661 2020-12-11
WO 2019/217552
PCT/US2019/031314
Example 7. Expansion of nTreg population in vivo, instead of increased
output of thymic Tregs, in response to STP.
Materials and methods
Figure 14A is a diagram of genetically modified mouse (details
provided in Rubstov et al., Science, 329(5999):1667-1671 (2010)) used in
the experimental setup shown in Figure 14B.
Figure 14B shows the experimental setup for determining whether
systemic expansion of nTregs is due to nTreg expansion or to the increased
output of thymic Tregs. Foxp3-Cre-ERT2-eGFPxR26YFP mice were
injected i.p. at days 0, 1, 2, and 3 with STP (containing OVA in the core
particle and RAPA in the tethered particle) at 2 mg. On day 5, some of the
mice were injected with PLGA NP containing TGF-beta/IL-2/Butyrate in the
same NP (at 2 mg i.p.). On days 5, 6, 7, 8, and 9 the mice received tamoxifen
(2 mg) every day, for 5 days. On day 12, some of the mice were sacrificed
and the spleens harvested for further analyses. On day 21, the remaining
mice were sacrificed and the spleens harvested for further analyses.
Nanoparticle administration and cellular adoptive transfer in mice.
All prepared nanoparticles prepared fresh in sterile PBS at 10 mg/ml. Unless
indicated otherwise, each mouse received an intraperitoneal injection of 2
mg of particles. Adoptive transfer of cells into RAG-'- mice was done by
intravenous injection of 5.0x10⁵ OT-II CD4 T cells or 5.0x10⁵ WT naive
CD4 T cells.
Results
Figure 14C shows the percent change in YFP+ cells from the CD4+
GFP+ T cells when the animals (genotype shown in Figure 14A) received
control or STP with TGF-beta/IL-2/Butyrate in the same NP (as shown in
Figure 14B), p = 0Ø0248. Figure 14D shows the change in the number (#)
of YFP+ GFP+ CD4+ T cells when the animals (genotype shown in Figure
14A) received control or STP with TGF-beta/IL-2/Butyrate in the same NP
(as shown in Figure 14B), p = 0.1365. Figure 14E shows the change in the
percent (%) of YFP+ GFP+ CD4+ T cells when the animals (genotype
shown in Figure 14A) received control or STP with TGF-beta/IL-2/Butyrate
89
CA 03103661 2020-12-11
WO 2019/217552
PCT/US2019/031314
in the same NP (as shown in Figure 14B), p = 0.0914. More of the YFP+
cells were observed in the GFP+ population, showing that expansion of
Tregs is from preexisting nTregs.
Specifically, STPs were tested for inducing immune tolerance in vivo.
As STP and OVA/RAPA deliver RAPA to cells that uptake nanoparticles,
inhibition of PI3K-Akt-mTOR pathway by RAPA was tested. It is well-
known that RAPA binds to FKBP12 to form a complex that inhibits
mTORC1 function, and one of many readouts for proper mTOR inhibition is
upregulation of transferrin receptor, CD71. Mice injected with STP indeed
demonstrated significantly higher proportion of B220-TCRb- cells that were
CD71 positive, confirming mTOR inhibition by RAPA delivery (Figure
12H). Interestingly, this effect was not seen in CD4 T cells, showing that
there is no systemic shut-down of mTOR by RAPA in CD4 T cells and that
RAPA delivery is limited to cells that uptake nanoparticles (Figure 10A).
The results show that there is no systemic leakage of RAPA of STP in vivo,
and that RAPA delivery by STP is highly selective to B220-TCRb- cells.
Splenocytes harvested from STP-injected mice were most potent in
generating OT-II Tregs ex vivo (Figure 11B), showing that STP cellular
uptake in vivo induced tolerance and that it was superior to OVA alone
nanoparticles. An enhanced Treg expansion in STP compared to
OVA/RAPA co-encapsulated nanoparticles was observed (data not shown).
STP also significantly increased the proportion of systemic Tregs in the
spleen and the mLN (Figures 13A and 13B-13G) in vivo, asserting its
superiority over co-encapsulated nanoparticles.
Tregs in vivo can be classified into nTregs and iTregs. Several
markers have been suggested to differentiate between nTregs and iTregs, but
the most canonical marker has been the transcription factor, Helios, which is
an Ilcaros transcription factor family member. It was found that the increased
proportion of Tregs in the spleen in vivo was largely due to the increase in
nTregs, not iTregs (Figures 13A and 13B-13G). In the mesenteric lymph
node (mLN), an increase for both nTregs and iTregs was observed (Figures
13A and 13B-13G). While iTregs are infamous for their plasticity and
CA 03103661 2020-12-11
WO 2019/217552
PCT/US2019/031314
tendency to revert back to inflammatory T cells, such as Th17, nTregs are
known to be more resilient to the inflammatory cues and have been shown to
retain their fate, largely owing to their epigenetic state. As such, STP's
ability to systemically expand nTregs was a highly effective measure to
establish stable tolerance in vivo.
Some studies have suggested that RAPA-mediated inhibition of
mTOR is associated with other CD4 T cell subsets, such as Th2. No
significant changes were detected for Th2 cell (GATA3+ T cells, Figures
18A and 18C) and Th17 cells (RORgt+ T cells, Figures 18B and 18D) in
vivo. Slight increase in neutrophils could be detected as a result of STP
administration, while proportion of NK cells have significantly decreased
(Figures 19A-19D). Compared to OVA nanoparticles, STP significantly
increased the proportion of Tregs in RAG-'- mice (Figures 20A and 20B),
suggesting that STP can also expand adoptively transferred CD4 T cells in an
immunodeficient environment.
Increase in the Treg population can be attributed to two possibilities:
de novo recruitment of Tregs from peripheral tissues or expansion of pre-
existing Tregs. Observation of increase in both nTregs and iTregs in mLN,
but not spleen, showed the expansion of pre-existing Tregs was the cause of
Treg increase. As the gut microbiome is widely known to foster high
proportions of varying types of Tregs, the lamina propia of large intestine in
mice treated with STP was studied. Surprisingly, no differences in the gut
were detected (Figure 21), showing that there was no noticeable recruitment
of Tregs from the large intestine. The expansion of Tregs in vivo through
tamoxifen-induced YFP labeling of Foxp3+ cells was tracked as previously
described (Rubtsov et al., Science, 329:1667-1671 (2010)). In STP-treated
mice, the increase of GFP expression was attributed by increase in YFP
expression, showing that the increase of Tregs by STP was due to pre-
existing Tregs (YFP GFP CD4 + T cells). Altogether, the results showed that
STP preferentially expanded pre-existing Tregs to the greatest extent in vivo,
accentuating the importance of sequential and spatial delivery of RAPA and
OVA.
91
CA 03103661 2020-12-11
WO 2019/217552
PCT/US2019/031314
Example 8. Prophylactic treatment of EAE disease model with STP.
In summary, the earlier delivery of RAPA relative to OVA results in DC
and antigen-specific T cell tolerance (Figures 6A-6C). Longer exposure to
free RAPA decreases DC surface markers, such as CD80, CD86, PD-L1, and
MHC II, while free OVA did not. However, when DCs were treated with
both free RAPA and free OVA, DCs treated with free RAPA prior to free
OVA (free RAPAE/OVAL) resulted in significantly decreased expression of
DC surface markers overall. DCs treated with free RAPA and free OVA for
72 hours manifested a similar phenotype to DCs treated with free RAPA and
free OVA for 24 hours, emphasizing that the sequence of RAPA and OVA
delivery was the main cause of the decreased surface marker expression, not
the exposure duration of free RAPA. More pronounced effect of sequential
delivery was observed when RAPA and OVA were encapsulated in PLGA
nanoparticles, increasing the population of PD-Llh tolerogenic DCs.
Nanoparticle RAPAE/OVAL DCs were also able to increase the induction of
Tregs in vitro and ex vivo. Tregs induced by RAPA and OVA nanoparticles
were highly suppressive in an antigen-specific manner.
An advantage of nanoparticle delivery of RAPA and OVA, was
particularly attributed to the increase of PD-Li expression when DCs were
treated with RAPA nanoparticles. Therefore, fine tuning of RAPA and OVA
kinetics by nanoparticles has a high potential for modulation of the immune
system and can be further adjusted for any desired immunotherapy.
As the temporal effect of RAPA and OVA nanoparticles are apparent
both in vitro and in vivo in induction of Tregs, exploiting the timing of
RAPA and OVA delivery can be used to develop Tregs for treatment of
autoimmune diseases in subjects, as demonstrated below
Materials and Methods
Figure 15A is a diagram showing the experimental setup used to
obtain the data in Figures 15B and 15C. The animal models for prophylactic
EAE disease studies were established as described in "EAE induction by
Active Immunization in C57BL6 Mice" manual, version 2017-01 (EK-2110,
Hooke Laboratories, Inc.). A day -7, C57BL6 female mice of 11 weeks old
92
CA 03103661 2020-12-11
WO 2019/217552
PCT/US2019/031314
received by i.p. injection: Mock injection (line 1), PLGA NPs containing
RAPA (line 2), MOG35_55 (MOG, line 3), MOG35_55 and RAPA
(MOG/RAPA, line 4), or STP (containing MOG35_55 in the core particle and
RAPA in the tethered particle, STP, line 5) at 2 mg. On day 0, the mice
received MOG35_55, complete Freund's adjuvant (CFA), and pertussis toxin.
On day 1, the mice received pertussis toxin. On day 28, the mice were
weighed, EAE disease score determined, and the mice sacrificed with brain
and spinal cord (collectively, the CNS) taken for further analyses. The CNS
tissue was analyzed for the total lymphocyte population and for detecting T
cell subsets.
Results
Figure 15B is a graph showing the change in EAE Disease Score over
time (days) in mice that prophylactically received Mock injection (line 1),
PLGA NPs containing RAPA (line 2), MOG35_55 (MOG, line 3), MOG35_55
and RAPA (MOG/RAPA, line 4), or STP (containing MOG35_55 in the core
particle and RAPA in the tethered particle, STP, line 5), at 2 mg. Figure 15C
is a graph showing the change in mass (g) over time (days) for mice that
prophylactically received Mock injection (line 1), PLGA NPs containing
RAPA (line 2), MOG35-55 (MOG, line 3), MOG35-55 and RAPA
(MOG/RAPA, line 4), or STP (containing MOG35_55 in the core particle and
RAPA in the tethered particle, STP, line 5), at 2 mg. The results show that
the combined treatment, with immunomodulator first then antigen, is highly
effective in inducing tolerance.
Example 9. Therapeutic treatment of EAE disease model with STP.
Materials and methods
Figure 16A is a diagram showing the experimental setup used to
obtain the data in Figures 16B and 16C. The animal models for therapeutic
EAE disease studies were established as described in "EAE Induction by
Active Immunization in C57BL6 Mice" manual, version 2017-01 (EK-21 10,
Hooke Laboratories, Inc.). A day 0, C57BL6 female mice of 11 weeks old
received by i.p. injection MOG35_55, complete Freund's adjuvant (CFA), and
pertussis toxin. On day 1, the mice received pertussis toxin. On day 12, the
93
CA 03103661 2020-12-11
WO 2019/217552
PCT/US2019/031314
mice received by i.p. injection: Mock injection (line 1), PLGA NPs
containing RAPA (line 2), MOG35_55 (MOG, line 3), MOG35_55 and RAPA
(MOG/RAPA, line 4), or STP (containing MOG35_55 in the core particle and
RAPA in the tethered particle, STP, line 5) at 2 mg. On day 31, the mice
were weighed, EAE disease score determined, and the mice sacrificed with
brain and spinal cord (collectively, the CNS) taken for further analyses. The
CNS tissue was analyzed for the total lymphocyte population and for
detecting T cell subsets.
Results
Figure 16B is a graph showing the change in EAE Disease Score over
time (days) in mice that therapeutically received Mock injection (line 1),
PLGA NPs containing RAPA (line 2), MOG35_55 (MOG, line 3), MOG35_55
and RAPA (MOG/RAPA, line 4), or STP (containing MOG35_55 in the core
particle and RAPA in the tethered particle, STP, line 5), at 2 mg. Figure 16C
is a graph showing the change in mass (g) over time (days) for mice that
therapeutically received Mock injection (line 1), PLGA NPs containing
RAPA (line 2), MOG35_55 and RAPA (MOG/RAPA, line 4), or STP
(containing MOG35_55 in the core particle and RAPA in the tethered particle,
STP, line 5), at 2 mg.
Figures 17A-17F are graphs showing the change in CD4+ T cell
populations (Figures 17A-17C), pathogenic cytokine producing CD4+T cells
(Figures 17D and 17E), and neutrophil cell populations (Figure 17F) in the
CNS of mice prophylactically treated with i.p. injected MOG35_55/RAPA NP
over those in the CNS of control mice treated with mock i.p. injection. The
data show that MOG35_55/RAPA NP expand Tregs (Figures 17B and 17C),
while the overall CD4+ T cell population in the CNS is reduced (Figure
17A), suppresses pathogenic cytokine producing cells (Figures 17D and
17E), and neutrophil trafficking (Figure 17F) over those in the CNS of
control mice.
Experimental autoimmune encephalomyelitis (EAE) is an
autoimmune disease characterized by inflammatory demyelination of the
CNS. It has been well-established that pathogenicity of Th17 cells is the
94
CA 03103661 2020-12-11
WO 2019/217552
PCT/US2019/031314
primary cause of the autoimmunity in EAE and that restoration of Th17/Treg
axis is imperative for the reversal of the disease. As antigen-specific Tregs
are crucial for restoration from EAE, the effect of STP in prevention and
treatment of EAE was investigated. It is demonstrated that STP platform was
applicable to different antigens, including myelin oligodendrocyte
glycoprotein residues 35-55 (MOG35_55), in 2D2 transgenic mice, which have
transgenic T cells specific for MOG35_55 (Figures 22A-22D). As expected
with OVA STP, an increase in Foxp3+ population and activated CD44+ T
cells was detected, while showing no changes in NK cells and RORgt+ CD4
T cells (Figures 22A-22D). Induction of tolerance with a different antigen in
2D2 mice strongly emphasized the potential of STP for prevention and
treatment of EAE, as MOG35_55 is the primary antigen for pathogenesis of
EAE.
Administration of MOG, MOG/RAPA, and STP, but not RAPA
nanoparticles, prevented the onset of EAE and disease mediated weight loss
(Figure 15B, 15C, and 16B). More strikingly, STP showed superiority to
MOG/RAPA and MOG nanoparticles, completely preventing EAE even
after day 10 (Figure 15B). Compared to the untreated group, mice treated
with STP showed significantly less infiltration of immune cells and the
degree of demyelination in the spinal cord sections. In the CNS, fewer counts
of overall CD4 T cells, inflammatory cytokine producing CD4 T cells (IL-
17A+, IFNg+, and GM-CSF ), and neutrophils were detected, showing that
systemic STP administration was able to block lymphocyte trafficking to the
CNS in both acute (14 days post disease induction) and chronic (28 days post
disease induction) stages of EAE (Figures 24A-24F and 25A-25F). However,
similar proportions of Tregs in day 14 and increased proportion of Tregs in
day 28 (Figures 24A-24F and 25A-25F) was detected, showing that the
decrease in T cells is biased towards inflammatory CD4 T cells and
neutrophils. Interestingly, there was an overall increase of CD4 T cells in
the
draining lymph node (dLN) (Figures 23A-23F), showing that the mechanism
of EAE prevention could be through blockade of infiltration of immune cells
to the CNS.
CA 03103661 2020-12-11
WO 2019/217552
PCT/US2019/031314
In addition to prevention of EAE incidence, STP also greatly reduced
the severity of the disease when it was administered at the peak of disease
(Figures 16B and 26). While MOG/RAPA and MOG nanoparticles had some
effect in ameliorating the disease, STP outperformed both groups at low
concentrations of particles (Figure 26). Consistent with prophylactic data,
RAPA nanoparticles had no effect in treatment of EAE (Figure 16B).
Example 10. Single-cell RNAseq reveals immediate development of
alternatively activated macrophages (M2) and upregulation of antigen
presentation genes by STP.
Materials and Methods
Sample preparation for single-cell RNAseq. Isolated splenocytes
were sorted into three distinct populations: macrophages (BCR220-, TCRP
MHCII+, F4/80+), DCs (BCR220-, TCRO-, MHCII+, CD11c+), and T cells
(BCR220-, F4/80-, CD11 c-, TCRO+). Within each group, the total of 3,000
cells (1:1:1 ratio of macrophages, DCs, and T cells) were sent to Yale Center
for Genome Analysis for 10x chromium single-cell RNA sequencing.
Construction of 10X Genomic Single Cell 3' RNA -Seq libraries and
sequencing. Prepared single cell suspensions were mixed in RT Master Mix,
loaded on the Single Cell a Chip and partitioned with a pool of about
750,000 barcoded gel beads to form nanoliter-scale Gel Beads-In-Emulsions
(GEMs). Upon dissolution of the Gel Beads in a GEM, the primers with the
unique cell barcodes are released and mixed with cell lysate and Master Mix.
Incubation of the GEMs then produces barcoded, full-length cDNA from
poly-adenylated mRNA. Silane magnetic beads are used to remove leftover
biochemical reagents and primers from the post GEM reaction mixture. Full-
length, barcoded cDNA is then amplified by PCR to generate sufficient mass
for library construction. Enzymatic Fragmentation and Size Selection are
then used to optimize the cDNA amplicon size prior to library construction,
which includes end Repair, A-tailing, adaptor Ligation, and sample indexing
PCR to produce Illumina-ready sequencing libraries. The final libraries
contain the P5 and P7 primers used in Illumina bridge amplification. A16 bp
10x Barcode and 10 bp UMI are encoded in Read 1, while Read 2 is used to
96
CA 03103661 2020-12-11
WO 2019/217552
PCT/US2019/031314
sequence the cDNA fragment. In addition to performing standard analysis
steps such as demultiplexing, alignment, and gene counting, the Cell
RangerTM analysis pipelines perform secondary analysis and visualization to
generate expression data with single-cell resolution.
scRNAseq data analysis. For all scRNAseq data analysis, the
standardized protocol provided by Satija Lab (New York Genome Center),
Seurat R package v3.0, was followed (https://satijalab.org/seurat). More
specifically, processed raw data obtained by YCGA were inputted to Seurat
v3.0 and quality control test was performed. Cells with outlier number of
read counts were excluded. Next, the data was log transformed and
normalized by the total expression. Principal component analysis (PCA) was
performed for linear dimensionality reduction and significant PCs were
determined based on the jackstraw analysis from Seurat. Statistically
significant PCs were selected as input for t-distributed Stochastic Neighbor
Embedding (tSNE) in order to visualize clustering of samples. Canonical
markers that were used to identify each cluster were obtained through
comparison of cells in a given cluster to the cells in all other clusters
using
likelihood ratio test, and markers with lowest corrected p-value were ranked
by significance. Detection of statistically significant differentially
expressed
genes in each cluster was completed through comparison of gene expression
between samples in a pairwise manner.
Pathway analysis. Significantly differentially expressed genes in
cluster 5 and cluster 6 were used as input for Ingenuity Pathway Analysis
(IPA, Apr 2018, Qiagen) or g:Profiler
(https://biit.cs.ut.ee/gprofiler/index.cgi) testing for canonical KEGG pathway
enrichment. A one-tailed Fisher's exact test was performed to test the
probability of the overlap between our input gene set and a given reference
gene set by chance events. The Benjamini-Hochberg (B-H) method was
applied to correct for multiple comparisons.
Results
The mechanism of STP-mediated tolerance in vivo was investigated.
As nanoparticles and STP are preferentially uptaken through endocytosis due
97
CA 03103661 2020-12-11
WO 2019/217552
PCT/US2019/031314
to their particle-like design, systemic, cellular distribution of STP in vivo
would be heavily localized in antigen presenting cells. Macrophages and
dendritic cells exhibited highest uptake of nanoparticles, while T and B
lymphocytes did not (Figure 10A). In the spleen, several class subsets of
DCs exist, such as CD8a (lymphoid) DCs and CD11b (myeloid) DCs. No
significant differences between subsets of DCs and macrophages for
nanoparticle uptake were detected (Figure 10A). As such, the immediate
cellular effect of particles would be best found in antigen presenting cells.
In order to further elucidate changes in cellular and genetic level,
single-cell RNA sequencing on mice that have been treated with
OVA/RAPA nanoparticles and STP was performed. Splenocytes were
harvested a day after the final STP injection. The noise of the samples and
analysis was minimal, as they exhibited the expected number of genes,
barcodes, and mitochondrial genes (data not shown). Principal component
analysis revealed that the cellular population could be divided into thirteen
distinct clusters, which were each assigned as cell types based on its
transcriptome (Table 5). Overlay of samples reveal a striking difference in
spatial distribution in control group vs. STP, especially in M2 macrophages
and monocytes (cluster 5 and 6) (data not shown). The number of cells found
in M2 macrophages and monocyte cluster was significantly higher in STP
compared to the control (Figure 27).
98
CA 03103661 2020-12-11
WO 2019/217552
PCT/US2019/031314
Table 5. Thirteen distinct clusters assigned as cell types based on its
transcriptome.
Cluster # Cell Type
1 Neutrophils
2 Bone marrow plasma cells
3 CD11b-CD8- DCs
4 B cells
M2 macrophages
6 Monocytes
7 CD1 lb+ DCs
8 DN/DP thymocytes
9 CD8+ DCs
NK cells
11 Tregs
12 CD4+ T cells
13 CD8+ T cells
Differentially expressed genes of M2 macrophages and monocyte
5 clusters between samples was investigated. Expectedly, a huge
upregulation
of genes involved in antigen presentation and proteasome (Table 6, showing
differences in spatial distribution per samples in clusters 5 and 6) was
detected. The results show that STP injected particles lead to enhancement of
M2 macrophages and transcriptional changes in antigen presentation
10 immediately after STP injection, showing again that expansion of M2
macrophages could be a bridge to STP-induced tolerance in vivo.
Table 6. Top-ranked pathways of cluster 5 and 6 for Control vs. STP based
on KEGG pathway analysis via g:profiler
(https://biit.cs.ut.ee/gprofiler/index.cgi) or IPA.
Cluster 5 Cluster 6
Biological pathways Corrected Biological pathways Corrected
(KEGG) p-value (KEGG) p-value
Antigen processing and 2.44e-10 Antigen processing and 3.83e-26
presentation presentation
Proteasome 9.18e-08 Allograft rejection 5.31e-13
Intestinal immune 1.03e-04 Graft vs. Host Disease 6.42e-13
network for IgA Signaling
production
Graft vs. Host Disease 4.67e-04 Autoimmune Thyroid 7.48e-13
Signaling Disease Signaling
Helper T cell 3.61e-03 0X40 Signaling Pathway 8.46e-13
differentiation
99
CA 03103661 2020-12-11
WO 2019/217552
PCT/US2019/031314
At least 30 upregulated genes in STP compared to Ctrl were selected and
analyzed for biological pathways.
Example 11. Importance of M2 Macrophage in Treg expansion and
tolerance by STP.
Materials and Methods
Depletion of Macrophage and PD-Li. Clodronate liposomes
(ClodronateLiposomes, Liposoma B.V.) were injected (i.p.) (200 pL per
mice) for depletion of macrophages. PD-Li neutralizing antibody
(InVivoMab; 10F.9G2, Bio X Cell, West Lebanon, NH, USA) was injected
(i.p.) 200pg per mouse triweekly for PD-Li depletion.
Results
Given that the number of M2 macrophages had greatly increased in
early stage of STP-treated mice, the importance of M2 macrophages in
induction of tolerance at a later timepoint was investigated where the
expansion of Tregs was detected. F4/80+ macrophages were robustly
depleted through administration of clodronate liposomes. Representative
FACS plots were generated demonstrating percentage of cells that expressed
F4/80 after clodronate injections (gated on Lin:-) . OT-II mice were injected
with clodronate (200 pL) once at day 0. Splenocytes were harvested at each
timepoint and cells were analyzed by FACS. FACS plots not shown. The
percentage of cells expressing F4/80 reduced from 6.87% in control sample,
to 0.42% for clodrosome Day 2 sample, to 0.84% for clodrosome Day 4
sample, to 0.74% for clodrosome Day 7 sample.
Depletion of macrophages inhibited STP's ability to expand Tregs
(Figure 28A), showing that macrophages were essential in STP uptake and
inducing tolerance. M2 macrophage increase in STP-treated mice was also
confirmed by flow cytometry (Figure 28B), showing that there was a
selective increase of M2 in the Ml/M2 axis. As such, complementary to
results from single-cell RNA sequencing, the results emphasized the
importance of tolerogenic M2 by STP as a mechanism of expansion of Tregs
and tolerance.
100
CA 03103661 2020-12-11
WO 2019/217552
PCT/US2019/031314
CD8a DCs are well-known for immunogenicity and cross
presentation. Several studies have shown that CD8a+ DCs are responsible
for establishment of cross-tolerance, particularly to tissue-associated
antigens. To investigate if CD8a+ DCs had also increased in STP-treated
mice, the ratio of CD11b+ DCs to CD8a+ DCs in the spleen was compared.
The ratio of 33D1+ DCs (CD11b+ DCs) to XCR1+ DCs (CD8a+ DCs) had
significantly decreased in STP-treated mice (Figure 29), showing that cross-
tolerance associated CD8a+ DCs were also recruited to the spleen, consistent
to increase in M2 macrophage.
Specifically, STPs increased the ratio of CD8a+ DCs to CD11b+ DCs
in the spleen. Representative FACS plot showed XCR1 expressing DCs
(CD8a+ DCs) and 33D1 expressing DCs (CD11b+ DCs) (gated on Lin:-,
CD11c+ MHCII+ cells) were 6.25% : 35.8%, respectively, in controls and
11.6% : 24.0% with STP treatment. Splenocytes from mice that have been
injected with STP (as described in Figures 13B-13G) were harvested and
analyzed by FACS. Figure 29 shows the ratio of 33D1+ DCs to XCR1+ DCs
(N=3; p-value was determined by student t-test).
Example 12. STP induces tolerance through upregulation of PD-Li.
Materials and Methods
Using FACS analysis, the cells were analyzed by detecting Foxp3
expressing cells (gated on CD4 T cells). OT-II mice with or without
depletion of macrophages by clodronate liposomes were injected with STP,
and splenocytes were harvested and analyzed by FACS (N>4). CD206
expressing cells were also analyzed (gated on Lin:-, CD11c-, CD11b+,
F4/80+ cells). Nanoparticles were injected in OT-II mice as described for
Figures 13B-13G, and the percentage of M2 macrophages (CD206+
macrophages) was analyzed (N>8). PD-Li expressing M2 cells from mice
were analyzed as described for 206 expressing cells (N>8). Cells from spleen
or mLN of OT-II mice with or without depletion of PD-Li were analyzed.
Splenocytes or cells from mesenteric lymph node were harvested after
treatment of STP with or without PD-Li neutralizing antibody (N>4). p-
values were determined by student t-test.
101
CA 03103661 2020-12-11
WO 2019/217552
PCT/US2019/031314
Results
The molecular mechanism of STP-induced tolerance in vivo was
investigated. Amongst several tolerogenic markers on APCs, PD-Li is a
well-known co-inhibitory surface and its role in development of Tregs and
immune suppression has been well-established. As PD-Li is also known to
be upregulated on tolerance-associated M2 macrophages, the role of PD-Li
as a molecular mechanism of action of STP was explored. STP significantly
increased the level of PD-Li on M2 (Figure 28C), suggesting that PD-Li
upregulation on M2 is a mechanism of tolerance by STP. To confirm the
dependence of PD-Li of STP, broadly neutralizing antibody (anti PD-L1)
was used to decrease the level of PD-Li expression in vivo, as shown in
Figure 28D. In both spleen and mLN, anti PD-Li treated mice failed to
expand Tregs even with STP administration (Figures 28E and 28F).
Altogether, PD-Li expression on M2 macrophages by STP was essential for
expansion of Tregs and immune tolerance in vivo.
Unless defined otherwise, all technical and scientific terms used
herein have the same meanings as commonly understood by one of skill in
the art to which the disclosed invention belongs. Publications cited herein
and the materials for which they are cited are specifically incorporated by
reference.
Those skilled in the art will recognize, or be able to ascertain using
no more than routine experimentation, many equivalents to the specific
embodiments of the invention described herein. Such equivalents are
intended to be encompassed by the following claims.
102