Note: Descriptions are shown in the official language in which they were submitted.
CA 03106818 2021-01-15
WO 2020/023251
PCT/US2019/042096
ENGINEERED EXOSOMES FOR MEDICAL APPLICATIONS
CROSS REFERENCE TO RELATED APPLICATIONS
[0001] This application claims the benefit of U.S. Provisional Application No.
62/698,650,
filed July 16, 2018, which is incorporated herein by reference for all
purposes.
BACKGROUND OF DISCLOSURE
Field of Invention
[0002] This invention relates to compositions and methods for making and using
exosomes
to treat various disorders.
Technical Background
[0003] Exosomes are cell-derived nano scale (40-150nm), lipid layered
spheroids packed
with unique cell-type specific protein and/or nucleic acids. Parental cells
secrete exosomes
to transfer this "information" to effector cells. This results in a signaling
process that can
provide parental cell influence on target cell function. Current studies of
exosome function(s)
highlight their important roles in modulating cellular signaling in
immunology, cancer biology
and regenerative medicine.
[0004] Exosomes derived from some types of cells, such as mesenchymal stem
cells and
dendritic cells have therapeutic potential and can be considered efficient
agents against
various disorders. However, many challenges for the development of exosome-
based
therapeutics are known in the art. Specifically, heterogeneity and low
productivity of art-
recognized methods for producing exosome formulations is the major barrier for
their
therapeutic application. Development and optimization of producing methods,
including
methods for isolating and storing exosome formulations, are required for
accomplishing
exosome-based therapeutics. Moreover, improvement of delivery efficiency of
exosomes is
important for their therapeutic application, which can include treatment of
bone damage and
treatment of neurological disorde
[0005] Osteoimmunology is a central phenomenon controlling adult bone health,
disease
and regeneration. Failure of osteogenesis (i.e., the formation of bones)
complicates
dentoalveolar and orthopedic therapies. The biologic and therapeutic control
of bone repair
is linked to responses of injury that involve activation of the immune system.
Facture repair
involves responses mediated by inflammatory cytokines. Therefore, there exists
a need in
this art for new methods to treat bone diseases that will promote bone repair
yet minimize
activation of the immune system.
[0006] Neurological disorders are complex in both origin and progression.
Several factors
contribute to injury or damage of nerve cells. These factors include physical
traumas such as
-1-
CA 03106818 2021-01-15
WO 2020/023251
PCT/US2019/042096
head traumas, sport accidents and vehicle accidents; chemical traumas such as
drug or
alcohol abuse and exposure to environmental chemicals; metabolic traumas such
as
epileptic seizure, spinal cord ischemia, and cerebral ischemia; and
complicated trauma (or
complex migraine) that are associated with high prevalence of stroke or
transient ischemic
attack during migraine attacks.
[0007] Central nervous system ischemia triggers both restorative and
degenerative
processes. Restorative processes are neurotrophic in nature, regenerative and
reparative.
These drive cells and tissues toward health and normal function. Degenerative
processes
lead to loss of function, cell death, and can spread from the area directly
affected by the
primary insult to more diffuse areas of the central nervous system. Following
ischemic
trauma such as stroke to the central nervous system, degenerative processes
tend to
predominate, leading to progressive secondary damage or injury and its
sequelae of adverse
health conditions or disability. It has also been suggested that normally
restorative
processes can be altered in certain ways to become degenerative. Secondary
injury is
caused or brought about by cascades of cellular and metabolic processes. These
secondary
injury processes are spread over a space and time continuum. For instance,
after spinal cord
injury changes can be observed in neuronal function even in remote areas of
the central
nervous system including the brain, and these processes follow time courses of
hours, days,
weeks and even months.
[0008] Neurological disorders have proved to be some of the most difficult
types of disease
to treat. In fact, for some neurological diseases, there are no drugs
available that provide
significant therapeutic benefit. The difficulty in providing therapy is all
the more tragic given
the devastating effects these diseases have on their victims. Therefore, there
is a need for
new and effective methods to treat disorders or damage of the neurological
systems.
SUMMARY OF THE DISCLOSURE
[0009] This disclosure provides exosome compositions and methods of using
them.
[0010] As described below, in one aspect, the disclosure provides a
composition comprising
isolated engineered exosomes from mesenchymal stem cells (MSCs), each exosome
comprising at least one factor that is: an osteoinductive factor, a neuronal
regeneration
factor, an immunomodulatory factor, an extracellular matrix binding factor, or
a combination
thereof, wherein the at least one factor is present at a higher amount in the
engineered
exosome than the amount present in a naturally occurring cell-derived exosome.
[0011] In another aspect, the disclosure provides a method of preparing a
composition of
the disclosure, comprising engineering stem cells to contain at least one
factor that is: an
osteoinductive factor, a neuronal regeneration factor, an immunomodulatory
factor, and an
-2-
CA 03106818 2021-01-15
WO 2020/023251
PCT/US2019/042096
extracellular matrix binding factor at a higher amount than stem cells that
are not
engineered; and isolating the exosome from the cells.
[0012] Another aspect of the disclosure is a method for treating an eye
disorder in an
individual comprising delivering a composition of isolated exosomes to
vitreous humour of
the individual, wherein the exosomes are enriched in regenerative factors
endogenous to
stem cells.
BRIEF DESCRIPTION OF THE DRAWINGS
[0013] The accompanying drawings are included to provide a further
understanding of the
methods and compositions of the disclosure, and are incorporated in and
constitute a part of
this specification. The drawings illustrate one or more embodiment(s) of the
disclosure and,
together with the description, serve to explain the principles and operation
of the disclosure.
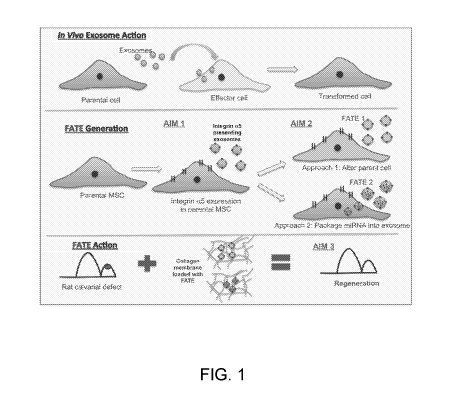
[0014] Figure 1. Generation and testing of biomimetic FATE as nano-modulators
of
Stem Cell Lineage Determination (SCLD) for tissue-engineering applications.
[0015] Figure 2. Exosome analysis. (A) Representative transmission electron
microscopy
(TEM) image of exosomes. (B, C) Representative TEM images of exosomes that
were
immunostained for CD63 using 10nm gold particles. The electron dense black
dots
represent positive staining. (D) Immunoblots showing the presence of exosome
markers
CD63 and CD9 in the exosome protein lysates.
[0016] Figure 3. Workflow schematic for generation of a5 FATE.
[0017] Figure 4. Exosome binding to COL1. Dose dependent and saturable binding
of
exosomes to collagen type 1 (COL1) coated (54) assay plates. 1ul of exosome
suspension
corresponds to exosomes from 10,000 cells.
[0018] Figure 5. Exosome binding to fibronection (FN). (A) Confocal
microscopic image
of exosomes (immunostained for marker CD63) bound to cell-secreted FN in the
extracellular matrix (ECM) of decellularized human mesenchymal stem cells
(HMSCs). The
arrows in the merged image shows areas of colocalization of exosomes with FN.
(B)
Confocal microscopic image showing that blocking exosome integrins with 2mM
RGD
peptide blocks exosome binding to FN.
[0019] Figure 6. Representative TEM images of exosomes from HMSCs (left panel)
and HMSCs constitutively expressing integrin a5 (right panel) immunogold
labeled for
integrin a5. The arrows point to increased presence of the integrin a5 on the
exosome
membranes indicating that increasing integrin expression on the parent cell
plasma
membrane increases its expression on the exosome membrane.
-3-
CA 03106818 2021-01-15
WO 2020/023251
PCT/US2019/042096
[0020] Figure 7. Saturable endocytosis of fluorescently labeled exosome by
MSCs.
Relative fluorescence in arbitrary units is shown. Endocytosis levels off with
increased
exosome delivery as the cells mechanisms become saturated.
[0021] Figure 8. 30 reconstruction of z-stack confocal images showing
endocytosis
collagen bound exosome (represented by Osteo Exo) by HMSCs (represented by
Actin).
[0022] Figure 9. Table depicting increased potency of osteogenic exosomes to
induce
HMSC differentiation.
[0023] Figure 10. Workflow for production of osteoinductive exosomes.
[0024] Figure 11. Endocyctosis of exosome is not integrin mediated. (A)
Confocal
images showing fluorescently labeled exosomes (Exo) endocytosed by HMSCs
(tubulin). (B)
Confocal images showing endocytosis of fluorescently labeled exosomes (Exo)
pretreatment
with 2.5mM RGD peptide to block integrins. Note that endocytosis of exosomes
was not
blocked after integrin blocking (B). DAPI, 4',6-diamidino-2-phenylindole.
[0025] Figure 12. Representative micrographs of sections from control (Al, BI,
Cl,
D1, El) and osteogenic exosome-containing (A2, B2, C2, 02, E2) groups of
collagen
sponges seeded with HMSCs. Scaffolds were implanted for 4 weeks subcutaneously
in
nude mice and immunostained for phosphorylated proteins (p-STT), DMP1, VEGF
and
BMP2. Note the increased expression of these proteins in A2, B2, C2 and D2.
(El and E2)
are H&E stained sections. The arrows in E2 point to RBC containing capillaries
showing
vascularization in the group containing exosomes. (F) A graphical
representation of serial
von Kossa and alizarin red stained sections that shows exosome mediated
increase in
mineralization in the form of calcium phosphate. Error bars represent mean +1-
SD and *
represents statistical significance with respect to control (student's t-test
P<0.01).
[0026] Figure 13. Increased expression of Let7a and miR218 in osteogenic MSC
exosomes compared to control MSC exosomes.
[0027] Figure 14. Dose dependent reduction in endocytosis of fluorescently
labeled
MSC exosomes in the presence of heparin. (*) Represents statistical
significance with
respect to control (#) represents significance between indicated groups
(Students t-test
(p<0.05)).
[0028] Figure 15. Workflow and experimental groups for in vivo experiments.
[0029] Figure 16. Model of MSC immunomodulation during osteogenesis involves
altering macrophage (MO) Ml/M2 polarization. Reducing the ratio of
proinflammatory M1
MO to anti-inflammatory M2 MO exosomes promotes osteoinduction and
regeneration.
[0030] Figure 17. Venn diagram showing results of miRNAseq analysis of MO
polarized exosomes reveal a small set of polarization- specific miRNAs. MO
were
polarized using LPS+IFNy to M1 and IL4 to M2 phenotypes; Exosomes were
isolated and
-4-
CA 03106818 2021-01-15
WO 2020/023251
PCT/US2019/042096
RNA was prepared. Small RNA libraries were constructed and subjected to
sequencing
(Illumine). Sequences aligned to the mouse genome were mapped to mmiRBase_v.19
and
normalized to reads per million. The highly expressed miRNAs were compared
manually as
shown.
[0031] Figure 18. Table showing polarized MO exosome miRNAs and their known
relationship to osteoinduction/ osteogenesis. There are few miRNA uniquely
expressed
in the polarized MO. In M2 MO, two of the three miRNAs are implicated in the
positive
regulation of osteoinduction. An M2-enriched MO population can enhance bone
repair.
[0032] Figure 19. Graph comparing IL-1 beta. IL-6 and IL-10 in cells. MO were
treated
with MSCcont and MSCTNFa exosome for 24 hours. Total RNA was isolated and
cytokine
expression was measured by quantitative reverse transcription-polymerase chain
reaction
(qPCR) (n=4;*p, 0.05, **=p, 0.01).
[0033] Figure 20. Assays for M1 polarization pathway members (top); Assays for
M2
polarization pathway members (bottom). Known experimental methods for
inhibiting the
molecules and a means of result readout are shown.
[0034] Figure 21. Table of M1 Inhibitors and their induction in response to
TNFa.
Exosomes from MSCs treated with PBS or lOng/m1 TNFa for 18 hours were prepared
and
small RNAs were isolated. The levels of 5 known miRNA inhibitors of M1
signaling pathways
were quantified by qRT-PCR. All were induced by TNFa treatment of MSCs.
[0035] Figures 22 and 23. MSC Exosomes alter the ratio of M1/M2 exosomes
during
bone regeneration. Figure 22, left: Collagen scaffolds containing 3 x 10⁶ MSC
exosomes
were placed in calvaria (skullcap) defects in rats to assay bone regeneration.
Figure 22,
right: At 3 weeks, immunostaining for M1 (a-Arg1) and M2 (a -CD206) was
performed.
Staining revealed reduced M1 MO in treated defects. Figure 23: The MSC exosome-
mediated reduced M1 and increased M2 population ( M1/M2 ) suggests that MSC
exosomes promote a regenerative MO population for healing.
[0036] Figure 24. Schematic for MO polarization signaling pathways. The
relevant
exosome population is shown on top.
[0037] Figure 25. Characterization of Exosomes. Particle tracking analysis of
isolated
extracellular vesicles (Evs) showed a size distribution that fit the exosome
profile for both
MSC and MO. lmmunoblotting (labeled Western blot) showed the presence of
exosome
markers CD63 and CD9 for both cells. TEM of immunogold labeled vesicles showed
the
presence of vesicles labeled positively for CD63 (10nm gold labeled) falling
within the
prescribed size distribution of exosomes.
[0038] Figure 26. Endocytosis of MSC exosomes by MO. A) Dose dependent
endocytosis of fluorescently labeled MSC exosomes by MO. B) A confocal image
of MO
-5-
CA 03106818 2021-01-15
WO 2020/023251
PCT/US2019/042096
(tubulin) with MSC exosomes within MO (tubulin). Nuclei are indicated (central
dark areas,
DAPI stained).
[0039] Figure 27. Primary mouse MO polarization. Mouse bone marrow MO were
treated
with LPS/IFNy (M1) or IL-4 (M2) for 24 hours and fixed for immunostaining or
lysed for qPCR
analysis of polarization markers. Top: M1 express high levels of iNOS, IL 1[3,
TNFa; M2
express Arg1, CD206 and FIZZ1. Bottom: immunostaining affirms M1 specific iNOS
and M2
elevated CD206 expression.
[0040] Figure 28. Table showing phenotypic markers of MO polarization.
[0041] Figure 29. Polarity-specific effects of MO exosomes on MSCs. Left: Bar
graph
showing expression of BMP2 and 9 in MSCs 72 hours following treatment with MO,
Ml, or
M2 exosomes. Fold change determined by qPCR (n=4). b) Bar graph representing
transactivation of the BMP2-responsive SBE12 plasmid following MSC treatment
with MO,
M1 or M2 exosomes +/- 50 ng/ml rhBMP2. Note the potentiated BMP2 signaling
with MO or
M2 exosome treatment (*=p<0.01; **=p<0.001).
[0042] Figure 30. MicroCT and immunohistochemical evaluation of MO exosome-
mediated mouse calvaria bone regeneration. 3.5 mm mouse calvaria defects were
treated with 3.5 mm diameter collagen scaffolds containing either PBS, M1 or
M2 MO
exosomes (4.0 x 10⁸ exosomes/ calvaria). Top left: Representative
reconstructed pCT
images of 3 and 6 week treated defects reveal positive effects of M2 exosome
treatment.
Top right: Quantifying mineralized tissue by pCT revealed marked bone
regeneration at 6
weeks only in the M2 exosome-treated calvaria (calculated in Matlab and
statistically
compared (n=6; *= p<0.05)). Bottom: Confocal microscopy of BMP2 and BSP
expression in
healing calvaria 6 weeks after placement of collagen scaffolds containing
either PBS, M1 or
M2 MO exosomes. M1 exosomes impared osteogenesis (and BMP2 and BSP
expression).
M2 exosome treatment supported osteogenesis /bone regeneration (and BMP/BSP
gene
expression) at 6 weeks.
[0043] Figures 31 and 32. Increased expression of miRNA in exosomes
effectively
targets cell functions. Figure 31, left: Schematic showing process. miR424
(proliferative
function) was cloned into XMIR plasmid and resulting lentivirus was transduced
into R28
cells. Figure 31, Right: miR 424 expression was analyzed by QPCR, and miR424
abundance was increased 115-fold (vs. control) in exosomes. Exosomes were
characterized
(CD9, CD63, nanocyte (not shown)). Figure 32, left: The miR424 exosomes were
taken up
by cells. Right: The exosomes induced increased proliferation relative to
control exosomes.
[0044] Figure 33. Engineered exosomes promote osteogenesis. Exosomes from BMP2-
expressing cells that over expressed miRNAs (-5 to 11 fold) that down
regulated the BMP
inhibitors BAMBI and SMAD7 were produced. These exosomes ((4.0E8) / calvaria)
-6-
CA 03106818 2021-01-15
WO 2020/023251
PCT/US2019/042096
increased osteogenic gene in vitro stimulated bone regeneration in vivo.
miR424 is
upregulated in BMP2 exosomes.
[0045] Figure 34. Monocyte depletion impairs bone healing. A) The number of
F4/80-
CD11 b double positive cells in peripheral blood of Control and MaFIA mice
treated with
AP20187 measured at day 3 by flow cytometry indicates a significant reduction
in the
monocytes. B) micro CT images of control and AP20185 treated (x 2 weeks) mice
calvaria
with 3 mm defects after 28 days post-surgery. This affirms previous studies in
fracture and
tibia defect bone repair models in the MaFIA mouse.
[0046] Figure 35. Automated Calculation of Bone Volumes from uCT data. a) Low-
resolution 3D rendering of the pCT imaged calvaria. The black circle =
experimental region
(osteotomy), dashed circle = control region (intact); markers = anterior and
posterior ends of
the sagittal suture defining the main axis of the cranium. b) High-res 3D
rendering showing
the relative bone densities, as percentage of the maximum density observed.
Top, the bone
density of thin coronal sections is shown. Lighter areas are higher density.
[0047] Figure 36. E Analyses of miR 424 exosomes. A. QPCR data showing exosome
specific overexpression of miR424 B. Engineered exosomes show the presence of
exosome
markers C. Endocytosis of control exosomes D. Endocytosis of engineered
exosomes
showing that altering miRNA content does not affect the endocrine process.
[0048] Figure 37. Endocytosis of HMSC miR424 by R28 cells.
[0049] Figure 38. Endocytosis of dental pulp stem cell (DPSC) miR424 by R28
cells.
[0050] Figure 39. Engineered exosomes rescue ischemic retinal cells. To mimic
ischemic conditions, R28 retinal cells were subjected to oxygen and glucose
deprivation
(OGD). To test the hypothesis if exosomes can rescue R28 cells from OGD-
mediated cell
death, the R28 cells were subjected to OGD conditions for 6h and later were
treated with
exosomes overnight. The cytotoxicity was measured from LDH (LDH is an enzyme
that is
released when cells are dying) released by the cells. As seen in the figure,
OGD conditions
caused more than 50% of cell death. Conversely, when same were treated with
DPSC
exosomes showed significant reduction in %cell death as compared to cells with
absence of
exosomes. The same experiment was performed using DPSC miR424 derived
exosomes.
Similar results were obtained. When compared, DPSC miR424 derived exosomes
proved
more effective than DPSC exosomes. Also, condition media depleted of exosomes
were
tested and fewer protective effects were seen implying that the protective
effects are due to
the presence of exosomes (data not shown).
[0051] Figure 40. Proliferation of Retinal Cell Line (R28) cells treated with
miR 424
exosomes versus control exosomes. Proliferation is shown relative to untreated
R28
cells. A lactate dehydrogenase (LDH) assay was used to assess proliferation.
-7-
CA 03106818 2021-01-15
WO 2020/023251
PCT/US2019/042096
[0052] Figure 41. Characterization of MSC derived EVs. (A) Nanoparticle
Tracking
Analysis (NTA) histogram demonstrating MSC-EVs size distribution after
isolation using
centrifugation and EV Exo-quick Isolation Reagent. In the insert, mean and
mode for particle
size are displayed along with concentration. MSC-EVs showed a modal size of 93
nm, peaks
at 89 and 141 nm, and the presence of few large vesicles (shown as larger
peaks at higher
diameters) indicating that the majority of the MSC-EVs are likely exosomes.
(B) Western blot
illustrating the characteristic surface markers of exosomes, CD63, CD9, CD81,
and
HSP70a, present in MSC-EV preparations, but not in MSC-conditioned medium (CM)
depleted of EVs. Molecular weight markers are on left of each blot. (C)
Transmission
electron microscopic (TEM) image of cup-shaped MSC-EVs isolated from MSCs with
diameters of approximately 100 nm, consistent with exosomal size. (D)
Immunogold labeling
of MSC-EVs with CD63 antibody to exosome surface markers, again demonstrating
that the
MSC-EVs are mainly exosomes. Scale bar are on lower left of panels C and D.
[0053] Figure 42. Endocyctosis of MSC-EVs by R28 cells. (A) Representative
confocal
micrograph demonstrating endocytosis of fluorescently labeled EVs by R28
cells. The cells
were counterstained with primary antibody to tubulin (cytoskeleton, red), and
with DAPI to
stain the nuclei (blue). Clockwise from the top left are: DAPI (blue), MSC-
EVs, composite of
DAPI, MSC-EVs, and tubulin. The image on the top right of panel A demonstrates
punctae of
MSC-EVs (light arrows) and denser concentration of MSC-EVs (dark arrows near
center of
image), and there is co-localization of MSC-EVs and tubulin within the
cytoplasm of the cells
(arrows in lower right, composite panel of 2A). Scale bars are on the top of
each panel. (B)
Graph indicates a dose-dependent and saturable endocytosis of fluorescently
labeled MSC-
EVs. X-axis is volume of MSC-EVs and Y-axis indicates mean normalized
fluorescence
units. (C) Quantitative fluorescence measurements of MSC-EV endocytosis at 37
C and 4
C showing a decrease in endocytosis at lower temperature. Temperature is on X-
axis, and
Y-axis is mean normalized fluorescence units. The data represented in panel B
and panel C
are the mean of 6 individual experiments, and error bars indicated SD. * in
panel C
represents statistical significance with respect to control (normothermia, P <
0.01).
[0054] Figure 43. Heparin sulfate proteoglycans (HSPGs), but not integrins,
are
involved in endocytosis of MSC-EVs by R28 cells. (A) Increasing doses of RGD
peptide
to block cell surface integrins did not alter endocytosis of fluorescently
labeled MSC-EVs. Y-
axis is mean normalized fluorescence units SD; the X-axis is dose of RGD in
mM. No
statistical significance was observed (n = 6 experiments). (B) Dose-dependent
reduction of
fluorescently labeled MSC-EV endocytosis after heparin pretreatment to block
HSPGs. Data
on Y-axis is mean normalized fluorescence units SD; the X-axis is dose of
heparin in
pg/ml. *= P < 0.05 compared to vehicle (heparin = "0"), n = 6 experiments. (C)
Representative confocal micrograph showing endocytosis of fluorescently
labeled MSC-EVs
-8-
CA 03106818 2021-01-15
WO 2020/023251
PCT/US2019/042096
by R28 cells treated with PBS vehicle (control). (D) Representative confocal
micrograph
showing no reduction in endocytosis of MSC-EVs after pre-incubation with RGD
to block
integrins (RGD = "0" is PBS vehicle alone). (E) Representative confocal
micrograph showing
reduction in endocytosis of MSC-EVs after they were pre-incubated with heparin
to block
HSPGs. (For C, D, and E, from left to right are shown MSC-EVs, DAPI to stain
the cell
nuclei, anti-tubulin to stain cytoskeleton, and composite of MSC-EVs, DAPI,
and tubulin on
the far right. Endocytosis can be seen in C and D, in the far right panels,
where MSC-EVs
are visible inside cells (white arrows), as well as overlapping with tubulin
(grey arrows).
Scale bars appear on top or bottom of each panel.
[0055] Figure 44. Involvement of the caveolar pathway in MSC-EV endocytosis by
R28
cells. (A) Representative confocal images showing endocytosed fluorescently
labeled MSC-
EVs co-localized with anti-caveolin 1. From left to right are DAPI, MSC-EVs,
caveolin-1, and
merged. (B) Magnified area of box in A. White arrowheads point to regions of
co-localization
of caveolin-1 and MSC-EVs. (C) Representative confocal images of endocytosed
MSC-EVs
counterstained with anti-clathrin. From left to right are DAPI, MSC-EVs,
clathrin, and
merged. (D) Magnified area of box in C. Note that in contrast to A and B,
there is no co-
localization of MSC-EVs and clathrin in C and D. (E) Representative confocal
images
showing endocytosed fluorescently labeled MSC-EVs in R28 cells. From left to
right are
DAPI, MSC-EVs, anti-tubulin, and merged. MSC-EVs are visible inside the cells
in the far
right merged panel (shown by grey arrows), or where tubulin and MSC-EVs co-
localize
(shown by white arrows). (F) Representative confocal images showing
endocytosed
fluorescently labeled MSC-EVs in R28 cells after pretreatment with methyl-p-
cyclodextrin
(MBCD) to disrupt R28 cell membrane cholesterol. From left to right are DAPI,
MSC-EVs,
tubulin, and merged. (G) Quantitation of MBCD effect on endocytosis of MSC-EVs
into R28
cells. There was a significant dose dependent reduction in MSC-EV uptake with
increasing
doses of MBCD. Data on the Y-axis in mean normalized fluorescence units SD;
the X-axis
is dose of MBCD in mM. *= P < 0.05 compared to control, n = 6 experiments.
[0056] Figures 45 and 46. EVs protect retinal cells from OGD-induced cell
death.
Figure 45: Dose dependent effect of MSC-EVs on oxygen glucose deprivation
(OGD)
induced cytotoxicity of R28 cells as measured by lactate dehydrogenase (LDH)
assay. Note
the decrease in cell death from OGD with increasing dosage of MSC-EVs with
saturation at
105 EV/ml. In A, data is presented as percentage cytotoxicity on Y-axis ( /0
cell death, LDH,
mean SD), and X-axis in concentration of MSC-EVs in particles/ml. n = 6
experiments *=
P < 0.05 vs OGD alone. Figure 46, top: Representative flow cytometry results
for the
presence of EdU-positive cells after OGD with and without EVs. The percentages
within the
graphs in bold indicated the % of proliferating cells. Conditioned medium (CM)
without EVs
(CM-Exo), and PBS (chi) were controls. Exo = Evs. Figure 46, bottom: Graphical
-9-
CA 03106818 2021-01-15
WO 2020/023251
PCT/US2019/042096
representation of results in (B). Y-axis is % EdU-positive cells (mean SD).
n = 4
experiments, *= p < 0.05 normoxia vs OGD, # = p < 0.05 vs control ("ctrl", OGD
+ PBS).
Both CM and Exo prevented the loss of proliferation in cells subjected to OGD,
while CM-
Exo showed no effect. Although there was a small decrease in the proliferation
in normoxic
cells treated with EVs, there was no significant difference from the control.
[0057] Figures 47 and 48. MSC-EVs enhance functional recovery after retinal
ischemia
in vivo. Figure 47: Stimulus intensity plots of a-(A) and b-waves (B) were
measured at
baseline and at 8 days post ischemia. MSC-EVs, PBS, or MSC medium depleted of
EVs (EV
depleted medium) were injected 24 h after ischemia into the vitreous humor of
both eyes
(right eye was ischemic and left eye was non ischemic control), as described
in the methods
section. Figure 48: (C) Representative ERG traces from ischemic retinae
injected with PBS,
MSC-EVs and medium depleted of EVs respectively; for brevity, only one set of
representative traces, from ischemic eyes, per group is shown. The scale bars
for amplitude
(Y-axis, pV) and latency (X-axis, ms) appear in the top right of each
representative ERG
panel. N = 11-13 rats, for MSC-EVs or PBS; N = 6f0r MSC-EV depleted medium. *=
P <
0.05 for ischemic + MSC-EVs vs ischemic + PBS, # = P < 0.05 for medium
depleted of MSC-
EVs + ischemic vs MSC-EVs + ischemic.
[0058] Figures 49 and 50. MSC-EVs attenuated ischemia-induced apoptosis
(TUNEL,
terminal deoxynucleotidyl transferase-mediated dUTP nick end labeling assay)
in
ischemic retinae in vivo. Figure 49: Representative immuno-histochemical
images of
TUNEL in retinal cryosections (7 pm) demonstrating MSC-EV-mediated reduction
in TUNEL
cells in ischemic retina compared to PBS injected ischemic. TUNEL; DAPI;
fluorescently
labeled MSC-EVs. In these experiments, the retinal cryosections were taken
from retinae at
24 h after intravitreal injection of MSC-EVs or PBS, which was 48 h after
ischemia. TUNEL
cells are seen in the RGC layer (grey arrows, upper right quadrant), and in
the inner (INL)
and outer nuclear layers (ONL) (white arrows, upper right quadrant). IPL =
inner plexiform
layer. Note that aggregates of MSC-EVs (grey arrows, lower quadrants) are
present in the
retinal ganglion cell (RGC) layer in EV ischemia (bottom right panel), and in
the vitreous in
EV control (bottom left panel). Figure 50: Graphical representation of TUNEL
cells in retinal
ganglion cell layer, inner nuclear layer, outer nuclear layer, and total
nuclei in retina, with
data shown on Y-axis as TUNEL cell/20 x field, mean SD. TUNEL was counted in
all four
groups (PBS control, MSC-EV control, PBS + ischemia and MSC-EVs + ischemia) by
blinded observers. MSC-EVs attenuated TUNEL in ischemic retinae, and there was
no
significant increase in TUNEL in normal eyes injected with MSC-EVs ("EV
control") except in
the RGC layer. N = 4 rats per group; *= P < 0.05 for PBS non-ischemic, or MSC-
EV non-
ischemic vs MSC-EV ischemic; # = P < 0.05 for PBS ischemic vs MSC-EV ischemic.
** = P <
0.05 for MSC-EV non-ischemic vs PBS non-ischemic.
-10-
CA 03106818 2021-01-15
WO 2020/023251
PCT/US2019/042096
[0059] Figures 51 and 52. MCS-EVs attenuated neuro-inflammation and caspase 3
activation after retinal ischemia in vivo. Figure 51A: Representative Western
blots for
TNFa, IL-6 and cleaved caspase 3. 3-Actin was used as the loading control.
Figure 51 B,
Figure 52C and D: Quantitative bar graphs for Western blots illustrating the
significant MSC-
EV-mediated amelioration of ischemia-induced increases in levels of
inflammatory
mediumtors (IL-6, TNFa), and apoptosis (cleaved caspase 3) in rats injected
with intravitreal
MSC-EVs 24 h after ischemia. There was no significant change in levels of IL-
6, TNFa, or
caspase 3 in MSc-EV injected normal eyes compared to PBS injected normal eyes.
Retinal
samples were collected 48 h after ischemia, which was 24 h after MSC-EV or PBS
injection.
N = 10 rats per group, *= P < 0.05 control non-ischemic vs ischemic, # = p <
0.05 PBS +
ischemic vs MSC-EV + ischemic.
[0060] Figures 53 and 54. In vivo live imaging of intra-vitreally injected
fluorescent
MSC-EVs. Figure 53: Uptake of MSC-EVs intro vitreous and retina of normal and
ischemic
eyes was imaged in real time by in vivo fundus imaging for a time course of
four weeks
(days 1 and 3, weeks 1, 2, and 4), using a Phoenix Micron IV. The control non-
ischemic
eyes are on the left and ischemic on the right in each of the two columns in
(A). Fluorescent
MSC-EVs were present for up to 4 weeks after injection into the vitreous
humor.
Concentration of the MSC-EVs at the sites of injection into the vitreous and
in the needle
track likely explain the intense fluorescence in the day 1 and 3 images.
Figure 54: Graph
representing binding of fluorescently labeled MSC-EVs to 50 pg of isolated
humor coated to
96-well assay plates. The binding of MSC-EVs to the vitreous humor was
saturable. Data
point represent mean SD (n = 6 experiments) of normalized fluorescence
intensity.
[0061] Figures 55, 56, and 57. Uptake and distribution of MSC-EVs by normal
and
ischemic retinae in vivo. Flat mount confocal microscopic imaging of retinae
injected with
fluorescent MSC-EVs and stained with retinal markers anti-Brn-3a for retinal
ganglion cells
(RGCs), anti-lba-1 for microglia and nuclei (DAR). Figure 55: Representative
images
displayed for days 1, 3 and 7 for PBS-injected control (I) and ischemic (II)
retinae. Figure 56:
Representative images displayed for days 1, 3, and 7 for MSC-EV injected
control (III) and
ischemic retinae. For each group a low magnification image is presented in one
channel
indicating the overview of the flat mount. The square white box indicates the
representative
area shown under high magnification. Higher magnification images (63x) are
provided in all
channels followed by a merged image for days I (A to E), 3 (F to J) and 7 (K
to 0).
Comparing (III) and (IV), enhanced MSC-EV uptake can be seen in the ischemic
(IV)
compared to the normal retina (III), along with enhanced co-localization with
the activated
microglia. The composite images (E, J, and 0) for each group show co-
localization of MSC-
EVs and microglia (white arrows in panel VE), and Brn3a (white dots, shown by
grey arrows
in panel VE), indicating that MSC-EVs were taken up by both RGCs and microglia
after
-11-
CA 03106818 2021-01-15
WO 2020/023251
PCT/US2019/042096
intravitreal administration. Grey arrows in panels HD and IVD show the greater
arnoeboid
shape as opposed to ramified microglia indicating greater activation of
rnicroglia in ischemia-
PBS injected compared to ischemia-MSC-EV injected retinae. N = 3 per time
point. Figure
57: The uptake of MSC EVs by RGCs is further illustrated in (B), that are
representative
digital magnification of retinal flat mount images in (A) illustrating co-
localization of MSC-EVs
and distribution by specific retinal cell type in MSC-EV injected control and
ischemic retinae.
Grey arrows in the top panel of (b) point to RGCs co-localized with MSC-EVs
and dark
arrows in the bottom panel of (b) point to MSC-EVs with microglial cells.
[0062] Figure 58. High magnification confocal imaging of retinal flat mounts
shows
that retinal neurons and retinal ganglion cells take up MSC-EVs, and that
ischemia
increases uptake. Top panel shows control, non-ischemic retina, and bottom
panel shows
ischemic retina. Retinal flat mounts of non-ischemic eyes injected with
labeled MSC-EVs,
stained for (A) DAPI, (B) EVs alone, (C) Beta-tubuiin Ill alone (13T3), and
(D) Brn-3a alone,
(E) EVs 3-r3 and (F) EVs Brn-3a. 3-r3 stains only neurons and their axonal or
dendritic
projection. These flat mounts are from retinas harvested 24 h after injection
of MSC-EVs,
which was 48 h after ischernia. Arrows in (F) indicate the presence of EVs
within the cell
body of the retinal ganglion cells (Brn-3a stains only the nuclei of RGCs).
Note that the
majority of cells in (B), (E), and (F) show punctate staining indicating that
EVs were taken up
by the cells. White arrows in (E) show the co-localization between the MSC-EVs
and the
retinal neuron cell bodies. White arrowheads mark the axonal or dendritic
projection of the
retinal neurons, and the presence therein of MSC-EVs (E).
[0063] Figure 59. Differential miRNA reads in various groups of exosomes. The
third
column represents the total number of the raw reads in the original input
file. The fourth
column represents the numbers of the reads which can be mapped to the miRNA
reference
genome. The fifth column represents the percentage of the reads which can be
mapped to
the miRNA reference genome comparing to the total number of the short reads.
The sixth
column represents the number of the reads which can be mapped to the miRNA
reference
genome, after the PCR duplicates have been removed. Also, a big portion of the
reads
which can be mapped as miRNA are PCR duplicates. In the second tab (Raw
count), the
number of the short reads which can be mapped as miRNA are further classified
by each
miRNA. Each column represents a sample. Each row represents one miRNA. In each
sample, the number of reads for each miRNA were normalized by the library size
(number of
the total reads in the library).
[0064] Figure 60. Table of top miRNA reads for various exosome sample
populations.
[0065] Figure 61. Schematic for reaction assembling alginate peptide
modification.
[0066] Figure 62. Schematic for reaction assembling methacrylated alginate.
-12-
CA 03106818 2021-01-15
WO 2020/023251
PCT/US2019/042096
[0067] Figures 63. Graph showing hMSC Regular exosome binding and releasing
profiles on the coated peptides ¨ volume of exosomes study. Binding and
release of
MSC exosomes to various collagen and fibronectin derived peptides was assayed.
[0068] Figure 64. Graph showing hMSC Regular Exosome binding and releasing
profiles on the coated peptides ¨ time study. Binding and release of MSC
exosomes to
various collagen and fibronectin derived peptides was assayed.
[0069] Figures 65. Graph showing hMSC exosome release from photocrosslinkable
alginate hydrogels.
[0070] Figure 66. Graphs showing hMSC exosome release profile from
photocrosslinkable alginate hydrogeis with and without RGD.
[0071] Figure 67. hMSC Regular Exosome loaded in the alginate hydrogel
(AMARGD),
4 hrs after hMSC seeded on top of the hydrogel . Staining is for nuclei (DAR).
[0072] Figure 68. hMSC Regular Exosome loaded in the alginate hydrogel
(AMARGD),
4 hrs after hMSC seeded on top of the hydrogel . Staining is for exosomes.
[0073] Figure 69. hMSC Regular Exosome loaded in the alginate hydrogel
(AMARGD),
4 hrs after hMSC seeded on top of the hydrogel . Staining shown is merged, for
both
nuclei and exosomes.
[0074] Figure 70. hMSC Regular Exosome loaded in the alginate hydrogel
(AMARGD),
3 days after hMSC encapsulated in the hydrogel ¨ merged staining, actin and
exosomes.
[0075] Figure 71, 71A. hMSC Regular Exosome loaded in the alginate hydrogel
(AMARGD), 3 days after hMSC encapsulated in the hydrogel. Figure 71: top,
exosomes;
bottom, actin. Figure 71A: merge of exosomes and actin.
[0076] Figure 72. Exosome release kinetics for various 3-0 printed hydrogels.
[0077] Figure 73. hMSC BMP2 Exosomes loaded on alginate hydrogei in vitro
experiment ¨ contactless experiment. The top figure shows the configuration
for the
experiment. The bottom shows the fold change at 3 days and 5 days for the
factors
indicated.
[0078] Figure 74. hMSC BMP2 Exosomes loaded on alginate hydrogel in vitro
experiment ¨ contact experiment. The top figure shows the configuration for
the
experiment. The bottom shows the fold change at 3 days and 5 days for the
factors
indicated.
[0079] Figure 75. BMP2 Exo mediated bone regeneration. Representative pCT
images
showing regeneration of bone in 5mm calvarial defects that were treated with
plain collagen
sponge (Control), collagen sponge containing controi EVs (Ctrl. Exo), collagen
sponge
containing BMP2 (BMP2 GE) and collagen sponge containing BMP2 Exo at 4, 8 and
12
weeks post wounding,
-13-
CA 03106818 2021-01-15
WO 2020/023251
PCT/US2019/042096
[0080] Figure 76. hMSC BMP2 Exosomes loaded on alginate hydrogel in vivo
experiment. Similar to Figure 75, with calyarial defects treated with exosomes
on alginate
hydrogeis. Results for 4 and 8 weeks are shown.
[0081] Figure 77. List of miRNA primer sequences used to measure expression
levels
in exosomes.
[0082] Figure 78. Isolation and characterization of EVs. A) Representative NTA
plots of
EVs isolated from naIve, osteogenic, chondrogenic and adipogenic
differentiated HMSCs.
Note that the size distribution falls within the range of extracellular
vesicles characterized as
EVs. B) Representative transmission electron microscopy images of the EVs
isolated from
naïve, osteogenic, chondrogenic and adipogenic HMSCs. C) Immunoblot of protein
isolates
from EVs from naïve, osteogenic, chondrogenic and adipogenic HMSCs showing the
presence of CD63 exosomal marker protein. D) Immunoblot indicating the
presence of EV
marker CD9 in the EV protein isolates mentioned above.
[0083] Figure 79. Endocytosis of HMSC EVs by HMSCs. A) Graphical
representation of
dose-dependent and saturable endocytosis of fluorescently labeled HMSC EV by
naïve
HMSCs. Data points represent mean fluorescence (n=6) +/- SD. The EV
volume/particle
number was standardized as described under the methods section. B) Graph
showing the
dose dependent inhibition of HMSC EV endocytosis after pre-treatment of the
EVs with
heparin to block interaction with the cell surface HSPGs. Data represent mean
percentage
fluorescence with respect to control +/- SD (n=6). * represents statistical
significance
(P<0.05) with respect to control by student's t-test. C) Graph showing the
reduction in
HMSC endocytosis after disruption of target cell membrane cholesterol with
varying doses of
MBCD. Data is presented as mean percentage fluorescence with respect to
control +/- SD
(n=6). * represents statistical significance (P<0.05) with respect to control
by student's t-test.
D) Representative confocal micrograph depicting the endocytosed fluorescently
labeled
HMSC EVs within target HMSCs after 1 hour of incubation at 37 C. E)
Representative
confocal micrograph indicating the abrogation of MSC EV endocytosis when the
experiment
is performed at 4 C. F) Representative confocal micrograph showing that pre-
treatment of
EVs with heparin blocks MSC EV endocytosis. G) Representative confocal
micrograph of
MSC EV endocytosis after pre-treatment of the cells with 2mM RGD peptide to
block cell
surface integrins. In images D, E, F and G EVs, tubulin, and nuclei are
labeled. H) Confocal
micrograph showing colocalization of endocytosed MSC EVs with caveolin1. I)
Confocal
micrograph showing the absence of co-localization between endocytosed EVs and
clathrin.
[0084] Figure 80. Endocytosis of EVs isolated from differentiated HMSCs. A)
Representative confocal micrographs of fluorescently labeled EVs isolated from
control
(naïve), osteogenic, adipogenic and chondrogenic HMSCs endocytosed by naïve
HMSCs.
In all images, EVs and blue represents DAPI nuclear stain. Scale bar
represents 10um in all
-14-
CA 03106818 2021-01-15
WO 2020/023251
PCT/US2019/042096
images. B) Graph showing dose dependent and saturable endocytosis of EVs
isolated from
osteogenic, chondrogenic and adipogenic HMSCs by naïve HMSCs. Data points
represent
mean percentage fluorescence with respect to the highest concentration +/- SD
(n=6). Note
the absence of any significant difference in endocytosis between EVs isolated
from the three
lineages.
[0085] Figure 81. EV mediated lineage-specific differentiation of HMSCs in
vitro. A, B
and C represent fold changes in gene expression levels of representative
marker genes for
osteogenic, chondrogenic and adipogenic differentiation of HMSCs after
treatment of naïve
HMSCs for 72 hours with the EVs isolated from respectively differentiated
HMSCs. The data
are presented as mean fold change with respect to control (n=4). The data
presented also
shows the statistical significance in the form of P value for each data point
obtained by
student's t-test in comparison with the respective controls. The data
represents fold change
for genes unique to the specific lineage. No significant change was observed
in the
represented genes upon treatment with EVs from other lineages.
[0086] Figures 82 and 83. EV mediated lineage-specific differentiation of
HMSCs in
vivo. A) Confocal micrographs representing immunohistochemical staining for
the presence
of phosphorylated proteins (pSTT) by staining for phosphorylated serines,
threonines and
tyrosines and DMP1 in control and osteogenic EV treated subcutaneous explant
tissue
sections. Note the increase in the expression levels of phosphorylated
proteins and DMP1
in the osteogenic EV treated group. B) Confocal micrographs representing
immunohistochemical staining for type ll collagen and the anti-angiogenic
factor PEDF in
control and chondrogenic EV treated subcutaneous explant tissue sections. Note
the
increase in the expression levels of both proteins in the chondrogenic EV
treated group. C)
Confocal micrographs representing immunohistochemical staining for PPARy and
caveolin 1
(cav-1) in control and adipogenic EV treated subcutaneous explant tissue
sections. Note the
increase in the expression levels of PPARy and the decrease in the expression
levels of
caveolin1 in the chondrogenic EV treated group. Additionally, also note the
presence of fat
globule-like morphology in the PPARy positively stained cells.
[0087] Figure 84. Characterization of BMP2 OE HMSCs and BMP2 EV. A) Graph
representing the fold change in the expression levels of BMP2 gene in vector
control and
BMP2 OE HMSCs with respect to untreated controls. Data represent mean fold
change +/-
SD of three independent cultures. B) Representative images of alizarin red
stained culture
dishes of control, vector control and BMP2 OE HMSCs after 7 days of culture in
osteogenic
differentiation media. Note the increase in calcium deposits in the BMP2 OE
HMSC group.
C) Representative TEM image of BMP2 EV immunolabeled for CD63 (10nm gold
dots). D)
Representative NTA plot of BMP2 EV indicating exosomal size distribution. E)
Graphical
-15-
CA 03106818 2021-01-15
WO 2020/023251
PCT/US2019/042096
representation of dose-dependent and saturable endocytosis of fluorescently
labeled BMP2
EVs by naïve HMSCs. Data points represent mean fluorescence (n=6) +/- SD. The
EV
volume was standardized as described under the methods section.
[0088] Figures 85 and 86. BMP2 EVs potentiate the BMP2 signaling cascade. A)
Fold
change in osteogenic gene expression (w.r.t untreated control) after HMSCs
were treated
with BMP2 EVs for 72 hrs. * Represents statistical significance w.r.t
untreated control group
(n=4). B) Representative western blot showing phosphorylated SMAD 1/5/8 (red
lanes to
the left) and tubulin (green to the right) after treatment of HMSCs with
rhBMP2, Control EVs
and BMP2 EVs. Note the increase in the band intensity for phosphorylated SMAD
1/5/8
after treatment with positive control BMP2 and with BMP2 EVs. The graph below
shows
percentage increase in luciferase activity of the SMAD 1/5 specific reporter.
Note the
increase in activity after treatment with BMP2, BMP2 EVs and the combination
of BMP2 and
BMP2 EVs. * Represents statistical significance w.r.t untreated control and #
represents
statistical significance w.r.t the rhBMP2 treated group (n=4 for all groups).
C) Dual
immunoblot for BMP2 (red) and CD63 (green) showing the presence of BMP2 in the
EV-
depleted conditioned medium from the BMP2 OE cells but not in the EV protein
isolates of
the control cell conditioned medium. CD63 was observed in the EV protein
isolates only. D)
Table listing the mean fold change (n=4) in the expression levels of miRNA
that bind to the
3'UTR of SMAD7 and SMURF1. miR 3960 is a pro-osteogenic miRNA that remained
unchanged and is used as a control to show pathway specific increase in EV
miRNA
composition. P value was calculated using student's t-test.
[0089] Figures 87 and 88. BMP2 Exo mediated bone regeneration. A)
Representative
1..iCT images showing regeneration of bone in 5mm calvarial defects that were
treated with
plain collagen sponge (Control), collagen sponge containing control EVs (Ctrl.
Exo), collagen
sponge containing BMP2 (BMP2 GF) and collagen sponge containing BMP2 Exo at 4,
8-
and 12-weeks post wounding. The arrow in the 12 week BMP2 CF group shows
ectopic
bone formation. B) Volumetric quantitation of the 1..iCT data expressed as
percentage bone
volume regenerated with mineralized tissue (n=6 defects per group per time
point). *
represents statistical significance (P<0.05, student's t-test) with respect to
the collagen
control group (no EV). # represents statistical significance (P<0.05,
student's t-test)
between the control EV and BMP2 CF group. tic# represents statistical
significance (P<0.05,
student's t-test) between the BMP2 EV and control EV groups.
[0090] Figure 89. Histological evaluation of calvarial defects. Images are
representative
light microscopy images of H&E stained demineralized calvarial samples of
defects treated
with plain collagen sponge (Control), collagen sponge containing control EVs
(Ctrl. Exo),
collagen sponge containing BMP2 (BMP2 CF) and collagen sponge containing BMP2
Exo
-16-
CA 03106818 2021-01-15
WO 2020/023251
PCT/US2019/042096
after 4, 8 and 12 weeks post wounding. The black arrows in the images point to
regenerated
bone tissue. The yellow arrows in the BMP2 CF group point to fat deposits
within the
regenerated bone. Scale bar represents 200m in all images.
[0091] Figures 90 and 91. BMP2 and BSP IHC. Images represent the expression
levels of
BMP2 and BSP in the calvarial sections from the different groups after 4
weeks. Note the
increase in the expression levels of both proteins in the rhBMP2 treated (BMP2
GF) and
BMP2 EV treated groups.
[0092] Figures 92 and 93. DMP1 and OCN IHC. Images represent the expression
levels of
DMP1 and OCN in the calvarial sections from the different groups after 4
weeks. Note the
increase in the expression levels of both proteins in the BMP2 EV treated
group compared to
the control groups.
DETAILED DESCRIPTION
[0093] Provided herein are compositions, methods, and systems for making and
using
engineered exosomes and treating various disorders, such as bone or neuronal
disorders,
thereby.
[0094] Before the disclosed processes and materials are described, it is to be
understood
that the aspects described herein are not limited to specific embodiments, and
can vary. It
also will be understood that the terminology used herein is for the purpose of
describing
particular aspects only and, unless specifically defined herein, is not
intended to be limiting.
[0095] In view of the present disclosure, the methods and compositions
described herein
can be configured by the person of ordinary skill in the art to meet a
particular desired need.
In general, the disclosed materials and methods provide advances over the
prior art
regarding exosome compositions and their use in treatment of various diseases
and
disorders.
[0096] Tissue engineering approaches for regenerating tissues such as bone,
cartilage,
skin, muscle and liver utilize growth factors and morphogens to enable stem
cell
differentiation. This approach is fraught with challenges such as dosage,
ectopic activity,
delivery and immunological complications limiting clinical use and
translation. Engineered
exosomes can be used as an alternative to growth factors to induce/enhance
tissue
regeneration. As disclosed herein, functionality and target specificity has
been engineered
into exosomes to generate Functionally Activated Targeted Exosomes (FATE) for
tissue
engineering and regenerative medicine applications.
Therapeutic Applications
[0097] The compositions of the disclosure as provided herein can be used in
treatment of
varous diseases and disorders. Thus, in one aspect, the disclosure provides
methods of
treating bone diseases or disorders. Such methods include administering the
compositions
-17-
CA 03106818 2021-01-15
WO 2020/023251
PCT/US2019/042096
of the disclosure as described herein to a subject in need of treatment. Bone
diseases that
can be treated with the methods of the disclosure, for example, include but
are not limited to
bone defect, damage, and fracture, including for dentoalveolar indications. In
certain
embodiments, the bone disease is a bone defect, damage, or fracture.
[0098] In another aspect, the disclosure provides methods for treatment of
neurological
diseases or disorders. Such methods include administering the compositions of
the
disclosure as described herein to a subject in need of treatment. Neurological
diseases or
disorders that can be treated with the methods of the disclosure, for example
include, but are
not limited to, stroke/ischemia, loss of neuronal function, neuronal cell
death and severed
nerves. In certain embodiments, the neurological disease is stroke/ischemia.
In some
embodiments, the disclosure provides method for treating a disease or disorder
in an
individual, comprising administering a therapeutically effective amount of the
composition of
any of claims 1-42 to the individual in need thereof. In some embodiments, the
disease or
disorder is a bone disorder. In some embodiments, the disease or disorder is
bone defect,
fracture, or a dentoalveolar disorder.
[0099] In some embodiments, the disease or disorder is a neurological
disorder. In some
embodiments, the disease or disorder is ischemia, loss of neuronal function,
neuronal cell
death, or severed nerves. In some embodiments, the composition is administered
by
injection.
[0100] In some embodiments, the composition is administered by implantation.
In some
embodiments, the composition is administered by 3D-printed material. In some
embodiments, the dosage is 1x10⁶ to 1x10¹² exosomes per unit mm3 of graft,
tissue, patch
or injection volume or ointment.
[0101] In some embodiments, the disclosure provides a method for treating an
eye disorder
in an individual comprising delivering a composition of isolated exosomes to
vitreous humour
of the individual, wherein the exosomes are enriched in regenerative factors
endogenous to
stem cells.
Administration of the compositions
[0102] In some embodiments, dosages of 1x10⁶ to 1x10¹² exosomes per unit mm3
of graft,
tissue, patch, or injection volume are administered. Exosome dosage may be
determined by
the volume of the area to be treated (i.e. the size of the graft or tissue),
or by the volume of
the composition to be administered (i.e. the size of the patch, or the volume
to be injected).
[0103] In some embodiments, exosome compositions are administered as a single
bolus. In
other embodiments, multiple administrations can be required. For example,
exosomes can
be administered every other month, once per month, twice per month, one per
week, week,
several times per week (e.g., every other day), or once per day, depending
upon, among
-18-
CA 03106818 2021-01-15
WO 2020/023251
PCT/US2019/042096
other things, the mode of administration, the specific indication being
treated, and the
judgment of the prescribing physician.
[0104] Various methods of administering exosomes are contemplated. Exosome
compositions disclosed herein can take a form suitable for virtually any mode
of
administration, including, for example, topical, ocular, oral, buccal,
systemic, nasal, injection,
transdermal, rectal, vaginal, etc., or a form suitable for administration by
inhalation or
insufflation. In some embodiments, exosome compositions are administered by
injection.
Injection is a technique for delivering drugs by parenteral administration,
including
subcutaneous, intramuscular, intravenous, intraperitoneal, intracardiac,
intraarticular, and
intracavernous injection, all of which are contemplated by the present
disclosure.
[0105] In some embodiments, exosome compositions are administered by
implantation, i.e.
through use of an implant. An implant is a medical device manufactured to
replace a
missing biological structure, support a damaged biological structure, or
enhance an existing
biological structure. Implant surfaces that contact a body or portion thereof
can be made of a
biomedical material such as titanium, silicone, or apatite depending on what
is the most
functional. An implant can be made of a bioactive material.
Compositions of the Disclosure
[0106] In general, the present disclosure concerns compositions and methods of
making
and using isolated exosomes. As used herein, an isolated exosome is an exosome
that is
physically separated from its natural environment. For example, an isolated
exosome may
be physically separated, in whole or in part, from tissue or cells within
which it naturally
exists, including MSCs, In some embodiments of the disclosure, a composition
of isolated
exosomes may be free of cells such as MSCs or free or substantially free of
media.
[0107] In some embodiments, the disclosure provides compositions comprising
isolated
engineered exosomes from mesenchymal stem cells (MSCs), each exosome
comprising at
least one factor that is: an osteoinductive factor, a neuronal regeneration
factor, an
immunomodulatory factor, an extracellular matrix binding factor, or a
combination thereof,
wherein the at least one factor is present at a higher amount in the
engineered exosome
than the amount present in a naturally occurring cell-derived exosome.The
exosomes of the
disclosure are also engineered. In some embodiments, the exosomes are
engineered in
vitro. The exosomes can be engineered through genetic modification of a
parental cell that
gives rise to the exosomes. In some embodiments, exosomes are engineered by
exposing
parental cells to a stimulus, for instance, a particular compound or molecule
in the culture
medium. In some embodiments, the stimulus can be a deficit of a necessary
element (i.e.,
oxygen).
Factors
-19-
CA 03106818 2021-01-15
WO 2020/023251
PCT/US2019/042096
[0108] In some embodiments, the engineered exosomes comprise one or more
factors at a
higher level or concentration than the level or concentration present in a
naturally occurring
cell-derived exosome. A factor can be a molecule, for instance, a protein,
peptide, nucleic
acid, lipid, or carbohydrate. A factor can be a small molecule or a
macromolecule.A naturally
occurring cell-derived exosome is an exosome that has arisen without human
manipulation
of the parent cell or the exosome itself. If a naturally occurring exosome has
been isolated, it
has been isolated using means that do not change any of its characteristics.
[0109] In some embodiments, the one or more factors is one or more microRNAs.
A
microRNA (miRNA, or miR as named) is a small non-coding RNA molecule
(containing
about 22 nucleotides) found in plants, animals and some viruses, that
functions in the
regulate gene expression in various biological processes and signaling
pathways.
MicroRNAs are abundant in many mammalian cells and are known to target
approximately
60% of genes. They also play a key role in various pathologies ranging from
metabolic
diseases to cancer. miRNA can impact biological function as either suppressors
of gene
expression (when their expression levels are enhanced, for instance, in
disease state or
through human intervention) or upregulators of gene expression (when their
expression
levels are reduced). A microRNA can be tissue specific or ubiquitously
expressed. In some
embodiments of the current disclosure, the compositions comprise one or more
of let 7a,
miR 218, miR 9-5p, miR 19a-3p, mir 30a-5p, miR 212-5p, miR 323-5p, miR 15a,
miR 15b,
miR 16, miR 424 and miR 497at a higher level than the level present in a
naturally occurring
cell-derived exosome. In some embodiments, the one or more factors is a member
of a
particular molecular pathway ("pathway member"). A pathway member isa molecule
for
which activity or amount in a given cell is responsive to the activity or
amount of the named
molecule defining the pathway.
[0110] In some embodiments, the one or more factors comprise osteoinductive
factors.
Osteoinductive factors are those that promote or facilitate development or
healing of bone
tissue. These factors can be present in the exosomes, and in addition, they
can be used to
engineer parental cells to yield potent exosomes (i.e. these factors can be a
"stimulus").
Osteoinductive factors include, but are not limited to, transforming growth
factors (TGFs),
bone morphogenetic proteins (BMPs), fibroblast growth factors (FGFs), insulin-
like growth
factors (IGFs), platelet-derived growth factors (PDGFs), osterix (OSX), and
RUNX. A
microRNA, such as let 7a, miR 218, miR 9-5p, miR 19a-3p, mir 30a-5p, miR 212-
5p, miR
323-5p, miR 15a, miR 15b, miR 16, miR 424 and/or miR 497, can be an
osteoinductive
factor.
[0111] In some embodiments, the one or more factors comprose neuronal
regeneration
factors. Neuronal regeneration factors are those that promote or facilitate
development or
healing of neuronal tissue. These factors can be present in the exosomes, and
in addition,
-20-
CA 03106818 2021-01-15
WO 2020/023251
PCT/US2019/042096
they can be used to engineer parental cells to yield potent exosomes (i.e.
these factors can
be a "stimulus"). Neuronal regeneration factors include, but are not limited
to, c-Jun,
activating transcription factor-3 (ATF-3), SRY-box containing gene 11 (Sox11),
small proline-
repeat protein 1A (SPRR1A), growth-associated protein-43 (GAP-43) and CAP-23.
A
microRNA, such as miR 424, can be a neuronal regeneration factor.
[0112] In some embodiments, the one or more factors comprise immunomodulatory
factors.
Immunomodulatory factors are those that influence aspects of the immune
system, for
instance, macrophage populations.These factors can be present in the exosomes,
and in
addition, they can be used to engineer parental cells to yield potent exosomes
(i.e. these
factors can be a stimulus"). Immunomodulatory factors include, but are not
limited to
cytokines, interferon, interleukin, antigens, and growth factors. A microRNA,
such as miR-9-
5p, miR19a-3p, miR-30a-5p, miR-212-5p, and/or miR-323-5p, can be an
immunomodulatory
factor.
[0113] In some embodiments, the composition comprises isolated engineered
exosomes
from mesenchymal stem cells (MSCs), each exosome comprising at least one
factor that is:
an osteoinductive factor, a neuronal regeneration factor, an immunomodulatory
factor, an
extracellular matrix binding factor, or a combination thereof, wherein the at
least one factor is
present at a higher amount in the engineered exosome than the amount present
in a
naturally occurring cell-derived exosome. In some embodiments, the at least
one
osteoinductive factor is present in the engineered exosome at a higher amount
than the
amount present in a naturally occurring cell-derived exosome. In some
embodiments, the at
least one osteoinductive factor comprises let 7a, miR 218, miR 9-5p, miR 19a-
3p, mir 30a-
5p, miR 212-5p, and miR 323-5p. In some embodiments,the at least one
osteoinductive
factor comprises let 7a. In some embodiments, the amount of let 7a in the
engineered
exosomes is at least 10-fold higher than the amount of let 7a in the naturally
occurring cell-
derived exosomes.ln some embodiments, the amount of let 7a in the engineered
exosomes
is at least 35-fold higher than the amount of let 7a in the naturally
occurring cell-derived
exosomes. In some embodiments, the at least one osteoinductive factor
comprises miR
218.In some embodiments, the amount of miR 218 in the engineered exosomes is
at least
10-fold higher than the amount of miR 218 in the naturally occurring cell-
derived
exosomes.ln some embodiments, the amount of miR 218 in the engineered exosomes
is at
least 45-fold higher than the amount of miR 218 in the naturally occurring
cell-derived
exosomes. In some embodiments, the at least one osteoinductive factor
comprises one or
more of miR-9-5p, miR-19a-3p, miR-30a-5p, miR-212-5p, miR-323-5p, miR 15a, miR
15b,
miR 16, miR 424, and miR 497. In some embodiments, the at least one
osteoinductive
factor is an miRNA that positively regulates at least one RUNX2 and/or OSX
pathway
member.ln some embodiments, the amount of the one or more osteoinductive
factors in the
-21-
CA 03106818 2021-01-15
WO 2020/023251
PCT/US2019/042096
engineered exosomes is at least 3-fold higher than the amount of any of the
one or more
osteoinductive factors in the naturally-occurring cell-derived exosomes.ln
some
embodiments, the engineered exosomes comprise at least one immunomodulatory
factor,
wherein the composition decreases the ratio of pro-inflammatory M1 macrophages
to anti-
inflammatory M2 macrophages relative to the ratio demonstrated by the activity
of naturally
occurring cell-derived exosome.
[0114] In some embodiments, the at least one immunomodulatory factor comprises
miRNAs
that downregulate at least one NFxB, SOCS3, and/or IRF-5 pathway member. In
some
embodiments, the at least one immunomodulatory factor comprises miRNAs that
upregulate
at least one LXR-alpha, STAT6, and/or P13/Akt pathway member.ln some
embodiments, the
ratio of pro-inflammatory M1 macrophages to anti-inflammatory M2 macrophages
is less
than the ratio present in non-healing wound of bone or neuronal tissues.
[0115] In some embodiments, the engineered exosomes comprise at least one
neuronal
regeneration factor, wherein the at least one neuronal regeneration factor is
present at a
higher amount than the amount present in a naturally occurring cell-derived
exosome. In
some embodiments, the at least one neuronal regeneration factor comprises miR
424. In
some embodiments, the amount of miR 424 in the engineered exosomes is at least
10-fold
higher than the amount of miR 424 in the naturally occurring cell-derived
exosome. In some
embodiments, the amount of miR 424 in the engineered exosome is at least 100-
fold higher
than the amount of miR 424 in the naturally occurring cell-derived exosomes.
[0116] In some embodiments, the engineered exosomes comprise at least one
extracellular
matrix binding factor, wherein the at least one extracellular matrix binding
factor is present in
the engineered exosome at a higher amount- than the amount present in a
naturally
occurring cell-derived exosome. In some embodiments, the at least one
extracellular matrix
binding factor comprises integrin a5. In some embodiments, the amount of
integrin a5 in the
engineered exosome is at least 1.5-fold higher than the amount of integrin a5
present in a
naturally occurring cell-derived exosome. In some embodiments, the at least
one
extracellular matrix binding factor increases the binding affinity or rate to
one or more
components of the extracellular matrix and/or extracellular matrix- derivative
peptides in a
dose-dependent manner. In some embodiments, the components of the
extracellular matrix
comprise one or more of proteins (e.g., collagen, elastin, fibrin etc.),
glycoproteins (e.g.,
fibronectins, laminins, etc.), proteoglycans, and polysaccharides (e.g.,
hyaluronic acid,
alginate, heparin functionalized with extracellular matrix proteins or
extracellular matrix-
derivative peptide motifs, PLA functionalized with extracellular matrix
proteins or extracellular
matrix-derivative peptide motifs, and PGA functionalized with extracellular
matrix proteins or
extracellular matrix-derivative peptide motifs). In some embodiments, the one
or more
components of extracellular matrix comprises one or more of COL1 and FN1.
-22-
CA 03106818 2021-01-15
WO 2020/023251
PCT/US2019/042096
[0117] In some embodiments, the engineered exosomes comprise an osteoinductive
factor
and integrin a5 present at a higher amount than the amount present in a
naturally occurring
cell-derived exosome. In some embodiments, the at least one factors comprises
one or more
of let 7a, miR 218, miR 9-5p, miR 19a-3p, mir 30a-5p, miR 212-5p, miR 323-5p,
miR 15a,
miR 15b, miR 16, miR 424, miR 497, miR 424-, or integrin a5. In some
embodiments, the at
least one factor comprises one or more microRNAs listed in Figure 60.
[0118] In some embodiments, the amount of the at least one factor in the
exosomes is at
least about 1.5-fold higher, about 3-fold higher, about 10-fold higher, about
11-fold higher,
about 20-fold higher, about 50-fold higher, about 100-fold higher, about 115-
fold higher, or
about 200-fold higher than the amount present in the naturally occurring cell-
derived
exosome.
[0119] The number of engineered exosomes in an exosome composition can be any
suitable number in order to provide or maintain a sufficient therapeutic or
prophylactic effect.
For example, in certain embodiments, the number of engineered exosomes in a
composition
is in a range of about 1x10² to about 1x10²⁰; for example, in a range of about
1x10² to about
1x10¹⁶, about 1x10² to about 1x10¹², about 1x10² to about 1x10¹⁰, about 1x10²
to about
1x10⁶, about 1x10⁶ to about 1x10²⁰, about 1x10⁶ to about 1x10¹², about 1x10⁶
to about
1x10¹⁰, about 1x10¹⁶ to about 1x10²⁰, about 1x10¹² to about 1x10²⁰, or about
1x10¹⁶ to
about 1x10²⁰. In certain embodiments, the number of engineered exosomes in the
exosome
composition is in a range of about 1x10⁶ to about 1x10¹².
[0120] Exosome compositions as described herein can be formulated into a
composition
suitable for administration in vivo. Thus, in one embodiment, exosome
compositions of the
disclosure, in addition to the isolated engineered exosomes as described
herein, can further
include a polymer carrier (e.g., a biodegradable polymer carrier).
[0121] In certain embodiments, the carrier includes one or more biocompatible
polymers or
oligomers. Examples of biocompatible polymers or oligomers include, but are
not limited to,
alginate, agarose, hyaluronic acid/hyaluronan, polyethylene glycol,
poly(lactic acid),
poly(vinyl alcohol), polyanhydrides, poly(glycolic acid), collagen, gelatin,
heparin,
glycosaminoglycans, saccharides (e.g., glucose, galactose, fructose, lactose,
and sucrose),
and self-assembling peptides. In certain embodiments, the biocompatible
polymer is
alginate, hyaluronic acid/hyaluronan, polyethylene glycol, poly(lactic acid),
or poly(vinyl
alcohol). In certain embodiments, the biocompatible polymer is alginate.
[0122] Particularly useful carriers suitable for the compositions of the
disclosure are
hydrogels. Thus, in some embodiments, the compositions comprise a hydrogel as
the
carrier.
[0123] A hydrogel of the disclosure, in certain embodiments, includes a
plurality of
biocompatible polymers or oligomers as described herein cross-linked with a
hydrolysable
-23-
CA 03106818 2021-01-15
WO 2020/023251
PCT/US2019/042096
linker. The linker can comprise an acrylate or a methacrylate, and optionally
an ester,
amide, or a combination thereof. In certain exemplary embodiments, the carrier
is a
hydrogel comprising alginate, hyaluronic acid/hyaluronan, polyethylene glycol,
poly(lactic
acid) or poly(vinyl alcohol), cross-linked with an acrylate linker or a
methacrylate linker, and
optionally an ester linker, amide linker, or a combination thereof.
[0124] In certain embodiments, engineered exosomes are bound to the carrier.
To improve
binding of the engineered exosomes with the carrier, one approach is for the
carrier to mimic
the cell adhesion capacity of native extracellular matrix (ECM) components.
One approach
includes incorporating a cell surface-binding factor into the carrier. Thus,
in certain
embodiments, one or more of the biocompatible polymers or oligomers of the
carrier include
a cell surface-binding factor. Such cell surface-binding factor can be a
component of
extracellular matrix, and is generally well known in the art. For example, in
certain
embodiments, the cell surface binding factor includes a fibronectin-derived
peptide, a type I
collagen-derived peptide, a peptide containing an MMP, or a combination
thereof. The
fibronectin-derived peptide is, for example, RGD. The collagen-derived
peptide, for
example, is DGEA (SEQ ID NO: 1) or GFPGER (SEQ ID NO: 2). For example, in
certain
embodiments, exosomes are bound to the cell surface binding factor on the
carrier.
[0125] Carriers of the disclosure can also comprise a domain cleavable by one
intracellular
or extracellular release agent. In certain embodiments, carriers of the
disclosure also
comprise an enzymatic cleavable domain (e.g., a domain cleavable by one or
more
peptidases, proteases, esterases, elastases, etc.). In certain embodiments,
carriers of the
disclosure as otherwise described herein are cleavable by an intracellular or
extracellular
release agent. In certain embodiments, carriers of the disclosure as otherwise
described
herein are cleavable by two or more intracellular or extracellular release
agents (e.g.,
wherein the carrier comprises two or more different chemical groups each
cleavable by a
different release agent). In some embodiments, the carrier comprises
IPVSLRSGAGPEG
(SEQ ID NO: 3), GPLGLAGGERDG (SEQ ID NO:4), GFLG (SEQ ID NO:5), GPMGIAGQ
(SEQ ID NO:6), Phe-Leu, Val-Ala, Val-Cit, Val-Lys, Val-Arg, or Phe-Lys. In
certain
embodiments, the carrier comprises both the cell surface binding factor and
the cleavable
domain. For example, in certain embodiments, the carrier comprises
GGGGIPVSLRSGAGPEG_ DGEAY (SEQ ID NO:7).
[0126] Carriers of the disclosure can be present in an amount of 1 % to 20 %
by weight
based on the total weight of the composition. For example, in certain
embodiments, the
carrier is present in the amount of 1 wt% to 15 wt%, 1 wt% to 10 wt%, 1 wt% to
5 wt%, 5
wt% to 20 wt%, 5 wt% to 15 wt%, 5 wt% to 10 wt%, 10 wt% to 20 wt%, 10 wt% to
15 wt%, or
15 wt% to 20 wt%, based on the total weight of the composition.
-24-
CA 03106818 2021-01-15
WO 2020/023251
PCT/US2019/042096
[0127] In certain exemplary embodiments, compositions as described herein
comprise
1x10⁶ to about 1x10¹² of the engineered exosome and the carrier present in the
amount of 1
wt% to 15 wt%, based on the total weight of the composition.
[0128] The carrier can be provided in any form suitable for in vivo
administration. For
example, the carrier, such as the hydrogel, can be formulated in a variety of
physical forms,
including slabs, microparticles, nanoparticles, coatings, and films. In some
embodiments,
the hydrogel carrier of the present composition is formed by 3-D printing. In
3D printing,
material is joined or solidified under computer control to create a three-
dimensional object
with material being added together (such as liquid molecules or powder grains
being fused
together), typically layer by layer. The most-commonly used 3D-printing
process is a material
extrusion technique called fused deposition modeling (FDM). The 3D-printing
process builds
a three-dimensional object from a computer-aided design (CAD) model, usually
by
successively adding material layer by layer.
[0129] Another aspect of the disclosure provides methods of preparing the
compositions of
the disclosure. Such methods include engineering stem cells to contain at
least one factor
that is: an osteoinductive factor, a neuronal regeneration factor, an
immunomodulatory
factor, and an extracellular matrix binding factor at a higher level than stem
cells that are not
engineered; and isolating the exosome from the cells. Any method of isolating
exosomes
from parental cells known in the art can be used to isolate exosomes as
provided by the
invention. In some embodiments, the engineering comprises genetic modification
of the stem
cells and/or and exposure of stem cells to a stimulus. In some embodiments,
the genetic
modification of the stem cells comprises overexpression of BMP2 and/or RUNX2.
In some
embodiments, the genetic modification of the stem cells comprises
overexpression of one or
more of the following factors: let 7a, miR 218, miR 9-5p, miR 19a-3p, mir 30a-
5p, miR 212-
5p, miR 323-5p, miR 15a, miR 15b, miR 16, miR 424, miR 497, miR 424, and
integrin a5. In
some embodiments, the genetic modification of the stem cells comprises
overexpression of
at least one of BMP2, RUNX2, OSX, LXRalpha, STAT6 and/or P13/Akt pathway
members.
[0130] In some embodiments, the genetic modification of the stem cells
comprises
overexpression in an exosome-specific manner. In some embodiments, the
exposure of
stem cells to stimuli comprises culturing cells in the presence of one or more
of ascorbic
acid, p-glycerophosphate, and dexamethasone. In some embodiments, the exposure
of
stem cells to stimuli comprises treating cells with TNFa. In some embodiments,
the exposure
of stem cells to stimuli comprises exposing the stem cells to hypoxic
conditions.
[0131] In some embodiments, the stem cells are mesenchymal stem cells. In some
embodiments, the stem cells are dental pulp stem cells. In some embodiments,
the method
further comprises lyophilizing the isolated exosome to obtain a lyophilized
isolated exosome.
-25-
CA 03106818 2021-01-15
WO 2020/023251
PCT/US2019/042096
Definitions
[0132] Throughout this specification, unless the context requires otherwise,
the word
"comprise" and "include" and variations (e.g., "comprises," "comprising,"
"includes,"
"including") will be understood to imply the inclusion of a stated component,
feature,
element, or step or group of components, features, elements or steps but not
the exclusion
of any other component, feature, element, or step or group of component,
feature, element,
or steps.
[0133] As used in the specification and the appended claims, the singular
forms "a," "an"
and "the" include plural referents unless the context clearly dictates
otherwise.
[0134] As used herein, ranges and amounts can be expressed as "about" a
particular value
or range. About also includes the exact amount. Hence "about 5%" means "about
5%" and
also "5%." The term "about" can also refer to 10% of a given value or range
of values.
Hence, about 5% also means 4.5% - 5.5%, for example.
[0135] As used herein, the terms "or" and "and/or" are utilized to describe
multiple
components in combination or exclusive of one another. For example, "x, y,
and/or z" can
refer to "x" alone, "y" alone, "z" alone, "x, y, and z," "(x and y) or z," "x
or (y and z)," or "x or y
or z."
[0136] As used herein, the term "engineered" relative to naturally occurring
cell-derived
vesicles, refers to cell-derived vesicles (e.g., such as exosomes, liposomes
and/or
microvesicles) that have been altered such that they differ from a naturally
occurring cell-
derived vesicles.
[0137] As used herein, the term "genetic modification" refers to the genetic
manipulation of
one or more cells, whereby the genome of the one or more cells has been
augmented by at
least one DNA sequence. Candidate DNA sequences include but are not limited to
genes
that are not naturally present, DNA sequences that are not normally
transcribed into RNA or
translated into a protein ("expressed"), and other genes or DNA sequences
which one
desires to introduce into the one or more cells, including promoter sequences
that drive high
levels of expression (i.e. cause overexpression). It will be appreciated that
typically the
genome of genetically modified cells described herein is augmented through
stable
introduction of one or more recombinant genes. Generally, introduced DNA is
not originally
resident in the genetically modified cell that is the recipient of the DNA,
but it is within the
scope of this disclosure to isolate a DNA segment from a given genetically
modified cell, and
to subsequently introduce one or more additional copies of that DNA into the
same
genetically modified cell, e.g., to enhance production of the product of a
gene or alter the
expression pattern of a gene.
-26-
CA 03106818 2021-01-15
WO 2020/023251
PCT/US2019/042096
EXAMPLES
[0138] The Examples that follow are illustrative of specific embodiments of
the disclosure,
and various uses thereof. They are set forth for explanatory purposes only and
should not
be construed as limiting the scope of the disclosure in anyway.
Example 1: Osteoinductive exosomes with enhanced binding to the extracellular
matrix.
[0139] Exosomes influence the fate of target cells: Depending on the source
and target cell
type, exosomes are endocytosed by either clathrin or caveolin mediated
endocytosis. This
process triggers endocytosis mediated signaling cascades in target cells
mediated by the
extracellular receptor kinase family (ERK) and mitogen activated protein
kinase family
(MAPK). The endocytosis of exosomes also results in the transference of their
miRNA and
protein cargo intracellularly. After this discovery, there has been increased
focus on
applications in regenerative medicine as inducers of cell proliferation,
angiogenesis and as
immunomodulators for cancer therapy. The miRNA and protein composition of the
exosome
is unique to the parent cell type it is sourced from and can vary in content
and activity
depending on the state of the source cell.
[0140] The significance and translational relevance for FATE: The potential of
exosomes as
SCLD mediators for regenerative medicine applications is high. While isolation
is
straightforward, it is not practical to isolate autologous exosomes without
donor-dependent
risks and variability in composition and potency. Some recent studies have
shown that it is
possible to package protein and genetic material into exosomes for therapeutic
applications
and cellular delivery. However, the inherent exosomal property to affect the
recipient cell is
often overlooked in favor of target delivery. With the recent knowledge on
source and cell-
type specificity of exosomes, the targeting of exosomes and the ability to
engineer exosome
functionality to induce SCLD are translationally relevant areas of
investigation.
[0141] Primarily, targeting of exosomes can be engineered to be cell-type
specific or
biomaterial specific. Given the complexities of endocytic mechanisms of
different exosomes
by recipient cells, achieving cell-type specificity is not feasible. On the
other hand, it is
possible to achieve site-specificity or biomaterial specificity by controlling
exosome-ECM
interactions (Figure 1). Biomaterials for tissue-engineering applications
commonly contain
ECM sequences. As exosomal membranes are subsets of the plasma membrane,
specificity to these ECM proteins can be accomplished by modulating the
expression of
integrin a5 on the exosomal membranes. The translational significance of this
approach is
that it can be customized to impart specificity to any ECM component or motif
by targeting
appropriate transmembrane proteins/receptors.
[0142] Secondarily, by choosing application-specific cells as exosome sources
(MSCs
here), exosomes with specific functionality (FATE) can be engineered (Figure
1). As FATE
-27-
CA 03106818 2021-01-15
WO 2020/023251
PCT/US2019/042096
exosomes are engineered nano vesicles, they possess consistent properties
without donor-
dependent risks. Of additional translational significance are: 1) FATE can
potentially be
mass-produced using standardized cell lines. 2) Unlike the single morphogen
system, FATE
contain the necessary 'information' in the form of proteins and genetic
material in
physiologically relevant amounts to direct SCLD.
[0143] As a result of these drawbacks, bone regeneration is one of the most
widely
researched fields in regenerative medicine. Given the clinical need and the
well-
characterized system, bone regeneration has been chosen as a model system to
study
FATE. As many of the current allograft matrices for bone regeneration contain
COL1 and FN
(collagen membranes, DBM, etc.), the results of these experiments are
translationally
relevant to this field and to regenerative medicine in general.
[0144] Isolation of exosomes. Exosomes were isolated and characterized as per
published
protocols and as per standards developed for exosomal characterization.
Exosomes were
isolated from the culture medium of human marrow-derived MSCs (HMSCs). One day
prior
to isolation, the cell cultures were washed in serum free media and cultured
for 24 hours in
serum free media. The exosomes from the culture medium were isolated using the
ExoQuick-TC (System Biosciences) exosome isolation reagent as per the
manufacturer's
protocol. The isolated exosome suspension underwent washing and buffer
exchanges
during the isolation procedure and was devoid of any measurable media
constituents when
purified. Exosome suspensions were normalized to cell number from the tissue
culture plate
they were isolated from and diluted to ensure that 100 pL of suspension
contains exosomes
isolated from 1 million cells as per the published and standardized protocols.
Cross-
verification will be performed by measuring RNA and total protein isolated
from the exosome
suspensions to ensure that RNA/protein concentration from the same volume of
exosomes
remained consistent. The presence of exosomes in the isolates was verified by
transmission
electron microscopy (TEM) (Figures 2A, B and C). For each batch of isolates,
immunoblotting is also performed with exosome markers CD63 (Abcam, 1/1000) and
CD9
(Abcam 1/1000) antibodies as positive markers (Figure 20) and also with
tubulin as
negative marker for intracellular proteins (Sigma 1/10,000).
[0145] Human bone marrow derived MSCs (HMSCs): All of the in vitro experiments
to
isolate exosomes and to test the potency of the exosomes are performed using
HMSCs.
The HMSCs that are routinely used are purchased from ATCC. These cells are
primary
human cells from healthy adult donors that have been certified and designated
for research
use. Each batch of cells obtained will be tested for multipotency to
differentiate into
osteogenic, chondrogenic and adipogenic lineages as per previously published
protocols.
The cells are not used beyond passage 4 for any application.
-28-
CA 03106818 2021-01-15
WO 2020/023251
PCT/US2019/042096
[0146] The preliminary results indicated that integrins meditate binding of
exosomes to ECM
proteins. However, targeting of FATE for regenerative medicine requires
improved binding
efficiency to biomaterials. As the exosomal membrane is a subset of the plasma
membrane,
improving the biomaterial-ECM binding characteristics (affinity/rate or both)
of exosomes
was attempted by increasing the expression of integrin a 5 on the exosomal
membrane
(Figure 3). Integrin a 5 and its respective p pairs mediate cellular adhesion
to ECM proteins
FN, COL1 and to the RGD sequence. Furthermore, it was established that
increased
integrin a 5 expression results in a concurrent enhancement in ECM mediated
adhesion.
[0147] COL1 is the most abundant ECM protein and forms the primary constituent
of the
organic bone matrix upon which hydroxyapatite is nucleated. Therefore, several
biomaterials that are used clinically (Collagen sponges and DBM) as well as
experimental
materials (blends of collagen and other polymeric biomaterials used to alter
material
properties) contain COL1 as the primary constituent. The second most abundant
ECM
protein is FN. The RGD domain was in fact originally identified in domain 10
of the FN
protein sequence. Several clinical materials such as DBM and allograft bone
particles
contain this structural matrix protein. Therefore, a significant amount of
biomaterials
developed for regenerative applications also contain integrin-binding domains
from FN.
[0148] Exosome binding to COL1 and FN: The preliminary results indicate that
exosomes
can bind dose dependently and in a saturable manner to COL1 (Figure 4).
Exosomes can
also bind to FN secreted by MSCs and this binding is integrin mediated (Figure
5A).
Blocking integrin binding using the RGD peptide (25mM) abrogated exosome
binding to FN
and to the ECM of MSCs (Figure 5B).
[0149] Engineering FATE displaying increased a 5 integrin (a 5 FATE): As the
exosomal membrane is a subset of the plasma membrane of the parent cell, an
increase in
integrin a 5 expression on the plasma membrane of the parent cell consequently
results in
the increased presence of integrin a 5 on the exosomal membranes. HMSCs are
transduced to constitutively express integrin a 5. Plasmids containing the
integrin a 5 gene
under the control of the EF1 a promoter (suitable for expression in primary
MSCs) are
readily available (Applied biological materials (ABM), Canada). Following
transduction,
puromycin selection is employed to generate a stable cell line that
constitutively expresses
integrin a 5 as per previously published protocols for transduction and cell-
line generation.
Exosomes are isolated from this cell line as per previously described
protocols. Preliminary
results indicate that exosomes isolated from HMSCs constitutively expressing
integrin a 5
show increased presence of the same on the exosomal membranes (Figure 6).
[0150] Evaluation of increased integrin presence in a 5 FATE: Quantitative and
qualitative evaluations will be performed on a5 FATE with respect to control
exosomes.
Preliminary results presented in Figure 6 indicate an increase in the
expression levels of
-29-
CA 03106818 2021-01-15
WO 2020/023251
PCT/US2019/042096
integrin a 5 in the a 5 FATE compared to control exosomes. TEM analyses of
different
batches of purified exosomes immunogold labeled for integrin a5 will be used
to qualitatively
observe the increased integrin presence. Quantitative evaluations are
performed by
NanoSight analysis of immunolabeled exosomes. The NanoSight instrument is
specifically
designed to detect fluorescently labeled nano particles such as quantum dots
and
exosomes. Control and a5 FATE will be fluorescently dual labeled with CD63
(exosome
marker) and integrin a 5 antibodies in different wavelengths. The fluorescence
corresponding to both proteins are quantitated using the nano-sight
instrument. The CD63
antibody fluorescence coupled with size exclusion nanosight analysis is used
to count the
number of exosomes in each pool followed by estimation of integrin a5 presence
in the form
of fluorescence intensity per exosome. A comparison between the control
exosomes and a5
FATE is performed and expressed as percentage gain over control to quantitate
the increase
in the expression levels of integrin a5. In addition to evaluating the
increase in a5 integrin
expression, the increased presence of its corresponding [3 pairs is also
evaluate using the
same methodology described above. In particular, if there is an increase in
the expression
levels of [31, [33 and [35 integrins is also evaluated. These candidates were
chosen based on
published characterizations of integrin pairs binding to COL1 and FN.
[0151] Evaluation of exosome dose-dependent binding to COL1 and FN (constant
time):
Quantitative binding experiments are performed to evaluate binding of control
exosomes and
a5 FATE to COL1 and FN as per the previously published protocols. Briefly, 96
well assay
plates coated with 5 pg of COL1 or FN are incubated with increasing amounts of
fluorescently labeled exosomes for a period of 2 hours (0-20p1, refer to
Figure 3) at room
temperature. Green fluorescence labeling of exosomes is performed using the
Exo-Glow
labeling kit (System Biosciences) as per the previously published protocols.
As stated
previously, normalized suspensions (100 pL of suspension containing exosomes
from 1
million cells) are used. The bound exosomes are quantified using a micro titer
plate reader
(BioTek). The total exosome amount (x-axis) is plotted against normalized
fluorescence
readings and the resulting plot is fit to a rectangular hyperbola (the
standard for a single
binding site saturation). Figure 4 serves as an example. Any improvement in
binding is
observed as saturation at lower amounts of exosome with respect to controls.
As the
number of integrins on the exosomes cannot be presented as a concentration,
calculation of
a dissociation constant (KD) is not possible. However, the change in affinity
can be
quantitated in the form of reduction in required amounts of exosome to achieve
saturation.
[0152] To demonstrate that the improvement in binding is a direct result of a5
presence, a
competitive binding experiment is performed using integrin a5 antibody.
Briefly, a5 FATE is
pre-incubated with integrin a5 antibodies to saturate all a5 integrins. The
quantitative
binding experiments to COL1 and FN are performed in conjunction with untreated
controls to
-30-
CA 03106818 2021-01-15
WO 2020/023251
PCT/US2019/042096
observe the percentage loss in binding. Further, the effect of RGD blocking on
the binding
efficiency will also be quantified. For these experiments, the collagen and FN
amounts are
kept constant at 5pg. a5 FATE are maintained at saturation volume and is pre-
treated with
increasing concentrations of the RGD peptide (SIGMA). The corresponding dose-
dependent
reduction in binding efficiency to COL1 and FN is quantitatively analyzed
using the binding
assay.
[0153] All experiments are performed in quadruplicates. Statistical
significance for all
comparisons between control exosomes and a5 FATE or for significance of the
competitive
binding experiments is evaluated using student's t-test with a 95% confidence
interval.
[0154] Estimation of binding kinetics (variable time): An increase in receptor
presentation on the exosome membrane can increase the rate at which exosomes
can bind
to COL1 and FN. From a translational perspective, this is an important
property to consider,
as it would reduce the time of contact between an exosome suspension and a
biomaterial to
achieve binding saturation. A time course assay is used for this purpose.
Pseudo first order
kinetics was followed by maintaining COL1 and FN concentration at 5 pg/coated
96 well and
control exosomes or a5 FATE are used 5x saturation amount of a5 FATE (a higher
than
saturation concentration is required to satisfy pseudo first order kinetics).
Control exosomes
and a5 FATE are used at the same amounts to compare improvement in kinetics.
The
fluorescently labeled exosome suspensions are incubated with the ECM proteins
at room
temperature in fixed time increments of 5 minutes up to 60 minutes. The amount
of bound
exosomes after each time point is quantitatively measured using a plate reader
and plotted
as fluorescence intensity versus time plot. The slope of the plot
(dFluorecence/dT) is
calculated to estimate the rate of binding. Statistics are performed as
described above.
[0155] Endocytosis of a5 FATE: The ability of a5 FATE to be endocytosed by
HMSCs is
evaluated quantitatively in a dose dependent manner as per published protocols
using
fluorescently labeled exosomes. The preliminary results indicate that MSC
derived
exosomes are endocytosed in a dose-dependent and saturable manner by target
HMSCs
(Figure 7). Therefore, the ability of a5 FATE to be endocytosed by HMSCs is
determined
and compared to that of control exosomes. A loss is efficiency is
characterized as a
statistically significant drop in the amount of endocytosed exosomes
(quantitated as a
measure of fluorescence intensity at each concentration) and/or a
statistically significant
increase in the amount of exosomes required to saturate endocytosis (an
indicator of
slow/impaired endocytosis). The experiments are performed at 37 C with 1-hour
incubations. A standardized exosome dosage of 0 to 20p1 is used. Each
experiment will
contain 6 repeats. The significance between the control group and a5 FATE is
analyzed
using student's t-test (95% confidence).
-31-
CA 03106818 2021-01-15
WO 2020/023251
PCT/US2019/042096
[0156] Endocytosis of a5 FATE bound to ECM proteins: MSC derived exosomes can
be
endocytosed by target MSCs when bound to COL1 membranes, (Figure 8). These
bound
exosomes were also functional in in vivo experiments (refer to Figure 9 and
Figure 10).
The ability of a5 FATE, when bound to COL1 and FN coated plates, to be
endocytosed by
HMSCs is evaluated quantitatively and qualitatively. Fluorescently labeled
exosomes
(control and a5 FATE) is bound at increasing concentrations to COL1 and FN
coated cover
glass bottomed assay plates (5 pg/well). 25,000 HMSCs will then be seeded on
to the
plates and incubated for 24 hours in tissue culture conditions. For
qualitative evaluations,
the plates are imaged by confocal microscopy. For quantitative evaluation, the
cells are
trypsinized, fixed in neutral buffered formalin and subjected to FACS
(fluorescence activated
cell sorting) analysis to identify the percentage of cells that have
endocytosed the labeled
exosomes and also the intensity of the signal to correlate with dose
dependency. Qualitative
evaluations and verification of results in a 3D environment are performed by
binding
fluorescently labeled a5 FATE to COL1 membranes (Zimmer collagen membranes)
followed
by HMSC seeding (250,000 cells/1cm square membrane for 24 hours). The formalin
fixed
scaffolds are subjected to z-stack confocal imaging as per the published
protocols, (Figure
8). All experiments are performed in quadruplicates. Statistical evaluations
are performed
using student's t-test (95% confidence interval).
[0157] It was expected that a5 FATE will be endocytosed with the same
efficiency of control
exosomes irrespective of the increase in rate or stoichiometry of the binding.
This is based
on the fact that MSC exosome endocytosis is not integrin mediated (preliminary
result
provided in Figure 11). Direct FATE mediated SCLD (osteoinduction) was
evaluated. The
workflow provided in Figure 10 gives a broad overview of this evaluation.
[0158] The preliminary results (Figure 9, Figure 12 indicated that exosomes
from
osteogenically differentiated MSCs are better inducers osteogenic SCLD
compared to
exosomes isolated from undifferentiated MSCs. However, it is not possible to
generate
exosomes of consistent functionality for therapeutic applications using this
approach.
Therefore, the osteogenic potential of MSCs is stably enhanced by
constitutively expressing
known osteoinductive morphogen BMP2 and the well-defined osteoinductive t
transcription
factor RUNX2, respectively.
[0159] Exosomes from differentiated MSCs are more potent inducers of
osteogenic
SCLD: Human bone marrow derived MSCs (HMSCs) were subjected to osteogenic
differentiation for 4 weeks in the presence of osteogenic culture (containing
ascorbic acid, p-
glycerophosphate and dexamethasone). Exosomes were isolated from both the
differentiated MSCs and MSCs cultured in regular media (control). Using the
control or
osteogenic exosomes as inducers of SCLD, undifferentiated HMSCs were subjected
to 3D in
vitro differentiation assay for 48 hours followed by qPCR analyses of
osteoinductive gene
-32-
CA 03106818 2021-01-15
WO 2020/023251
PCT/US2019/042096
expression. Compared to control exosomes, treatment of HMSCs with exosomes
from
osteogenic MSCs resulted in a significantly higher expression of a broad panel
of
osteogenesis-associated genes (Figure 9). Notably, the experiment was
performed in the
absence of other differentiation factors to observe the effect of exosomes
alone.
[0160] When exosomes from control and osteogenic MSCs were bound to collagen
scaffolds and implanted in vivo (subcutaneously) with HMSCs, the osteogenic
exosomes
induced a more robust expression of phosphorylated proteins (required for
induction of
matrix mineralization and identified using an antibody directed to
phosphorylated serine,
threonine and tyrosine residues), mineralization inducers such as dentin
matrix protein 1
(DMP1) the pro-vascular protein VEGF and osteoinductive growth factor BMP2
(Figure 12).
Concurrently, histological evaluations revealed increased vascularization
(arrows in Figure
12E2) and a significant increase in calcium phosphate deposition as depicted
by quantitated
alizarin red and von Kossa stains (Figure 12F). These results show the
osteoinductive
potential of exosomes from differentiated MSCs.
[0161] Generation of osteoinductive FATE from BMP2 and RUNX2 expressing HMSCs:
Transduction of BMP2 and RUNX2 genes individually in a5 HMSCs generated as
provided
above was performed. Plasmids encoding the BMP2 and RUNX2 gene suitable for
MSCs
are commercially available (Applied Biological Materials, Canada). Given that
a5 HMSC has
been selected using puromycin for stable expression of a5 integrin, the BMP2
and the
RUNX2 expression vectors will contain a neomycin cassette for selection. The
resultant
BMP2 or RUNX2 gene (qPCR) and protein expression (western blotting, IF, ELISA)
in the
derived cells are evaluated quantitatively with respect to wild type and
vector controls to
confirm constitutive expression. A qPCR analysis of the expression of
osteogenic marker
genes is performed to evaluate the increased osteogenic potential of both the
derived cell
lines as a confirmation of the functionality of the constitutively expressing
proteins. GAPDH
and B2M are used as internal controls. The osteoinductive marker genes are:
Growth
factors: BMP2, BMP6, TGF81, VEGFA, FGF2, GDF1. Transcription factors: RUNX2,
Osterix (OSX). ECM proteins: Osteocalcin, Alkaline phosphatase, COL1,
osteopontin and
DMP1. This list of genes is based on the published experience in bone and
mineralized
tissue biology. Figure 9 is an example of a typical data set. Exosomes from
the of a5-
BMP2 and a5-RUNX2 HMSCs cell lines are isolated as BMP2-FATE and R2-FATE.
[0162] miRNAs play a pivotal role in exosomal function. Therefore, specific
manipulation of
exosomal miRNAs may be used to control exosome functionality. Two miRNAs
(Let7a and
miR218) that are present in increased amounts in exosomes from differentiated
MSCs
(Figure 13) were identified. The Let-7 family of miRNAs has been shown to
enhance
osteogenic differentiation of MSCs. On the other hand, miR-218 enhances
osteogenic
-33-
CA 03106818 2021-01-15
WO 2020/023251
PCT/US2019/042096
differentiation of MSCs by positively regulating the Wnt/p-catenin signaling
cascade.
Therefore, they are good targets for manipulation.
[0163] Recent studies on miRNA sorting into exosomes have identified a target
sequence in
the 3' end of miRNAs (GGAG; SEQ ID NO:8) that directs exosomal sorting.
Plasmids and
expression systems that readily express this target sequence at the 3' end of
miRNA
sequences are commercially available (System Biosciences, XMIR expression
system) and
have been verified experimentally. Using this system, Let7a and miR218 into
MSC
exosomes are selectively packaged to generate osteoinductive FATE.
[0164] Generation of osteoinductive FATE by exosomal expression of Let7a and
miR218:
a5 HMSCs is transduced with plasmids incorporating the Let7a and miR218
sequences
individually along with the exosomal targeting sequence and selected for
stable expression
as described previously. Exosomes are isolated from these cell lines as
described and
labeled as 7a-FATE and 218-FATE respectively. miRNA is isolated from these
exosomes
and qPCR are used to evaluate the expression levels of Let7a and miR218 in the
respective
exosomes with respect to control exosomes and vector-control exosomes (Figure
13 data is
an example). Statistically significant (t-test, P<0.05) increase in the
expression of Let7a and
miR218 in 7a-FATE and 218-FATE respectively with respect to the controls will
denote
success in the generation of FATE.
[0165] In vitro evaluation of osteoinductive potential: This evaluation is
performed on
FATE isolated using both approaches. A 3D in vitro cell culture system (COL1
scaffolds) is
used to evaluate the osteoinductive potential of FATE. This 3D model provides
a biomimetic
environment for the MSCs providing an ideal environment to evaluate the
osteoinductive
potential of exosomes. For this experiment, the standardized exosome to cell
ratio of
exosomes from 500,000 cells per 100,000 HMSCs is used. This number was derived
from
exosome endocytosis saturation experiments. 500,000 HMSCs is seeded on to
either control
or exosome bound COL1 scaffolds (1cmx1cm Zimmer collagen tape). Exosome
suspension
is adsorbed on to the collagen tape and incubated at room temperature for 10
minutes prior
to cell seeding. The cells are cultured within the scaffolds for 2, 4 and 7
days. The
experiments are conducted in quadruplicates and HMSCs treated similarly in the
absence of
exosomes will serve as comparative standard for gene expression data. Exosomes
from
undifferentiated HMSCs will serve as control for exosome basal activity.
Osteogenic
exosomes from differentiated HMSCs that have osteoinductive properties are
used as
positive control. Four different osteoinductive FATE form the experimental
groups.
[0166] RNA is isolated from the control and experimental groups at different
time points.
The expression levels of genes required for and indicative of induction of
osteogenic
differentiation (list of genes provided above, Figure 9) are evaluated by qRT
PCR with
respect to controls as per standard protocols. Statistical significance is
assessed using
-34-
CA 03106818 2021-01-15
WO 2020/023251
PCT/US2019/042096
student's t-test with respect to the control (non-exosome containing) group
with 95%
confidence interval. ANOVA is used to analyze the significance when multiple
groups are
compared as well as for comparing the different osteoinductive FATE.
[0167] Evaluation of ECM binding and endocytic potential: The methods to
generate
FATE should not affect their ECM binding or endocytic potential of the
exosomes. However,
their ability to bind to COL1 and FN as well as their ability to be
endocytosed by HMSCs is
verified by performing the quantitative binding and endocytic assays as
described above.
[0168] FATE - directed tissue regeneration (bone repair) in vivo was
evaluated. The acid
test for any osteoinductive strategy is the ability to induce repair of
critical size bone defects.
Bone regeneration using osteoinductive exosomes delivered in clinically
relevant
biomaterials is an ideal model to test the translational relevance of FATE in
regenerative
medicine. Therefore, the two types of FATE using the well-developed and
standardized rat
calvaries defect model are evaluated. In order to maintain clinical relevance,
a clinical grade
collagen membrane (Zimmer collagen tape) is used as the carrier for FATE and
control
exosomes.
[0169] Loss of function-ECM binding: The rationale behind including this group
is to
show the importance of FATE targeting in bone repair and tissue regeneration.
Disruption of
ECM binding is achieved by pretreating FATE with 2mM RGD peptide (Figure 5
provides
relevant data for choice of concentration). FATE is expected to show
no/impaired binding to
the collagen membranes resulting in impaired/reduced osteoinduction due to
lack of
localization to the defect site. The RGD-treated FATE is bound to the collagen
membranes
and treated the same way the other groups.
[0170] Loss of function-Endocytosis: Endocytosis of exosomes is a critical
process that
delivers the osteoinductive molecules enclosed within the exosomal membrane
into target
cells. To highlight the functional importance of FATE in bone repair, exosome
endocytosis is
blocked by using sulfated heparin (Sigma). To achieve this, the MSCs are
pretreated with
10pg/m1 heparin (Figure 14). Additionally, collagen membranes that are used to
bind FATE
are pre-treated with 50pg of heparin. Heparin binding to COL1 is well
characterized.
Therefore it is possible to load the collagen membranes with heparin. The
preliminary
results (Figure 14) indicate that MSC exosomes are endocytosed via cell-
surface Heparin
Sulfate Proteoglycan Receptors (HSPGs). Sulfated heparin can bind to these
HSPGs and
block MSC exosome endocytosis. The results presented in Figure 14 indicate
that there is
a dose-dependent reduction in the endocytosis of fluorescently labeled MSC
exosomes in
the presence of heparin. 5 x saturation concentrations are used for the animal
experiments
to ensure that all cells within the defect boundary receive heparin treatment.
[0171] Rat calvarial defect model: All surgeries are performed as per approved
animal
care protocols. A critical size calvarial bone defect 8mm in diameter would be
made using a
-35-
CA 03106818 2021-01-15
WO 2020/023251
PCT/US2019/042096
trephine bur without dura perforation as per established standards. For the
groups
containing exosomes or FATE along with the collagen membrane, the exosome/FATE
suspension (100p1, equivalent of exosomes from 1 million cells) is added to
the biomaterial
just before surgery and incubated for 10 minutes at room temperature to
facilitate binding.
Two different FATE (FATE1, FATE2, one from each approach in aim 2) are used.
Naïve
MSC exosomes are used as a control group and osteogenic exosomes are used as a
positive control. Figure 15 shows all the control and experimental groups. The
animals are
sacrificed 2, 4, 8 and 12 weeks post-surgery. The time points have been chosen
from as
early as 2 weeks to observe the rate of formation of mineralized matrix
between the groups.
There are 6 experimental repeats (n=6) per group per time point (based on
power analysis:
80% power, 95% confidence). Three of them are male and three are female rats
to ensure
absence of gender bias in the results. For all in vivo experiments, wild type
rats are used.
After euthanasia, the calvarial bones are fixed in neutral formalin and
processed for:
[0172] Quantitative pCT: For these experiments, extracted bone blocks are
fixed in formalin
and scanned using a pCT-40 scanner (Scanco Medical, Wayne, PA, USA). Scan
parameters are 90 KVp (voltage), 5mA (tube current) and an integration time of
1min.
Reconstruction of the 2D slices into 3D images is performed using the
manufacturer's
software. pCT is used to analyze the following:
[0173] 1. Volume of bone regenerated: The volume of regenerated bone at the
various
time points are quantified with respect to the total void volume. Statistical
significance
(P<0.05) is calculated using ANOVA for multiple group comparisons and pair
wise
comparisons are using Tukey's method. This type of evaluation will provide
quantitative data
on the rate of bone repair (slope of volume vs time plot) amongst the groups.
[0174] 2. Quality of regenerated bone: Quality of regenerated bone (bone
density) is
obtained by quantitating the average radio opacity of the regenerated area
with respect to
that of the surrounding natural bone. Statistical analyses amongst groups are
performed as
described above. The radiopoacity is an indirect measure of bone density. Data
from
various groups and time points will provide a quantitative analysis of the
rate of bone
hardening (slope of radio opacity vs time plot) as well as the quality of the
FATE regenerated
bone in comparison to the control groups and natural bone.
[0175] Nano indentation: Nano indentation experiments are performed to analyze
the actual
hardness of the FATE regenerated bone with respect to that of native bone and
the control
groups. In addition, the evaluation of bone hardness from the various time
points will also
provide quantitative information on the rate of bone hardening amongst the
groups (slope of
hardness vs time plot). Nano indentation measurements are performed as per the
previously published protocols. All measurements are performed at room
temperature using
a calibrated TI-700 Ubi nanoindentation system (Hysitron, Inc.). A 100pm cono-
spherical tip
-36-
CA 03106818 2021-01-15
WO 2020/023251
PCT/US2019/042096
is used for a trapezoidal load pattern. 12 indents are made per sample
randomly spanning
the defect area and 12 across normal bone. The modulus is calculated using the
Oliver
Pharr method and the hardness is calculated using the formula: H=Pmax/Ar,
where
Pmax=maximum load and Ar=residual indentation area. The data is represented as
hardness in GPa and is compared to hardness of surrounding normal bone at all
time points.
Statistical significance between the groups (P<0.05) is calculated using ANOVA
and pair
wise comparisons is evaluated using Tukey's method.
[0176] c) Histology: The samples are decalcified prior to histology. The
samples are
embedded in paraffin and sectioned along the x-z plane into 5pm thick sections
to view the
injury closure across the thickness of the bone, as per the previously
published protocol.
Two sections from the top, middle and end (along y direction) of each block is
analyzed
using:
[0177] H&E stain: This is used to qualitatively analyze tissue architecture,
osteoblast/mesenchymal cell infiltration and presence of blood vessels. Semi
quantitative
analyses on MSC infiltration and percentage vascularization is performed as
per the
previously published methods.
[0178] IHC for osteogenic marker proteins: Fluorescence IHC is performed to
analyze
qualitatively, the expression patterns and levels of marker proteins
osteocalcin (OCN), Bone
sialoprotein (BSP) and dentin matrix protein 1 (DMP1) between groups. The
sections are
probed to analyze the expression pattern of BMP2, TGFp and VEGF among the
groups and
compare it to native bone.
[0179] Overall, the disclosed studies enable the generation, characterization
and evaluation
of FATE as nano-scale mediators of SCLD for bone regeneration.
Example 2: Immune-modulating osteoinductive exosomes.
[0180] The mesenchymal stem cell's (MSC's) osteoinductive and immunomodulatory
signaling is well known and involves macrophages (MO). The studies indicate
MSCs and
their exosomes function by negatively regulating M1 polarization that reduces
the M1/M2
MO ratio in healing bone tissues and M2 MO exosomes stimulate osteogenesis and
bone
regeneration. Taken together, these results indicate the presence of an
immunomodulatory
loop involving MSCs and MO polarization to promote repair and regeneration
(Figure 16).
[0181] Exosomes (nanosized vesicles enriched in miRNAs) are significant
components of
secretome signaling among cells. MSC exosomes are implicated in the control of
bone
repair via MO. Although several lines of evidence exist for the
immunomodulatory properties
of MSCs, there is a significant gap in knowledge regarding the
immunomodulatory roles of
both MSCs and MO exosomes. Studying these mechanisms provides valuable
information
that can be used to engineer immunomodulatory and regenerative exosomes for
therapeutic
-37-
CA 03106818 2021-01-15
WO 2020/023251
PCT/US2019/042096
use. It is hypothesized that MSC exosomes regulate MO polarization resulting
in MO
exosomes that contribute to the control of bone repair by reducing the M1/M2
MO ratio in
healing tissues to foster M2 MO osteoinductive signaling (Figure 16).
[0182] MSCs influence MO polarization in health and disease. It is
hypothesized that
inflammation-informed MSC exosomes and their miRNA cargo direct the signaling
of MO
polarization (e.g., M1/M2 ratio) during bone regeneration. The effect of naïve
and
inflammation-informed MSC exosomes and miRNA cargo on MO polarization is
determined
by immunocytochemistry in vitro, How MSC exosomes and specific miRNAs affect
MO
polarization signaling pathways (e.g., M1 = NFxB, Notch, SOCS3; M2 = AKT,
Stat6, LXRa)
are characterized in cell culture studies. The impact of naïve and
inflammation-informed
MSC exosomes on the temporal changes in M1 and M2 MO populations within
healing
calvaria defects is defined in vivo. The identified MSC exosome miRNAs are
demonstrated
to contribute to the MSC's immunomodulatory properties (e.g. M1/M2 ratio) to
enhance
bone repair.
[0183] Further, MO exosome cargo varies with polarization to directly
influence healing.
The preliminary work has identified polarity-specific miRNAs associated with
osteoinduction
in MO exosomes (Figure 17 and Figure 18). It is hypothesized that polarity-
specific miRNA
in primary MO exosomes influence MSC osteoblastic differentiation and bone
regeneration.
Based on the promotion of M2 MO (M1/M2 ratio) in healing calvaria, it is a)
affirmed by
miRNAseq followed by qPCR that polarized M2 MO exosomes contain osteoinductive
miRNAs, b) defined M2 MO exosomal miRNAs' osteoinductive mechanism(s) by i) in
silico
miRNA target analysis, ii) defining effects of overexpression and knock down
of selected
miRNAs on targeted gene / protein expression and osteoblast differentiation;
and c) studied
in the mouse calvaria model the impact of M2 MO related exosomes and miRNAs on
bone
regeneration. Existing anti-inflammatory approaches impact M1 polarization and
here M2
exosome mechanisms that directly promote osteoinduction in bone repair are
examined.
These mechanistic studies explore the roles of MSC and MO exosomes in an
immunomodulatory loop that influences regeneration. Additionally, the
potential to
manipulate this exosome signaling mechanism to enhance immunomodulation and
bone
repair is demonstrated.
[0184] MO-induced osteogenesis has been interrogated in cell culture; a MO
polarity-
dependent expression of MO osteoinductive cytokines was previously identified.
Other
macrophage-derived mediators of osteoinduction have also been identified,
including OSM,
SDF-1, PGE-2 and TGF-I3. The role of MO in osteoblast physiology has been
informed by
cell culture studies demonstrating that: a) MO-derived cytokines promote
osteoblastic
differentiation, b) osteoblast/ MO and MSC/ MO co-culture promote
osteoinduction and c)
depletion of MO from bone marrow reduces CFU-OB formation. Cell culture
studies also
-38-
CA 03106818 2021-01-15
WO 2020/023251
PCT/US2019/042096
demonstrated d) that biomaterial/ MO interactions influence the MO
osteoinductive function.
e) In vivo, different approaches to MO depletion (e.g., systemic monocyte or
MO depletion,
clodronate, MaFIA mice) result in reduced fracture healing and bone repair.
These studies
implicate the MO, but have not revealed the mechanisms acting in the required
communication between MSC and MO (and potentially other cell types).
[0185] The regenerative function of MO involves the regulated polarization
from naïve (MO)
to pro-inflammatory (M1) and anti-inflammatory (injury healing) (M2)
phenotypes
representing extremes of a multidimensional /spatial continuum of function.
The relative
roles of M1 versus M2 MO in osteogenesis remain partially obscure. Several
investigations
indicate that M2 MO enhance osteogenesis. MO contributions to osteogenesis
likely involve
the serial function of the spectrum of MO phenotypes. The bone healing process
may
involve a transition from M1 contributions followed by M2 contributions. The
preliminary data
demonstrates that the relative abundance of M1/M2 MO is altered by MSC
exosomes
resulting in marked reductions in M1 MO and reduced M1/M2 ratio (Figure 19).
[0186] However, significant gaps in knowledge remain concerning the
mechanism(s) by
which MO contribute to bone regeneration. The cellular interactions (e.g. MO /
MSC) in local
environments involve both direct cell- cell and soluble factor signaling. In
addition to growth
factors, cytokines and chemokines, cells secrete exosomes (30 -150 nm
extracellular
vesicles containing protein and miRNA cargo) that transfer this cargo as
regulatory signals
from parental to target cells. MSC exosome contributions to healing may be
direct (targeting
osteoprogenitors) and/or indirect (targeting immune cells). MO exosomes are
implicated in
healing, osteogenesis and MSC osteoinduction. While it is known that MSC's
immunomodulatory function involves exosomes, it was not fully know how MSCs
direct MO
polarization or how MO specifically target osteogenesis. It is herein
hypothesized that MSC
exosomes are regulators of the polarized population that contributes specific
exosomes to
control osteoinduction.
[0187] The preliminary data indicates that 1) MSC exosomes influence the
relative
abundance of MO (M1/M2 ratio, Figure 19), 2) inflammation-informed MSC
exosomes
contain miRNAs that control MO polarization (Figure 20 and Figure 21), 3) M1
and M2 MO
exosomes differ in promoting bone regeneration (Figure 22 and Figure 23), and
4) MO
exosome miRNA cargos differ with M2 exosomes carrying osteoinductive miRNAs
(Figure
24, Figure 20).
[0188] These data form a fundamental premise for the investigation of MO
exosome-
mediated mechanisms acting in MSC mediated osteoimmunology. The MSC exosome
miRNA-targeted mechanisms affecting MO polarization are explored. It was
confirmed that
exosomes are specific and powerful agents for influencing--among many
biological and
pathological processes--osteogenesis.
-39-
CA 03106818 2021-01-15
WO 2020/023251
PCT/US2019/042096
[0189] The preliminary miRNA Seq data indicate that there are but a few miRNA
unique to
polarized MO and it is possible to mechanistically characterize those
functioning in
osteoinduction. This approach has not been described nor exploited. Then,
miRNAs and
their targets are identified, and deployed for regulation of bone
regeneration. Regarding
clinical translation, exosomes (and miRNA cargo) can be readily produced from
cultured
cells, engineered to carry select miRNAs (and complementary drugs), are immune
privileged
and may be delivered in many carriers or directly to tissues.
[0190] General Methods
[0191] Cell culture: Primary mouse bone marrow MSC is isolated from 6- 8 week
old mice
as previously described. Femurs and tibias are dissected from surrounding
tissues. The
epiphyseal growth plates are removed from dissected femurs and tibias and the
marrow are
flushed with a-MEM containing 100 U/mL of penicillin/streptomycin, and 10 %
fetal calf
serum (FCS) with a 25G needle. Single cell suspensions are prepared by passing
the cell
clumps through an 18G needle followed by filtration through a 70-mm cell
strainer. Cells are
plated at a density of 2.5x10⁶cells/cm2 in 75 mL culture flasks. After 4 days,
one-half of the
medium containing non-adherent cells is replaced with fresh medium. The
phenotype of
cultured MSC is characterized functionally by multi lineage differentiation
using published
culture conditions and is further defined by flow cytometry (CD44+, CD90+,
CD45-) at the
UIC RRC.
[0192] Primary mouse bone marrow MO is isolated from the femurs and tibias of
6-8 week
old mice. After cutting the proximal and distal epiphyseal plates, the marrow
is flushed with
mL warm M199 media +10% FCS using a 28 gauge needle. After filtering cells
through a
70 mm cell strainer, cells is carefully pipetted to a single cell suspension
and then collected
by centrifugation at 250 x g for 10 minutes at room temperature. Cells are
resuspended,
counted, and plated on low adherence plastic (Costar) at 2 x 10⁶cells/mL in 6
well plates
and supplemented with 20 ng/mL M-CSF. The plated cells are washed 2x in PBS
every 2-3
days with replacement of M-CSF containing medium. At 6 days, the adherent MO
is collect
using pre-warmed trypsin and their phenotype validated by staining and flow
cytometry
(F4/80+, CD 68+).
[0193] Isolation and characterization of exosomes: Exosomes are isolated and
characterized by the published protocols and following standards developed for
exosomal
characterization. Exosomes are isolated from the culture medium of mouse bone
marrow
MSCs (MSC) and bone marrow derived MO. One day prior to exosome isolation, the
cell
cultures are washed in PBS and cultured for 48 hours in serum free media. The
exosomes
from the culture medium are isolated using the ExoQuick-TC (System
Biosciences) exosome
isolation reagent as per the manufacturer's protocol. The isolated exosome
suspension
undergoes washing and buffer exchanges during the isolation procedure and is
devoid of
-40-
CA 03106818 2021-01-15
WO 2020/023251
PCT/US2019/042096
any measurable media constituents when purified. Exosomes are used in stock
concentrations of 9 x10⁶ particles / mL and diluted based on saturation
studies as previously
reported. Cross-verification is performed by measuring RNA and total protein
isolated from
the exosome suspensions to ensure that RNA/protein concentration from the same
volume
of exosomes remained consistent. Then, the size heterogeneity of exosomes is
determined
using NanoSight (Figure 25) and identify CD63 and CD9 protein by
immunoblotting (Figure
25). The presence of exosomes in the isolates is verified by transmission
electron
microscopy (TEM) (Figure 25). For all exosome batches, immunoblotting is
performed with
exosome markers CD63 (Abcam, 1/1000) and CD9 (Abcam, 1/1000) antibodies
(Figure 26).
Anti-tubulin antibody (Sigma, 1/10,000) is used in future as negative marker
for intracellular
proteins.
[0194] Fluorescent labeling of exosomes: Exosomes are stained using the Exo-
Glow-
Green labeling kit (System Biosciences) as per the previously published
protocol. As a
control, PBS not containing exosomes are subjected to labeling to control
against non-
specific staining. Exosomes are observed and quantified by immunofluorescence
(Figure
26).
[0195] Phenotype assessments by Real Time PCR: Osteoblastic differentiation
and MO
polarization are monitored in various experiments at the level of mRNA
expression using RT
PCR. SYBRgreen-based assays are performed as previously reported using panels
of OB-
and MO- specific primers and control primer pairs. Briefly, total RNA is
isolated using the
Qiagen RNA isolation kit, first strand cDNA synthesis is completed and gene
specific primers
is used to direct PCR amplification and SYBRgreen probe incorporation using a
BioRad
CFX96 thermocycler. Fold change is calculated using ¨CT method. For most
studies, n=4
is used for comparison using student's t-test. All cell culture based studies
is conducted in 6,
12 or 24 well dishes with 4 replicates/group or time point. Experiments are
repeated at least
twice. Statistical analyses are performed as described below.
[0196] All animal breeding, care and treatment are conducted according to the
UIC ACC
approved protocols specific to this project and monitored by veterinarian
staff of the UIC
Biological Resource Laboratory. Surgeries are conducted under sterile
conditions using
intraperitoneal ketamine anesthesia (16mg/ml, 80mg/kg). Calvaria hair is
removed and a
full-thickness cutaneous incision and flap made to reveal the parietal and
occipital bones.
Mid-skull transcortical defects are created using a 3.5 mm trephine in a
dental drill. Defects
are filled with 3.5 mm diameter collagen scaffolds containing PBS, or exosomes
from MSCs
or MO, M1 or M2 MO (described above). Additionally, scaffolds are treated with
recombinant
human Bone Morphogenetic Protein 2 (rhBMP2, 50 ng/scaffold) as positive
controls. As
NSAIDs may influence MO function, buprenorphine is given subcutaneously (0.1
mg/kg body
weight, BID) for pain relief according to the UIC BRL guidelines. Following 1 -
21 day healing
-41-
CA 03106818 2021-01-15
WO 2020/023251
PCT/US2019/042096
periods, mice is euthanized, calvaria dissected of soft tissues, fixed in 4%
paraformaldehye
at 4 C for pCT followed by histological processing. Routine husbandry
procedures including
cage cleaning, feeding and watering are conducted every other day.
[0197] Statistical analyses: For the proposed experiments, data obtained is
presented as
mean +/- SD. All comparisons between multiple groups are performed using
ANOVA.
Pairwise comparisons among groups are performed using Tukey's method.
Individual
pairwise comparisons are performed using student's t-test; the confidence
interval is set at
95% (P<0.05). All quantitative studies using pCT data are performed using
Matlab software
and the results compared for significance using ANOVA. Quantification of
histological data is
performed by evaluating at least 5 regions/section and a total of 5 sections
spanning the
thickness of the embedded tissue resulting in a total of 25 images/sample.
Statistical
significance is calculated as stated above.
[0198] Power analysis: The number of animals used per group was based on the
preliminary data and was determined by power analysis assuming 80% power, 0.5%
significance, low standard deviation (< 10%) and greater than 20% differences
between
experimental groups (e.g., pCT bone volume, number of cells). To define a 20%
reduction in
bone volume at p < 0.05 and assuming 10% SD in measured volumes, a minimum of
6
animals is needed. The preliminary studies indicate error of 5¨ 10%, and 10 ¨
20 %
differences among the groups. Eight animals per group (4 male/4 female to
account for sex
as a biological variable) provide sufficient power and permit loss of one
animal per group.
[0199] Mouse bone marrow derived MSCs and MSC exosomes (to be isolated,
characterized and quantified as described above in general methods) are
applied to MO
cultured in media, or media supplemented with 10 ng/ml LPS + 1x10³U/m1 IFNyor
10 ng/ml
IL-4 to direct M1 or M2 polarization, respectively (Figure 27). MSC exosomes
(or PBS
control) are added to MO plated in 12 well dishes (50,000 cells/well in 1 ml
media) 4 hours
prior to polarization using 3 x 10⁸exosomes/1 mL media. After 3 days, cultured
MO is
washed with PBS, harvested by trypsinization, and placed in TriZol or fixed in
4%
paraformaldehyde for RNA isolation and flow cytometry. MO polarization is
determined using
qPCR and flow cytometry to identify polarization specific markers (Figure 28).
All
experiments are conducted using 5 wells/ experimental time point or exosome
type.
[0200] To assess the impact of inflammation on MSC exosome signaling to MO,
parallel
studies are conducted using exosomes of MSCs treated with 10 ng/ml TNFa for 18
hours
(MSCTNFa) to mimic the early inflammatory phase of bone injury. The
preliminary studies
indicate that MO inflammatory cytokine expression is differentially altered by
MSCcont versus
MSCTNFa exosome treatment (Figure 19). TNFa treatment of mouse MSCs alters
their
exosome cargo with increases in miRNA that have previously been shown to
reduce MO M1
-42-
CA 03106818 2021-01-15
WO 2020/023251
PCT/US2019/042096
polarization (Figure 21). This new data is complimentary to knowledge that MSC
TNFa pre-
conditioning enhances MSC exosome production and their osteoinductive
function.
[0201] In an initial effort to define the impact of inflammation-informed
exosome miRNAs on
MO polarization, MO is treated with either MSCcont or MSCTNFaexosomes and
Antagomirs to
each of the five miRNAs of increased abundance in the MSCTNFaexosomes (Figure
21).
Antagomirs (and scrambled controls; Qiagen) are added to MO in 24 well plates
(1 mL
media, n=5) at a concentration of 100 nM and incubated for 24 ¨ 72 hours.
[0202] Subsequently, levels of target miRNAs are quantified by miR qRT-PCR and
reported
relative to snRNA-U6. In parallel, mRNAs for MO and M1 polarization are
quantified by qRT-
PCR as described in general methods. It is expected that antagomir treatment
ameliorate
the effect of MSCTNFa exosomes on MO polarization.
[0203] MSC miRNAs may play a key role in directing this shift to a
regenerative MO
population. It was observed by immunohistochemistry that MSC exosome treatment
in vivo
reduces the ratio of M1/M2 MO in healing calvaria (Figure 22 and Figure 23).
The M1/M2
ratio was reduced from 0.84 to 0.29 (p < 0.02). This reduction is consistent
with M1 versus
M2 effects on bone repair (Figure 29).
[0204] MO are stimulated with LPS/IFNyor with IL-4 (or PBS control) to direct
M1 or M2
polarization 4 hours following the addition of MSC exosomes (or PBS control).
To study
inflammation effects on MSC exosomes, both MSCcont and MSCTNFa exosome
treatment of
MO are performed (+PBS control tx). Inhibitors (and/or siRNA knockdown) of
defined
polarization pathways are included to demonstrate exosome mechanisms for both
M1 or M2
pathway-specific polarization (Figure 24). Scrambled siRNAs, empty vectors and
inhibitor
vehicle controls are used in all studies.
[0205] MSC exosomal miRNA effects on M1 polarization: M1 polarization involves
signaling
via NFxB, 50053, and IRF-5. Primary MO are treated +/- LPS/IFNy with or
without
exposure to MSCcont or MSCTNFa exosomes. The NFxB, 50053, and IFR-5 pathways
are interrogated by treatment with pathway-specific inhibitors to determine
the influence of
MSC exosome miRNAs on M1 signaling. Of note, 50053 has been identified as both
an
activator and inhibitor of M1 polarization, while NFxB and IFR-5 are known
inhibitory
pathways. MSCTNFa exosomes possess increased levels of miRNAs that inhibit
these
pathways (Figure 20). Signaling is measured using well-defined specific
assays. The impact
of treatment on polarization is examined by qPCR measurement of polarization-
specific
gene expression (target genes).
[0206] An immunohistochemistry approach for characterization of the MO M1/M2
populations was adopted in healing tissues of the mouse calvaria defect model
(Figures 22,
23 and 30).
-43-
CA 03106818 2021-01-15
WO 2020/023251
PCT/US2019/042096
[0207] To compare the influence of MSCcont versus MSCTNFaexosomes on the
polarized MO
populations in calvaria over the early time course of bone regeneration,
single 3.5 mm
diameter calvaria defects are created by trephine drilling in 8 mice (4 male/4
female). 3.5
mm diameter collagen scaffolds are hydrated in media and loaded by incubation
for 1 hour
at 37 0C in 50 IL of media containing 8.0 x 10⁸ MSC exosomes or saline (based
on
saturation studies; in press). Following 1, 3, 7, 14 and 21 days, the calvaria
is harvested and
fixed in 4% paraformaldehyde for 24 hours. Following paraffin embedding,
sectioning and
processing for immunohistochemistry, 5-10 rm thick sections are stained for MO
specific
antigens (MO - F4/80 / CD 68; M1 - CD80/ iNOS; M2 - CD206 / Arg-1) and
counterstained
with hematoxylin. Osteoprogenitors are stained with anti-RUNX2 anti-Osterix -,
and anti-
BSP - specific antibodies. Requisite secondary antibody control staining is
performed.
Within the defects, for each antigen, three sections from each of 8 mouse
calvaria /
experimental group is imaged at 20x and immunostained cells is counted / area.
The
average number of MO, M1 and M2 specific immuno-stained cells/area is
calculated and
compared statistically by Student's t-test (as shown in Figure 22 and Figure
23). The
potential different temporal associations of M1 or M2 MO numbers with
osteoprogenitor
abundance is examined by regression analysis (time vs. osteoprogenitor #).
[0208] To implicate miRNA function in the MO polarization-dependent exosome
effects on
osteogenesis, MSC exosomes from DICER KO mice is included because DICER is
required
for miRNA biogenesis and function. DICER ablation in MSC by Runx2/Cre impaired
bone
formation, indicating the activity of Dicer dependent miRNAs in osteogenesis.
Osx-
cre/Dicer(f1f1) mice are used in these studies. The effect of VVT and DICER
mice MSC
exosomes on M1 and M2 polarization (LPS+IFN-yand IL-4 treatment respectively)
is
evaluated by qRT- PCR, flow cytometry of CD80 and CD206 and immunocytochemical
detection of iNOS and Arg-1. MSC exosomes are further characterized by size
(100-200 nm)
and quantified using NanoSight.
[0209] Six groups of mice are treated with collagen scaffold grafting; 1)
collagen only, 2)
collagen + rhBMP2 (positive control), 3) collagen + WT MSCcont exosomes, 4)
collagen +
MSCTNFa exosomes, 5) collagen + Dicer MSCcont exosomes, and 6) collagen +
Dicer MSCTNF
exosomes. Eight C57/BL J6 mice (male (4) and female (4)) are treated per time
point per
group. This experiment is intended to define the impact of MSC exosomes -- and
inflammatory signaling of MSCs influencing exosomes -- on the polarized MO
population and
will correlate the M1/M2 phenotype with the relative abundance of
osteoprogenitors in
healing bone. 240 mice (5 time points x 6 treatment conditions x n=8) are
required (statistical
plan provided in the general methods section).
-44-
CA 03106818 2021-01-15
WO 2020/023251
PCT/US2019/042096
[0210] Complementing the experiments described above, additional studies are
conducted
for 4 and 8 weeks to assess the impact of MSC exosomes on calvaria bone
regeneration: 1)
MSCcont exosome or saline treated collagen is applied in defects of WT mice to
demonstrate
that MSC exosome enhance bone regeneration. 2) Additional studies in VVT mice
are
conducted using MSCTNFaexosomes to evaluate the possible inflammation-induced
change
in MSC exosomes affecting bone regeneration.3) VVT mice are treated with Dicer
KO mouse
MSCcont and 4) with MSCTNFaexosomes to demonstrate the role of exosomal miRNA.
5) To
mechanistically explore the role of inflammation, 3 of the miRNAs identified
within
MSCTNFa are applied using engineered exosomes. The 3 candidate miRNAs
demonstrate
marked M1 polarization or enhanced M2 polarization of MO in vitro. 128 mice
are needed to
account for 2 time points, 8 exosome treatment groups, and n=8 mice (4 male +
4 female) /
group.
[0211] MO and MO exosome cargo varies with polarization to directly influence
healing.
Polarization is associated with unique miRNA cargo and M2-specific miRNA are
implicated
in osteogenesis (Figure 17 and Figure 18).
[0212] Treatment of mouse MSCs with MO exosomes alters osteoinductive gene
expression
in a MO polarity-specific manner (Figure 29). As shown, MSC treatment with M1
exosomes
reduced BMP2 and BMP9 expression and inhibited BMP2 induced transcription at
the BMP2
responsive promoter (SBE12, Figure 29 right). In contrast, M2 exosomes
significantly
potentiated BMP2-mediated signaling at the SBE12 promoter, despite no
significant increase
in BMP2 mRNA levels (Figure 29 left).
[0213] Further, when MO exosomes in collagen scaffolds were engrafted in
calvaria defects,
the M2 MO exosomes increased bone regeneration while M1 MO impaired early
regeneration (Figure 30). These new data provide a basis for continued
investigation of how
MO exosome miRNAs influence osteoinduction. While it is acknowledged that MO
exosomes may influence other resident cell types ("off target'), the
congruence of in vitro
osteoprogenitor responses and the in vivo result implicate these 'on target"
(BMP signaling
responses to MO exosome effects.
[0214] Recent analysis of miRNA among resting and LPS-treated MO confirm that
only a
limited number of miRNAs differ among treated and untreated cells. This is
consistent with
the preliminary data (Figure 25 and Figure 28). Others have shown that highly
expressed
miRNAs are limited in number and comprise a high percentage of total miRNA
reads.
[0215] Mouse primary bone marrow MO is isolated and polarized to M1 and M2
phenotypes
as described above. Their polarization is characterized at the level of gene
expression
(PCR) and surface marker phenotypes (flow cytometry) prior to their use. M1
and M2
polarizing MO are cultured in 70 mL low adhesion flasks and media are
collected for
isolation of exosomes as described in general methods above. For these
experiments, MO
-45-
CA 03106818 2021-01-15
WO 2020/023251
PCT/US2019/042096
isolated from three different donor mice (6 week old, 3 male/3 female) and the
independent
isolation of exosomes are achieved for subsequent miRNA-seq.
[0216] miRNA-seq QC and quantification: Adapters from raw reads are trimmed
using
trimmomatic to eliminate RNA sequences too long to be miRNA from the library.
Trimmed
reads are aligned directly to miRNA sequences obtained from MIRBASE using BWA
ALN
optimized for short read alignment. miRNA expression levels are quantified by
counting the
number of reads mapped to each miRNA sequence, and normalized to counts-per-
million
units for direct comparison between samples.
[0217] Differential expression: Differential expression statistics (fold-
change and p-value)
are computed using edgeR, on raw expression counts obtained from
quantification.
Importantly, edgeR allows multi-group analyses to prioritize which genes show
the biggest
effects overall, as well as pair-wise tests between sample conditions to
specifically
determine the context of the changes. In all cases, p-values are adjusted for
multiple testing
using the false discovery rate (FDR) correction of Benjamini and Hochberg.
Significant
genes will demonstrate an FDR threshold of 5% (0.05) in the multi-group
comparison.
[0218] Clustering and visualization: Unsupervised clustering is used to
determine
predominant gene expression patterns that drive phenotype in an unbiased
manner. Only
miRNAs that show a statistically significant effect are first selected from
the multi-group
differential expression FDR. Hierarchical clustering of the gene expression
levels is
performed and plot the data in a heatmap. By visual inspection, gene sets with
concordant
expression patterns are determined, which putatively represent biological
functions that are
co-regulated during MO polarization. After determination of the clusters of
interest, self-
similarity statistics within each cluster are computed to quantify the degree
of separation.
[0219] Pathway analysis: The gene sets obtained from the hierarchical
clustering and
differential expression presumably represent cellular functions representing
MO polarization.
A detailed perspective into different biological pathways enriched in each
cluster is obtained
using the Core Pathway Analysis database in Ingenuity Pathway Analysis. The
statistical
significance and enrichment of each pathway is compared between the miRNA
clusters to
compare how relevant osteoinductive functions are differentially regulated.
[0220] miRNA target analysis: A comprehensive miRNA target prediction using
two tools,
TargetScanMouse 7.2 (www.tardetscan.ord), and Diana Tools DIANA-microT (v5.0)
(diana.imis.Athena-innovation.gr/Dianatools/index.php.) are used to anticipate
the miRNAs
impact on osteoinduction and osteogenesis. This is exemplified by the
preliminary analysis
conducted using the three specific miRNAs from MO M2 exosomes (Figure 18).
[0221] Overexpression and knockdown of miRNAs: miRNAs play a pivotal role in
exosomal function. Therefore, specific manipulation of exosomal miRNAs may be
used to
control exosome functionality. Recent studies on miRNA sorting into exosomes
have
-46-
CA 03106818 2021-01-15
WO 2020/023251
PCT/US2019/042096
identified a target sequence in the 3' end of miRNAs (GGAG; SEQ ID NO:8) that
directs
exosomal sorting and are available as expression systems (System Biosciences,
XMIR
expression system) directing miRNA into exosomes. MO are genetically modified
to express
specific miRNAs selectively targeting into exosomes as demonstrated in Figure
31 and
Figure 32.
[0222] Overexpression of M2 miRNAs is achieved by MO transfection with
lentiviral particles
incorporating the select miRNA sequences preceded by the exosomal targeting
sequence
and subsequent selection for stable expression. Illustrating the current
methodology, MSC
exosomes were engineered for regenerative purposes by targeted expression of
miR424, an
anti-inflammatory miRNA of MSCs (Figure 31 and Figure 32). Using this
approach, MO is
transduced with M2 MO miRNA encoding XMIR (AXMIR for knockdown) plasmids and
then
selected for stable expression. Exosomes is isolated from these cell lines as
described. The
size distribution, presence of exosomal markers and endocytic properties of
the modified
exosomes is verified as per the standardized protocols (general methods). To
assess the
over expression or knockdown of miRNA in the engineered exosomes, total
exosome RNA
is isolated and qRT-PCR is used to evaluate the engineered exosome expression
levels of
the selected miRNAs with respect to control exosomes and vector- control
exosomes.
Increased miRNA levels with respect to control MO exosomes (student's t-test,
P<0.05) will
denote success. The functionality of these engineered exosomes are explored as
described
below. Note the modification of parental cells does not affect exosome
endocytosis in target
cells (Figure 31 and Figure 32).
[0223] Gene expression, protein expression and osteoblastic differentiation in
MO
exosome/miRNA ¨ targeted MSCs: Osteoblastic differentiation of primary mMSCs
are
performed using standard procedures and assays. Briefly, primary mouse bone
marrow
MSCs is cultured with osteogenic media (OM) containing a-MEM supplemented with
15 %
FBS, 0.1 mM dexamethasone, 10 mM /3-glycerophosphate, 50 mM ascorbate-2-
phosphate,
100 U/mL penicillin, 100 mg/mL streptomycin, and 250 ng/mL amphotericin B.
Cells grown
in MSC medium (a-MEM containing 10%fetal calf serum, 100 Wm! of
penicillin/streptomycin)
are used as controls. Media is changed every 3 days and cultures are
maintained for 28
days.
[0224] To define the possible impact of the selected M2 MO miRNAs on mouse
bone
marrow MSC osteoblastic differentiation, P2 or P3 mouse MSC is cultured to 80%
confluence (day 0) in 12 well culture plates and treated at day 0 with PBS, M2
exosomes or
engineered MO exosomes (9 x10⁶/ pL). OM +/- miRNA- engineered exosomes are
changed
every third day for 28 days. Assays for osteogenic differentiation include
colorimetric
assessment of alkaline phosphatase activity, calcium deposition using alizarin
red staining,
and qPCR analysis of osteogenic gene expression (RUNX2, OSX (5P7), BMP2, BMP2,
-47-
CA 03106818 2021-01-15
WO 2020/023251
PCT/US2019/042096
BSP, DMP1 and OC). Differentiation assays are performed using n=5 wells /
engineered
exosome variable and per time point and analyzed by Student t-test (p< 0.05).
All assays are
repeated using MSCs from three different mouse- derived MSC cultures. Results
are
compared to both OM only - and MO exosome - treated MSC cultures.
[0225] M2 MO exosomes positively alter bone regeneration in the calvaria model
and that
MO exosomes are effectively delivered to the calvaria defect using a simple
expanded
collagen scaffold (Figure 30). Further, engineered exosomes enhance bone
repair (Figure
33).
[0226] Engineered MO exosome engraftment: The miRNAi, miRNA2, and miRNA3are
identified by the linear selection process involving miRNA seq, in silico
targeting and
validation, and cell culture osteogenesis assays detailed in sub aim 2b. These
miRNAs are
expressed in exosomes as described above. The engineered exosomes are isolated
using
ExoQuick-TC and quantified using NanoSight (general methods), and targeted
miRNA
expression is quantified by qRT-PCR. 3.5 mm calvaria defects are created by
standard
surgical techniques. The calvaria defects are grafted by placement of 3.5 mm
collagen
scaffolds, with or without MO exosomes (4.0 x 10⁸exosomes / defect). Collagen
scaffolds
are hydrated with saline or saline with exosomes at 37 C for 1 hour prior to
surgical
engraftment. 8 mice (4 male, 4 female) are treated per group and per time
point using the
following treatment groups: 1) collagen + saline, 2) collagen + M1 MO exosomes
(negative
control, isolated from MO treated with LPS + INFy), 3) collagen + M2 specific
miRNAi
engineered exosomes, 4) collagen + M2 specific miRNA2engineered exosomes, and
5)
collagen + M2 specific miRNA3engineered exosomes. Healing will occur 4 weeks
to assess
initial mineralized matrix formation and 8 weeks to assess the extent of bone
repair. 80 mice
(2 time points x 5 groups x 8 mice (4ma1e + 4 female) are required for each of
two repeated
experiments (power analysis in general methods).
[0227] MO exosome complementation in MO depleted mice. Depletion of MO in the
MaFIA mouse reduces bone formation. The preliminary data shows that MO
reduction is
associated with reduced bone healing in this model (Figure 34). To directly
implicate the M2
exosomes and the possible effects of specific M2 miRNAs in bone regeneration,
a second
series of calvaria regeneration studies are conducted treating calvaria
defects using 4.0x10⁸
exosomes/defect in MO depleted MaFIA mice. Quantification of bone regeneration
is
compared between groups as a function of the presence of M2 or engineered MO
exosomes
in the presence or absence of AP20187 treatment. It is anticipated that M2 and
engineered
MO exosomes will partially reverse the AP20187 mediated MO ablation and
related
inhibition of bone regeneration by replacing key MO exosomes and miRNA
involved in
signaling of osteoinduction and osteogenesis.
-48-
CA 03106818 2021-01-15
WO 2020/023251
PCT/US2019/042096
[0228] Osteogenesis within the calvaria defects is measured using standard
methods for a)
p [CT-based morphometry, b) histology, c) immunohistochemistry using anti-
Runx2 and anti
BSP antibodies (the MSC marker Stro-1 does not identify mouse MSCs, and CD29
is
expressed by MO) and d) RT-PCR assessment of osteoblastic gene expression (see
general methods).
[0229] Four - and 8 ¨ week time points are evaluated for bone regeneration.
Studies are
conducted in MaFIA mice treated with AP20187(MO depleted) or saline
(background
control). Under each condition, the treatment groups are: 1) collagen scaffold
(control), 2)
collagen + M2 exosomes, 3) collagen + M2 specific miRNAi engineered exosomes,
4)
collagen + M2 specific miRNA2engineered exosomes, and 5) collagen + M2
specific miRNA3
engineered exosomes. Eight mice (4 male /4 female) are used / group. 160 mice
are
required [(n=8 mice (4 male +4 female) x 2 time points x 5 groups) +/-
AP20187] for each of
two repeated experiments.
[0230] The p [CT-based morphometry is based on a novel Matlab script that
automatically
calculates the volume of mineralized tissue within a fixed 3.5 mm diameter
cylindrical volume
of interest (Figure 35). This reduces dramatically the labor of manual
segmentation. The
p [CT data is imported into the Matlab software using custom scripts and
stored as voxels of
greyscale values. The data are then segmented on grey scale values and
relative bone
density calculated based on maximum density of intact calvarium. The defect
boundaries
and the center point are then set manually and the software was programmed to
create an
ROI of the defect diameter (-3.5mm) cutting across the z plane. For the
experimental and
control regions, the regenerated volume was determined by summation of the
greyscale
values within the ROI and percentage regeneration was calculated based on the
total
volume of the cylindrical ROI. To visualize the 3D distribution of bone
density, a modified
version of the Matlab function v013d_v2 (version 1.2.2.0) was used to create
3D renderings
using orthogonal plane 2D texture mapping techniques. The volume of newly
formed bone
within the implanted scaffolds is quantified and expressed as bone volume over
total volume
(BV/TV/0). CT analysis will include bone volume (BV/TV/0).
Example 3: Neuronal regenerative exosomes
[0231] Exosome-specific exprssion of miR424 was achieved, and the exosomes
were
successfully endocytosed (Figure 36). Human bone marrow derived MSC and DPSC
(dental
pulp stem cell) were genetically modified to overexpress miR 424 with an
exosome targeting
sequence. The resulting exosomes were evaluated for their ability to be
endocytosed by
retinal neuronal cell line R28 (Figures 37 and 38). To evaluate the function
of these
engineered exosomes under ischemic conditions, ischemic conditions were
mimicked in
R28 retinal cells by subjecting them to oxygen and glucose deprivation (OGD).
To test the
-49-
CA 03106818 2021-01-15
WO 2020/023251
PCT/US2019/042096
hypothesis if exosomes can rescue R28 cells from OGD-mediated cell death, the
R28 cells
were subjected to OGD conditions for 6h and later were treated with exosomes
for about 18
hours. The cytotoxicity was measure by release of LDH (LDH is an enzyme that
is released
when cells are dying) by the cells. As seen in Figure 39, OGD conditions
caused more than
50% of cell death. Conversely when same were treated with DPSC exosomes showed
significant reduction in %cell death as compared to cells with absence of
exosomes. The
same experiment was performed using DPSC miR424 derived exosomes. Similar
results
were obtained. When compared, DPSC miR424 derived exosomes proved more
effective
than DPSC exosomes (Figure 40). Also, conditioned media depleted of exosomes
were
tested and fewer protective effects were seen implying that the protective
effects are due to
the presence of exosomes (data not shown).
Example 4: Mesenchymal Stem Cell-Derived Extracellular Vesicles and Retinal
Ischemia-Reperfusion
[0232] Retinal ischemia is a major cause of vision loss and impairment and a
common
underlying mechanism associated with diseases such as glaucoma, diabetic
retinopathy,
and central retinal artery occlusion. The regenerative capacity of the
diseased human retina
is limited. Previous studies have shown the neuroprotective effects of
intravitreal injection of
mesenchymal stem cells (MSC) and MSC-conditioned medium in retinal ischemia in
rats.
Based upon the hypothesis that the neuroprotective effects of MSCs and
conditioned
medium are largely mediated by extracellular vesicles (EVs), MSC derived EVs
were tested
in an in-vitro oxygen-glucose deprivation (OGD) model of retinal ischemia.
Treatment of R28
retinal cells with MSC-derived EVs significantly reduced cell death and
attenuated loss of
cell proliferation. Mechanistic studies on the mode of EV endocytosis by
retinal cells were
performed in vitro. EV endocytosis was dose- and temperature-dependent,
saturable, and
occurred via cell surface heparin sulfate proteoglycans mediated by the
caveolar endocytic
pathway. The administration of MSC-EVs into the vitreous humor 24 h after
retinal ischemia
in a rat model significantly enhanced functional recovery, and decreased neuro-
inflammation
and apoptosis. EVs were taken up by retinal neurons, retinal ganglion cells,
and microglia.
They were present in the vitreous humor for four weeks after intravitreal
administration, with
saturable binding to vitreous humor components. Overall, this study highlights
the potential
of MSC-EV as biomaterials for neuroprotective and regenerative therapy in
retinal disorders.
[0233] Age related macular degeneration, diabetic retinopathy, and glaucoma
are the
leading causes of irreversible blindness in Western countries, predicted to
affect
approximately 200 million people by 2020. Retinal ischemia and cell death
resulting from,
among other mechanisms, apoptosis and inflammation, are the hallmark events in
the
pathogenesis of the resulting visual loss. Current therapy focuses upon
arresting disease
progression using intraocular injections (e.g., anti-VEGF), eye drops, or
surgery. Limitations
-50-
CA 03106818 2021-01-15
WO 2020/023251
PCT/US2019/042096
of these treatments motivate studies of alternatives with greater safety
margin, and higher
likelihood of reaching the retinal target cells.
[0234] Successful strategies for enabling repair and regeneration of injured
or diseased
tissues should overcome the limitations of using morphogens and growth factors
and rely on
biomimetic strategies that minimize immunological and oncogenic consequences.
In this
regard, stem cell therapy using mesenchymal stem cells (MSCs) serves as an
attractive
option. MSCs are multipotent cells with regenerative and immunomodulatory
properties. It
has been previously reported that MSCs exhibit a robust neuroprotective
effect, as does
their conditioned medium, in an in vivo rat model of retinal ischemia-
reperfusion injury. In the
eye, stem cell-based retinal cell replacement is a highly encouraging approach
to trigger
neuroprotection and/or regeneration. However, low cell integration and
aberrant growth,
among other factors, limit its promise.
[0235] On the other hand, mounting evidence suggests that most MSC effects are
paracrine
in nature and are mediated by MSC derived extracellular vesicles (EVs).
Several groups
have reported on the regenerative potential of MSC-EVs in soft and hard tissue
regeneration. Therefore, it can be possible to avoid the limitations and
complications of stem
cell therapy in the eye by using MSC derived EVs as biomimetic agents to aid
neuroprotection and regeneration. This approach is made feasible by the fact
that apart from
possessing neuroprotective and regenerative properties, MSCs are also prolific
producers of
EVs. Therefore, MSCs can prove to be an ideal source for therapeutic EVs that
can be
applied as naturally occurring biomaterials. Additionally, published studies
show that EVs
decrease neuronal cell death after hypoxia/ischemia in vitro and in vivo,
stimulate axonal
growth, and are anti-inflammatory and immunomodulatory, supporting a potential
treatment
role in retinal diseases. Therefore, an aim of this study was to test the
hypothesis that MSC-
EVs attenuate injury produced by hypoxia and ischemia in the retina.
[0236] EVs are integral to intercellular communication, interacting with
recipient cells by
three main mechanisms which resemble viral entry: 1) Binding surface receptors
to trigger
signal cascades, 2) internalization of surface-bound EVs via endocytosis,
phagocytosis, or
macro-pinocytosis, and 3) fusion with the cell to deliver material directly to
the cytoplasmic
membrane and cytosol. Presently, there is a foundational knowledge gap with
respect to the
endocytosis of MSC-EVs by retinal cells and their mechanisms of entry. Uptake
can depend
upon proteins on the EV surface and the target cell. A logical hypothesis is
that cells use
unique, and likely multiple, means to internalize EVs, e.g., integrins are
necessary for EVs
internalization in dendritic cells, macrophages, and heparin sulfate
proteoglycans (HSPGs)
for entrance into cancer cells. Moreover, clathrin- and caveolin-mediated
pathways can be
involved. Therefore, one of the aims of this study was to evaluate the
endocytic mechanism
of MSC-EVs by retinal cells. These mechanistic studies help in developing a
foundational
-51-
CA 03106818 2021-01-15
WO 2020/023251
PCT/US2019/042096
knowledge of MSC-EV functionality in neuronal cells that can be exploited to
promote
enhanced delivery for engineered EVs as well as to facilitate cell-type
specific targeting.
[0237] Compared to studies of neuronal injury in vivo, retinal neurons and
other cells in the
retina such as glial cells are more readily accessible by injection directly
into the vitreous
humor. Thus the retina is ideal as a window into the brain for studies of EV
mechanisms and
therapeutics that targets neuroprotection and regeneration. This route is also
commonly
used in the treatment of retinal disease and EV therapeutics should be
optimized to use the
intravitreal injections advantageously. However, the principles governing EV
transit within
tissues under normal and pathological conditions are poorly understood and are
necessary
to be determined in order to reach the full potential of EVs as effective
biomaterials for ocular
therapy.
[0238] Most pre-clinical studies use systemic administration of EVs. This is a
low efficiency
method as much of the injected dose is distributed outside of the target
organ. For the retina,
EVs delivered into the vitreous humor are expected to gain direct access to
the inner retina
cells including the retinal ganglion cells (RGCs). The vitreous humor is
predominantly
comprised of collagen and hyaluronic acid along with a network of extended
random coil
molecules that fills in the meshes of the collagen fiber network. However,
studies utilizing
intravitreal injections of EVs have not focused on their interactions with the
vitreous humor,
their endocytic mechanisms and distribution within the eye. This knowledge is
vital for
understanding EV dynamics in the intraocular space and provides a foundational
knowledge
for nanoparticle-based biomaterials movement in this environment. Based on the
earlier
observation that MSC-EVs can bind to type I collagen, it was hypothesized that
the vitreous
humor proteins can bind to EVs and serve as a reservoir for EVs prolonging
their availability
to retinal cells.
[0239] Overall, this study aimed to evaluate the use of MSC-derived EVs as
biomimetic
agents for neuroprotection/regeneration following ischemic insult or injury
using the eye as a
model system and characterizing the fundamental aspects of EV behavior within
the eye and
the retina in particular.
Materials and Methods
[0240] Isolation of human bone marrow mesenchymal cell derived EVs: Human MSCs
(hMSCs) were purchased from American Type Culture Collection (ATCC, Manassas,
VA)
and cultured in a-MEM supplemented with 20% FBS, 1% L-Glutamine, and 1%
antibiotic-
anti-mycotic solution (all from GIBCO, Thermo-Fisher). They were seeded to
confluence
cultured for 4 weeks. Subsequently, EVs were isolated from the culture medium.
Briefly,
cultures were washed with serum-free medium and cultured 48 h in the same
medium under
normoxic (21% 02,37 C) conditions. Conditioned medium was collected and
centrifuged to
remove whole cells and debris. After filtration with a 0.22-pm pore filter,
supernatant was
-52-
CA 03106818 2021-01-15
WO 2020/023251
PCT/US2019/042096
transferred to a 100-kDa molecular weight cut-off ultra-filtration conical
tube (Amicon Ultra-
15, Millipore, Burlington, MA), and centrifuged (3,000 x g) at 4 C for 45 min.
EVs were
isolated from the concentrated conditioned medium using Exo Quick-TC EV
Precipitation
Solution (System Biosciences, Palo Alto, CA). Isolated EVs were suspended in
PBS, the
suspensions normalized to cell number from the tissue culture plate from which
they were
isolated, and diluted such that 100 I of suspension contained EVs isolated
from 1 million
cells. Cross-verification was performed by measuring RNA and total protein
from EV
suspensions to ensure that RNA/protein concentration from the same volume of
EV
remained consistent.
[0241] Characterization of MSC-EVs using electron microscopy, nanoparticle-
tracking
analysis, and Western blotting: MSC-EVs isolated from the conditioned medium
were
characterized for size, morphology, and the specific exosome surface marker
CD63 by
transmission electron microscopy (TEM). CD63 and additional exosome surface
markers
were also examined using immunoblotting. Nanoparticle Tracking Analysis (NTA)
by
Nanosight (LM10-HS, Malvern, Westborough, MA) measured MSC-EV concentrations
and
particle size to confirm the composition and consistency of the MSC-EV
preparations.
[0242] MSC-EVs were adsorbed onto carbon-Formvar film grids and fixed in 2%
glutaraldehyde/PBS at pH 7.4. Morphology was observed by TEM (80 kV, JEM-1220
TEM,
JEOL, Peabody, MA), following staining with 2% phosphor-tungstic acid. For
immunogold
labeling, the MSC-EVs bound to the grids were permeabilized in 0.5% Triton X-
100/PBS,
then blocked with 5% BSA/PBS. The MSC-EVs were incubated for 2 h at room
temperature
in mouse monoclonal anti-CD63 (Abcam, Cambridge, MA, 1/100). Grids were washed
three
times and then incubated 1 h at room temperature in gold-labeled secondary
antibody
(1/2000, Abcam). The grids were then washed, dried and imaged using a JEOL JEM-
3010.
[0243] For immunoblotting, the MSC-EV pellets were lysed in 1X RIPA buffer
with protease
and phosphatase inhibitor cocktail. Lysates were centrifuged at 4 C and
protein
concentrations measured using a protein assay kit (Pierce, Rockford, IL) Equal
amounts of
protein per lane (10 pg) were diluted with SDS sample buffer and loaded onto
gels (4%-20%
or 16%; Invitrogen-Thermo Fisher). Proteins were electroblotted to
polyvinylidene difluoride
membranes (Immobilon-P; Millipore, Bedford, MA) with efficiency of transfer
confirmed by
Ponceau S Red (Sigma, St Louis, MO). Nonspecific binding was blocked with 5%
nonfat dry
milk in Tween-Tris-buffered saline. Membranes were incubated overnight at 4 C
with primary
antibodies: anti-CD81 (rabbit polyclonal, Abcam, 1/250), anti-CD63 (rabbit
polyclonal,
Abcam, 1/250), anti-CD9 (mouse monoclonal, Abcam, 1/250), and anti-a-HSP70
(rabbit
polyclonal, System Biosciences, 1/1000. Anti-rabbit horseradish peroxidase
(HRP)-
conjugated (goat IgG; Jackson Immuno Research, West Grove, PA), or anti-mouse
HRP-
conjugated (sheep IgG; Amersham, Buckinghamshire, UK) secondary antibodies
were
-53-
CA 03106818 2021-01-15
WO 2020/023251
PCT/US2019/042096
applied at 1:20,000. Chemiluminescence was developed with a kit (Super Signal
West Pico;
Pierce). Protein bands were digitally imaged with a LICOR Odyssey (Lincoln,
NE).
Fluorescent labeling of MSC-EVs:
[0244] To image MSC-EVs in vivo and in vitro, isolated EVs were labeled with
green
fluorescent-tagging reagent Exo-Glow Protein (System Biosciences), which
labels intra-
exosomal proteins fluorescently. Briefly, MSC-EVs were suspended in PBS and
incubated
with Exo-Green Protein for 10 min at 37 C followed by 30 min incubation on
ice. Labeled
MSC-EVs were precipitated by adding Exo Quick-TC and centrifuged for 30 min at
14,000 x
g. The obtained pellet was re-suspended in PBS.
[0245] Retinal cell line R28 culture: Retinal cell line R28 was purchased from
Kerafast
(Boston, MA) and cultured according to the supplier's instructions. R28 is an
adherent retinal
precursor cell line derived from postnatal day 6 Sprague-Dawley rat retina
immortalized with
the 12S E1A gene, and has been used previously in studies on oxidative stress
in retinal
cells. The 12S E1A gene was introduced via an incompetent retroviral vector;
therefore, the
cells produce no infectious virus. The cells have been passaged 200 times thus
far, and
show no signs of senescence. The heterogeneity of this cell line provides a
diversity of cell
types simulating in vivo retina and offers differentiation potential as an
additional test of
viability. Cells were cultured in DMEM with 10% serum (420 ml DMEM incomplete,
15 ml
7.5% sodium bicarbonate, 50 ml calf serum, 5 ml MEM non-essential amino acids,
5 ml
MEM vitamins, 5 ml L-glutamine (200 mM) and 0.625 ml Gentamicin (80 mg/ml),
with pH
adjusted to 7.4.
[0246] In vitro oxygen glucose deprivation model: As an in vitro model of
retinal ischemia,
an oxygen-glucose deprivation (OGD) in R28 cells was used. R28 cells were
plated to reach
70% confluence in normal medium. For OGD, cells were cultured in glucose-free
medium
and subjected to hypoxia (1% 02, 5% CO2) for 24 h. Cells were then re-
oxygenated (21%
02, 5% CO2) for another 18 h, then assayed for lactate dehydrogenase (LDH,
Promega,
Madison, WI), and cell proliferation (ethynyl-deoxyuridine (EdU) assay
followed by flow
cytometry). Cytotoxicity was assayed by using Sytox non-radioactive
cytotoxicity assay kit
(Promega). Briefly, culture supernatant samples from normoxic and OGD cells
treated with
MSC-EVs were transferred to a 96 well plate and equal volume of Sytox reagent
was added,
incubated 30 min at room temperature, and absorbance measured at 490 nm.
Percentage
cytotoxicity was calculated from LDH release into the supernatant.
[0247] We used Click-iT EdU kit from Thermo-Fischer for measuring cell
proliferation. Cells
were labeled with EdU at the end of OGD and subjected to click reaction. The
fluorescent
signal generated by Click-iT EdU was detected by logarithmic amplification and
analyzed by
flow cytometry with a CyAn 2 Bench-top Analyzer (Beckman-Coulter, Brea, CA).
Endocytosis experiments:
-54-
CA 03106818 2021-01-15
WO 2020/023251
PCT/US2019/042096
[0248] For imaging, R28 cells were seeded onto glass coverslips in 6-well
tissue culture
plates. At 24 h post-seeding, 50 I of fluorescently labeled MSC-EVs
(corresponding to EVs
isolated from 500,000 hMSCs) or PBS was added to the culture medium and
incubated for 1
h at 37 C. The PBS control was subjected to a similar labeling procedure as
the EV
suspension prior to being used in the experiment. After each experiment,
coverslips were
washed in PBS three times, fixed in 4% neutral buffered formalin, and immuno-
labeled using
anti-tubulin (1/5000, Sigma), anti-clathrin (1/500, Santa Cruz Biotechnology,
Santa Cruz,
CA), or anti-caveolin-1 (1/1000, Santa Cruz). Slides were imaged using a Zeiss
(Thornwood,
NY) LSM 710 confocal microscope or Zoe fluorescent imager (BioRad, Hercules,
CA).
[0249] Quantitation of endocytosis and dose-dependency experiments were
performed in 96
well ELISA plates, with 10,000 R28 cells per well. At 24 h post seeding,
increasing amounts
of MSC-EVs were added and incubated for 1 h at 37 C. For blocking experiments,
20 I of
MSC-EVs were used per 20,000 cells (2x saturation). Cells were pre-treated
with either
heparin (0, Sand 101.1M, Sigma), RGD (Arg-Gly-Asp peptide, 0,0.5, 1, and 2 mM,
Abcam),
MBCD (Methyl-8- cyclodextrin, 0, 2.5, 5 mM, Sigma), or incubated at 4 C for 1
h followed by
incubation with the MSC-EVs. The experiments were conducted in quadruplicate.
Wells
were washed 3 times in PBS, fixed using 4% neutral buffered formalin, and the
fluorescence
measured using a BioTek (Winooski, VT) 96 well plate reader equipped with the
appropriate
band pass filter sets.
[0250] In vivo rat model of retinal ischemia: Procedures conformed to the
Association for
Research in Vision and Ophthalmology Resolution on the Use of Animals in
Research. Male
Wistar rats (200-250 gm, Harlan, Indianapolis, IN) were maintained on a 12 h
on/12 h off
light cycle. For retinal ischemia, rats were anesthetized with ketamine 100
mg/kg, and
xylazine, 7 mg/kg intraperitoneally (i.p.). After sterile preparation, and
working under an
operating microscope, a 30-gauge, 5/8-inch metal needle (BD Precision Glide,
Becton-
Dickinson, Franklin Lakes, NJ) was placed with its tip inside the anterior
chamber of the eye.
The needle was connected by plastic tubing via a three-way stopcock to a
pressure
transducer (Trans-pac, Hewlett-Packard) and an elevated bag of balanced salt
solution
(BSS; by sterile technique BSS was transferred from its bottle (Alcon, Ft
Worth, TX) to an
empty 1000 ml 0.9% saline plastic bag. Intraocular pressure (10P), continually
displayed on
an anesthesia monitor (Hewlett-Packard HP78534C), was increased to 130-135 mm
Hg for
55 min by pressurizing the bag (Smiths Medical Clear Cuff, Minneapolis, MN).
The eyes
were treated with topical Vigamox (0.5%; Alcon), cyclomydril (Alcon) and
proparacaine
(0.5%; Bausch & Lomb, Bridgewater, NJ). Temperature was maintained at 36-37 C
using a
servo¨controlled heating blanket (Harvard Apparatus, Holliston, MA). Oxygen
saturation of
the blood was measured with a pulse oximeter (Ohmeda-GE Healthcare, Madison,
WI) on
-55-
CA 03106818 2021-01-15
WO 2020/023251
PCT/US2019/042096
the tail. Supplemental oxygen, when necessary to maintain 02 saturation > 93%,
was
administered with a plastic cannula placed in front of the nares and mouth.
[0251] Electroretinography: For baseline and post¨ischemic follow¨up
electroretinography
(ERG), rats were dark adapted and were injected i.p. with ketamine (35 mg/kg)
and xylazine
(5 mg/kg) every 20 min to maintain anesthesia. Custom Ag/AgCI electrodes were
fashioned
from 0.01 inch Teflon-coated silver wire (Grass Technologies, West Warwick,
RI).
Approximately 10 mm was exposed and fashioned into a small loop to form the
corneal/positive electrodes while ¨20 mm was exposed to form a hairpin loop,
the
sclera/negative electrodes looped around the eye. To maintain moistness of the
cornea and
electrical contact, eyes were treated intermittently with Goniosol (Alcon).
Electrodes were
referenced to a 12 mm x 30-gauge stainless steel, needle electrode (Grass)
inserted 2/3
down the length of the tail. Stimulus-intensity ERG recordings were obtained
simultaneously
from both eyes using a UTAS-E 4000 ERG system with a full-field Model 2503D
Ganzfeld
(LKC Technologies, Gaithersburg, MD).
[0252] The ERG a- and b-waves were expressed as normalized intensity-response
plots
with stimulus intensity (log cd.s/m2) on the X-axis, and corresponding percent
recovery of
baseline on the Y-axis. Recorded amplitude, time course, and intensity were
exported and
analyzed in Matlab 2011a (MathWorks, Natick, MA). ERG waveform recovery after
ischemia
was corrected for day-to-day variation and reference to the non-ischemic eyes.
In vivo administration of MSC-EVs, and MSC-EV depleted conditioned medium into
the
eyes:
[0253] MSC-EV-depleted conditioned medium was prepared by isolating MSC-EVs
from the
medium as described above and served as control in addition to PBS. The
conditioned
medium was centrifuged, filtered to remove cells and debris, and concentrated
using 10-kDa
molecular weight cut-off ultra-filtration conical tubes (Amicon Ultra-15) by
centrifuging at
3,000 x g at 4 C for 45 min. MSC-EVs were isolated as described above.
Supernatant
without MSC-EVs was evaluated for pH, and for protein concentration using a
protein assay
kit (Pierce). Normoxic MSC-EV-depleted conditioned medium (10 pg protein/4
I), MSC-EVs
(4 I of 1x10⁹ particles/m1), or PBS (4 were injected into the vitreous
humor of both the
ischemic (right) and non-ischemic (left) eyes, 24 h after retinal ischemia (4
l is the maximal
safe volume for injection into the vitreous humor in rats). The normal/non-
ischemic left eye
served as the control eye. Rats were subjected to ERG recordings at baseline,
prior to
ischemia, and at seven days post injections, i.e., 8 days after ischemia.
Evaluation of apoptosis and inflammatory markers in MSC-EV injected retinae:
[0254] Retinal tissue was homogenized with a Bead-Bug Micro-tube Homogenizer
(Midwest
Scientific, Valley Park, MO) in RIPA buffer (Cell Signaling Technology,
Danvers, MA)
-56-
CA 03106818 2021-01-15
WO 2020/023251
PCT/US2019/042096
containing protease and phosphatase inhibitors. Lysates were centrifuged at 4
C and protein
concentration measured using a BCA protein assay kit (Pierce). Equal amounts
of protein
(15 pg) were loaded onto 10% sodium dodecyl sulfate¨polyacrylamide gel
electrophoresis
gels, transferred onto nitrocellulose membranes and Western blotting was
performed.
Membranes were probed with anti-IL-6 (Santa Cruz, mouse monoclonal, 1/500,
anti-TNF-a
Santa Cruz, mouse monoclonal, 1/500), and anti-cleaved caspase-3 (Cell
Signaling, rabbit
polyclonal, 1/1000) primary antibodies. IL-6 and TNF-a are markers of
inflammation, and
caspase-3 of apoptosis gene-related expression. Band density was calculated
using
densitometry with macros in ImageJ (https://imagej.nih.gov/Wdocs/guide/user-
guide-
USbooklet.pdf) where each protein was normalized to anti--actin.
[0255] Fundus imaging and in vivo tracking of MSC-EVs in the eye: To track MSC-
EVs in
vivo, the EVs were labeled with Exo-Glow Protein prior to intravitreal
injection. The labeled
MSC-EV pellet was suspended in PBS and injected (4 pl of 1x10⁶ particles/m1)
24 h post-
ischemia into the mid-vitreous under direct vision using an operating
microscope, in both
normal and ischemic eyes. For in vivo real-time imaging, rats were injected
i.p. with
ketamine (35 mg/kg), and xylazine (5 mg/kg). Pupils were dilated with 0.5%
tropicamide
(Alcon), and cyclomydril. Fluorescent fundus images were obtained using a
Micron IV
Retinal Imaging Microscope (Phoenix Research Labs, Pleasanton, CA), at 1, 3,
7, 14, and
28 days after injections into the vitreous humor.
[0256] Fluorescent imaging and localization of labeled MSC-EVs in retinal flat
mounts: Exo-
green MSC-EV-injected ischemic and normal rats were anesthetized at different
time points
(1, 3, and 7 days) after intravitreal injections and subjected to whole animal
perfusion-fixation
with PBS and 4% paraformaldehyde. Following enucleation, the eye cups were
prepared by
removing the cornea, lens and vitreous. The eyecups were post-fixed in 4% PFA
for 30 min,
washed twice in PBS, and permeabilized with PBST (0.3% Triton X-100 in PBS,
twice). The
eye cups were blocked overnight in 2% Triton X-100, 10% normal serum and 1
mg/ml BSA.
The primary antibodies anti-IBA-1 for retinal microglia (1:500, Novus Bio,
Littleton, CO), and
anti-Brn-3a for retinal ganglion cells (1:500, EMD Millipore), and anti-p-
tubulin III for retinal
neurons (1:500, Sigma), were incubated with the eyecups at 4 C for 48 h
followed by
washing and incubation with the appropriate secondary antibodies (Alexa Fluor
555 and 647,
Molecular Probes, Thermo-Fisher) for an additional 48 h at 4 C. The samples
were washed
again, and the retinal tissues carefully dissected from the choroid and placed
on a glass
slide and mounted with Pro-Long Diamond Antifade Mounting Solution with DAPI
(Life
Technologies, Thermo-Fisher). Slides were imaged using a Zeiss 710 confocal at
63 and
100x oil immersion magnification, and images deconvoluted using Zeiss Zen v2.4
software.
[0257] Fluorescent TUNEL: Fluorescent TUNEL (terminal deoxpucleotidyl
transferase-
mediated dUTP nick end labeling assay) was performed with Apop Tag Red In Situ
-57-
CA 03106818 2021-01-15
WO 2020/023251
PCT/US2019/042096
Apoptosis Detection Kit (Millipore-Sigma) on 7 pm thick cryosections at 24 h
post-MSC-EV
injection (48 h after ischemia). This is consistent with the time course of
apoptosis that was
previously described in retinal ischemia, where peak TUNEL was present 48 h
after
ischemia. Briefly, cryosections were fixed and hydrated in 4% paraformaldehyde
followed by
ethanol: acetic acid (2:1) post fixation. Sections were then exposed to
equilibration buffer
and incubated in TdT enzyme for lh in a humidified chamber followed by
application of anti-
digoxigenin conjugate for 30 min at room temperature, with the slides covered
to protect
them from light exposure. Sections were mounted using Prolong Diamond Antifade
Mounting
Agent containing DAPI.
[0258] Imaging was performed at 20x magnification on a Zeiss Axiovert 100
inverted
microscope using Metamorph 7.3. The images were processed and analyzed using
ImageJ.
In brief, the inner and outer nuclear retinal cell counts for DAPI (total cell
nuclei), and the
TUNEL stained nuclei were counted using an automated cell counting macro in
ImageJ,
utilizing the Cy3 channel. The TUNEL cells of the retinal ganglion cell (RGC),
inner nuclear,
and outer nuclear layers were counted blindly without knowledge of the group
name.
MSC-EV vitreous humor binding assay:
[0259] The vitreous humor was extracted from normal rat eyes. After measuring
the protein
concentration, dilution to 504/100 I was performed in coating buffer (0.2M
sodium
bicarbonate, pH 9.4) and 96 well plates were coated with the vitreous proteins
overnight at
4 C. Plates were washed and incubated for 1 h at room temperature with
increasing
amounts of fluorescently labeled MSC-EVs. Fluorescence from the bound MSC-EVs
after
washing was measured using a BioTek ELISA plate reader with the appropriate
band pass
filter sets and the results were plotted against MSC-EV amount to obtain the
binding curves.
Statistical Analysis:
[0260] Data were expressed as mean + standard deviation (SD), and compared by
ANOVA
where appropriate, and by t-testing. Analyses were performed using Stata
version 10.0
(College Station, TX).
Results
Characterization of MSC-EVs:
[0261] The purified MSC-EVs were characterized by NTA, immunoblotting, and EM.
EVs are
a complex mixture of membrane-bound vesicles released from most cells, and
according to
their size they have been classified as microvesicles (100-800 nm), exosomes
(50-150 nm),
and the much larger apoptotic bodies. MSC-EVs were found to be exosomal in
their size and
properties. Analysis of size and concentration of isolated EVs using NTA
demonstrated a
bell-shaped curve with the majority of the area under the curve falling within
the
characteristic exosomal size range of 50-150 nm, a peak at 89 nm, and a modal
size of 93
nm. Another peak at 141 nm likely represents a mixture of exosomes and
microvesicles, and
-58-
CA 03106818 2021-01-15
WO 2020/023251
PCT/US2019/042096
the smaller peak at 324, the less abundant microvesicles (Figure 41A). Western
blot
demonstrated exosome surface markers CD81, CD63, CD9, and HSP70a in the
exosomal
lysates, and not in exosome-depleted conditioned medium (Figure 41B). The
exosomal
lysates were probed for tubulin as negative control for intracellular protein
and no positive
staining was observed (data not shown). TEM (Figure 41C) showed particle shape
and
diameter of approximately 100 nm consistent with exosomes, and immuno-gold EM
labeling
for CD63 (Figure 410) showed the presence of CD63 on the exosome surface,
confirming
the immunoblotting results and that exosomes constitute most of the MSC-EVs in
agreement
with other studies.
[0262] MSC-EVs are endocytosed by R28 retinal cells via specific mechanisms:
[0263] These experiments were performed to identify the basic mechanisms that
control
MSC-EV internalization by retinal cells. It was first confirmed that MSC-EVs
are endocytosed
by R28 retinal cells. Figure 42A is a representative confocal image
demonstrating that
fluorescently labeled MSC-EVs were endocytosed by R28 cells in culture. Most
of the R28
cells contained MSC-EVs indicating a high uptake efficiency. The MSC-EVs were
visualized
as punctate staining as well as agglomerates within the cells and across the
nuclei. Yellow
or orange staining in the composite image (lower right panel of Figure 42A)
indicated
overlap with tubulin, showing that MSC-EVs were in the cytoplasm. Figure 42B
shows dose-
dependent, saturable endocytosis of fluorescently labeled MSC-EVs.
Furthermore,
endocytosis was reduced significantly at 4 C, indicating temperature
dependence (Figure
42C). Taken together, these results indicate the presence of a controlled,
energy-dependent
endocytic mechanism for MSC-EVs in retinal cells.
[0264] Next the study aimed to identify the endocytic receptors. Studies have
shown
involvement of integrins in EV endocytosis in some cell types. To analyze
integrin
involvement in the endocytosis of MSC-EVs by R28 retinal cells, integrins on
the R28 cell
membrane were blocked by pre-treatment with increasing concentrations of the
integrin-
binding Arginyl-glycyl-aspartic acid (RGD) peptide. No statistically
significant impact upon
MSC-EV endocytosis was observed (Figure 43A). Conversely, when MSC-EVs were
pre-
treated with heparin to mimic the binding to HSPGs on the R28 plasma membrane,
EV
endocytosis was significantly and dose-dependently blocked (Figure 43B).
Confocal
microscopy qualitatively confirmed these quantitative results (Figures 43C-E).
The results
ruled out integrin involvement in the endocytosis of MSC-EVs and indicated a
role for cell
surface HSPGs.
[0265] Depending on the receptors involved and the type of ligand, endocytosis
can occur
via a clathrin- or caveolin-mediated process. Endocytosed MSC-EVs were
analyzed by
confocal microscopy for co-localization with caveolin-1 (a marker for caveolae
and lipid rafts)
and clathrin (which forms clathrin-coated endocytic pits). Representative
confocal images
-59-
CA 03106818 2021-01-15
WO 2020/023251
PCT/US2019/042096
(Figures 44A-B) show co-localization of the endocytosed MSC-EVs with caveolin-
1. No co-
localization was observed with clathrin in Figures 44C-D. Blocking caveolar-
mediated
endocytosis by MBCD, to disrupt membrane cholesterol, dose-dependently
inhibited MSC-
EV endocytosis (Figures 44E-F, and Figure 44G).
MSC-EVs attenuate cell death in R28 cells subjected to OGD in vitro:
[0266] Oxygen glucose deprivation (OGD) results in cell death and mimics
ischemic
conditions in vitro. The hypothesis that MSC-EVs rescue R28 cells from OGD-
mediated cell
death was tested. R28 cells pre-treated for 24 h with or without varying doses
of MSC-EVs
were subjected to OGD. Figure 45 shows that in the absence of MSC-EVs, OGD
induced
cytotoxicity was > 75%. Cytotoxicity was significantly reduced in a dose-
dependent and
saturable fashion with MSC-EV pre-treatment. To evaluate the effect of MSC-EVs
on the
proliferative state of R28 cells, flow cytometry analysis was performed for
EdU positive cells
(Figure 46) under both normoxic and OGD conditions. Under normoxic conditions,
the
percentage of EdU positive cells was no different between PBS control, MSC
conditioned
medium, EVs, or EV depleted conditioned medium. A slight decrease in the
percentage of
proliferating cells was observed with the EVs although this change was not
significant.
Conditioned medium as well as EVs significantly improved the number of
proliferating cells
under OGD conditions. When conditioned medium depleted of EVs was used, the
protective
effect was abrogated suggesting that the protective effect is likely due to
EVs in the
conditioned medium.
MSC-EV administration following retinal ischemia in vivo attenuates ischemic
damage:
[0267] We tested the hypothesis that MSC-EVs reverse the effects of ischemic
injury in vivo
in a rodent model. MSC-EVs injected intra-vitreally 24 h after ischemia
significantly improved
the recovery of the a- and b-wave amplitudes of the ERG in comparison to both
PBS vehicle
and EV-depleted conditioned medium from MSCs (Figure 47). Electroretinogram
(ERG)
results were normalized to control eyes and to the baseline prior to ischemia
which accounts
for day-to-day variation in the amplitudes of the non-ischemic eyes. Y axis is
% recovery
relative to baseline/100 and x-axis is stimulus intensity in log cd-ms/m2. The
amplitudes are
shown as mean + SD. There was significant improvement of recovery of the a-
wave
amplitude with intravitreal MSC-EVs vs PBS control, and significant
improvement of recovery
of the b-wave amplitude with intravitreal MSC-EVs compared to PBS and MSC-EV-
depleted
medium controls.
[0268] The significant improvement of the a- and b-waves is also evident in
the
representative ERG stimulus-intensity traces shown in Figure 48. To evaluate
if the MSC-
EV functionality was related to its anti-apoptotic effects, fluorescent TUNEL
was quantitated
on retinal cryosections (Figures 49 and 50). MSC-EV injection 24 h after
ischemia
significantly reduced TUNEL in the inner and outer nuclear layers and in the
retinal ganglion
-60-
CA 03106818 2021-01-15
WO 2020/023251
PCT/US2019/042096
cell layers. There was an increase in TUNEL in the RGC, but not in other cell
layers in MSC-
EV-injected non-ischemic retinae. In whole retinal homogenates, levels of the
inflammatory
mediumtors TNF-cc and IL-6 were significantly reduced upon MSC-EV treatment
following
ischemic injury vs vehicle controls (Figures 51A and 52C). There was also a
significant
reduction in cleaved caspase-3 levels in MSC-EV treated ischemic retina vs
vehicle controls
(Figures 51A and 520). In non-ischemic MSC-EV injected retinae, there was no
significant
change in levels of any of the three proteins, although cleaved caspase 3 was
observed with
EV or PBS treatment under non-ischemic conditions, there was no statistically
significant
increase with respect to PBS control. Taken together, the results in Figures
47-52 indicate
that MSC-EV treatment following retinal ischemia leads to functional
improvement in the
retina via reduction of apoptosis and neuro-inflammation. In addition, the
results indicate,
that with the exception of an increase in TUNEL in the RGC layer, no evidence
of
inflammation or apoptosis triggered by EVs in normal retina was detected by
the
measurement techniques.
MSC-EV uptake and distribution in retina in vivo:
[0269] Having observed the functionally neuroprotective effects of MSC-EVs in
the ischemic
retina, the distribution of the EVs after injection into the vitreous humor
was evaluated.
Figure 53 displays localization of labeled MSC-EVs in the vitreous humor and
retina. There
was persistent retention of MSC-EVs in vitreous humor up to 4 weeks after
intra-vitreal
injection. Ischemic retina demonstrated increased MSC-EV uptake vs control non-
ischemic
eyes. In addition, large deposits of accumulated MSC-EVs in the control and
ischemic retina
were observed. These results are entirely explainable as fluorescence from the
MSC-EVs,
as previously it has been shown that fluorescein injected into the vitreous
humor is cleared
within 48 h. To test the vitreous humor's capacity as a reservoir for MSC-EVs,
quantitative
binding experiments were performed on assay plates coated with protein isolate
from the
vitreous humor and increasing dose of fluorescently labeled MSC-EVs. Results
presented in
Figure 54 illustrates dose-dependent and saturable binding of MSC-EVs to
vitreous humor
proteins. This result explained the presence of accumulated MSC-EVs in the
vitreous
humor.
[0270] To evaluate if MSC-EVs are preferentially endocytosed by specific
retinal cells in
vivo, retinal flat mounts prepared at different time intervals after
fluorescently labeled MSC-
EV injections were immuno-stained with markers for different retinal cells.
Brn3A was used
as the marker for RGCs and IBA-1 for retinal microglial cells. Flat mounts
(Figures 55 and
56) showed distribution throughout the retina and persistence of MSC-EVs at
one week after
injection (time points later were not evaluated). Figure 57 shows that both
RGCs and
microglia take up MSC-EVs. Moreover, Figures 55-57 qualitatively show greater
microglial
amoeboid, or activated morphology in ischemic, non-MSC-EV treated retinae vs
MSC-EV-
-61-
CA 03106818 2021-01-15
WO 2020/023251
PCT/US2019/042096
treated retinae, suggesting reduced microglial activation in ischemia in the
presence of
MSC-EVs.
[0271] Figure 58 contains 100x confocal microscopic images of retinal flat
mounts from
non-ischemic (upper panels) and ischemic retinae (lower panels) respectively
from retinal
tissues harvested 24 h after administration of MSC-EVs, that corresponds to 48
h after
ischemia. MSC-EVs are present in retinal neurons, as indicated by presence of
MSC-EVs in
cells labeled with specific neuronal marker 8-tubulin Ill (Figure 58E) as well
as in axonal or
dendritic projections (arrows in Figure 58E) and in Brn3a-positve cells
(Figure 58F)
indicating that the MSC-EVs are endocytosed by the retinal neurons and by
RGCs.
[0272] This study presents new data on the neuroprotective effects of MSC
derived EVs in
the retina that are relevant to treatment of ischemia-related retinal
degeneration, as well as
to the treatment of neuronal injuries in general. The vesicular populations
were referred to as
MSC-EVs. Although the definition of exosomes is evolving, a modal size of 93
nm along with
the expression of exosome specific markers indicate that the population is
predominantly
exosomes as defined by Kowal et al. These studies using MSC-EVs depict a
consistent
progression from stem cell-based therapy to cell-free therapy for retinal
tissue
neuroprotection and regeneration and regenerative medicine in general. As cell-
free
therapy, MSC-EVs offer a safe, biomimetic alternative with lower oncogenic and
immunological risks and greater target specificity. To date, only a small
number of studies
have examined EV therapy in the retina, one demonstrating therapeutic effect
in an optic
crush model and the other in a glaucoma model, both in rats. However, no prior
studies have
examined the mechanisms of uptake of EVs in retina, their vitreous humor and
cellular
distribution, nor effects upon ischemic insult.
[0273] These results indicate that EVs are endocytosed by retinal R28 cells in
a dose-
dependent, saturable, and temperature-dependent manner, suggesting the
involvement of a
receptor-mediated endocytic mechanism. Published studies show that EVs from
different
sources undergo endocytosis via different mechanisms owing to a change in the
composition of the EV membrane. The clathrin and caveolar pathways,
phagocytosis, and
macro-pinocytosis have all been implicated in endocytosis of EVs. These
results indicated
that MSC-EVs are endocytosed by R28 retinal cells via the caveolar endocytic
pathway
mediated by cell surface HSPG receptors. Quantitative studies showed that MSC-
EV
endocytosis by R28 cells was dose-dependently blocked by disrupting the cell
membrane
cholesterol or by competitively blocking HSPG binding sites on the EVs with
heparin.
Furthermore, confocal microscopy revealed that membrane bound and endocytosed
EVs co-
localize with caveolin-1, further confirming the role of the caveolar
endocytic process.
Considering that the caveolar pathway routes its cargo away from lysosomal
degradation
-62-
CA 03106818 2021-01-15
WO 2020/023251
PCT/US2019/042096
and considering the functional activity of the endocytosed EVs, it is possible
that for the EVs
to be functionally active, this mode of endocytosis is ideal.
[0274] These mechanistic studies highlight the potential of MSC-EVs as
biomimetic agents
for treatment of neurodegenerative diseases and nerve injuries in general.
From a
therapeutic perspective, the effectiveness of MSC-EVs is dependent on the
efficiency of
endocytosis by target cells. Improved endocytic efficiency can promote greater
target-
specificity at the site and reduce ectopic effects. Therefore, the results
outlining the
endocytic mechanism open up avenues for future studies that can be aimed at
engineering
EVs for enhanced delivery by targeting these endocytic pathways. In addition,
they can also
serve as quality control points for function-specific engineered exosomes to
ensure that
intrinsic endocytic processes are not altered upon generation of engineered
EVs. However,
the R28 cell line is an immortalized retinal cell line that displays both
neuronal and glial cell
properties. While the ability of these cells to proliferate enables
measurement of a critical cell
function, further studies using primary retinal cells can be required to
confirm the endocytic
mechanism identified here.
[0275] In the in vitro OGD model, results indicated a dose response effect of
MSC-EVs and
saturation that corroborates well with the endocytosis data. Furthermore,
cytotoxicity studies
using quantitation of proliferative cells via flow cytometry revealed that MSC-
EVs rescue the
R28 cells from OGD insult. Taken together, these studies showed that MSC-EVs
have the
potential to promote the survival and proliferation of retinal neurons that
have been
subjected to ischemia-type stress in vitro. These results encouraged the
evaluation of MSC-
EVs post ischemic insult in vivo in a rodent model.
[0276] The onset of retinal ischemic injury in vivo is manifested as neuronal
cell death,
apoptosis, and neuroinflammation resulting in RGC loss, blood-retinal barrier
permeability,
and neurodegeneration. Therapeutic effects of MSC derived EVs are reported in
a wide
range of inflammatory diseases including, but not limited to ischemia-
reperfusion injury in
brain, heart, kidney as well as in neurodegenerative diseases. The results
demonstrate that
MSC-EVs render their neuro-protective effect by decreasing neuroinflammation
and
neuronal apoptosis. These results provide an insight into the mechanism behind
MSC-EV
action in the retina under ischemic injury and serve as a foundational
knowledge that can be
used to generate engineered EVs with function-specific miRNA cargo with anti-
inflammatory
and anti-apoptotic properties.
[0277] Prior to the current study, the uptake, retention, turnover and
prolonged effect of EVs
in the retina have been addressed in only a limited manner. The role of the
vitreous humor in
EV retention and the subsequent endocytosis by different cells of the retina
has remained
unexplored. A few recent studies injected EVs in single dose, weekly, and
monthly in a
model of glaucoma, and reported enhanced protection with multiple
administration, while
-63-
CA 03106818 2021-01-15
WO 2020/023251
PCT/US2019/042096
another group reported high dose, single injection EV (15 X 109 particles/ml)
induced
protection in experimental autoimmune uveitis. Dose dependence and toxicity
studies using
MSC EVs with retinal or neuronal cells under normal and ischemic conditions
have not been
performed. The results using concentrated EV injections in an in vivo model
did not cause
any deleterious effect in the ERG functional studies, nor increased
inflammatory mediators.
Additionally, the in vitro and in vivo results indicate a mild level of
toxicity of MSC EVs under
normoxic conditions albeit being statistically insignificant. However, there
was no
corresponding increase in the inflammatory markers or increase in cleaved
caspase 3 in
retinal homogenates in the normal non-ischemic retinae. Further studies will
be required to
evaluate if there is any functional effect of EVs specifically on the retinal
ganglion and
amacrine cells in the RGC layer.
[0278] Multiple dosing or higher doses are not required if EVs can traverse
the vitreous and
reach target cells in the inner retina after administration. Greater
quantities of MSC-EVs
were observed in ischemic compared to non-ischemic retinae. Additionally, they
were more
concentrated in RGCs and in microglial cells. This increase in the uptake of
EVs by ischemic
cells is potentially advantageous, but the mechanism of this effect requires
further
investigation. Preferential uptake by cells in ischemic neuronal and glial has
potentially
important implications in therapeutic development of EVs as biomimetic agents
for treatment
of nerve injuries and neuro degenerative diseases. Likewise, a surprising
result was that
while EVs robustly attenuated TUNEL throughout the retina and decreased
cleaved caspase
3 presence indicating a decrease in apoptosis, the labeled EVs were not found
deeper than
the retinal ganglion cell layer at the time of peak apoptosis (48 h after
ischemia). This
suggests that the EV effects on apoptosis are either due to altered retinal
cell-to-cell
signaling, e.g., via Muller glial cells that traverse most of the retina, or
are due to release of
EV induced anti-apoptotic factors from the cells that have endocytosed them.
It is also
possible that with more time, the MSC-EVs penetrate more deeply into the
retina, and further
studies will be required to test this hypothesis.
[0279] We showed specific uptake of MSC-EVs in vivo by RGCs and microglia, as
well as
by retinal neurons. The targeting of RGCs by the EVs supports development of
EVs and
engineered EVs for the treatment of glaucoma and other diseases of optic nerve
that result
in degeneration of RGCs. These studies can also serve as a prelude to neuro-
targeted EV
therapy for treatment of specific nerve cells. It is interesting that MSC-EVs
were present in
axonal or dendritic projections from RGCs and retinal neurons. Further studies
are
necessary to determine if the MSC-EVs are transported along the axons, as this
can enable
novel access to the optic nerve via retrograde transport. Microglial
activation was not
quantitated in this study but decreased amoeboid formation after ischemia in
MSC-EV-
injected eyes suggests another potential target for MSC-EV-therapy. Microglial
activation in
-64-
CA 03106818 2021-01-15
WO 2020/023251
PCT/US2019/042096
the retina can be a pathogenic factor in various diseases including diabetic
retinopathy,
glaucoma, and age-related macular degeneration, thus MSC-EVs targeting
microglia could
be a novel treatment modality.
[0280] This study indicates that intravitreal injection produced uptake of MSC-
EVs uniformly
in the retina (as seen in the distribution on flat mounting). The MSC-EVs
remained in the
vitreous humor for up to 4 weeks after injection and quantitative binding
experiments to
vitreous humor-derived proteins suggest that the effect is due to binding to
vitreous humor
proteins in a dose-dependent and saturable manner. As a result, the vitreous
humor serves
as a reservoir for release of EVs into the retina and this property could be
used
advantageously to prolong EVs effects and minimize the number of injections
necessary to
produce long-term effects.
[0281] One of the significant challenges associated with the use of EVs for
therapeutic
purposes is the ability to deliver them site specifically to relevant tissues.
From this
perspective, the identification of EV binding kinetics to vitreous proteins is
valuable data for
the biomaterials community. Future studies aimed at identifying peptide
sequences present
in vitreous collagens can be used to generate engineered biomimetic matrices
used to
deliver EVs and possibly promote controlled release of EVs to aid repair and
regeneration of
not just neuronal tissues, but other tissues as well.
[0282] MSC-EVs are endocytosed by retinal cells in a receptor-mediated, dose-
dependent
and saturable manner. The endocytosed EVs can protect retinal cells from cell
death in
simulated ischemic conditions in vitro and in retinal ischemia in vivo. The
findings on the
involvement of HSPGs on the target cell surface in EV endocytosis and the
binding of EVs to
the vitreous serve as a basis for development of engineered EVs targeting
these
mechanisms for enhanced delivery and/or functionality. Furthermore, if these
results can be
extrapolated to other neuronal systems a common modality and a pathway for
biomaterial
based site-directed EV therapy can be established.
Example 5: miRNA reading in various engineered exosome populations
[0283] The raw reads of RNA-seq were mapped to miRNA reference genome GENCODE
hg38 (only containing the miRNA sequences from GENCODE hg38). Several mapping
software and different parameter settings were compared: the bowtie2 was
determined to
have provided the best mapping result. The identified miRNAs were
differentially
represented in exosomes, depending on how their parent cells were engineered
(Figure 59).
In each sample, the number of reads for each miRNA were normalized by the
library size
(number of the total reads in the library). The top candidates, i.e. those
with normalized
reads above 100 in at least one exosome population, are shown in Figure 60.
-65-
CA 03106818 2021-01-15
WO 2020/023251
PCT/US2019/042096
[0284] Because there were reads that could not be mapped to the miRNA
reference
genome, the conclusion was reached that the sample contains a large amount of
non-
miRNA sequences, which could be pi RNA or other long non-coding RNA.
Example 6: Preparation of Hydrogel Exosome Composition
[0285] Methacrylic alginate with RGD/DGEA/GFPGER peptide modification was
prepared
as illustrated in Figures 61 and 62. In short, first native alginate powder
(3g) was dissolved
in 300 mL of MES buffer (0.1 M MES, 0.3 M NaCI, pH 6.5) at 1% w/v. The
solution was
stirred until alginate was fully dissolved. Then, 1-ethyl-3-(3-
dimethylaminopropyl)carbodiimide (150 mg; EDC) and N-hydroxysulfosuccinimide
(84 mg;
sulfo-NHS) were added into the solution, and the solution was stirred for 15
minutes. Then,
the peptide powder (22.14 mg of GGGGRGDY (SEQ ID NO:9) or 23.46 mg GGGGDGEAY
(SEQ ID NO:10) or GFPGER (SEQ ID NO:11)) to yield a 10 pmole/g alginate
concentration
and the solution was gently stirred for another 24 hours at room temperature.
The solution
was dialyzed against distilled H20 for 7 days and lyophilized until dried.
FIGURE
[0286] Next, the lyophilized peptide-conjugated alginate was dissolved in
water at 2.5% w/v,
and this solution was treated with 120 mL of methacrylic anhydride. The
solution was
adjusted and maintained at pH at 7 to 8 for 72 hours using 10 N NaOH solution.
The
solution was stirred for an additional 1-2 days until it solidified, and then
water and 6 N HCI
were added to dissolve the solid. The dissolved solution was poured into 600
mL of 100%
alcohol, and the alginate precipitated. The precipitate was then dissolved in
120 mL of
water, centrifuged, and washed again as needed. The methacrylate- and peptide-
conjugated alginate was left to air dry.
[0287] Finally, 1-8 wt% of methacrylate- and peptide-conjugated alginate was
mixed with
exosome suspension (1x10⁶-1x10¹² exosomes of the disclosure) and polymerized
by
exposure to UV light to obtain hydrogel comprising the exosomes of the
disclosure.
[0288] Schematics of this process are shown in Figures 61 and 62.
Example 7: Evaluation of Hydrogel Exosome Composition
[0289] Exosome binding peptides that are representative derivatives of type I
collagen and
fibronectin were coated onto 96 well plates and the dose-depending binding of
fluorescently
labeled MSC exosomes to these peptides was evaluated (Figure 63). Results
indicate that
MSC exosomes can bind to these peptides and that such ECM binding derivative
peptides
may be used as carriers for exosomes. Consequently, the release profile of the
bound
exosomes was also evaluated over (Figure 64). The ability of MSC exosomes to
be bound
to hydrogels containing these binding peptides and delivered was evaluated in
vitro by
encapsulating the exosomes in alginate hydrogels with and without the binding
peptides at 2
and 4% w/v alginate concentrations. Here RGD peptide was used as a proof-of-
principle
-66-
CA 03106818 2021-01-15
WO 2020/023251
PCT/US2019/042096
example. The results of these studies are presented in Figures 65 and 66.
Overall, the
results indicate that MSC exosomes are released from the hydrogels within a
few hours if
there is no tethering peptide (RGD here). On the other hand, in the presence
of the
tethering peptide, the release was slower. Note the increased retention of
exosomes with
RGD. To test if the encapsulated exosomes were endocytosed by colonizing
cells, naïve
MSCs were seeded on to alginate RGD hydrogels loaded with exosomes (stained).
Nuclei
(blue) and exosomes (green) were stained and imaged (Figures 67, 68, 69).
Similar loading
was also tested 3 days after post cell seeding. Exosomes (green) and actin
(red) were
stained and imaged (Figures 70 and 71). Results indicated that the bound and
encapsulated exosomes were endocytosed by the colonizing cells indicating that
the
exosomes maintained their ability to be taken up by cells even after 3D
encapsulation using
the tethering peptides.
[0290] In one example, the hydrogels comprising the exosomes of the disclosure
were
formed using a 3D printing technique. These printed compositions were
evaluated for
exosome release kinetics, and the results are shown in Figure 72.
Example 8: In vitro experiments
[0291] To test if the functionality of the exosomes are retained after
encapsulation and
release, Hydrogels containing BMP2 exosomes were tested via both a contactless
(Figure
73) and contact (Figure 74) model. BMP2 exosomes were used here as there is
extensive
data on their ability to induce osteogenic differentiation in naïve stem cells
in vitro and in vivo
(figures 75 and 76). Expression of various osteogenesis factors was tested.
The experiment
was designed to test the functional efficiency of the encapsulated and the
released
exosomes from the hydrogels. The results show that both the encapsulated and
the
released exosomes were endocytosed by cells and that the exosomes caused the
intended
change in the cells that took them up.
Example 9: In vivo experiments
[0292] To evaluate the ability of engineered exosomes to regenerate tissues,
BMP2
exosomes were tested on rats with calvarial defects: one on the right, and one
on the left.
Controls with no treatment and with non-engineered exosomes were used. Here,
collagen
sponges were used as exosome carriers. Bone regeneration was evaluated by
1.1CT 4
weeks, 8 weeks, and 12 weeks. The most significant regeneration results were
seen with the
BMP2 exosomes. For a positive control, BMP2 growth factor was used. Results
are shown
in Figure 75.
[0293] To evaluate if binding peptide carrying hydrogels can be used to
deliver exosomes,
Alginate RGD hydrogels and control alginate hydrogels containing BMP2 exosomes
were
tested on rats with calvarial defects similar to the experiment described
above. Hydrogels
-67-
CA 03106818 2021-01-15
WO 2020/023251
PCT/US2019/042096
with and without RGD were tested, with hydrogels without exosomes used as
controls.
Results were assayed at 4 weeks and at 8 weeks post implantation by 1.1CT.
Results are
shown in Figure 76. The most significant regeneration results were seen in the
alginate-
RGD samples containing the BMP2 exosome indicating that engineered exosomes
can be
delivered using hydrogels that incorporate ECM derivative peptides as exosome
carriers.
Example 10: Engineering Functionally Enhanced MSC EVs for Regenerative
Medicine
[0294] Mesenchymal stem cells (MSCs) are multipotent cells with regenerative
and
immunomodulatory properties. Several aspects of MSC function have been
attributed to the
paracrine effects of MSC derived extracellular vesicles (EVs). Recent studies
suggest that
the composition of MSC EVs is altered by the differentiation state of MSCs.
However, the
ability to control MSC EV functionality for tissue-specific regeneration has
been elusive. The
primary goal of this study is to evaluate the applicability of functionally
enhanced MSC EVs
for regenerative medicine. To achieve this, bone regeneration has been
utilized as a proof-
of-concept approach. This study elucidates that altering the MSC state by
inducing
differentiation into multiple lineages does not affect the endocytic property
of the resulting
EVs, but upon endocytosis, the EVs trigger the expression of lineage-specific
genes and
proteins in naïve MSCs in vitro and in vivo. Therefore, lineage-specific MSC
EVs induced
cell-type specific changes in target MSCs. To exploit this property for the
generation of MSC
EVs with consistent properties, genetically modified MSCs were generated by
constitutively
expressing BMP2 to generate EVs with osteoinductive properties. These EVs
maintained
the size distribution and endocytic characteristics of MSC EVs and showed
enhanced bone
regenerative potential compared to controls. Mechanistic studies revealed that
the
functionally enhanced EVs potentiate the BMP2 signaling cascade by delivering
miRNA that
suppress the negative regulators of BMP2 signaling. The results presented here
collectively
indicate that EVs may be engineered by genetic modification of the parental
MSCs to induce
lineage-specific differentiation and tissue regeneration in vivo. These
effects seem to be
primarily mediated via targeted pathway-specific changes to their miRNA cargo.
[0295] Mesenchymal stem cells (MSCs) are multipotent somatic stem cells that
can be
isolated from a variety of tissues such as the bone marrow, adipose tissue and
dental pulp.
The regenerative, protective and anti-inflammatory properties of MSCs
especially bone
marrow derived MSCs are well documented and make MSCs attractive cells for
regenerative
therapies. As of 2016, about 493 clinical trials that used MSCs were reported
in the NIH
clinical trials database. However, issues such as donor dependent variability,
cellular
viability, poor attachment and aberrant differentiation have posed significant
hurdles for the
use of MSCs in clinical treatment.
-68-
CA 03106818 2021-01-15
WO 2020/023251
PCT/US2019/042096
[0296] Many existing tissue-engineering approaches focus on delivery of
selected proteins
(growth factors, transcription factors etc.) or nucleic acids to host or
implanted stem cells to
achieve lineage specific differentiation. A variety of techniques ranging from
exogenous
addition of growth factors and controlled release devices to utilization of
engineered
biological and synthetic nano vesicles such as liposomes and polymeric vesicle
have been
investigated to deliver morphogens. Although the single morphogen system shows
initial
promise, when applied clinically, issues such as dosage, specificity, ectopic
effects, toxicity,
and immunological complications have posed significant restrictions to
clinical efficiency as
well as translational potential. Therefore, a sophisticated system that is
biomimetic in nature
provides necessary cues in physiologically relevant amounts and avoids the
limitations of the
single morphogen system is required. EVs/exosomes can satisfy these criteria.
[0297] EVs are nano vesicles (40-150nm) secreted by cells to facilitate
intracellular
communication. As these vesicles pinch off the plasma membrane of cells, their
lipid bilayer
membrane is representative of the parental cell's plasma membrane. Within the
EV, RNA
(both mRNA and miRNA), cytosolic proteins as well as transmembrane proteins
are present.
These nano packets of information are endocytosed by effector cells to trigger
a cellular
response designated by the parental cell to the target cell. Although
originally believed to be
mediators of cellular homeostasis by secreting cellular waste, the past decade
study of EVs
demonstrate their specific roles in modulating cellular function in
immunology, cancer biology
and regenerative medicine.
[0298] Recent evidence suggests that several of the beneficial effects of MSC
therapy can
be attributed to paracrine effects of the MSC secretome. More specifically,
MSC derived
EVs have been implicated as the principal active agents of the MSC secretome.
A recent
study highlighted that MSC-derived EVs possess better anti-inflammatory
properties
compared to MSC derived microparticles. Recent studies have shown that bone
marrow
and dental pulp MSC derived EVs can be used to induce osteogenic and
odontogenic
differentiation of naïve MSCs respectively. Additionally, a recent study
indicates that MSC
EV function supersedes the extracellular matrix (ECM) derived signals
indicating the potent
nature of EV signaling. These and many other studies implicate MSC derived EVs
as
effective tools in clinical efforts to control inflammation and regenerative
therapy and in the
treatment of disease.
[0299] The paracrine aspect of MSC function involves the directed uptake of
MSC derived
EVs by target cells. Further, the multilineage differentiation potential of
MSCs suggests that
lineage specific function could be reflected as lineage specific exosomal
effects on naïve
target cells. Harnessing the fundamental mechanistic features of EV-mediated
signaling can
be turned into an application-specific tool to direct lineage specific tissue
repair/regeneration
and disease treatment. With these goals in mind, this study characterized
basic mechanistic
-69-
CA 03106818 2021-01-15
WO 2020/023251
PCT/US2019/042096
aspects of MSC EV function and applies it to generate engineered lineage-
specific MSC EVs
that are able to modulate tissue repair and regeneration using bone as a model
system.
Materials and Methods
[0300] Cell Culture:Human bone marrow derived primary MSCs (HMSCs) were
purchased
from ATCC and Lonza. These cells were cultured in aMEM (Gibco) containing 20%
fetal
bovine serum (FBS, Gibco), 1% L-Glutamine (Gibco) and 1% antibiotic-
antimycotic solution
(Gibco). For induction of differentiation of HMSCs into osteogenic,
chondrogenic and
adipogenic lineages, the growth medium was supplemented with growth factors
and
differentiating agents. Osteogenic differentiation was induced by culturing
the cells in aMEM
growth medium containing 100pg/m1 ascorbic acid (Sigma), 10mM p-
glycerophosphate
(Sigma), and 10mM dexamethasone (Sigma) for 4 weeks. Chondrogenic
differentiation was
induced by culturing the cells in aMEM basal medium containing 1 M
dexamethasone,
504/m1 ascorbate-2-phosphate (Sigma), 1%ITS premix (BD Biosciences), 1%F6S and
lOng/m1 TGFI31growth factor (Sigma) for 4 weeks. Adipogenic differentiation
was induced by
culturing the cells in growth medium containing 10pg/m1 insulin (Sigma), 500 M
isobuty1-1-
methylxanthine (Sigma), 100pM indomethacin (Sigma) and 1pM dexamethasone for 4
weeks.
[0301] EV isolation and characterization: EVs were isolated from the culture
medium as per
standardized protocols. HMSCs were washed in serum free medium and cultured
under
serum free condition for 24 hours. If they were subjected to supplementation
for altering cell
state, the supplementation was maintained with only FBS being removed. The
culture
medium was harvested, cleaned of cell debris by centrifugation (1000xg) and
EVs were
isolated using the ExoQuick TC isolation reagent (System Biosciences) as per
the
manufacturer's recommended protocols. To maintain consistency, the isolated
EVs were
resuspended in PBS such that each 100 1 of EV suspension contained EVs from
approximately 1x10⁶ HMSCs. This equated to a stock concentration of 10,000
particles/1A as
determined by nanoparticle tracking analysis (NTA).
[0302] The isolated EVs were characterized for number and size distribution
and presence
of membrane markers by NTA, immunoblotting and transmission electron
microscopy (TEM)
as per established standards. For NTA, a 1/100 dilution of the EV suspension
was analyzed
in the Nanosight NS-300 instrument to obtain the size distribution plot. For
quantitative
experiments, the EV concentration (particles/nil) was also measured by NTA and
equal
number of EVs were used for each experiment.
[0303] For immunoblotting, exosomal proteins were isolated in RIPA buffer and
10-204 of
EV protein isolate was resolved by SDS-PAGE, transferred onto nitrocellulose
membranes
and probed with primary rabbit anti-CD63 (1/500, Abcam) and mouse anti-CD9
(1/500,
-70-
CA 03106818 2021-01-15
WO 2020/023251
PCT/US2019/042096
Abcam), mouse anti BMP2 (1/500, Abcam) antibodies and near infrared dye
conjugated
secondary antibodies (1/10,000 Licor). The blots were then dried and imaged
using a Licor
Odyssey imager. For immunoblotting of the conditioned medium, the medium from
which
EVs were isolated was dialyzed against deionized water, lyophilized and
reconstituted in lx
lameli buffer. SDS PAGE and immunoblotting were performed.
[0304] For transmission electron microscopy (TEM), 10 1 of 1/10 dilutions of
the EV
suspensions were placed on to carbon fomvar coated nickel TEM grids and
incubated for 1
hour followed by fixing with 10% formalin, washing with double deionized water
and air
drying. For immunogold labeling of CD63, the EV containing grids were blocked
in PBS with
5% BSA, incubated with CD63 antibody (1/100, Abcam) followed by washing and
incubation
with lOnm gold tagged secondary antibody (1/1000, Abcam). The grids were then
washed
and air-dried. All the grids were imaged using a Joel JEM3010 TEM.
Quantitative and qualitative endocytosis of MSC EVs:
[0305] For endocytosis experiments, MSC EVs were fluorescently labeled using
the
ExoGlow green labeling kit (System Biosciences) that labels the exosomal
proteins
fluorescently. The EVs were resuspended in PBS with 100 I corresponding to EVs
from 1
million MSCs.
[0306] For quantitative experiments HMSC cells were plated on to 96 well
tissue culture
plates at a concentration of 10,000 cells per well and incubated for 18 hours
to facilitate cell
attachment. The cells were then incubated with increasing amounts of
fluorescently labeled
HMSC EVs for 2 hours at 37 C. The cells were washed with PBS and fixed in
neutral
buffered 4% paraformaldehyde. The fluorescence from the endocytosed EVs was
measured
using a BioTek 5ynergy2 96 well plate reader equipped with the appropriate
filter sets to
measure green fluorescence. The results were plotted as mean (+/-SD)
normalized
fluorescence intensities (normalized to background and no EV fluorescence) as
a function of
dosage (n=6 per group).
[0307] For quantitative endocytosis blocking experiments, the cells were
plated in 96 well
plates or in 12 well culture plates (50,000 cells/well) and prior to EV
treatment, were pre-
treated with the blocking agents for 1 hour. Cell surface integrins were
blocked with 2mM
RGD polypeptide (Sigma). Membrane cholesterol was depleted using methyl f3
cyclodextrin
(MBCD, Sigma) in a dose dependent manner (0-10mM). In addition to this
treatment, the
labeled EVs were pretreated for 1 hour with indicated concentrations of
heparin (0-104/ml,
Sigma) to block the heparin sulfate proteoglycan binding sites on the exosomal
membrane.
For the qualitative and quantitative experiments, the fluorescently labelled
exosomal volume
was maintained at 2x saturation volume (determined from the saturation curve.
The stock
concentration of EV was 10,000 particles/u1) to ensure that saturable levels
of HMSC EVs
-71-
CA 03106818 2021-01-15
WO 2020/023251
PCT/US2019/042096
are used in the assay. Treatment with the EV suspension was carried out and
the
fluorescence measurement and quantitation and statistical analysis was
performed as per
published protocols.
[0308] For qualitative endocytosis experiments, 50,000 cells (HMSCs) were
plated on
coverslips placed in 12 well tissue culture dishes. Fluorescently labeled EVs
at 2x saturation
volume were then added with/without inhibitors as described above and
incubated for 2
hours in the presence/absence of blocking agents as described above. The cells
were then
washed, fixed in 4% neutral buffered paraformaldehyde, permeablized and
counter stained
using mouse monoclonal anti tubulin antibody (1/2000, Sigma), rabbit
polyclonal anti
caveolin1 antibody (1/100, Santacruz Biotechnology) or rabbit polyclonal anti
clathrin
antibody (1/100, Santacruz Biotechnology) followed by treatment with TRITC
labeled anti
mouse/rabbit secondary antibody. The coverslips were then mounted using
mounting
medium containing DAPI (Vector Labs) to label the nuclei and imaged using a
Zeiss LSM
710 Meta confocal microscope.
[0309] EV mediated HMSC differentiation: HMSCs were differentiated as
described under
the cell culture methods section and EVs from the differentiated HMSCs were
isolated as
described under the isolation section. The isolated EVs were characterized for
size and the
presence of exosomal markers as described under the characterization section.
For in vitro
differentiation experiments, naïve HMSCs (250,000 cells per 1cmx1cm hydrogel)
were
embedded in type I collagen hydrogels in quadruplicates. Clinical grade
collagen sponges
(Zimmer collagen tape) were used as the hydrogel of choice. 2x saturation
volume of the
different EVs (osteogenic, chondrogenic and adipogenic) were then added to the
cells and
incubated for 72 hours. The saturation volume was determined by the
quantitative dose
dependence endocytosis experiment described in the previous section. The
saturation was
reached at 20111 of standardized EV suspension per 10,000 HMSCs. NTA was used
to
measure the amount of EVs and this amounted an average of 10,000 EV
particles/u1 of
standardized EV suspension from HMSCs. 1x10⁸ EV particles were used per group
in this
experiment. Untreated cells received PBS treatment of equal volume. Post 72
hours, RNA
was isolated from the embedded HMSCs followed by cDNA synthesis and qPCR for
selected marker genes for osteogenic, chondrogenic and adipogenic
differentiation as
published protocols and primer sequences.
Generation of BMP2 overexpressing HMSCs and their EVs:
[0310] Lentiviral particles containing a mammalian dual promoter vector that
encodes the
BMP2 gene under the control of EF10c promoter and a GFP marker under the
control of
5V40 promoter or control vector without the BMP2 gene was obtained from
Applied
Biological Materials (ABM). HMSCs were transfected with the lentiviral
particles as per the
-72-
CA 03106818 2021-01-15
WO 2020/023251
PCT/US2019/042096
manufacturer's instructions and stably selected using puromycin. EVs were
isolated and
characterized from these overexpressing and control cells and the ability of
these EVs to
induce HMSC differentiation was evaluated.
[0311] SMAD 1/5 specific reporter assay: 30,000 HMSCs cultured in 24 well
tissue culture
plates were transfected in quadruplicates with control or SMAD 1/5 specific
luciferase
reporter plasmid (SBE12(31)) using lipofectamine transfection reagent. 48
hours post
transfection, the cells were treated with the control or experimental reagents
in
quadruplicates. The EVs were added at 2x saturation dosage. This amounted to
6x10⁶ EVs
for every 30,000 HMSCs. 48 hours post transfection, total protein was
extracted from the
cells, concentration determined and the luciferase activity from equal amounts
of protein for
each sample from each group was measured (reporter kit Promega) and normalized
to
control activity. The data is represented as mean % increase in luciferase
activity (+/- SD,
n=4) w.r.t untreated cells expressing the SMAD1/5 reporter and statistical
significance was
calculated using student's t-test.
[0312] Quantitative miRNA expression in EVs: qRT PCR was used to evaluate the
expression level of miRNAs in the exosomes. The miRNA was isolated from equal
numbers
of control and BMP2 EVs using the Qiagen miRNA isolation kit as per the
manufacturer's
protocol. cDNA synthesis was performed using the miScript ll kit (Qiagen) and
qRT PCR
was performed using the SYBR greet PCR kit (Qiagen) using custom primers for
the
selected miRNA (Figure 77). As there is no defined housekeeping miRNA for EVs,
direct
quantitation was performed by utilizing exact amounts of small RNA from equal
numbers of
EVs for all groups for cDNA synthesis followed by quantitation of the cDNA
amounts and
double standardization to obtain the fold change in expression levels. The
data is
represented as mean fold change (n=4). Statistical significance was calculated
between the
control and BMP2 EV samples using student's t-test.
[0313] Mouse subcutaneous implantation experiments: All in vivo
experimentation was
performed in either immunocompromised mice (Charles River Labs, 1-month old
mice) or
Sprague Dawley rats (250-300g, Charles River Labs) as per protocols and
procedures
approved by the University of Illinois animal care committee (ACC). All
animals were
housed in appropriate cages in temperature and humidity-controlled facilities.
Food and
water were made available at libitum.
[0314] The ability of EVs from differentiated HMSCs to induce lineage specific
differentiation
of naïve HMSCs was evaluated in vivo in an immunocompromised mouse
subcutaneous
implantation model. 1x10⁶ HMSCs were seeded on to a 1cm x 1cm square of
clinical grade
collagen tape (Zimmer) with 2x saturation volume (approximately 4x10⁸ EVs) of
respective
control (naïve HMSC EV) or experimental EV (osteogenic, chondrogenic or
adipogenic)
suspension and implanted within the subcutaneous pocket bilaterally on the
back of
-73-
CA 03106818 2021-01-15
WO 2020/023251
PCT/US2019/042096
immunocompromised mice. The mice were anesthetized by intraperitoneal
injection of
Ketamine (80-100mg/kg)/Xylazine (10mg/kg). A 1.5cm incision was made on the
back along
the midline and the control or experimental scaffolds were placed bilaterally
within the
subcutaneous pocket. All experiments were performed in quadruplicate. 4 weeks
post
implantation, the animals were sacrificed by carbon dioxide asphyxiation
followed by cervical
dislocation. The scaffolds were extracted, fixed in neutral buffered 4%
paraformaldehyde,
embedded in paraffin and sectioned in to 5m sections. The sections were then
immunostained fluorescently for marker proteins, mounted and imaged using a
Zeiss LSM
710 laser scanning confocal microscope. All primary antibodies were purchased
from
Abcam and were used at a dilution of 1/100 of the stock solution. The
secondary anti-mouse
FITC and anti-Rabbit TRITC were obtained from Sigma and were used at a
dilution of 1/200.
[0315] Rat calvarial bone defect model: To evaluate the ability of HMSC
derived EVs to
regenerate bone, a rat calvarial defect model was used. All groups and time
points
contained 6 repeats. Briefly, the rats were anesthetized intraperitoneally
using Ketamine
(80-100mg/kg)/Xylazine (10mg/kg). Using aseptic technique, a vertical incision
was made in
the head at the midline to expose the calvarial bone. The connective tissue
was removed
and two 5mm calvarial defects were created bilaterally in the calvarium
without dura
perforation using a trephine burr. A clinical grade collagen tape (Zimmer) was
placed on the
wound with or without control or experimental EVs. The amount of EVs used was
5x10⁸ EVs
per defect. Collagen tape alone served as control and rhBMP2 (504/wound,
Medtronic)
containing scaffolds served as positive control. Four, 8- and 12-weeks post-
surgery, the rats
were sacrificed by carbon dioxide asphyxiation followed by cervical
dislocation. The calvaria
were harvested, fixed in neutral buffered 4% paraformaldehyde and subjected to
3D 1..iCT
analysis using a 5canc040 1..iCT scanner. The data obtained from the 1..iCT
scanner was
quantitatively analyzed using a custom built Matlab Program. The samples were
then
decalcified in 10% EDTA solution, embedded in paraffin, sectioned into 10um
sections and
subjected to histology.
Results
Characterization of EVs:
[0316] EVs isolated from HMSCs were characterized for size, shape and presence
of
exosomal marker proteins. NTA analysis indicated that the isolated vesicles
show a particle
size distribution consistent for EVs (Figure 78A). On average, after the
standardized EV
dilution (100u1 suspension containing EVs from 1x10⁸ cells), the EV
concentration for
HMSCs used was determined to be approximately 1x10⁸ particles/ml of the EV
suspension.
Electron microscopy analysis revealed spherical vesicles between 100-150nm in
size.
Osteogenic, chondrogenic and adipogenic differentiation of HMSCs yielded EVs
that shared
-74-
CA 03106818 2021-01-15
WO 2020/023251
PCT/US2019/042096
similar vesicle size distribution (Figure 78A). The TEM morphology and size
also remained
consistent between undifferentiated and differentiated HMSC derived EVs
(Figure 78B).
Immunoblot analysis indicated the presence of exosomal marker proteins CD63
(Figure
78C) and CD9 (Figure 780) in both naïve and differentiated HMSC EVs. Taken
together,
these results indicate that the extracellular vesicles isolated from HMSCs
here, conform to
accepted properties of EVs and that these physical characteristics remain
unchanged
irrespective of the differentiation state of the source HMSCs.
Endocytosis of HMSC derived EVs:
a) Different cell types show similar endocytosis of HMSC EVs:
[0317] EVs from different cell types have been shown to be endocytosed by a
variety of
mechanisms. The endocytic mechanism of HMSC EVs by target HMSCs was evaluated.
HMSC EV endocytosis by MSCs was a dose dependent and saturable process (Figure
79A). Pretreatment of the EVs with heparin significantly reduced the
endocytosis (Figure
79B, 79F) suggesting the involvement of membrane surface heparin sulfate
proteoglycan
receptors (HSPGs) in the process of EV endocytosis. Pre-treatment of the
target cells with
2mM RGD peptide to block the cell surface integrins did not completely block
EV
endocytosis (Figure 79G), indicating that integrins are not primary receptors
involved in
HMSC EV endocytosis. When endocytosis experiments were performed after pre-
treatment
with MBCD to disrupt the membrane cholesterol, EV endocytosis was
significantly reduced,
indicating the involvement of the lipid raft/caveolar pathway (Figure 79C).
Further,
colocalization experiments with caveolinl (a marker protein for caveolae) and
clathrin
(marker protein for clathrin coated pits) indicated that the fluorescently
labeled EVs co-
localized with caveolinl (Figure 79H) and not clathrin (Figure 791). Finally,
when
endocytosis experiments were performed at 4 C, EV endocytosis was blocked
indicating the
temperature and thereby, the energy dependency of the process (Figure 79E).
Overall,
these results indicate that MSC EV endocytosis was a dose dependent and energy
dependent process and occurs in a heparin-sensitive manner that is mediated
via the
caveolar endocytic pathway.
b) EVs from differentiated HMSCs are endocytosed by naïve HMSCs:
[0318] Because a common mode of endocytosis occurs across multiple cell types,
a change
in cell state was tested to determine if this variable would affect the
endocytosis of lineage-
specified, HMSC derived EVs. HMSCs were first differentiated along the
osteogenic,
chondrogenic and adipogenic lineages. EVs isolated from these cells were
harvested and
evaluated for dose dependent and saturable endocytosis. Figure 80A shows
representative
confocal images of the different fluorescently labeled EVs by naïve HMSCs.
Further, the
dose-dependent endocytosis of the multi-lineage EVs by naïve HMSCs was similar
without
-75-
CA 03106818 2021-01-15
WO 2020/023251
PCT/US2019/042096
any statistically significant difference irrespective of the HMSC lineage from
which EVs were
isolated (Figure 80B).
EVs from differentiated HMSCs induce lineage specific differentiation of naïve
HMSCs in
vitro and in vivo:
[0319] Undifferentiated HMSCs in 3d cultures were incubated with EVs isolated
from
differentiated HMSCs for 72 hours. Osteogenic, chondrogenic and adipogenic EVs
induced
a significant increase in the expression levels of respective lineage specific
marker genes
with respect to untreated controls (Figure 81). These genes included a mixture
of growth
factors, transcription factors and ECM proteins representative of the
individual lineages. The
genes represented in Figure 81 for each of the three lineages were unique to
that specific
lineage such that they were not significantly affected by other MSC EVs. For
example, the
osteogenic genes represented here did not show a statistically significant
change when
naïve HMSCs were treated with chondrogenic or adipogenic MSC EVs. This result
indicates
the specificity of action.
[0320] To verify these effects in vivo, collagen sponges loaded with
undifferentiated HMSCs
with or without EVs were implanted subcutaneously in the back of
immunocompromised
mice. After 4 weeks, the forming tissue were excised, fixed, embedded and the
sections
were analyzed by fluorescence immunohistochemistry for the expression of
lineage-specific
marker proteins. For all three different EVs, lineage-specific protein
expression was
observed. Figure 82 shows representative confocal images of the sections.
[0321] For osteogenic differentiation the expression levels of phosphorylated
proteins and
dentin matrix protein 1 (DMP1) were analyzed. Phosphorylated proteins were
analyzed by
staining the sections with an antibody that recognizes phosphorylated serine,
threonine and
tyrosine residues. Phosphorylated proteins serve as a source for organic
phosphorus in
osteogenic environments aiding the nucleation of calcium phosphate by serving
as
substrates for phosphatases. DMP1 is an osteogenic marker protein that is
involved in
osteoblast differentiation and hydroxyapatite nucleation. Results presented in
Figure 82
show that HMSCs from the group treated with osteogenic EVs showed an increased
presence of phosphorylated proteins and increased expression of DMP1 compared
to the
control adding evidence to the in vitro results presented in Figure 81.
[0322] Similarly, chondrogenic differentiation was evaluated by looking at the
expression
levels of type II collagen, a major component of the cartilaginous matrix as
well as the
expression level of pigment epithelium derived factor (PEDF). PEDF is a potent
anti-
angiogenic factor that is expressed in developing cartilage tissue to actively
prevent
vascularization. Results presented in Figure 82 show that type ll collagen and
PEDF
expression was elevated in HMSCs subjected to chondrogenic EV treatment with
respect to
control HMSCs.
-76-
CA 03106818 2021-01-15
WO 2020/023251
PCT/US2019/042096
[0323] Finally, adipogenic differentiation of HMSCs from the subcutaneous
implants was
evaluated by evaluating the expression levels of peroxisome proliferator
activator receptor-
gamma (PPAR-y) and caveolin 1. PPAR-y is a nuclear receptor that controls
adipogenesis
and adipogenic differentiation of MSCs. On the other hand, caveolin 1
expression is
reduced upon induction of adipogenic differentiation of MSCs. Results
presented in Figure
83 show an increased expression of PPAR-y and reduced expression of caveolin 1
in
HMSCs treated with adipogenic EVs compared to controls indicating an induction
of
adipogenic differentiation. Additionally, these cells demonstrate the presence
of fat-like
deposits with positive PPAR-y staining.
[0324] Collectively, these results indicate that EVs isolated from
differentiating HMSCs can
induce lineage-specific phenotypic changes in naïve HMSCs in vitro and in
vivo.
EVs from BMP2 overexpressing HMSCs can enhance differentiation in vitro and
bone
regeneration in vivo:
[0325] Based onobservations that lineage-specificity is imparted to HMSC EVs
with a
functional impact upon target cells, it was speculated that genetic
manipulation of HMSCs
serving as an EV source could generate EVs with enhanced functionality for
targeted
differentiation of stem cells. To explore this possibility and to investigate
the potential of
generating standardized EVs from a stabilized parental cell line, a stable
HMSC line that
constitutively overexpresses BMP2 (BMP2 OE HMSCs) was generated. This cell
line
demonstrated increased mRNA expression of BMP2 compared to control (untreated)
and
vector control cell lines (Figure 84A). The BMP2 expression was further
associated with
functional differentiation; Figure 84B shows a representative image of the
control, vector
control and BMP2 OE HMSCs subjected to cell culture in 6 well dishes in the
presence of
osteogenic differentiation media (7 days) and stained for alizarin red to
identify calcium
deposits. The BMP2 OE HMSCs generated higher amounts of calcium deposits
compared
to the controls indicating their greater osteogenic differentiation potential.
[0326] EVs were isolated from these BMP2 OE HMSCs (BMP2 EV) and evaluated for
the
presence of marker protein CD63 by immunoelectron microscopy (Figure 84C),
size
distribution by NTA (Figure 840) and for endocytosis by naïve HMSCs
quantitatively
(Figure 84E). Results presented in Figures 84C, 840 and 84E indicate that the
isolated
EVs possess a similar size distribution as the control and differentiated HMSC
EVs
(compare to Figure 79) and are endocytosed by naïve HMSCs in a dose dependent
manner
similar to the control HMSC derived EVs (compare to Figure 79A).
[0327] To explore whether the induced lineage-specification of HMSCs altered
the function
of these EVs, their potential to induce osteogenic differentiation of naïve
HMSCs in vitro was
evaluated. Results presented in Figure 85A show that BMP2 EV treated HMSCs
showed a
-77-
CA 03106818 2021-01-15
WO 2020/023251
PCT/US2019/042096
significant increase in the expression of osteogenic marker genes. As the EVs
were isolated
from BMP2 overexpressing cells, the study sought to evaluate if the EVs
themselves trigger
the BMP2 signaling cascade. To test this, HMSCs were subjected to a 4hr
incubation with
control EVs, BMP2 EVs and with rhBMP2 (positive control) and evaluated for
phosphorylation of SMAD1/5/8. Untreated HMSCs remained as baseline. Results
presented in Figure 85B indicate that treatment with either rhBMP2 and BMP2EVs
triggered
SMAD 1/5/8 phosphorylation and treatment with control HMSC EVs did not
indicating that
the BMP2 EVs were triggering the BMP2 signaling cascade. To further confirm
this effect,
HMSCs were transfected with a reporter luciferase construct that is specific
to SMAD 1/5
activity and evaluated for response. Results presented in Figure 85B indicate
that the
luciferase activity was increased upon treatment with positive control BMP2
and to a lesser
extent with BMP2 EV. Interestingly, when the EVs were used in combination with
rhBMP2, a
robust increase in luciferase activity was observed with the BMP2 EVs but not
with control
EVs indicating that the BMP2 EVs were potentiating the BMP2 signaling cascade.
Additionally, the presence of control EVs actively negated the effect of
rhBMP2.
[0328] To provide assurance that the BMP2 EV effects was not the result of
BMP2 protein
expression from the parental cell, both the EVs and EV depleted conditioned
media were
examined for BMP2 and EV marker CD63 expression. Figure 86C shows the result
from
this experiment. BMP2 was not present in detectable levels in the conditioned
medium from
control cells and in the EV protein extracts from both control and BMP2
groups. However,
BMP2 was detected in the EV depleted conditioned medium from the BMP2 OE HMSCs
(visible band in lane 2 of Figure 86C). On the other hand, CD63 (labelled) was
present only
in the EV protein extracts from both groups. Overall, this result indicated
that BMP2 protein
was not packaged with in the EVs of the BMP2 OE HMSCs.
[0329] The next experiment sought an exosomal miRNA-based mechanism that
enables
BMP2 EVs to potentiate the BMP2 signaling pathway. To identify possible miRNA
targets,
TargetScan (targetscan.org) was used to identify miRNA targets that might bind
to the
negative regulators of the BMP2 pathway namely SMURF1 and SMAD7.
Interestingly, a
cluster of five miRNAs that bind to the 3' untranslated region (UTR) of both
SMURF1 and
SMAD7 was identified. These miRNAs are broadly conserved among vertebrates,
indicating
their importance in the control of the BMP2 pathway. To demonstrate that these
miRNAs
were differentially expressed among control and BMP2 EVs, the miRNA levels in
control and
BMP2 EVs were analyzed by qRT PCR. Results presented in Figure 860 indicate a
statistically significant increase in the levels of these miRNA in the BMP2
EVs compared to
control HMSC EVs. On the other hand, there was no significant change in the
expression
level of miR 3960, an miRNA that has been implicated in osteogenic
differentiation and bone
regeneration via regulation of RUNX2 gene. Taken together, these results
indicate a
-78-
CA 03106818 2021-01-15
WO 2020/023251
PCT/US2019/042096
pathway-specific mechanism active in these lineage-specific, functionally
enhanced
exosomes.
[0330] Finally, the functionality and translational relevance of BMP2 EVs was
evaluated in
vivo in a rat calvarial defect model. Figure 87 shows representative 3D
reconstructed 1..iCT
images of rat calvaria after 4, 8- and 12-weeks post wounding. For these
experiments,
rhBMP2 was used as a positive control. rhBMP2 induced a rapid and robust bone
growth
over 12 weeks compared to the other groups. At this high, effective dose, bone
formation
obliterated the calvarial sutures and areas of ectopic bone formed (12-week
group white
arrow). In contrast, the group of rats treated with EVs from BMP2 OE cells
(BMP2 EV)
showed a gradual increase over time in bone formation followed by robust wound
coverage
by 12 weeks. Mineralized bone formation appeared to be exclusively confined to
the treated
defect region. The control groups (No EV and naïve HMSC EV (Control EV))
showed
minimal healing over the study period. The uCt data was quantified using a
custom
designed Matlab program that evaluates BV/TV ratios as percentage of defect
volume filled
with mineralized tissue at the different time points. The results of this
quantification are
presented in Figure 88. These results show that the healing of cranial defects
in the BMP2
EV group was significantly greater than either control group indicating that
the application of
the BMP2 EVs enhanced osseous regenerative function. Thus, this demonstrates
the
potential for EVs from an engineered lineage-specific cell line to provide
instruction for
lineage-specific regeneration.
[0331] Histological evaluation was performed on paraffin embedded sections of
demineralized tissues across all groups and time points. Results presented in
Figure 89
validate the incomplete and poor healing observed in the control groups over
the different
time points evidenced by the increased presence of connective tissue and
minimal bone
matrix. In contrast, both the BMP2 EV and the rhBMP2 groups showed greater
regeneration
of bone tissue. The histological sections corroborate the 1..iCT data
indicating the
comprehensive regeneration of bone tissue in the rhBMP2 group. Notably, the
BMP2 EV
group histology revealed ongoing woven bone formation across the defects,
indicating a
dedicated intramembranous bone regeneration process was induced.
[0332] Further, immunofluorescence staining was performed on the 4week
sections from the
different groups to evaluate the expression levels of proteins important for
bone formation.
Results presented in Figures 90-93 indicate that both rhBMP2 and the BMP2 EV
groups
induced early expression of BMP2, bone sialoprotein (BSP), dentin matrix
protein 1 (DMP1)
and osteocalcin (OCN). Taken together, the 1..iCT and histological results
indicate that EVs
from a lineage-specified HMSC cell line (BMP2 OE HMSCs) are able to inform and
target
-79-
CA 03106818 2021-01-15
WO 2020/023251
PCT/US2019/042096
endogenous cells to differentiate along a parallel lineage to achieve tissue
regeneration by a
mechanism that enhances osteoinduction.
Discussion
[0333] Regenerative strategies require the recruiting and instructing of cells
to form new
tissues. MSC EVs are of current interest because they demonstrate
immunomodulatory and
regenerative potential that may rival the use of MSCs or growth factors in
regenerative
medicine. Furthermore, studies are currently underway to engineer MSCs to
improve their
ability to produce EVs by altering several secretory pathways. The
immunomodulatory,
angiogenic and regenerative potential of MSC EVs is well documented. The
potential of
bone marrow derived MSC EVs in bone regenerative applications has been
demonstrated.
[0334] This study provided insights into some of the basic properties of MSC
derived EVs
and how they may be utilized and exploited for improving tissue engineering
strategies. The
inquiry began by investigating MSC EV endocytosis, a first requisite step in
the process of
EV-mediated paracrine signaling. Identification of the endocytic mechanism can
provide
valuable information to target EVs for therapeutic delivery. As the exosomal
membrane is
the subset of the plasma membrane of the source cell, EVs from different cell
types undergo
endocytosis via different mechanisms. The clathrin pathway, caveolar pathway,
phagocytosis and even macropinocytosis have all been implicated in endocytosis
of EVs.
Energy dependence and dose dependence were observed, as well as dependence on
membrane cholesterol, indicating the involvement of the lipid raft/caveolar
endocytic
pathway. Furthermore, the data shows that the MSC EVs are endocytosed in a
manner that
involves the target cell surface HSPGs. Based on observations made with dental
pulp MSC
derived EVs, this appears to be a common endocytic mechanism for MSC derived
EVs.
Further studies using different MSC sources are required to conclusively
determine if this
mechanism is applicable to MSCs in general.
[0335] Next, the study sought to explore an important question regarding the
use of EVs for
therapeutic purposes: Does the state of the parental cell influence a)
exosomal properties
and endocytic mechanism and b) exosomal cargo and function?" The results
presented
here show that the characteristics of MSC derived EVs are not altered by
changes to cell
state. When HMSCs were differentiated into osteogenic, chondrogenic and
adipogenic
lineages, the secreted EVs from these cells maintained their morphology, size
distribution
and expression of exosomal surface markers. From a therapeutic perspective,
this result
shows that modifications to MSC state may not adversely affect the properties
of the
secreted EVs.
[0336] Next, the study tested if lineage-specification of parental MSCs would
inform the
differentiation potential of EVs. Results indicated that the endocytic
efficiency of MSC EVs is
not altered by changes to cell state. EVs isolated from osteogenic,
chondrogenic and
-80-
CA 03106818 2021-01-15
WO 2020/023251
PCT/US2019/042096
adipogenic MSCs did not show any significant difference in their dose-
dependent ability to
be endocytosed by naïve MSCs. However, they were able to effect lineage
specific changes
within the target MSCs in vitro and in vivo. This effect can be due to the
alterations to the
exosomal cargo of miRNA, mRNA and proteins. The characterization of lineage
specification by EVs from lineage differentiated MSCs underscores the unique
character of
cell-type specific EVs. This novel finding that directing tissue-specific
regeneration using EVs
from differentiated MSCs has wide-ranging applications in regenerative
medicine.
[0337] Importantly, this work sought to create a stable cellular source for
generating
function-specific EVs for tissue engineering applications. Using bone
regeneration as a
model system, it was hypothesized that the stable transduction of HMSCs with
an
osteoinductive factor can generate a stable cell line to consistently produce
lineage
specifying EVs. To test this hypothesis, an HMSC cell line that overexpresses
BMP2 was
generated. BMP2 is a clinically used morphogen for bone regenerative
procedures in
orthopedic and dental surgeries that is not without identified complications
or side effects.
However, it is reproducibly efficient in the generation of bone in preclinical
models including
the model used here. EVs from the BMP2 OE HMSCs showed a similar size
distribution,
morphological and endocytic profile to that of naïve and differentiated MSC
derived EVs
indicating that genetic modification of the MSCs did not affect the basic
properties of the
secreted EVs. This is an important observation of this study that shows that
genetic
modification of source MSCs do not alter the properties of their derivative
EVs. It is to be
noted here that endocytic efficiency refers to the saturation amount of EVs
and not the
absolute value of fluorescence as this value is arbitrary and is subject to
change with
experimental conditions.
[0338] When analyzed for their osteoinductive potential in vitro, BMP2 EVs
triggered
osteogenic gene expression in naïve HMSCs. Pathway studies indicated that the
BMP2
EVs potentiated the BMP2 signaling cascade. However, this activity was not due
to BMP2
protein presence within the EVs. The results indicate that the increased
osteoinductive
potential of the BMP2 EVs is due to the increased levels of pathway specific
miRNA within
the EVs that negatively regulate the negative regulators of the BMP2 pathway
in SMURF1
and SMAD7. Further refinement can enable changes to targeted pathways and
enhance
therapeutic specificity.
[0339] In a rat calvarial defect model, the BMP2 EVs performed significantly
better than
control groups that included calvarial wounds covered with just collagen
sponge and
collagen sponge containing EVs from control MSCs. Apart from highlighting the
enhanced
potential of the engineered MSC EVs, the data also revealed that EVs from
undifferentiated
MSCs possess limited bone regenerative potential. The bone formed in the BMP2
OE EV
group is representative of intramembranous woven bone. The cell-rich
mineralized matrix
-81-
CA 03106818 2021-01-15
WO 2020/023251
PCT/US2019/042096
deposition at 4 -12 weeks indicates that the EVs may be functioning by direct
targeting of
osteoprogenitors. Unlike rhBMP2 regenerated tissues, there is no ectopic and
exaggerated
bone formation nor an excessive vascular or adipogenic response to BMP2 EV
stimulated
bone regeneration. The involvement of various cells and the targeting of
individual cell types
by EV treatment in this model remains to be elucidated. In terms of the
percentage volume
of defect covered by mineralized tissue, the BMP2 Exo group performed
admirably albeit not
as robust as the rhBMP2 group. Collectively, the results from the bone
regenerative
experiments indicate that engineered EVs from genetically transformed MSCs can
be used
as mediators of host response to injury to improve regenerative outcomes.
[0340] Overall, the data presented in this study indicates that altering the
MSC cell state
generates EVs with function-specific properties without altering EV
characteristics, size
distribution or endocytic ability. EVs from genetically modified MSCs (BMP2)
displayed
unaltered size and endocytic properties compared to naïve MSC EVs but showed
enhanced
regenerative potential in vitro and in vivo in line with the targeted genetic
modification.
Furthermore, overexpression of BMP2 growth factor in MSCs altered the EV cargo
to
contain miRNA that potentiates the BMP2 signaling cascade. These results show
how
properties of MSC derived EVs may be manipulated for various applications in
disease
treatment and regenerative medicine.
[0341] It is understood that the examples and embodiments described herein are
for
illustrative purposes only and that various modifications or changes in light
thereof will be
suggested to persons skilled in the art and are to be incorporated within the
spirit and
purview of this application and scope of the appended claims. All
publications, patents, and
patent applications cited herein are hereby incorporated herein by reference
for all purposes.
-82-