Note: Descriptions are shown in the official language in which they were submitted.
CA 03108862 2021-02-05
WO 2019/032558
PCT/US2018/045567
TITLE OF THE INVENTION
[0001] SYSTEM AND METHOD FOR THE VISUALIZATION AND
CHARACTERIZATION OF OBJECTS IN IMAGES
CROSS REFERENCE TO RELATED APPLICATIONS
[0002] This application is a U.S. National Stage Entry of U.S.
Provisional Patent Application
No. 62/541989 filed on August 7, 2017, the contents of which are incorporated
herein in its
entirety.
BACKGROUND
[0003] The present invention generally relates to image processing and,
more particularly, to
a convergence-based system and method for the visualization and
characterization of objects in
images.
SUMMARY
[0004] In some embodiments, the convergence-based system may be known as
local micro-
contrast convergence (LMCC). LMCC algorithms may utilize an iterative approach
that causes
all tissues/materials in a digital image to express their structures in a way
that is unique to each
and every type of tissue.
[0005] Embodiments of the invention, described herein, may include
methods that utilize an
iterative approach that causes all tissues/materials in a digital image to
express their structures in
a way that is unique to each and every type of tissue.
[0006] Benoit B. Mandelbrot, in his book titled "The Fractal Geometry of
Nature", revealed
that Fractal Geometry (as compared with Euclidean Geometry) best expresses the
irregular
patterns of nature and biological growth. Fractal patterns often have the
following properties:
Non-integer dimensions, self-similarity, properties associated with symmetry
and scalability.
[0007] LMCC mathematically deconvolves already existing fractal-like
patterns of natural
systems in digital images through an Iterated Function Model. Iteration of
polynomials can
create fractal patterns in a computer. Iteration of functions applied to
digital images by LMCC
algorithms causes local patterns of pixel neighborhoods to converge into
characteristic patterns,
CA 03108862 2021-02-05
WO 2019/032558
PCT/US2018/045567
independently of their luminance or color values. The convergence-based
sequencing visualizes
the complex (geometric/fractal-based) patterns into meaningful visual patterns
for the
characterization and analysis of those patterns for machine learning.
[0008] While some components of Imago's LMCC algorithmic sequences can
distinctly
express and differentiate tissue characteristics based on topology, others
express fractal
dimensions which can be expressed in non-integer values. Practically, this
means that there are
distinct "linear" patterns that reflect different tissue types. In one
embodiment there is a
convergence-based method of visualizing and characterizing all features in a
first grayscale
image, such that the first image is duplicated into at least two channels with
identical luminance
values, then applying a local micro-contrast convergence (LMCC) algorithm that
transforms at
least some of the input values of each duplicate channel so that the output
pixel values of each
duplicate channel are different from both its input pixel values and those of
every other duplicate
channel's output pixel values, then using a look-up table to map values for
each vector in each
channel that, as a process, collectively produces a second image that is
different from the first
image.
[0009] Channels may be created as grayscale, alpha, color information
channels, or a
combination of the three.
[0010] In a further embodiment, applying a second local micro-contrast
convergence
algorithm, separate and distinct from the first local micro-contrast
convergence algorithm, to the
second image to produce a third image that is separate and distinct from the
first image and
separate and distinct from the second image.
[0011] In a further embodiment, altering the third image by sequentially
applying one or
more additional local micro-contrast convergence algorithms to generate a
fourth image.
[0012] In a further embodiment, combining one or more of the first,
second, third or fourth
.. images to produce a fifth image that is separate and distinct from the
first, second, third or fourth
images.
[0013] In a further embodiment, a local micro-contrast convergence
algorithmic sequence
may include one or more of the preceding types of multi-dimensional (multi-
channel) image
transformations.
[0014] In a further embodiment, multi-dimensional image transformations may
be expressed
as a profile look-up table (PLUT) in a digital file format as hexadecimal code
or text.
2
CA 03108862 2021-02-05
WO 2019/032558
PCT/US2018/045567
[0015] In a further embodiment, multi-dimensional image transformations
may be stored as a
PLUT in a digital file format as one or more matrices.
[0016] In a further embodiment, local micro-contrast convergence
algorithms define and can
process a sequence of transformations utilizing metrics specified in PLUTs
that translate image
input pixel values representing specific material types to image output pixel
values to cause
relationships among neighboring pixel groups to aggregate into predictable
color and luminosity
patterns consistent with the material's structure and relationship to its
imaging modality; each
material is uniquely characterized and can be visually differentiated.
[0017] In a further embodiment, local micro-contrast convergence, multi-
dimensional image
transformations may be stored as a PLUT in a digital file format where a set
of two-dimensional
input functions Fi(x,y,i), F2(x,y,i)....,FN(x,y,i) is mapped to a set of two-
dimensional output
functions Gi(x,y,i), G2(x,y,i)....,GN(x,y,i) with space variables (x, y) and
luminance variable (i).
[0018] In a further embodiment, multi-dimensional image transformations
may be stored as a
PLUT in a digital file format where a set of two-dimensional input functions
Fi(x,y,i),
F2(x,y,i)....,FN(x,y,i) is mapped to a set of more than two-dimensional output
functions in the
form of sub-matrices Gi(x,y,i,j,k,1), G2(x,y,i,j,k,1)....,GN(x,y,i,j,k,l) with
space variables (x,y), a
luminance variable (i), and alpha or color channels (j,k,1).
[0019] In a further embodiment, a first grayscale image may be
replicated into a first multi-
dimensional space where each layer dimension of the multi-dimensional space is
a replicate of
the first image.
[0020] In a further embodiment, the number of dimensions in a multi-
dimensional space
equals two or more.
[0021] In a further embodiment, the number of dimensions in a multi-
dimensional space
equals four including luminance and the color components red, green, and blue.
[0022] In a further embodiment, the number of dimensions in a multi-
dimensional space may
equal N dimensions of color spaces such as Red, Green and Blue (RGB) (the RGB
color model
is an additive color model in which red, green and blue light are added
together in various ways
to reproduce a broad array of colors), Hue, Saturation, and Lightness (HSL),
CIE XYZ (the
International Commission on Illumination or CIE, which is the abbreviation for
its French name,
Commission internationale de l'eclairage, established the first system for
scientifically defining
3
CA 03108862 2021-02-05
WO 2019/032558
PCT/US2018/045567
light colors or additive colors.), and Cyan, Magenta, Yellow, and Black (CMYK
is a
combination of cyan, magenta, yellow and black.).
[0023] In a further embodiment, converting a multi-dimensional color
space image that was
created by a local micro-contrast convergence algorithmic sequence into a
single channel
[dimension] grayscale image.
[0024] In a further embodiment, converting a multi-dimensional color
space image into a
single channel grayscale image by differentially altering the luminance values
of colors in the
first image as they are expressed in the grayscale (desaturated) image.
[0025] In a further embodiment, the functions utilized within a local
micro-contrast
convergence algorithmic sequence can include superposition additive or
differential operators
utilizing two or more resultant images from two different local micro-contrast
algorithmic
sequences.
[0026] In a further embodiment, one or more local micro-contrast
convergence algorithmic
sequences may employ finite area convolution filters with an M x M (e.g., 3x3
/ 5x5 ...pixel
arrays) impulse response array for either sharpening or reducing noise in an
image.
[0027] In a further embodiment, the resulting features that are
visualized and characterized
can be expressed in the context of a given first grayscale image wherein each
object or material
type converges to similar patterns or colors characteristic of its type,
thereby expressing unique
characteristics in response to the algorithmic sequence.
[0028] In a further embodiment, different local micro-contrast convergence
algorithmic
sequences can be utilized for the same given first grayscale image to express
different
convergent visualizations and characterizations of materials within that image
by causing all like
materials to converge into similar patterns or colors.
[0029] In a further embodiment, different algorithmic sequences may be
created and applied
to optimize the characterization of distinct material properties in an image,
such as object
boundaries, textures, fine structures, and changes within objects.
[0030] In a further embodiment, the first image is an image generated by
x-ray, ultrasound,
infra-red, ultra-violet, Magnetic Resonance Imaging (MM), Computerized Axial
Tomography
(CAT or CT scans), Positron-Emission Tomography (PET) scans, grayscale, color,
visible light,
millimeter wave, or laser scan.
4
CA 03108862 2021-02-05
WO 2019/032558
PCT/US2018/045567
[0031] In a further embodiment, a cancer, cyst or any abnormality of the
breast tissue the
breast, prostate, kidney, liver, bone, lung, brain, or skin of either a human
or animal can be
visualized and characterized within the context and patterns of all other
structures in an image.
[0032] In a further embodiment, a biomarker for cardiovascular disease,
Alzheimer's
disease, diseases of the eye, or multiple sclerosis lesion can be visualized
and characterized
within the context and patterns of all other structures in the image.
[0033] In a further embodiment, a chemical marker for solid or liquid
organic compounds,
such as explosives in an X-ray image, can be visualized and characterized
within the context and
patterns of all other structures in an image.
[0034] In a further embodiment, a structural defect or anomaly can be
visualized and
characterized within the context and patterns of all other structures in an
image.
[0035] In one embodiment, there is a system of reducing the false
positive error rate for
visually or digitally expressing the presence of a feature in an image
according to any of the
methods described herein. In medical testing, and more generally in binary
classification, a false
positive is an error in data reporting in which a test result improperly
indicates presence of a
condition, such as a disease (the result is positive), when in reality it is
not present.
[0036] In one embodiment, there is a method of reducing the false
negative error rate for
visually or digitally expressing the presence of a feature in an image
comprising: applying a local
micro-contrast tissue convergence algorithm to a first image to produce a
second image that is
different from the first image. In medical testing, a false negative is an
error in which a test result
improperly indicates no presence of a condition (the result is negative), when
in reality it is
present.
[0037] In a further embodiment, the first image is an image generated by
x-ray, ultrasound,
infra-red, ultra-violet, MRI, CT scans, PET scans, grayscale, color, visible
light, millimeter
wave, or laser scan.
[0038] In a further embodiment, a cancer, cyst or any abnormality of the
breast tissue the
breast, prostate, kidney, liver, bone, lung, brain, or skin of either a human
or animal can be
visualized and characterized within the context and patterns of all other
tissue structures in an
image.
5
CA 03108862 2021-02-05
WO 2019/032558
PCT/US2018/045567
[0039] In a further embodiment, a biomarker for cardiovascular disease,
Alzheimer's
disease, diseases of the eye, or multiple sclerosis lesion can be visualized
and characterized
within the context and patterns of all other structures in the image.
[0040] In a further embodiment, a chemical marker for a solid or liquid
organic compound
can be visualized and characterized within the context and patterns of all
other structures in an
image.
[0041] In a further embodiment, a structural defect or anomaly can be
visualized and
characterized within the context and patterns of all other structures in an
image.
[0042] In a further embodiment, the false negative rate for breast
cancer detected or
visualized by a radiologist in the second (i.e., subsequent) image is less
than 16% for normal
breasts and less than 60% for breasts having a portion of dense tissue.
[0043] In one embodiment, there is a system of reducing the false
negative error rate of
detecting or revealing a feature in an image according to any of the methods
described herein.
[0044] In one embodiment there is a system comprising: one or more
memory units each
operable to store at least one program; and at least one processor
communicatively coupled to the
one or more memory units, in which the at least one program, when executed by
the at least one
processor, causes the at least one processor to perform the steps of:
receiving an image; mapping
pixel values of the image to an initial multi-dimensional color space;
applying one or more local
micro-contrast convergence transfer functions to the image's initial multi-
dimensional color
.. space to cause local micro-contrast convergence and to create a processed
image with a multi-
dimensional color space; and displaying that image visualization based on the
processed multi-
dimensional color space.
[0045] In a further embodiment, converting the processed multi-
dimensional color space
image to a single channel grayscale image.
[0046] In a further embodiment, the multi-dimensional color space image
includes a
luminance dimension having luminance values.
[0047] In a further embodiment, converting the processed multi-
dimensional color space to a
single channel grayscale image by differentially altering the luminance values
of colors in the
first image as they are expressed in the grayscale (desaturated) image for
purposes of image
display or analysis.
[0048] In a further embodiment, the multi-dimensional color space is an
RGB color space.
6
CA 03108862 2021-02-05
WO 2019/032558
PCT/US2018/045567
[0049] In some embodiments, the multi-dimensional color space may be one
of: HSV (Hue,
Saturation, Value), HSL, HSB (hue, saturation, brightness), CMYK , CIE XYZ or
CIELAB (The
CIELAB color space, also known as CIE L*a*b* or sometimes abbreviated as
simply "Lab"
color space is a color space defined by the International Commission on
Illumination,CIE). It
expresses color as three numerical values, L* for the lightness and a* and b*
for the green¨red
and blue¨yellow color components).
[0050] In a further embodiment, the system further comprising the
processing of a breast
image (mammogram, CT, Mill, or ultrasound): applying a median filter to the
initial multi-
dimensional color space; and wherein applying the one or more PLUTs to the
initial multi-
dimensional color space includes: applying a first set of PLUT functions to
attenuate low density
fatty breast tissue (as defined by the American College of Radiology (ACR)
density
classification system); applying a second set of PLUT functions to cause fatty
breast tissue to
appear as a first color and to differentiate the denser breast tissue (as
defined by the American
College of Radiology (ACR) density classification system) using other colors;
applying a third
set of PLUT functions to amplify low pixel values and attenuate high pixel
values in the color
space layer associated with the first color; and applying a fourth set of PLUT
functions to change
the background of the image, when displayed, to black or other desired
luminance or color value.
[0051] In a further embodiment, the system further comprising: receiving
a second image,
the second image being substantially similar to the first image; mapping pixel
values of the
second image to a second initial multi-dimensional color space; applying a
median filter and a
convolution filter to the initial multi-dimensional color space to create a
second processed multi-
dimensional color space; and displaying an image visualization based on the
processed multi-
dimensional color space associated with the first image and the second
processed multi-
dimensional color space associated with the second image, and wherein the
applying the one or
more PLUT functions to the initial multi-dimensional color space associated
with the first image
includes: applying a first set of PLUT functions to elevate darker values of
the image and
attenuate mid tones; applying a second set of PLUT functions to the multi-
dimensional color
space to add subtle color hues; and applying a third set of PLUT functions to
expand the tonal
values associated with cancer.
[0052] In a further embodiment, the system further comprising: adjusting
gamma levels of
the multi-dimensional color space to adjust the contrast of the first image
and highlight structural
7
CA 03108862 2021-02-05
WO 2019/032558
PCT/US2018/045567
details, and wherein the applying the one or more PLUT functions to the
initial multi-
dimensional color space associated with the first image includes: applying a
first set of PLUT
functions to diminish the luminance levels slightly; and applying a second set
of PLUT functions
to invert values of the initial multi-dimensional color space associated with
luminance.
[0053] In a further embodiment, the first image is a mammogram that
includes dense tissue
and fatty tissue (as defined by the American College of Radiology (ACR)
density classification
system), and applying a first local micro-contrast convergence algorithm to a
first image to
produce a second image that is separate and distinct from the first image
includes: mapping pixel
values of the first image to a first multi-dimensional color space; applying a
median filter to the
first multi-dimensional color space to produce a second multi-dimensional
color space; inverting
the second multi-dimensional color space to produce a third multi-dimensional
color space;
applying a first set of one or more non-linear transfer functions to the third
multi-dimensional
color space to produce a fourth multi-dimensional color space and to cause
fatty breast tissue to
appear as one color and to differentiate the denser breast tissue using other
colors; applying a
second set of one or more transfer functions to the fourth multi-dimensional
color space to
produce a fifth multi-dimensional color space and to amplify high pixel values
and attenuate low
pixel values and to highlight the breast area structures; and displaying an
image visualization
based on the fifth multi-dimensional color space.
[0054] In a further embodiment, the first image is a mammogram that
includes dense tissue
and fatty tissue, and applying a first local micro-contrast convergence
algorithm to a first image
to produce a second image that is separate and distinct from the first image
includes: mapping
pixel values of the first image to a first multi-dimensional color space;
applying a first set of one
or more transfer functions to the first multi-dimensional color space to
produce a second multi-
dimensional color space and to cause fatty breast tissue to appear as one
color and to differentiate
the denser breast tissue using other colors; converting the second multi-
dimensional color space
to a third multi-dimensional color space in an HLS color space; and displaying
an image
visualization based on the third multi-dimensional color space.
[0055] In a further embodiment, the first image is a mammogram that
includes dense tissue
and fatty tissue, and applying a first local micro-contrast convergence
algorithm to a first image
to produce a second image that is separate and distinct from the first image
includes: mapping
pixel values of the first image to a first multi-dimensional color space;
applying a first set of one
8
CA 03108862 2021-02-05
WO 2019/032558
PCT/US2018/045567
or more transfer functions to the first multi-dimensional color space to
produce a second multi-
dimensional color space and to cause fatty breast tissue to appear as one
color and to
differentiate and reveal detailed structures in the denser breast tissue using
other colors; and
displaying an image visualization based on the second multi-dimensional color
space.
[0056] In a further embodiment, the first image is a mammogram that
includes dense tissue
and fatty tissue, and applying a first local micro-contrast convergence
algorithm to a first image
to produce a second image that is separate and distinct from the first image
includes: mapping
pixel values of the first image to a first multi-dimensional color space;
applying a first set of one
or more transfer functions to the first multi-dimensional color space to
produce a second multi-
dimensional color space and to cause fatty breast tissue to appear translucent
and to differentiate
denser breast tissue (as defined by the American College of Radiology (ACR)
density
classification system) using other colors, and to distinguish small dot-like
structures; and
displaying an image visualization based on the second multi-dimensional color
space.
[0057] In a further embodiment, the first image is a mammogram that
includes dense tissue
and fatty tissue, and applying a first local micro-contrast convergence
algorithm to a first image
to produce a second image that is separate and distinct from the first image
includes: mapping
pixel values of the first image to a first multi-dimensional color space;
applying median filter to
the first multi-dimensional color space to produce a second multi-dimensional
color space;
applying a convolution filter to the second multi-dimensional color space to
produce a third
multi-dimensional color space; importing a duplicate first image; mapping
image pixel values to
a fourth multi-dimensional color space; applying a first set of one or more
transfer functions to
the fourth multi-dimensional color space to produce a fifth multi-dimensional
color space and to
build contrast and darken fatty tissue; applying a second set of one or more
transfer functions to
the fifth multi-dimensional color space to produce a sixth multi-dimensional
color space and to
build contrast and darken fatty tissue; applying a third set of one or more
transfer functions to the
sixth multi-dimensional color space to produce a seventh multi-dimensional
color space and to
invert fatty breast tissue luminance to appear as one color and to
differentiate and reveal detailed
structures in the denser breast tissue using other colors; applying a fourth
set of one or more
transfer functions to the seventh multi-dimensional color space to produce an
eighth multi-
.. dimensional color space and to define the breast boundary; merging the
third multi-dimensional
color space with the eighth multi-dimensional color space to produce a ninth
multi-dimensional
9
CA 03108862 2021-02-05
WO 2019/032558
PCT/US2018/045567
color space; converting the ninth multi-dimensional color space to grayscale
values and
displaying an image representative of the ninth multi-dimensional color space.
[0058] In a further embodiment, the first image is a mammogram that
includes dense tissue
and fatty tissue, and wherein applying a first local micro-contrast
convergence algorithm to a
first image to produce a second image that is separate and distinct from the
first image includes:
mapping pixel values of the first image to a first multi-dimensional color
space; applying a first
set of one or more transfer functions to the first multi-dimensional color
space to produce a
second multi-dimensional color space and to cause the image pixel values to
invert non-linearly;
applying a second set of one or more transfer functions to the second multi-
dimensional color
space to produce a third multi-dimensional color space and to cause fatty
breast tissue to appear
as one color and to differentiate and reveal detailed structures in the denser
breast tissue using
other colors; applying a third set of one or more transfer functions to the
third multi-dimensional
color space to produce a fourth multi-dimensional color space and to cause
fatty breast tissue to
appear as one color and to differentiate and reveal detailed structures in
denser breast tissue
using other colors; converting the fourth multi-dimensional color space to a
fifth multi-
dimensional color space in an HLS color space; merging the fifth multi-
dimensional color space
with the first multi-dimensional color space by employing a darken blend to
produce a sixth
multi-dimensional color space; adjusting the opacity of the sixth multi-
dimensional color space
to produce a seventh multi-dimensional color space; and converting the seventh
multi-
dimensional color space to grayscale values and displaying an image
representative of the
seventh multi-dimensional color space.
[0059] In a further embodiment, the first image is a mammogram that
includes dense tissue
and fatty tissue, and wherein applying a first local micro-contrast
convergence algorithm to a
first image to produce a second image that is separate and distinct from the
first image includes:
mapping pixel values of the first image to a first multi-dimensional color
space; applying median
filter to the first multi-dimensional color space to produce a second multi-
dimensional color
space; applying a first set of one or more transfer functions to the second
multi-dimensional
color space to produce a third multi-dimensional color space and to alter the
contrast and reduce
luminosity of fatty tissue; applying a second set of one or more transfer
functions to the third
multi-dimensional color space to produce a fourth multi-dimensional color
space and to colorize
all breast tissue except those of the higher density; applying a third set of
one or more transfer
CA 03108862 2021-02-05
WO 2019/032558
PCT/US2018/045567
functions to the fourth multi-dimensional color space to produce a fifth
multidimensional color
space and to reduce the fatty tissue to an almost solid color; inverting the
colors of the fifth
multi-dimensional color space to produce a sixth multi-dimensional color
space; applying a
fourth set of one or more transfer functions to the sixth multi-dimensional
color space to produce
a seventh multi-dimensional color space and to differentiate the breast from
outside its boundary;
converting a seventh multi-dimensional color space to an eighth multi-
dimensional color space in
an HLS color space and adjust HLS properties of the eighth multi-dimensional
color space to
produce a ninth multi-dimensional color space; displaying an image
visualization based on the
ninth multi-dimensional color space.
[0060] In one embodiment, there is a method performed by the system
described herein.
BRIEF DESCRIPTION OF THE SEVERAL VIEWS OF THE DRAWINGS
[0061] The foregoing summary, as well as the following detailed
description of embodiments
of the invention, will be better understood when read in conjunction with the
appended drawings
of an exemplary embodiment. It should be understood, however, that the
invention is not limited
to the precise arrangements and instrumentalities shown.
[0062] In the drawings:
[0063] Figure la depicts a diagram illustrating the elements of an
Iterated Function Module
in accordance with an exemplary embodiment of the present invention;
[0064] Figure lb depicts two resultant image representations after
processing an original
mammogram in accordance with an exemplary embodiment of the present invention;
[0065] Figure lc is a characteristic non-linear luminance transform
"tone adjustment curve"
with 2 nodal (anchor) points, in accordance with an exemplary embodiment of
the present
invention;
[0066] Figure ld is a hierarchical structure of the levels of image
processing and analysis
embodied, in accordance with an exemplary embodiment of the present invention;
[0067] Figure le is a local micro-contrast convergence algorithm
sequence, in accordance
with an exemplary embodiment of the present invention;
[0068] Figure lf is a plot in a coordinate system representative of a
non-linear transfer
function, in accordance with an exemplary embodiment of the present invention;
11
CA 03108862 2021-02-05
WO 2019/032558
PCT/US2018/045567
[0069] Figure lg is a plot in a coordinate system representative of
breast tissue color in a
grayscale image in accordance with an exemplary embodiment of the present
invention;
[0070] Figure 2a is a mathematical function that may be used to generate
a new profile look
up table (PLUT) input and output values in accordance with an exemplary
embodiment of the
present invention;
[0071] Figure 2b is a look-up table (LUT) for an 8-bit grayscale image
according to at least
some embodiments of the invention;
[0072] Figure 2c is a block diagram that illustrates an electronic
device for performing one or
more methods according to at least some embodiments of the invention;
[0073] Figure 3a is an exemplary high density (as defined by the American
College of
Radiology (ACR) density classification system) original X-ray mammogram
containing cancer
in the brightest area of the image;
[0074] Figure 3b is an exemplary mammogram image after applying local
micro-contrast
convergence algorithm sequence to create the resultant image using one or more
methods in
accordance with an exemplary embodiment of the present invention;
[0075] Figures 4a to 4k is an exemplary local micro-contrast convergence
algorithmic
sequence to process mammographic images to reveal breast abnormalities in
resultant color
images, in accordance with an exemplary embodiment of the present invention;
[0076] Figures 5a to Si is an exemplary local micro-contrast convergence
algorithmic
sequence to process mammographic images to reveal low attenuating breast
tissues in resultant
grayscale images, in accordance with an exemplary embodiment of the present
invention;
[0077] Figures 6a to 6i is an exemplary local micro-contrast convergence
algorithmic
sequence to process mammographic images to reveal details in dense breast
tissues in resultant
grayscale images. in accordance with an exemplary embodiment of the present
invention;
[0078] Figures 7a to 7j is an exemplary local micro-contrast convergence
algorithmic
sequence to process mammographic images to reveal the presence of
microcalcifications in
dense breast tissues in resultant grayscale images, in accordance with an
exemplary embodiment
of the present invention;
[0079] Figures 8a to 8u are an exemplary local micro-contrast
convergence algorithmic
sequence to process mammographic images to reveal details of very fine breast
tissue structures
12
CA 03108862 2021-02-05
WO 2019/032558
PCT/US2018/045567
in resultant grayscale images, in accordance with an exemplary embodiment of
the present
invention;
[0080] Figures 9a to 9q is an exemplary local micro-contrast convergence
algorithmic
sequence to process mammographic images to reveal breast abnormalities in
resultant grayscale
images, in accordance with an exemplary embodiment of the present invention;
[0081] Figures 10a to lOw are an exemplary local micro-contrast
convergence algorithmic
sequence to process mammographic images to isolate breast abnormalities in
resultant grayscale
images, in accordance with an exemplary embodiment of the present invention;
[0082] Figures 11 a to lid are an exemplary local micro-contrast
convergence algorithmic
sequence applied to four different mammograms generated from four different
image acquisition
modalities showing the same patterns from one local micro-contrast convergence
algorithm in
accordance with an exemplary embodiment of the present invention;
[0083] Figure lie is an X-ray image of surgically excised breast cancer
tissue, in accordance
with an exemplary embodiment of the present invention;
[0084] Figure 1 if depicts the results after applying an exemplary local
micro-contrast
convergence algorithmic sequence to the X-ray in Figure lie, in accordance
with an exemplary
embodiment of the present invention;
[0085] Figure 1 lg is a close-up of a mammographic X-ray image revealing
the presence of
cancer, in accordance with an exemplary embodiment of the present invention;
[0086] Figure 11h depicts results after applying an exemplary local micro-
contrast
convergence algorithmic sequence to the X-ray in Figure 11g, in accordance
with an exemplary
embodiment of the present invention;
[0087] Figure 12a is an original image showing cancer cells as imaged
using photo
microscopy, in accordance with an exemplary embodiment of the present
invention;
[0088] Figure 12b is the result after applying an exemplary local micro-
contrast convergence
algorithmic sequence to the image in Figure 12a, in accordance with an
exemplary embodiment
of the present invention;
[0089] Figure 13a is an original image revealing the surface of a cancer
cell, in accordance
with an exemplary embodiment of the present invention;
13
CA 03108862 2021-02-05
WO 2019/032558
PCT/US2018/045567
[0090] Figure 13b depicts the results after applying an exemplary local
micro-contrast
convergence algorithmic sequence to the image in Figure 13a in accordance with
an exemplary
embodiment of the present invention;
[0091] Figure 13c depicts a close-up of on area of Figure 13b, in
accordance with an
exemplary embodiment of the present invention;
[0092] Figure 13d depicts a graphic representation of the metric
distance scale and four
images containing cancer, cancer cell, or surface of cancer cell, in
accordance with an exemplary
embodiment of the present invention;
[0093] Figures 14a to 14i are an exemplary local micro-contrast
convergence algorithmic
sequence to process breast images generated from different imaging modalities,
in accordance
with an exemplary embodiment of the present invention;
[0094] Figures 15a to 15f depicts the results of an exemplary local
micro-contrast
convergence algorithmic process, in accordance with an exemplary embodiment of
the present
invention;
[0095] Figure 16a is a close-up of a mammogram containing a large cluster
of
microcalcifications, in accordance with an exemplary embodiment of the present
invention;
[0096] Figure 16b is an exemplary local micro-contrast convergence
algorithmic sequence
result, in accordance with an exemplary embodiment of the present invention;
[0097] Figure 16c is an exemplary local micro-contrast convergence
algorithmic sequence
result, in accordance with an exemplary embodiment of the present invention;
[0098] Figure 17a-17c is an exemplary process for creating areas of
interest (AO') for
machine learning, in accordance with an exemplary embodiment of the present
invention;
[0099] Figure 18a-18g is an exemplary methodology for correlating
metrics from each of a
plurality of processed images, in accordance with an exemplary embodiment of
the present
invention;
[00100] Figures 19a and 19b are original CT scans of a patient who had had a
concussion, in
accordance with an exemplary embodiment of the present invention;
[00101] Figures 19c and 19d depict the results after applying an exemplary
local micro-
contrast convergence algorithmic sequence to the original images in Figures
19a and 19b
respectively, in accordance with an exemplary embodiment of the present
invention;
14
CA 03108862 2021-02-05
WO 2019/032558
PCT/US2018/045567
[00102] Figure 20a is an original CT scan of a chest cavity, in accordance
with an exemplary
embodiment of the present invention;
[00103] Figure 20b depicts the results after applying an exemplary local micro-
contrast
convergence algorithmic sequence to the original image in Figure 20a, in
accordance with an
exemplary embodiment of the present invention;
[00104] Figure 21a is an original X-ray image of a pipe with corrosion, in
accordance with an
exemplary embodiment of the present invention;
[00105] Figure 21b shows the results after applying an exemplary local micro-
contrast
convergence algorithmic sequence to the original image in Figure 21a, in
accordance with an
exemplary embodiment of the present invention;
[00106] Figure 21c depicts the results after applying an exemplary local micro-
contrast
convergence algorithmic sequence to the original image in Figure 21a, in
accordance with an
exemplary embodiment of the present invention;
[00107] Figure 22a is an original X-ray image of a dog's leg;
[00108] Figure 22b is an original x-ray image after applying local micro-
contrast convergence
algorithmic sequence to Figure 22a, in accordance with an exemplary embodiment
of the present
invention;
[00109] Figure 23a is an original X-ray image of the same dog's leg as imaged
in Figure 22a,
in accordance with at least one embodiment of the present invention;
[00110] Figure 23b depicts soft tissue sarcoma results after applying the same
exemplary local
micro-contrast convergence algorithmic sequence to the original image in
Figure 22a, in
accordance with an exemplary embodiment of the present invention;
[00111] Figure 24a is a resultant first-generation color image generated from
a dual-energy X-
ray system designed to scan baggage at airports and other security check
points, in accordance
with at least one embodiment of the present invention;
[00112] Figures 24b and 24c depict the application of the LD algorithm
illustrated in Figure
Si, in accordance with an exemplary embodiment of the present invention;
[00113] Figure 25a is a digital photograph of a winter scene, in accordance
with at least one
embodiment of the present invention;
[00114] Figure 25b is an example of a computer-generated pattern known as a
Mandelbrot
Set, in accordance with at least one embodiment of the present invention;
CA 03108862 2021-02-05
WO 2019/032558
PCT/US2018/045567
[00115] Figure 26a is an original X-ray mammographic image showing the white
pattern of
dense breast tissue in accordance with at least one embodiment of the present
invention;
[00116] Figure 26b shows the results after applying an exemplary local micro-
contrast
convergence algorithmic sequence to the original image in Figure 26a, in
accordance with at
least one embodiment of the present invention;
[00117] Figure 27a is an original X-ray mammographic image showing the gray
pattern of
fatty breast tissue, in accordance with at least one embodiment of the present
invention;
[00118] Figure 27b shows the results after applying an exemplary local micro-
contrast
convergence algorithmic sequence to the original image in Figure 27a, in
accordance with at
least one embodiment of the present invention;
[00119] Figure 28a shows a set of original X-ray mammographic images revealing
both the
left and right breast views, in accordance with at least one embodiment of the
present invention;
[00120] Figure 28b shows the results after applying an exemplary local micro-
contrast
convergence algorithmic sequence to the original lower left image (Right
medial lateral oblique
view) in Figure 28a, in accordance with at least one embodiment of the present
invention;
[00121] Figure 29a is an original X-ray mammographic image, in accordance with
at least one
embodiment of the present invention;
[00122] Figure 29b shows the results after applying an exemplary local micro-
contrast
convergence algorithmic sequence to the original mammogram in Figure 29a in
accordance with
at least one embodiment of the present invention;
[00123] Figure 29c is close up view of the lower left section of the original
mammographic
image shown in Figure 29a, in accordance with at least one embodiment of the
present invention;
[00124] Figures 29d to 29f shows the results after applying an exemplary local
micro-contrast
convergence algorithmic sequence to the close up of the original mammogram in
Figure 29c, in
accordance with at least one embodiment of the present invention;
[00125] Figure 30a is a first-generation X-ray image of a mouse known to have
breast cancer
on the right side of its body, in accordance with at least one embodiment of
the present
invention;
[00126] Figure 30b shows the results after applying an exemplary local micro-
contrast
convergence algorithmic sequence to the original X-ray in Figure 30a, in
accordance with at least
one embodiment of the present invention;
16
CA 03108862 2021-02-05
WO 2019/032558
PCT/US2018/045567
[00127] Figure 30c shows the results after applying an edge detection filter
to the exemplary
local micro-contrast convergence algorithmic image in Figure 30b, in
accordance with at least
one embodiment of the present invention;
[00128] Figure 30d is a close up of the left side of the X-ray of the mouse in
Figure 30c, in
accordance with at least one embodiment of the present invention;
[00129] Figure 30e is a close up of the right side of the mouse in Figure 30c,
in accordance
with at least one embodiment of the present invention;
[00130] Figure 31a is a first-generation color (fundus) image of the retina of
an eye, in
accordance with an exemplary embodiment of the present invention;
[00131] Figure 3 lb shows the results after applying an exemplary local micro-
contrast
convergence algorithmic sequence to the original fundus image in Figure 31a,
in accordance with
at least one embodiment of the present invention;
[00132] Figure 32a is a first-generation CT scan of a patient with lung
cancer, in accordance
with at least one embodiment of the present invention;
[00133] Figure 32b shows the results after applying an exemplary local micro-
contrast
convergence algorithmic sequence to the original X-ray in Figure 32a, in
accordance with at least
one embodiment of the present invention;
[00134] Figure 33a shows a set of original X-ray mammographic images revealing
both a left
and right breast view, in accordance with at least one embodiment of the
present invention;
.. [00135] Figure 33b shows the results after applying an exemplary local
micro-contrast
convergence algorithmic sequence to the original X-ray in Figure 33a, in
accordance with at least
one embodiment of the present invention;
[00136] Figure 34a shows a view of a patient's abdomen resulting from a
Positron Emission
Tomography (PET) exam, in accordance with at least one embodiment of the
present invention;
[00137] Figure 34b shows the results after applying an exemplary local micro-
contrast
convergence algorithmic sequence to the original X-ray in Figure 34a, in
accordance with at least
one embodiment of the present invention;
[00138] Figure 35a is a first-generation X-ray image of the head of a dog, in
accordance with
at least one embodiment of the present invention;
[00139] Figure 35b was created by applying the LD algorithm illustrated in
Figure 35a, in
accordance with at least one embodiment of the present invention;
17
CA 03108862 2021-02-05
WO 2019/032558
PCT/US2018/045567
[00140] Figure 36a is a set of multiple-exposure images created by the Hubble
Space
Telescope of a Kuiper Belt object 6.4 billion Km away from Earth, in
accordance with at least
one embodiment of the present invention;
[00141] Figure 36b shows the results after applying an exemplary local micro-
contrast
convergence algorithmic sequence to the original image in Figure 36a, in
accordance with at
least one embodiment of the present invention.
DETAILED DESCRIPTION
[00142] Referring to the drawings in detail, wherein like reference numerals
indicate like
elements throughout, there is shown in Figs. la ¨ 36b systems, devices and
methods, generally
designated, in accordance with exemplary embodiments of the present invention.
[00143] Introduction
[00144] Most image processing and analysis methodologies in medicine, for
example, are
designed to cause areas within an image to diverge, bifurcate, or be isolated
as areas of interest
(AOIs). In these processes, the AOIs may become isolated by applying one or
more sequences of
segmentation algorithms. Many image processing and analysis methodologies,
known as
computer aided detection (CAD) processes, may be designed to be used for
identifying the
presence of breast cancer in mammograms, other diseases in other modalities,
and for
applications outside of medicine. Results of studies have shown that, the CAD
processes used in
breast image analysis have false positive rates of up to 5,000 to 1. The false
positive rate is the
ratio between the number of negative events wrongly categorized as positive
(false positives),
and the total number of actual negative events.
[00145] It is the process of visual or data segmentation of objects of
interest, the bifurcating of
objects in an image, and/or the subsequent isolation from other tissues of the
image (divergence),
that greatly limits the effectiveness of such techniques to clinicians.
Because
bifurcating/segmenting processes remove the context of surrounding
objects/tissues from any
larger context in which the AOIs occur, the diagnostic value of such processes
to doctors are
greatly limited since the location of disease or abnormality within the breast
and its surrounding
tissues limits its use in making improved clinical decisions on possible
outcomes and treatments.
[00146] Many mathematical approaches have been devised to examine original
grayscale
images by utilizing local properties within the image such as luminance
values, running mean
filters, rubber-band straightening transforms, measurements of circularity at
a suspected region
18
CA 03108862 2021-02-05
WO 2019/032558
PCT/US2018/045567
of interest, texture, gradient histogram, and gray level increment analysis.
Many of these
approaches fail to produce acceptable results in areas of the image where the
objects to be
detected are very similar to the values of the surrounding neighborhood
values. A cancer may be
detected, but its margins (boundaries) may not be clearly established. Still
others, utilize machine
.. learning where an atlas of known pathology is compared with an image being
processed for
determining a probability of likelihood based on similarities between the
atlas and the unknown
set of image metrics in the image being analyzed.
[00147] In addition, many CAD methodologies may not improve visualization and
characterization of objects in the processed image as an aid to the
radiologist to visually confirm
.. the extent of the abnormalities or distinguish characteristics of
abnormalities from normal tissue.
Instead, CAD approaches may simply place a location marker within an original
mammogram
image. This further provides a dilemma for a radiologist in that no additional
discriminating
visual information is available to assess the validity of the marker. Using
CAD methodologies,
the radiologist must not only assess the original image for the presence of
cancer or other
.. abnormalities as defined by the American College of Radiology (ACR), but
also assess the
validity of a given marker, while being aware of the very high false positive
rate associated with
the CAD process. Similar deficiencies may exist in a broad spectrum of fields
that use CAD
methodologies or image segmentation algorithmic approaches.
[00148] Thus, there is a need in the art to improve image-processing
techniques beyond those
.. of CAD, bifurcating, or divergence-based processes.
[00149] Breast Cancer Imaging Domain Application
[00150] Mammography is the use of X-ray radiographs to generate an image of a
person's
breast to detect the possible presence of breast cancer or other
abnormalities. While the use of
mammograms is currently the best methodology available for screening to detect
breast cancer,
between 10% and 30% of women with cancer are reported as negative (i.e.,
cancer free). This
may be due in part to the very complex, and often very subtle nature of
detecting cancer in
mammographic images and is especially a serious issue for women with dense
breast tissue (as
defined by the American College of Radiology (ACR) density classification
system) who have a
higher potential of getting breast cancer. Cancer in mammograms appears white,
yet the breast
.. contains non-cancerous elements that also appear white (e.g., dense breast
tissue) and dark (e.g.,
fatty breast tissue). Radiologists more easily observe cancers in fatty
tissue, yet cancers
19
CA 03108862 2021-02-05
WO 2019/032558
PCT/US2018/045567
occurring in dense breast tissue are very difficult to distinguish from
surrounding tissue. Almost
40% of women have breasts that contain at least a portion of dense tissue;
consequently, there is
a significant need to be able to distinguish cancerous lesions regardless of
the level or relative
amount of density in a woman's breast tissue.
[00151] Moreover, when a radiologist determines that breast cancer may be
present in a
mammogram several possible follow-up procedures may be employed. These may
include the
use of ultrasound, MRI with contrast, breast CT scans, and biopsies. These
follow-up procedures
are expensive, are frequently emotionally traumatic to the patient and their
family and, in some
instances, can cause physical trauma. The positive predictive value of
ultrasound, when
indicating the need for a biopsy, is only 9%. Clinically, 91% of patients who
have biopsies
following ultrasound are confirmed by pathology as not having cancer.
Similarly, 60% of
patients having an MM and going on to biopsy do not have cancer. As used
herein, positive
predictive values refer to the probability that subjects with a positive
screening test have the
disease. As used herein, negative predictive value may refer to the
probability that subjects with
a negative screening test do not have the disease.
[00152] Ultrasound patients who have indications of possible disease in a
mammogram may
be sent to have an ultrasound or have an MM exam with contrast. When
ultrasound is
performed, and a radiologist determines from the ultrasound image that a
cancer might be
present, a biopsy is often recommended. Of those patients that had a follow-up
biopsy, based on
an ultrasound, 91% did not have cancer.
[00153] An approach that can reveal cancer with a high degree of sensitivity
and specificity
and utilizing only standard screening and inexpensive imaging (e.g.,
mammograms) will provide
a breakthrough in today's cancer detection environment. Approximately 90% of
breast cancers
arise in the cells lining the ducts of breast tissue. Early detection of
breast cancer may rely on a
clinical capability to distinguish such changes as might be present in an
image. Again, the
presence of local or general dense breast tissue makes this a very challenging
task. As a function
of breast density, dense breasts can be understood to include 5% to 95% dense
breast tissue.
Typically, densities vary throughout the breast volume with some local regions
having greater or
lesser density than other (e.g., different or nearby) regions. Overall, there
may be specific
regions in a woman's breast is very high density and other areas of very low
density containing
fatty tissue. In some women, the entire breast may be extremely dense, while
in others there are
CA 03108862 2021-02-05
WO 2019/032558
PCT/US2018/045567
only spots where high density occurs. Regardless of the amount of density that
is high as a
percentage of a woman's breast, any cancer occurring within a high-density
area is subject to
being misdiagnosed because breast cancer appears white in a mammogram as does
dense breast
tissue often leading to a radiologist inability to discriminate between the
high density and the
cancer itself.
[00154] Breast cancer may develop from normal tissues in one or more different
progressions
of change. Abnormal tissue development may progress from being normal to
Hyperplasia to
Atypical Hyperplasia to ductal carcinoma in situ (DCIS) to invasive DCIS.
Tissues can evolve
from being normal to being an invasive carcinoma with no intervening steps.
Once the tumor
has grown beyond the duct, it is called an invasive carcinoma.
[00155] Currently, only 1% of breast cancers are capable of being detected
when the lesion is
1 mm in size or less.
[00156] The challenges of using computer aided detection and machine-learning
techniques to
detect cancer in images showing local or general variation densities of tissue
are compounded by
the variability associated with the dynamic structure changes that can occur
in living tissues.
Segmentation of disease involving this number of possible combinations makes
it very difficult
to train computers to consistently detect cancer while maintaining a low
number of false
positives.
[00157] Techniques such as standard machine learning protocols, the use of
segmentation
algorithms, and processes for causing only pixels associated with disease to
be isolated (i.e.,
segmented or bifurcated) in images have the issue of having too many
combinations as
possibilities to correctly identify the disease. These processes function best
when there is a
SINGLE object that has unique boundaries associated with the object of
interest. For example,
identifying bacteria in an image generated through a microscope is aided
because bacteria have
definite shapes and sizes and the cell boundaries limit other possible
combinations. As the name
implies, bifurcation of images results in abrupt changes that lead to binary
(yes/no) results and
does not allow for subtle differences at boundaries within a given domain of
image content.
[00158] In contrast, breast cancer, as well as other diseases and
abnormalities, has diffuse
boundaries. The cancer is most often amorphous and multi-patterned. Tissues
may also be in a
variety of transition states. A lesion may have cells that are in the Atypical
Hyperplasia state as
21
CA 03108862 2021-02-05
WO 2019/032558
PCT/US2018/045567
well as being Ductal Carcinoma in Situ, and becoming invasive. Additionally,
both normal and
abnormal breast conditions may include or be affected by:
[00159] = Presence of spiculations and calcifications
[00160] = Presence of necrotic tissue
[00161] = Abundance of dense fibroglandular tissue associated with embedded
cancer
[00162] = Prior surgeries, biopsies, or weigh gain
[00163] = Changes to a woman during her menstrual cycle or from menopause.
[00164] Conventional CAD approaches
[00165] In general, radiographic findings related to breast cancer
generally involve identifying
the presence of two different types of structures, masses and
microcalcifications.
Microcalcifications related to pathology generally occur in ducts and in
association with
neoplasms. Masses are most often correlated with abnormalities and can either
be benign or
cancerous. Fibroglandular tissues within the breast can obscure masses, making
detection
difficult in unprocessed images.
[00166] In mammography, two mammographic views are generally created for each
breast
(cranial/caudal CC and medial lateral oblique MLO), to assure that all breast
parenchyma are
included in the views. This further complicates the task of cancer detection
and quantification in
that it is hard to correlate the presence and dimensionality of structures
between the two different
views.
[00167] Existing computerized diagnostic methodologies typically employ the
following
sequence of processing: suspect lesion > lesion extraction > feature
extraction > classification >
predict probability of malignancy > report probability.
[00168] In these methodologies, it is important to segment or extract
(e.g., cause to divide)
areas of concern to be able to analyze the areas for possible malignancy. For
example, applying
.. equalization or divergence processes to the image differentiate fatty
tissue from dense tissue.
The equalization process is limited in that it is a linear process and has no
specific thresholding
that is optimal for all mammograms. While divergence-type segmentation
algorithms may be
used in separating fatty from dense tissue, it does not effectively support
differentiation of white
cancer areas within white dense breast tissue.
[00169] Binary processes are typically designed to look for specific diseases,
but do not
address other diagnostically important features in mammographic or other
medical images such
22
CA 03108862 2021-02-05
WO 2019/032558
PCT/US2018/045567
as architectural distortions of the breast, degree of asymmetry between
breasts, nipple
retractions, dilated ducts, and skin lesions as defined by the American
College of Radiology
(ACR). While not being cancerous, these features are still of importance to
the clinician and their
patients. While segmentation and bifurcating divergence algorithmic approaches
focus on cancer,
they are not designed to address the overall structures of all tissues in the
image.
[00170] These segmentation techniques often use analysis of gray level
increments in pixels,
to define the boundaries of a possible lesion. Other techniques use
probabilistic interpolation of
pixel data but the interpolation method is limited again by the extreme
similarities between
lesions and dense tissue.
[00171] Local Micro-Contrast-Based Convergence
[00172] In some embodiments of the invention, there are disclosed systems and
methods
associated with image processing methodologies designed to improve
visualization and maintain
context of all tissues by differentially and predictably visualizing and
characterizing all structures
and features within the context of a given image. These embodiments employ a
process of
iterative sequencing of image processing functions that cause the local micro-
contrast patterns
associated with each material type to coalesce (or converge) and consistently
be expressed as
distinctive characteristic patterns within the resulting processed image. In
other words, these
embodiments provide an approach for the characterization of all tissue types
within the context
of the rest of the tissues, rather than attempting to extract or remove
identified tissue types
outside the context of the rest of the tissues.
[00173] Many objects in the real world, such as biological growth, patterns of
neurons,
branching of rivers, corrosion of pipes, and formation of snowflakes, are
statistically self-similar
where the patterns of development show the same statistical properties at many
scales of
magnification. In these patterns, a small piece of the object or pattern is
similar to the patterns at
a larger scale. These self-similar natural patterns are expressed as discrete
pixel neighborhoods
captured in images. An iterative process that may be used in the local micro-
contrast
convergence methodology, as utilized in at least some embodiments of the
invention described
herein, is designed to, and functions in a way, that explicitly visualizes and
characterizes these
self-similar patterns at any scale in the image.
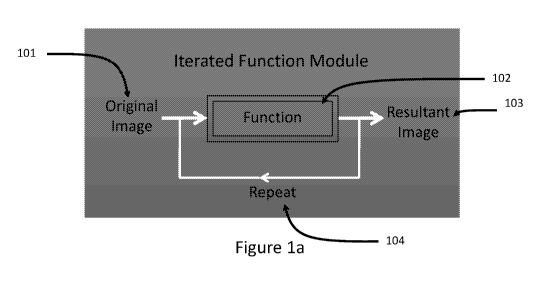
[00174] Figure la shows one embodiment of the local micro-contrast convergence
algorithmic
sequence pathway approach. An original image 101, e.g., a grayscale image 101,
is input into the
23
CA 03108862 2021-02-05
WO 2019/032558
PCT/US2018/045567
Iterated Functional Module processing sequence. The image 101 is then
processed by an image
processing function 102 which either becomes the resultant image 103 or is
further processed by
applying a second, but different image processing function at function 102.
The repeating
process may be applied from 0 to n times.
[00175] Diseases such as cancer exhibit such self-similarity in its growth,
and that growth can
be characterized and visualized at any scale utilizing the local micro-
contrast process where very
small cancerous lesions exhibit the same expressed patterns as large lesions.
[00176] While fractal geometry can generate patterns of nature through the
iteration of
mathematical functions, the approach exemplified in this set of embodiments
mathematically
decomposes the fractal-like patterns generated in biological systems into
identifiable and
measurable expressions of pixel data within an image. Consequently, the local
micro-contrast
convergence algorithms described herein can be mathematically parallel to an
iterative process,
and can visualize tissue patterns such as breast boundaries, cancerous and
benign lesion margins
and cores, and characteristics of breast asymmetry that can be present in
mammographic images.
[00177] As used herein, local micro-contrast convergence may refer to an
iterative sequencing
of image transformations utilizing profile look-up table (PLUT) functions.
[00178] As used herein, the PLUT functions refers to mathematical expressions
in a
matrix/array that specifies image input and output values of an image so that
localized, self-
similar image contrast pixel variables (such as statistically-based co-
occurrence of pixel
neighborhood relationships ¨ textures for example) in the source image, have a
discrete sets of
values (called reconstruction levels) where the pixels in each local
neighborhood (e.g., pixels
having similar characteristics) in the source image are assigned a single
color or luminance value
in a resulting output image.
[00179] Singular or iterative applications of PLUT and other functions in
the local micro-
contrast convergence process can cause relationships among neighboring pixel
groups to
converge or aggregate into repeatable and predictable color and/or luminosity
patterns consistent
with the material's structure and relationship to its imaging modality.
Although tissue/material
types may vary significantly, each tissue/material type possesses common
underlying pixel
neighborhood relationships. The resulting local micro-contrast convergence
patterns expressed
in each area of the image are capable of visually expressing their
characteristic color patterns
based on e.g., the statistically-based distribution of luminance values for
each object or material,
24
CA 03108862 2021-02-05
WO 2019/032558
PCT/US2018/045567
regardless of the presence of surrounding and overlying materials of different
types. For
example, using a local micro-contract convergence algorithm, a breast cancer
lesion in a
mammogram can be characterized with a specific visually-observable and
uniquely quantifiable
pattern regardless if it is in dark fatty or high luminance dense breast
tissue.
[00180] Figure lb shows an original mammogram image 105 and two resultant
images 107,
108 produced using at least some embodiments of the invention. A box outlining
the area of
cancer is shown at 106. Two resultant images are created by two different
local micro-contrast
convergence algorithmic sequences reveal distinctive patterns of the cancer as
shown at 107 and
108. The iterative processing sequence transformed the subtle grayscale
patterns of the original
X-ray of the breast into characteristic pattern responses, such as edges,
boundaries, internal
structures, textures, spiculations, and luminance values and colors associated
with a cancer
response.
[00181] Figure lc illustrates a standard photographic coordinate system used
to plot an image
transformation using 2 nodal points at 109. As used herein, a nodal point
refers to a singular
point on a curve where the direction of the curve is altered. Moving any nodal
point on a curve
alters surrounding aspects of the curve. The input values of the original
image are indicated
along the bottom of the plot (x axis) and the output of the image values are
indicated on the
vertical axis. There are limitations with this approach. Nodal points change
the shape of the
"curve" and modify the relationship between the input values and the output
values of an image.
However, nodal points must be linked so that all parts of the curve are
continuous. Therefore, it
is limited to what can be mapped with continuous and linked values. Non-linear
transformations
utilizing nodal points perform poorly when separation of objects of nearly
equal densities is
desired.
[00182] Currently, feature extraction is completely dependent on the degree to
which objects
have successfully been segmented or extracted from the image's pixel data.
While existing
algorithms are optimally designed to locate the brightest area of a possible
lesion, they often fail
to distinguish the external boundaries of the lesion, an area important in
diagnosis to determine
where angiogenesis is occurring.
[00183] In this application, the one or more local micro-contrast convergence
functions are
without nodal points so that an image can be processed to properly define
possible external
boundaries of a legion (or other feature of interest).
CA 03108862 2021-02-05
WO 2019/032558
PCT/US2018/045567
[00184] Figure id diagrams the hierarchical approach to the implementation of
the local
micro-contrast convergence process. The sequence progresses from the bottom of
the triangle to
the top as it relates to higher levels of processing integration.
[00185] Multi image Modality Fusion is supported in the local micro-contrast
convergence
process. Modality Fusion, as it relates to the embodiment of this application,
is a process of
adapting the input values of images from different types of imaging
modalities, so that the same,
or slightly modified local micro-contrast convergence algorithmic sequences,
can visualize and
characterize, the same types of tissues between different imaging modalities.
A local micro-
contrast convergence pattern would then be similar for a patient's cancer when
viewed in an X-
ray, ultra-sound, breast CT, and MM scan. This allows for combining
information from different
input modalities in a principled way. The imaging-based fusion approach
facilitates early fusion,
in which signals are integrated at the image feature level, and late fusion,
in which information is
integrated at the semantic level using post-processing image feature analytic
tools.
[00186] These data can be used to generate one or more probability
distribution functions
correlated to localized response patterns at one or more vector coordinates to
characterize
materials such as normal, benign, and cancerous breast-tissue-types and
correlate that data from
a multiplicity of X-ray, MM, or ultrasound images, even when the
tissues/materials are overlaid
with other tissue/material types.
[00187] In some embodiments, the Multi-processing Sequencing, Multi-image
Synthesis, and
Modality Fusion, the resultant images can be analyzed, and data correlated
among those images
within an Expert System. Since all tissues are visualized in the local micro-
contrast convergence
process, diseases can both be detected, and their pathology correlated to
their occurrence within
the organ of origin. This provides opportunities for advanced research in
disease prevention and
drug/treatment therapies.
[00188] At least some embodiments of the invention described herein are
capable of
consistently characterizing tissue/material types in images where other
mathematical models,
built on purely deterministic, or deterministic with simple random components
fail, due to the
complex stochastic non-Euclidean fractal-like shapes involving patterns of
growth/development
represented in images of natural processes like those in medicine.
[00189] In some embodiments, the methods are designed specifically to be able
to identify
structures within structures. For example, in medical imaging applications,
the finalized images
26
CA 03108862 2021-02-05
WO 2019/032558
PCT/US2018/045567
provide visual evidence as to the presence and structure of abnormal tissues
in the context of the
remaining structure in the image. The finalized images may also provide a
mechanism to
correlate abnormal objects to other normal and abnormal tissue types. For
example, a cancerous
lesion that is in a milk duct has a different level of concern than a lesion
that has become
invasive or appears to be associated with a lymph node. Similarly, a carcinoma
in proximity to
microcalcifications requires a different clinical interpretation as compared
to a carcinoma next to
the chest wall or in situations where there is significant asymmetry in the
breast.
[00190] An example of an iterative image process is illustrated in Figure
le. Specifically,
Figure le illustrates an exemplary fundamental sequencing of the local micro-
contrast
.. convergence process whereby an Iterated Function Module 110 approach takes
a first image 111
and processes it with a first set of one or more non-linear transfer functions
112 (e.g., local
micro-contrast convergence algorithm). The second image created either becomes
the final
resultant image 120 or, if a next processing step is designed as part of the
algorithm, the first
iteration image 113 is further processed with a second function 114 (e.g., a
second set of one or
more non-linear transfer functions) resulting in image 115. The process can be
iterated one or
more times with different sets of non-linear transfer functions (e.g., a third
set of one or more
non-linear transfer functions or a fourth set of one or more non-linear
transfer functions) applied
within a given algorithmic sequence 116 to 119 to output a resultant image
120.
[00191] In some embodiments, using a same source image 111, a second Iterated
Functional
Module can be applied to the same image 111, but applying different functions
and number of
iterations to reveal different characterizations and relationships among the
tissues. Consequently,
this Multi-process Sequencing approach can provide two distinct
characterizations of the same
objects within the same original image.
[00192] In some embodiments, two or more of the resultant images can be
combined or
merged in a Multi-image Synthesis process to create a new resultant image that
is a composite of
the two resultant images or a composite of one resultant image and the
original image. This
composite image can be further processed or combined with other resultant
images.
[00193] Figure if shows a plot in a coordinate system illustrating a
discontinuous non-linear
transfer function according to at least one embodiment of the invention.
Figure if illustrates one
example of mapping input values of a input image along the x-axis and output
values of an
output image along the y-axis. The graphic plot generated from a PLUT
illustrates the potential
27
CA 03108862 2021-02-05
WO 2019/032558
PCT/US2018/045567
to design discontinuous transformations to apply to images. By using PLUTs
with
discontinuities in the design of the local micro-contrast convergence
algorithms, at least some
embodiments of the Iterative Transformation Module process can better
differentiate margins of
cancers from surrounding tissues, even when the cancers are embedded in dense
breast tissue.
This is a capability that is very limited with the use of nodal point
plotting, or may not be
possible at all, when transforming input to output values in images.
[00194] Figure lg shows a plot in a coordinate system illustrating luminance
values of breast
tissue in a mammogram image. Figure lg illustrates one example of mapping
input values along
the x-axis and output values along the y-axis. Fatty tissue representation 122
is indicated in the
.. luminance area of breast images that contain fatty tissue and dense tissue
representation 123
indicates the luminance area of breast images that contain dense tissues.
Typically, breast cancer
has luminosities much higher than those of fatty tissue. Consequently, it is
important to separate
fatty tissue from dense tissue. Any remapping of luminosities below the red
diagonal line makes
that part of an image darker decreasing the density 124, while those above the
line makes the
values brighter and increases the density 125. The correlation of this image
property distribution
with discontinuous nonlinear transformations built into the PLUT design
reduces time needed for
developing new algorithms for new diseases and imaging modalities.
[00195] Figure 2a illustrates one embodiment where multiple mathematical
functions can be
utilized to create possible PLUT values for multiple image channels to create
different iterations
of a local micro-contrast convergence algorithm for use in applications with
new diseases,
modalities, and applications beyond medicine. Utilizing computer-based
creation of PLUT
sequences can greatly speed the process of developing new algorithmic
sequences for visualizing
new diseases or anomalies.
[00196] In Figure 2a, the x and y axis reflect the input and output values of
an image while
mid-point 126 specifies one possible position of a mid-point for the
coordinate system. Figure 2a
expresses the luminance and color values of an 8-bit image with 256 data
points possible for
luminance and multiple color channel mapping. Three mathematical functions 127
were plotted
automatically and their values indicated within the plot. The blue curve (blue
channel) 128 was
created using f(x)=sin(x). The red channel 129 was created using g(x)=tan(x)
and the luminance
channel 130 was created using h(x)=sec(x). The mid-point 126 (or 0 point) can
be placed in any
position within the coordinate system that best supports the mapping of
mathematical functions
28
CA 03108862 2021-02-05
WO 2019/032558
PCT/US2018/045567
that can be mapped to a PLUT for optimization of tissue/material visualization
and
characterization in an automatic, rather than a laborious manual process.
[00197] Figure 2b shows a matrix representing a grayscale 2D look-up table for
an 8-bit
grayscale image. Level 0 representing black is in the upper left corner of the
grid at 131.
Grayscale luminance levels increase stepwise left to right, and top to bottom
until pure white
level 255 is reached in the lower right-hand corner at 132.
[00198] Exemplary Computer System
[00199] Figure 2c shows a block diagram that illustrates an electronic device
250 for
performing one or more methods according to one or more embodiments of the
present
invention.
[00200] Electronic device 250 may be any computing device for receiving data
from a user or
a remote device, processing data, and generating and/or displaying data.
Electronic device 250
may include communication infrastructure 251, processor 252, memory 253, user
interface 254
and communication interface 255.
[00201] Processor 252 may be any type of processor, including but not limited
to a special
purpose or a general-purpose digital signal processor. In this embodiment,
processor 252 is
connected to a communication infrastructure 251 (for example, a bus or
network). Various
software implementations are described in terms of this exemplary computer
system.
[00202] Memory 253 may include at least one of: random access memory (RAM), a
hard disk
drive and a removable storage drive, such as a floppy disk drive, a magnetic
tape drive, or an
optical disk drive, etc. The removable storage drive reads from and/or writes
to a removable
storage unit. The removable storage unit can be a floppy disk, a magnetic
tape, an optical disk,
etc., which is read by and written to a removable storage drive. Memory 253
may include a
computer usable storage medium having stored therein computer software
programs and/or data
to perform any of the computing functions of electronic device 250. Computer
software
programs (also called computer control logic), when executed, enable
electronic device 250 to
implement embodiments of the present invention as discussed herein.
Accordingly, such
computer software programs represent controllers of electronic device 250.
Memory 253 may
include one or more data stores that store imaging data, software files or any
other types of data
.. files.
29
CA 03108862 2021-02-05
WO 2019/032558
PCT/US2018/045567
[00203] User interface 254 may be a program that controls a display (not
shown) of electronic
device 250. User interface 254 may include one or more peripheral user
interface components,
such as a keyboard or a mouse. The user may use the peripheral user interface
components to
interact with electronic device 250. User interface 254 may receive user
inputs, such as mouse
inputs or keyboard inputs from the mouse or keyboard user interface
components. User interface
254 may display imaging data on the display of electronic device 250.
[00204] Communication interface 255 allows imaging data to be transferred
between
electronic device 250 and remote devices. Examples of communication interface
255 may
include a modem, a network interface (such as an Ethernet card), a
communication port, a
Personal Computer Memory Card International Association (PCMCIA) slot and
card, etc.
Imaging data transferred via communication interface 251 are in the form of
signals, which may
be electronic, electromagnetic, optical, or other signals capable of being
transmitted or received
by communication interface. These signals are provided to or received from
communication
interface 251.
[00205] Exemplary Local Micro-Contrast Algorithms
[00206] Figure 3a shows a mammogram containing very dense breast (as defined
by the
American College of Radiology (ACR) density classification system) with high
density outlined
at 300. The outline at 301 defines the boundary of extreme density containing
cancer at 302.
[00207] Figure 3b shows an exemplary mammogram image after processing the
image using
one or more methods described herein. In this embodiment, only the highest
density areas of the
breast are revealed in color. Fatty and other low-density areas of the breast
image are indicated
in black at 303. Density increases are indicated in steps proceeding from the
outer boundary in
green 300 and progressing inward to the blue 302 and finally black area in the
center 303 where
the greatest development of the cancer exists. Each color represents a
quantifiably different level
of breast density. This quantification provides precise reporting for the
American College of
Radiology BI-RADS (Breast Imaging Reporting and Data System) specification to
indicate the
presence of dense breasts in a woman's mammograms. Additionally, however, this
process can
extend the BI-RADS reporting system to go beyond a simple overall percentage
of the breast
density. It can quantify multiple levels of breast density, specify their
distribution, and estimate
possible risk for the woman. These methods are adaptive and compensate for the
extreme
variability in mammographic image presentations influenced by differences in
the size of the
CA 03108862 2021-02-05
WO 2019/032558
PCT/US2018/045567
breast, the density of the breast, changes during pregnancy, changes with
aging and menopause,
alterations based on the development of cysts, fibro adenomas, calcifications,
the presence of
lesions, and scarring due to trauma, surgeries, and biopsies.
[00208] CI Algorithm
[00209] Embodiments of the CI algorithm are designed to optimize the
expression of high-
density abnormalities in breast tissues by processing original grayscale
mammograms and
revealing the abnormality's boundaries and internal structures. The
algorithmic sequence
provides significant color and brightness differentiation between the
abnormalities and other
normal tissues such that it is easier for clinicians and patients to readily
observe areas of concern.
[00210] Figure 4k is a flow chart illustrating a method 400 for creating a
visualization from a
grayscale image, according to at least one embodiment of the invention.
[00211] At step 401, processor 252 imports a grayscale image. Figure 4a shows
an exemplary
grayscale image of a mammogram, according to at least one embodiment of the
invention.
Figure 4d shows a horizontal gradient representation of Figure 4a. The
gradient grayscale image
provides the full range of luminance levels, as compared with the range
different mammograms
have, so that the full range of colors expressed in the local micro-contrast
convergence
algorithmic sequence can be illustrated. Each step of the algorithmic sequence
described in
Figure 4k can applied to both the mammograms and the gradients, again, for
illustration and
comparative purposes.
[00212] In some embodiments, a processor 252 receives or imports an image
(e.g., grayscale).
In some embodiments, the image is imported from memory 253. In other
embodiments, the
image is imported from a remote device via communication interface 251.
[00213] In some embodiments, the grayscale image is imported for processing as
an input
array or matrix with x and y pixel dimensions and z bits of grayscale or color
depth. In some
.. embodiments, the matrix may contain values of 8, 10, 12, 14 or 16 bits of
luminance per pixel
(Lp). (Lp) is the luminance value of each pixel (p) at a position (x, y) in
the original image. As
the number of bits increase, the greater number of variations in a pixel value
also increases. For
example, if 8 bits are used, then 28 possible pixel values may be assigned to
each pixel. On the
other hand, if 16 bits are used, then 216 possible pixel values may be
assigned to each pixel. By
increasing the number of possible pixel values, the image processing methods
described herein
can increase the variations in the final image.
31
CA 03108862 2021-02-05
WO 2019/032558
PCT/US2018/045567
[00214] At step 402, processor 252 maps the grayscale image to a multi-
dimensional color
space.
[00215] In some embodiments, to map the grayscale image, the grayscale image
is replicated
into additional matrices of identical x/y coordinates for each color component
and luminance
value to form an n-dimensional super-positioned matrix space of color space
layers, where n> 1
forms a new matrix set containing voxels.
[00216] In some embodiments, the grayscale image is replicated using the
following equation:
f(Lp) = Cp,
where the pixel values at each x/y coordinate in the original is mapped to
corresponding x/y
coordinate in each color space layer of the multi-dimensional color space of
C.
[00217] In one embodiment where n = 4, an RGB multi-dimensional color space
can be
defined in terms of four different components: luminance, red, green, and
blue. In these
embodiments, the RGB multi-dimensional color space includes a luminance color
space layer,
and first, second and third color space layers corresponding to blue, red and
green, respectively.
The new matrix C will contain pixel values where R=G=B=Luminance for each
pixel value and
these pixel values are equal to the grayscale image luminance values (Lp). In
some
embodiments, there can be a separate luminance only channel or, in other
embodiments, the
luminance can be generated as a composite of the three other channels. In
another embodiment,
the values can also be expressed for other values of n where, for example, n
has 3 values ¨
luminance, saturation, and hue.
[00218] One of ordinary skill in the art will appreciate that these
embodiments are operable on
matrices of n-dimensions that can be visualized in a wide range of color image
formats other
than the color image formats described herein. The processing of each
mammogram (or other
image) begins with a multi- channel matrix or image. Additional color spaces
may also occur in
color spaces such as HSV, CMYK, CIEXYZ or CIELAB using either xyz or
cylindrical color
spaces.
[00219] At step 403, processor 252 applies a median filter to the multi-
dimensional color
space. In some embodiments, a median filter may refer to a nonlinear digital
image processing
technique, which preserves edges of objects in the multi-dimensional color
space while removing
noise. Noise reduction can improve the results of later processing.
32
CA 03108862 2021-02-05
WO 2019/032558
PCT/US2018/045567
[00220] In some embodiments, the median filter is applied to each pixel in the
multi-
dimensional color space by replacing each pixel value with the median of
neighboring pixel
values. The pattern of neighbors may be referred to as the "window", which
slides, pixel by
pixel, over the entire image. In some embodiments, the median filter is a 3x3
or radius = 1
median filter. In other embodiments, a radius greater than 1 and matrix
combinations such as
5x5, 7x7 can be used.
[00221] At step 404, processor 252 inverts the image whereby black (0) becomes
white (255)
and white becomes black. All other values are proportionally inverted except
the midpoint of the
image values.
[00222] At step 405, processor 252 applies a first set of one or more (e.g.,
PLUT) non-linear
transfer functions to the multi-dimensional color space (e.g., RGB).
Representations of the
resultant images are shown in Figures 4b and 4e.
[00223] Figure 4g shows the color values of the CI PLUT 1 (2D look-up tables)
that have
been optimized to reveal breast structures in this local micro-contrast
convergence algorithmic
sequence after being applied to the image in Figure 4a.
[00224] Figure 4i shows a Cartesian plot illustrating a representation of an
exemplary (e.g,.
PLUT) transfer function applied by the processor 252 to the multi-dimensional
color space to
attenuate low-density breast tissue according to at least one embodiment of
the invention. In this
Cartesian plot, the color space layer input is shown on the x-axis, with
values ranging from -128
to +128. The corresponding output after the (e.g., PLUT) transfer function is
shown on the y-
axis, where the midpoint of the luminance levels of an image are at 0 and the
values range from -
128 to +128. It can be observed that the 0 position in the coordinate plot may
be placed at any
position in the x/y coordinate space.
[00225] In Figure 4i, the red channel is shown at 408, the green channel is
409, and the
luminance channel is 410. In some embodiments, a first (e.g., PLUT) transfer
function (as shown
in Figure 4i) is applied to the luminance color space layer to attenuate low-
density fatty breast
tissue. In some embodiments, the low-density fatty breast tissue has a
luminance value in the
lower 50% range; the lower 40% range; the lower 30% range; the lower 20%
range; or the lower
10% range. In some embodiments, step 405 can cause low-density materials to
appear as one
color and to differentiate the denser materials using other colors.
33
CA 03108862 2021-02-05
WO 2019/032558
PCT/US2018/045567
[00226] At this stage in processing, areas that do not hold a possibility of
having cancer have
been separated from those where possible cancer or other abnormalities can
occur. Additionally,
any lesions in the image now begin to form boundaries and express internal
morphological
structures as micro-contrast neighborhoods converge. Compared with the diffuse
grayscale
mammographic image, visually distinguishable boundaries have been formed based
on tissue
structures. An issue associated with a phenomenon known as center-surround
effect, and limits
human visual perception has been minimized or eliminated. Gray values are
differentially
interpreted by the human vision system based on what is around the object. The
same object
may look brighter against a dark background and darker against a light
background. At least
some embodiments of the invention may allow PLUT values to be determined that
eliminate the
center surround issue affecting perception and detection of cancer in
mammograms; based on
optimal settings for human vision differentiation based on color perception
theory, the image that
the clinician is seeing after the transformation provides greatly enhanced
diagnosis potential for
the tissues being examined.
[00227] Turning back to Figure 4k, at step 406, processor 252 applies a second
set of one or
more transfer functions to the multi-dimensional color space.
[00228] Figure 4h shows the color values of the CI PLUT 2 (2D look-up table)
that has been
optimized to reveal breast structures in this local micro-contrast convergence
algorithmic
sequence after being applied to the image in Figure 4b.
[00229] Figure 4i shows a Cartesian plot illustrating a representation of an
exemplary (e.g,.
PLUT) set of transfer functions applied by the processor 252 to the multi-
dimensional color
space. In Figure 4i, the red channel is indicated at 411 and luminance channel
at 412 are graphic
representations of CI PLUT 2 lookup table in Figure 4h.
[00230] In this Cartesian plot Figure 4i, the color space layer input is shown
on the x-axis,
with values ranging from -128 to +128. The corresponding output after the
transfer function
(shown visually in Figure 4i) is shown on the y-axis, where the midpoint of
the luminance levels
of an image are at 0 and the values range from -128 to +128. In these
embodiments, the values
are applied to the resultant image in Figure 4b to cause fatty breast tissue
to appear as one color
in Figure 4c (e.g., blue and magenta) and to differentiate the denser breast
tissue (gold and red),
and breast boundary (green) using other colors.
34
CA 03108862 2021-02-05
WO 2019/032558
PCT/US2018/045567
[00231] Figures 4c and 4f show exemplary image representations of a mammogram
and
gradient image based on the multi-dimensional color space after applying an
exemplary second
set of one or more non-linear transfer functions to cause low density breast
tissue to appear as
one color and differentiate high density breast tissue, according to at least
one embodiment of the
invention. In Figure 4c, the cancer is revealed in gold 413 and surrounded by
black.
[00232] The values of the high-density areas of a breast image measured in RGB
values in
Figure 4c at 413 are Red>250/Green>165/Blue<50.
[00233] In some embodiments, the design concept of these transfer functions is
employed to
attenuate pixel values in areas of a mammogram outside of the breast tissue.
As a result, one
component of the transfer function values in the PLUT reduce eyestrain on
clinicians in the final
image by assigning a value to the areas of the mammogram outside of the breast
so as not to
interfere with patterns inside the breast area. In some embodiments, step 406
can amplify high
pixel values and attenuate low pixel values to highlight industrial or
veterinarian material
structures of an object and to differentiate other materials using other
colors.
[00234] At step 407, processor 252 displays a visualization image (e.g.,
Figure 4c) based on
the processed multi-dimensional color space.
[00235] Each step of this process further transforms a grayscale mammogram
(and it also
works for MRI and ultrasound images of the breast) into color patterns that
clearly defined
boundaries of abnormal tissues as well as reveal structures of normal breast
tissue, regardless of
size. In this image visualization, cancerous lesions have distinctive patterns
that separate
themselves from all other abnormal and normal tissue structures.
[00236] In the CI visualizations, differences in the characterization of both
cancer and benign
lesions in the visualizations can be differentiated using histogram analysis.
The boundaries of
cancer are clearly defined in the CI visualizations. In addition, differences
in structure inside the
boundaries of the cancer are indicated with characteristic colors and shapes.
This makes it easier
for radiologists to identify boundaries of cancerous and benign structures.
For example, in the
CI visualizations, the greater the number of color changes within the
boundaries of the cancer,
the more advanced the development of the cancerous tissue. Changes in tissue
surrounding
cancerous and benign lesions are also revealed in the CI visualizations. It is
possible that the CI
visualizations may also reveal angiogenesis occurring at the boundaries of
cancerous lesions.
CA 03108862 2021-02-05
WO 2019/032558
PCT/US2018/045567
[00237] In addition to the differentiations described above, in the CI
visualizations, radial
scars vs. cancerous lesions and cancerous lesions vs. fibro adenomas are
differentiated. The CI
visualizations also indicate the presence of developing cancer within milk
ducts before it has
become invasive and surrounding breast tissue. Cancerous tissues can be
correlated with the
presence of microcalcifications.
[00238] Cancerous lesions, as well as all other structures, can be
correlated between different
views of mammograms for a woman such as Cranial-Caudal (CC or view from above)
and
Mediolateral-oblique (MLO or angled view) and be used to correlate data
between studies at
different times. The internal structure characterized for cancer by these
methods is so precise
that it can be used to guide surgeons performing biopsies, lumpectomies, and
for determining
progress for a patient undergoing treatment for cancer.
[00239] LD Algorithm
[00240] Embodiments of the invention regarding the LD algorithm provide
visualizations that
are designed to emphasize extremely fine structures and details in an image
(e.g., original
mammogram) that occur in the very low-density areas of the image.
Diagnostically important
structures such as spiculations and low attenuating lesions become clearly
defined.
[00241] Figure Si is a flow chart illustrating a method 500 for creating a LD
visualization
from a grayscale image, according to at least one embodiment of the invention.
[00242] At step 501, processor 252 imports a grayscale image. Figure 5a shows
an exemplary
grayscale image of a mammogram, according to at least one embodiment of the
invention.
Figure 5d shows a horizontal gradient representation of 256 grayscale values
from black to
white.
[00243] At step 502, processor 252 maps the grayscale image to a multi-
dimensional color
space. The grayscale mapping at step 502 is substantially similar to the
grayscale mapping in
step 402 above.
[00244] At step 503, processor 252 applies a first set of one or more
transfer functions (e.g., a
local micro-contrast convergence algorithm PLUT) to the multi-dimensional
color space.
Examples of the one or more transfer functions are illustrated in Figures 5g
and 5h.
[00245] Figure 5h shows a Cartesian plot illustrating a representation of an
exemplary (e.g.,
PLUT) transfer function applied by the processor 252 according to at least one
embodiment of
the invention. In some embodiments, a first transfer function is applied to
the luminance color
36
CA 03108862 2021-02-05
WO 2019/032558
PCT/US2018/045567
space layer 508 to amplify pixel values representative of low-density areas of
the breast image
while attenuating pixel values representative of high-density breast areas. A
second transfer
function representing a red channel 509, colorizes the breast parenchyma while
leaving the dense
tissue dark. In some embodiments, the low-density fatty breast tissue has a
luminance value in
the lower 50% range; the lower 40% range; the lower 30% range; the lower 20%
range; or the
lower 10% range. The design of this local micro-contrast convergence
algorithm, and its related
PLUT values, function to reveal details in any portion of the image regardless
of the percentage
of low density in the breast. In some embodiments, step 503 can amplify pixel
values
representative of low-density areas of industrial or veterinarian images while
attenuating pixel
values representative of high-density areas.
[00246] Representations of the resultant images produced after step 503 are
shown in Figures
5b and 5e.
[00247] At step 504, the multi-dimensional color space (represented as color
image shown in
Figure 5b) is now converted to an HSL color space. In this embodiment, RGB
values are
converted to luminance, hue, and saturation values, as shown below in the
following example:
(Hue, Saturation, Lightness, Zone)
(0.0, 0.0, 0.2, Red)
(0.0, 0.0, 0.1, Cyan)
(0.0, -1.0, 0, Master)
[00248] The image can be displayed first in RGB color or after conversion in
HSL color space
in step 505.
[00249] The image in Figure Sc (and corresponding image 5f) is created from
the image in
Figure 5b and 5e by setting the master saturation for all hues in the HSL
color space to -100%
saturation. As a result, hue is no longer a factor in the expression of the
image. Luminance values
however, are still adjustable and changing the luminance values of various
hues in the color
space can alter the grayscale representation of those values. In some
embodiments, the red and
cyan luminance values are adjusted to 0.2 and 0.1 respectively. This brightens
the gray values of
the general breast background, highlights the interior portion of dense
tissues such as cancerous
lesions, and creates separation between the fine structure and the fatty
tissue of the breast. The
image can be converted to a single channel image containing only luminance in
step 507 (and
shown in Figure Sc).
37
CA 03108862 2021-02-05
WO 2019/032558
PCT/US2018/045567
[00250] At this stage in processing, areas very fine structures associated
with low-density
luminance values are separated from the low-density, low-frequency areas 510
of the breast
parenchyma, boundary, and chest wall. Compared with the diffuse grayscale
mammographic
image, visually distinguishable boundaries have been formed based on tissue
structures.
[00251] HD Algorithm
[00252] Embodiments of the invention regarding the HD algorithm provide
visualizations that
are designed to reveal details in an image (e.g., original mammogram) that
occur in the very
highest density areas of the image. Structures such as breast abnormalities
and cancerous lesion
are revealed from the surrounding dense bright/white areas and become clearly
defined.
[00253] Figure 6i is a flow chart illustrating a method 600 for creating a HD
visualization
from a grayscale image, according to at least one embodiment of the invention.
[00254] At step 601, processor 252 imports a grayscale image. Figure 6a shows
an exemplary
grayscale image of a mammogram, according to at least one embodiment of the
invention.
[00255] At step 602, processor 252 maps the grayscale image to a multi-
dimensional color
space.
[00256] At step 603, processor 252 applies a first set of one or more non-
linear transfer
functions (e.g., HD PLUT 1 local micro-contrast algorithm) to the multi-
dimensional color
space. Representations of the first set of one or more non-linear transfer
functions are shown in
Figure 6g and 6h respectively. Figure 6g shows the color values of the LD PLUT
(look-up table)
that has been optimized to reveal breast structures in mammographic images.
Figure 6h show
graphic representations in a coordinate system (e.g., that can be created from
the PLUTs in
Figures 6h). In these embodiments, a first transfer function is applied to the
luminance color
space layer to invert the luminance values 606 of the breast image. A red
channel 607 amplifies
the low-density areas of the image while attenuating high-density breast
areas. The green channel
608, graphically shown in Figure 6h as a discontinuous mapping of green
channel values,
colorizes the breast boundary and contributes with the red channel to make the
breast
background a yellow color. In some embodiments, the high-density breast tissue
is greater than a
lower 50% range; a lower 40% range; a lower 30% range; a lower 20% range; or a
lower 10%
range. The blue channel 609 adds color to define the outer boundary of the
breast. The design of
this local micro-contrast convergence algorithm, and its related PLUT values,
can function to
reveal details in any portion of the image regardless of the percentage of
high density in the
38
CA 03108862 2021-02-05
WO 2019/032558
PCT/US2018/045567
breast. In some embodiments, step 603 amplifies the low-density areas of
industrial or
veterinarian images while attenuating high-density breast areas.
[00257] At this stage in processing, areas of the image containing very high-
density tissue
structures 610 are separated from the low-density areas 611 of the breast
parenchyma, boundary,
and chest wall and cancer is further distinguished from among other high-
density areas of the
breast. Compared with the diffuse grayscale mammographic image, visually
distinguishable
boundaries have been formed based on tissue structures.
[00258] The image can then be displayed in multi-dimensional color space step
604 (e.g., as
shown in Figure 6b) or converted to a grayscale image at step 605 before being
displayed (e.g.,
Figure 6c) using a weighted conversion of R, G, and B values to achieve a
luminance value
according to the following formula: 0.30*R + 0.59*G + 0.11*B = luminance
value.
[00259] MC Algorithm
[00260] Embodiments of the invention regarding the MC algorithm provide
visualizations that
are designed to reveal details in an image (e.g., original mammogram) that
occur in the very
highest density areas of the image, mainly small structures such as
calcifications are revealed
from the surrounding dense bright/white areas and become clearly defined.
[00261] Figure 7j is a flow chart illustrating a method 700 for creating a MC
visualization
from a grayscale image, according to at least one embodiment of the invention.
[00262] At step 701, processor 252 imports a grayscale image. Figure 7a shows
an exemplary
grayscale image of a mammogram, according to at least one embodiment of the
invention.
[00263] At step 702, processor 252 maps the grayscale image to a multi-
dimensional color
space.
[00264] At step 703, processor 252 applies a first set of one or more
transfer functions (e.g.,
MC PLUT 1 local micro-contrast convergence algorithm) to the multi-dimensional
color space.
Representations of the local micro-contrast convergence algorithm are shown in
Figures 7h and
7i. Figures 7h shows the color values of the MC PLUT (look-up table) that has
been optimized
to reveal breast structures in mammographic images. Figure 7i show graphic
representations in a
coordinate system. In these embodiments, a transfer function is applied to the
luminance space
706, to discontinuously invert the luminance values of the breast image. The
red channel 707
attenuates a large portion of the image employing a discontinuous mapping of
red channel
39
CA 03108862 2021-02-05
WO 2019/032558
PCT/US2018/045567
values. The green channel 708 values contribute to creating a brown tone to
the high-density
areas of the breast. The blue channel 709 slightly tints the fatty tissue area
of the breast.
[00265] The design of this local micro-contrast convergence algorithm, and its
related PLUT
values, function to reveal the presence of micro-calcifications in any portion
of the image
regardless of the percentage of high density in the breast.
[00266] At this stage in processing, micro-calcification structures, even
in very high-density
areas of the image, are separated from among other high-density areas of the
breast. Compared
with the diffuse grayscale mammographic image, visually distinguishable
calcifications have
been more clearly revealed. In some embodiments, step 703 can reveal the
presence of small
high density structures in any portion of an industrial or veterinarian image
regardless of the
percentage of high density in the surrounding object.
[00267] The image can then be displayed in multi-dimensional color space at
step 704 (e.g.,
Figure 7b) or converted to a grayscale image at step 705 (e.g., Figure 7c)
using a weighted
conversion of R, G, and B values to achieve a luminance value according to the
following
formula: 0.30*R + 0.59*G + 0.11*B = luminance value. Figure 7c is an enlarged
section of the
image in Figure 7b after being converted to grayscale. The small black
microcalcifications 710
can be distinguished from the light background more easily than in the
original image.
[00268] RF Algorithm
[00269] Embodiments of the invention regarding the RF algorithm provide
visualizations that
are designed to emphasize extremely fine structures and details in an image
(e.g., original
mammogram). Structures such as spiculations and milk ducts are clearly defined
as are
structures within high density areas of the rest including those of cancer. In
some embodiments,
the RF visualization is shown as an overlay on the original image to improve
visibility by a user
(e.g., radiologist).
[00270] Figure 8u is a flow chart illustrating a method 800 for creating a RF
visualization
from a grayscale image, according to at least one embodiment of the invention.
[00271] Figures 8b to 8c to 81 to 8m to 8s illustrate the results obtained by
applying multiple
local micro-contrast convergence transformations iteratively beginning with an
original
mammogram at Figure 8a. Figures 8e to 8f to 8n to 8o and 8t illustrate the
results of the same RF
transformational sequence steps as applied to an original gradient grayscale
image at 8d.
CA 03108862 2021-02-05
WO 2019/032558
PCT/US2018/045567
[00272] Figures 8g, 8h, 8p, and 8q show the color values of the RF PLUT (look-
up tables)
that have been optimized to reveal breast structures in mammographic images.
Figures 8i, 8j, 8k
and 8r show graphic representations in a coordinate system (e.g., that can be
created from the
PLUTs in Figures 8g, 8h, 8p, and 8q.
[00273] At step 801, processor 252 imports a grayscale image. Figure 8a shows
an exemplary
grayscale image of a mammogram, according to at least one embodiment of the
invention.
[00274] At step 802, processor 252 maps the original grayscale image to a
multi-dimensional
color space.
[00275] At step 803, processor 252 applies a median filter of radius 1 to the
multi-dimensional
color space of the original grayscale image.
[00276] At step 804, processor 252 applies a convolution filter to the multi-
dimensional color
space of the original image. In some embodiments, convolution filtering can be
used to modify
the spatial frequency characteristics of an image.
[00277] In operation, the convolution filter 804 is applied to each pixel
in the multi-
dimensional color space by replacing each pixel value with a weighted average
of the pixel value
and its neighboring pixel values. The pattern of neighboring pixel values is
called the "window",
which is applied, pixel by pixel, over the entire image. In some embodiments,
the convolution
filter is a 3x3 or radius = 1 convolution filter. In other embodiments, matrix
combinations such
as 5x5, 8x8 can be used.
[00278] In one embodiment, the values of the 3x3 convolution filter matrix are
shown in
Table 1 as follows:
-4 -1 0
0 1 -1
6 0 1
Table 1
[00279] At step 805, processor 252 copies the multi-dimensional color space of
the processed
image after step 804.
[00280] At step 806, processor 252, imports a duplicate of the same grayscale
original image
as utilized at step 801.
[00281] At step 807, processor 252 maps the duplicate image to a multi-
dimensional color
space.
41
CA 03108862 2021-02-05
WO 2019/032558
PCT/US2018/045567
[00282] At step 808, processor 252 applies a first set of one or more
transfer functions (e.g.,
local micro-contrast convergence transfer function RF PLUT 1) to the multi-
dimensional color
space of the duplicate image. In these embodiments, a first transfer function
(e.g., of local
micro-contrast convergence function RF PLUT 1) is applied to the luminance
color space 814 to
elevate darker values of the image and attenuate mid tones. In some
embodiments, step 808 can
elevate darker values of the industrial or veterinarian image and attenuate
mid-tones.
[00283] In these embodiments, a second transfer function, step 809 (e.g., of
local micro-
contrast convergence function RF PLUT 2) is applied to the luminance color
space 815 to further
attenuate mid tones. In these embodiments, mid tones are attenuated to a
minimum at a
luminance value of 1 in an image of 8-bit grayscale luminance range (0-255).
In some
embodiments, fatty tissue is elevated slightly at a maximum peak level 47 and
transformed to 71.
As a result, fatty tissue 816 is separated from the dense areas of the breast
817. In some
embodiments, step 809 can slightly elevate low-density areas of industrial or
veterinarian image
and attenuate mid-tones.
[00284] Figures 8i, 8j, 8k and 8r show Cartesian plots illustrating a
representation of an
exemplary PLUT transfer function (e.g. and generated from PLUTs applied by the
processor
252) according to at least one embodiment of the invention. In these Cartesian
plots, the color
spaces, coordinates, and values have been previously described and illustrated
in Figure 2a.
[00285] Figure 8b shows an exemplary image of a mammogram based on the multi-
dimensional color space after applying the first set of one or more transfer
functions to elevate
darker values of the image and attenuate mid tones, according to at least one
embodiment of the
invention.
[00286] Figure 8c shows an exemplary image of a mammogram based on the multi-
dimensional color space after applying a second set one or more transfer
functions to further
attenuate mid tones, according to at least one embodiment of the invention.
[00287] In Figure 81, at step 810, processor 252 applies a third set of one or
more transfer
functions (e.g., local micro-contrast convergence function RF PLUT 3) to the
multi-dimensional
color space of the image in Figure 8c to result in image shown in Figure 81.
In these
embodiments, the third transfer function is applied to the luminance color
space 818 create a
discontinuous invert in the luminance values. In some embodiments, step 810
can discontinuous
invert in the luminance values of industrial or veterinarian images.
42
CA 03108862 2021-02-05
WO 2019/032558
PCT/US2018/045567
[00288] In these embodiments, other "color" functions 819 of the third set of
transfer
functions can be applied to the color space layers to add subtle color hues.
[00289] At step 811, processor 252 applies a fourth set of one or more
transfer functions (e.g.,
local micro-contrast convergence function RF PLUT 4) to the multi-dimensional
color space of
the image in Figure 81 to result in image shown in Figure 8m. In some
embodiments, the RF
PLUT 4, also shown graphically in Figure 8q, is applied to the luminance
channel 820 to create
an increase in the luminance values of the lower densities of the image and to
expand the tonal
values associated with cancer and further define the breast boundary. In some
embodiments, step
811 can increase the luminance values of the lower densities of industrial or
veterinarian images
to expand the tonal values associated with structural defects and further
define the objects
boundaries.
[00290] At step 812, processor 252 merges the processed multi-dimensional
color space from
the image in step 811 (e.g., Figure 8m) with the copied image from step 805
(e.g., Figure 8a) by
employing a multiply blend. In some embodiments, the two images are blended
with an opacity
of 100%. As a result, the merged image has an emphasis on high frequency
structures and
attenuation of low frequency information with the highest densities remaining
in color.
[00291] In these embodiments, and other embodiments employing a merging
function, the
merging function can be utilized to allow mathematical functions to be applied
to one or more
resultant images that utilize optimal qualities from each of the combining
images for a specific
purpose. For example, an image expressing the boundaries of cancer tissue in
an image may be
combined with an image expressing high frequency information. Such a
combination can
simultaneously show the extent of a cancer as it relates to possible high-
frequency structures
such as spiculations and calcifications within the tumor.
[00292] Figure 8t shows an exemplary image of a mammogram after, at step 812,
merging of
the color spaces of the two images from 805 and 811, applying a merging
function of 50%, and
converting to grayscale at step 813 according to at least one embodiment of
the invention.
[00293] In some embodiments, an image can be superimposed with additional
matrices
(layers) that contain either additional images or processing functions such as
convert to black and
white or incorporate layers generated from previous processing such as from
high-pass filtering.
Features include, but are not limited to, create new, paste, flatten,
duplicate, make adjustment
layer, and merge functions.
43
CA 03108862 2021-02-05
WO 2019/032558
PCT/US2018/045567
[00294] GI Algorithm
[00295] Embodiments of the invention regarding the GI algorithm provide
visualizations that
are designed to isolate, visualize, and characterize high-density structures
and details in an image
(e.g., original mammogram), and display them in a grayscale resultant image.
Variations within
the dense breast tissue are reflected in the darker areas of the image.
Structures such as cancerous
and benign lesions are clearly defined as are structures within high density
areas. In some
embodiments, the GI visualization is designed to improve visibility of
abnormalities by a user
(e.g., radiologist).
[00296] Figure 9q is a flow chart illustrating a method 900 for creating a GI
visualization
from a grayscale image, according to at least one embodiment of the invention.
[00297] Figures 9b to 9c to 9m to 9n illustrate the results obtained by
applying multiple local
micro-contrast convergence transformations iteratively beginning with an
original mammogram
at Figure 9a. Figures 9e to 9f to 90 to 9p illustrate the results of the same
RF transformational
sequence steps as applied to an original gradient grayscale image at 9d.
.. [00298] Figures 9g to 9h to 9k show the color values of the RF PLUT (look-
up tables) that
have been optimized to reveal breast structures in mammographic images.
Figures 9i, 9j, and 91
show graphic representations in a coordinate system (e.g., that is created
from the PLUTs in
Figures 9g, 9h, and 9k respectively).
[00299] Referring now to Figure 9q, at step 901, processor 252 imports a
grayscale image.
Figure 9a shows an exemplary grayscale image of a mammogram, according to at
least one
embodiment of the invention.
[00300] At step 902, processor 252 maps the original grayscale image to a
multi-dimensional
color space.
[00301] At step 903, processor 252 applies a first set of one or more
transfer functions (e.g.,
local micro-contrast convergence transfer function GI PLUT 1) to the multi-
dimensional color
space of the image. In these embodiments, one or more transfer functions are
applied to the
luminance color space 912 to non-linearly invert the luminance values of the
image (e.g., as can
be seen in figures 9g GI PLUT 1 lookup table and graphic representation of the
PLUT in Figure
9i).
44
CA 03108862 2021-02-05
WO 2019/032558
PCT/US2018/045567
[00302] At step 904, processor 252 applies a second set of one or more
transfer functions
(e.g., local micro-contrast convergence function Figure 9h GI PLUT 2) to
process the multi-
dimensional color space image illustrated in Figure 9b.
[00303] Figure 9c shows an exemplary image of a mammogram based on the multi-
dimensional color space after performing step 904 to further isolate high-
density areas of the
mammogram, according to at least one embodiment of the invention.
[00304] The process performed at step 904 discontinuously alters the luminance
channel 913
while adding color to the image with a discontinuous mapping of the red
channel 914, and a low
value non-linear set of values in the green channel 915. In these embodiments,
the resultant
image in Figure 9c shows that the low-density tones are colored orange. In
some embodiments,
the red values of the low densities have values between 174 to 175 depending
on the distribution
in the original image. High density areas are bright, and boundaries of high
density areas become
dark. In some embodiments, step 904 can brighten high density areas and darken
the boundaries
associated with structural defects in industrial or veterinarian images.
[00305] At step 905, processor 252 applies a third set of one or more
transfer functions (e.g.,
local micro-contrast convergence function GI PLUT 3) to the multi-dimensional
color space of
the image in Figure 9c to result in image shown in Figure 9m. In these
embodiments, the third
transfer function is applied to the luminance channel 916 to amplify the low,
mid, and high
values with attenuated values between the amplified values as seen in Figures
9k and 91. This
greatly separates tonal values in the resultant image and separates the breast
from the
background, emphasizes possible cancerous areas of the breast, and further
defines the core of
possible lesions in blue 918. The values in some lesions have a value of blue
= 200 +/- 5. In
some embodiments, step 905 can greatly separates tonal values in the resultant
image and
separates the detailed structures from the background, emphasizes possible
structural defects of
the object, and further defines the core of possible objects in industrial or
veterinarian images.
[00306] The red channel 917 of the third set of transfer functions are applied
to the color
space layers to add distinctive color hues to the breast 919.
[00307] The color image shown in Figure 9m is now converted to an HSL color
space in step
904 with RGB values being converted to luminance, hue, and saturation values.
The image can
be displayed first in RGB color or after conversion in HSL color space in step
906.
CA 03108862 2021-02-05
WO 2019/032558
PCT/US2018/045567
[00308] The resultant image (e.g., Figure 9n) can be displayed in step 907
based on the
processed multi-dimensional color space.
[00309] The image in Figure 9m is altered in step 908 by setting the
saturation for all hues in
the HSL color space to -100% saturation. As a result, hue is no longer a
factor in the expression
of the image.
[00310] In step 909, the desaturated HSL color image in Figure 9m is merged
(blended) with
the original image in Figure 9a employing a darken blend. If the pixels of the
processed image
are darker than the ones on the original image, they are kept in the image. If
the pixels in the
processed image are lighter, they are replaced with the tones on the original.
[00311] In step 910, processor 252 adjusts the opacity so that the blending is
altered to 60% of
its total effect.
[00312] The blended and then merged image is then converted to a single
luminance channel
to form a grayscale image as shown in Figure 9n. Details in the final image
reveal a large
cancerous tumor in the upper part of the breast. The GI local micro-contrast
convergence
algorithmic process has revealed the extent of the lesion 920, defined its
boundaries, and
revealed details within the core of the lesion. Use of other local micro-
contrast convergence
algorithmic sequences embodied in this document, can then be correlated to the
identified area
for further analysis and to discriminate between normal high-density tissues,
benign, and
cancerous lesions.
[00313] The image can be converted to a single channel image containing
luminance only in
step 911 using a weighted conversion of R, G, and B values to achieve a
luminance value
according to the following formula: 0.30*R + 0.59*G + 0.11*B = luminance
value.
[00314] RB Algorithm
[00315] Embodiments of the invention regarding the RB algorithm provide
visualizations that
are designed to isolate and clearly defined boundary and internal structures
within high density
areas of the breast including those of cancer while the rest of the breast is
revealed as a dark
gray.
[00316] Figure lOw is a flow chart illustrating a method 1000 for creating a
RB visualization
from a grayscale image, according to at least one embodiment of the invention.
[00317] Figures 10b to 10c to 10m to 10n to lOs to 10t illustrate the results
obtained by
applying multiple local micro-contrast convergence transformations iteratively
beginning with an
46
CA 03108862 2021-02-05
WO 2019/032558
PCT/US2018/045567
original mammogram at Figure 10a. Figures 10e to 10f to 10o to 10p, to 10u to
10v illustrate the
results of the same RB transformational sequence steps as applied to an
original gradient
grayscale image as shown in Figure 10d.
[00318] Figures 10g, 10h, 10k, and 10q show the color values of the RB PLUT
(look-up
tables) that have been optimized to reveal breast structures in mammographic
images. Figures
10i, 10j, 101, and lOr show graphic representations in a coordinate system
(e.g., that is created
from the RB PLUTs in Figures lOg to 10h, 10k, and 10q respectively).
[00319] At step 1001, processor 252 imports a grayscale image. Figure 10a
shows an
exemplary grayscale image of a mammogram, according to at least one embodiment
of the
invention.
[00320] At step 1002, processor 252 maps the original grayscale image to a
multi-dimensional
color space.
[00321] At step 1003, processor 252 applies a median filter of radius 3 to the
multi-
dimensional color space of the original grayscale image.
[00322] At step 1004, processor 252 applies a first set of one or more
transfer functions (e.g.,
a local micro-contrast convergence transfer function RB PLUT 1) to the multi-
dimensional color
space of the duplicate image. In these embodiments, first set of one or more
transfer functions
(as shown in Figure lOg and luminance transfer function 1012 of Figure 10i) is
designed to the
discontinuously darken the luminance channel 1012 to darken the low- and mid-
density areas
values of the image as shown in Figures 10b and 10e. In some embodiments, step
1004 can alter
the contrast and reduce the luminosity of the low-density areas in industrial
or veterinarian
images.
[00323] In these embodiments, at step 1005, processor 252 applies a second set
of one or
more transfer functions (e.g., local micro-contrast convergence function RB
PLUT 2) 10h to the
multi-dimensional color space. For example, in Figure 10j, transfer functions
are applied to the
luminance 1013, red 1014, and blue 1015 color space layers. Figure 10c shows
an exemplary
image of a mammogram based on the multi-dimensional color space after applying
a second set
of one or more transfer functions, according to at least one embodiment of the
invention.
[00324] The luminance channel is altered to increase the contrast of the
image. The red
channel discontinuously elevates the dark areas of the image, reduces the
highlights, and "flat-
lines" the mid tones. The blue channel is reduced in value to control tonal
values in the color
47
CA 03108862 2021-02-05
WO 2019/032558
PCT/US2018/045567
image. In some embodiments, step 1005 can alter the luminance channel to
increase the contrast
of industrial or veterinarian images.
[00325] At step 1006, processor 252 applies a third set of one or more
transfer functions (e.g.,
third local micro-contrast convergence function RB PLUT 3 Figure 10k and plot
101) to the
multi-dimensional color space of the image in Figure 10c to produce the image
shown in Figure
10m. In some embodiments, a transfer function is applied to the luminance
channel 1016 to
create a discontinuous "flat line" in the low-density areas of the image,
attenuates the mid-tones,
and slightly reduces the high-density luminance values. The red, green, and
blue channels 1017
have transfer functions applied that colorize the low-density areas of the
breast area. In these
embodiments, other "color" functions of the third set of transfer functions
are applied to the color
space layers to add uniform color hues to the breast image. In some
embodiments, step 1006 can
alter the luminance channel to create a discontinuous "flat line" in the low-
density areas of the
image, attenuates the mid-tones, and slightly reduces the high-density
luminance values of
possible structural defect objects in industrial or veterinarian images.
[00326] At step 1007, the colors of the image shown in Figure 10m are inverted
to create
resultant image in Figures 10n in the mammogram and 10p in the gradient.
[00327] At step 1008, processor 252 applies a fourth set of one or more
transfer functions
(e.g., fourth local micro-contrast convergence function RB PLUT 4) 10q to the
multi-
dimensional color space image in Figure 10n to result in the image shown in
Figure 10s. Figure
10r shows that the luminance values 1018 of the low densities are brought to a
maximum 255
level for all luminance values < 74, another peak for mid-tones and for the
brightest areas of the
image. The red channel 1019 attenuates the low densities while maximizing the
high densities
with values set at 255 for all luminance values > 160. The green channel 1020
contributes to the
color hues of background and breast tissues. In these embodiments, the RB PLUT
4 Figure 10q,
also shown graphically in Figure 10r, is applied to the luminance color space
to differentiate the
breast from the outside of its boundary. In some embodiments, step 1008 can be
applied to the
luminance color space to differentiate the structural defect objects in
industrial or veterinarian
images from the outside of its boundary.
[00328] At step 1009, the color image shown in Figure lOs is converted to an
HSL color space
with RGB values being converted to luminance, hue, and saturation values. The
image can be
48
CA 03108862 2021-02-05
WO 2019/032558
PCT/US2018/045567
displayed first in RGB color or after conversion in HSL color space at step
1010. An exemplary
HSL color space conversion is as follows:
(Hue, Saturation, Lightness, Zone)
(0.0, -1.0, -0.3, Magenta)
(0.0, -1.0, 0.3, Red)
(0.0, -1.0, -0.4, Yellow)
(0.0, -1.0, -0.4, Cyan)
(0.0, -1.0, 0.2, Blue)
(0.0, -1.0, -0.1, Green)
[00329] The final image in Figure 10t is created from the image in Figure lOs
by setting the
master saturation for all hues in the HSL color space to -100% saturation. As
a result, hue is no
longer a factor in the expression of the image. Luminance values however, are
still adjustable
and changing the luminance values of various hues in the color space can alter
the grayscale
representation of those values.
[00330] In step 1011, the image is converted to a single channel image
containing luminance
only. In this embodiment, all areas of non-pathology are revealed in the
uniform gray 1021 of the
breast image area where the average luminance value may be 130. This
separation of possible
areas of abnormalities 1022 reduces the "dwell time" for a radiologist, that
is, the time they must
spend investigating all areas of an image to locate the highest probability
areas where cancer
could occur.
[00331] Consistency of local micro-contrast convergence algorithm
[00332] Figures 11 a through lld illustrate the consistency with which one
embodiment of this
application performs across different imaging modalities. The pattern
responses for breast
images reveal consistent colors and tissue characterizations for modalities 3D
Tomosynthesis in
Figure 11a, synthetic 2D from 3D in Figure 1 lb, Full Field Digital
Mammography (FFDM) in
Figure 11 c, and digitized film in Figure 11d. This provides a radiologist and
their patients the
ability to compare changes over time using only one set of algorithms, even
when a patient's
images were generated historically using different imaging modalities. These
results verify one
of the capabilities inherent in the local micro-contrast convergence approach
as indicated in the
local micro-contrast convergence hierarch of features identified as Modality
Fusion in Figure ld.
49
CA 03108862 2021-02-05
WO 2019/032558
PCT/US2018/045567
[00333] Figure lie shows an X-ray view of cancer in an exemplary mammogram
image
generated from excised breast tissue removed in surgery. Figure llf shows an
exemplary
mammogram image after processing the image using one or more methods described
herein.
The original image was processed using the CI Algorithm described earlier in
this document.
The black and magenta boundaries of the cancer 1101 are clearly defined, as
are the changes in
color inside of the boundaries 1102 indicating the extent of cancer
development. Differences in
color mapping of the interior of the cancer using the CI Algorithm can be
correlated to known
pathology and be used to indicate the structural differences in the tissue
that may indicate
angiogenesis, direction of growth, and the presence of necrotic tissue. The
patterns may be
further utilized to guide surgeries, immunotherapy applications, and biopsies.
The patterns can
also be utilized to monitor changes in a tumor during and after medical
treatments such as chemo
therapy, hormone therapy, immunotherapy, and radiation.
[00334] Embodiments of the invention, described herein, include methods that
utilize a multi-
algorithmic, multi-dimensional, computer-based process for the visualization
and
characterization of features, in context, in images. These local micro-
contrast convergence
methods are applicable in applications where the features are less than 1 mm
in size, less than
900 microns in size, less than 850 microns in size, less than 800 microns in
size, or less than 750
microns in size.
[00335] Figure llg shows an enlarged view of a mammographic X-ray known to
contain
cancer 1103. Figure 11h shows an exemplary mammogram image after processing
the image
using one or more of the methods described herein. In Figure 11h, the black
boundary of the
cancer 1104 using the CI Algorithmic process described earlier in Figures 4a-
4k is clearly
defined as are details inside of the core of the cancer. The progression from
yellow, to red to blue
within the cancer show a progression cancer development to as small a size in
the blue core 1105
being a size of only 980 microns. Multiple algorithmic expressions that are
embodiments of the
invention provide different characterizations and visualizations of the same
tissue.
[00336] These methods are even applicable in applications where a feature of
interest is
located within another feature, where the feature of interest is less than 900
microns in size, less
than 850 microns in size, less than 800 microns in size, or less than 750
microns in size and
where the first feature is 1 mm in size or larger. In some embodiments, the
feature of interest is
between 700 and 900 microns in size.
CA 03108862 2021-02-05
WO 2019/032558
PCT/US2018/045567
[00337] In some embodiments, structures as small as 750 nm (microns) are
identified using
the above methods. Based on X-ray images where a pixel represents a dimension
of breast tissue
that is 75 nm in size, cancer cores can be expressed and characterized in
sizes from 750 nm to 1
mm. It has been determined, through clinical testing, that structures as small
as 500 nm can be
revealed and differentiated in images whose pixel dimensions are 50 nm or
smaller.
Consequently, cancers of various forms as well as Ductal Carcinoma in Situ and
precancerous
Atypical Hyperplasia have been revealed using these methods in standard
mammograms.
[00338] In some embodiments, structures (e.g., cancer cells or
boundaries/cores of cancer
cells) as small as 0.45 nm are visualized and characterized using embodiments
of methods
described herein. Based on images created using photo microscopy, cancer cores
and boundaries
within individual cancer cells shown at 1201 in Figure 12a can be expressed
and characterized in
the same patterns shown 1202 in Figure 12b as those visualized and
characterized in aggregates
of cancerous tissues as viewed in mammograms 108 in Figure lb using
embodiments of methods
described herein. Similar characterizations of cancerous lesion patterns can
be observed and
quantified when the cancer or other living tissues are grown in a culture
medium.
[00339] In some embodiments, structures as small as about 200 nm (nanometers)
are
visualized and characterized using embodiments of methods described herein. In
some
embodiments, structures as small as about 75 nm (nanometers) are visualized
and characterized
using embodiments of methods described herein. Based on images created using
Atomic Force
.. microscopy, the surface of cancer cells shown at 1301 in Figure 13a can be
expressed and
characterized in the same patterns shown 1303 in Figure 13b, and enlarged view
of 13b shown in
Figure 13c as those visualized and characterized in aggregates of cancerous
tissues as viewed in
mammograms 108 in Figure lb and 1202 in Figure 12b using embodiments of
methods
described herein. Arrows 1302 and 1304 represent a connection or relationship
between pixels
areas on the original grayscale image 1301 with the same pixel areas in the
processed image
1303 and enlarged view of 1303 shown at 1305.
[00340] Figure 13d illustrates the consistency of patterns expressed for
cancer at different
scales of magnification using different imaging modalities by applying the CI
local micro-
contrast convergence algorithm to each original image. Scale 1306 shows the
metric scale of
length from Angstroms to meters. The image 1307 is a visualization of the CI
algorithm
reflecting the pattern of a small part of the surface of a cancer cell at 200
in in size when the
51
CA 03108862 2021-02-05
WO 2019/032558
PCT/US2018/045567
original image was generated by an Atomic Force microscope that had a pixel
resolution of
20 nm. The image 1308 is a visualization of the CI algorithm reflecting the
pattern of cancer at
the cellular level which ranges from 0.45 [tm to 2.6 [tm in length when the
original image was
generated by microscopy. The image 1309 is a visualization of the CI algorithm
after
processing an original mammogram generated using Full Field Digital
Mammography (FFDM)
with a pixel resolution of 50 p.m. It reflects the pattern of cancer when it
is forming as ductal
carcinoma in situ (DCIS) which ranges from 900 [tm to 2 mm in size. The image
1310 is a
visualization of the CI algorithm after processing an original mammogram
generated using Full
Field Digital Mammography (FFDM) with a pixel resolution of 50 p.m. It
reflects the same
pattern of cancer seen in the nm and p.m ranges but now are visualized in
sizes from millimeters
to centimeters in dimension.
[00341] Embodiments of the invention, described herein, include methods that
utilize a multi-
algorithmic, multi-dimensional, computer-based process for the visualization
and
characterization of features of specific tissues in a patient or animal, in
context, in images
acquired from different imaging modalities. As a result, correlations of
patterns can be made for
a given tissue type among the images from more than one imaging modality. For
example,
Figures 14a, 14d, and 14g are resultant first-generation breast images created
by X-ray,
ultrasound, and CT scans respectively. Figures 14b, 14e, and 14h are resultant
images obtained
by applying the RF algorithm illustrated in Figure 8u from step 801 to step
812. Figures 14c, 14f,
and 14i respectively were created by applying the RB algorithm illustrated in
Figure lOw from
step 1001 to step 1010 and then applying an edge detection filter on the
output image from step
1010. This sequence of steps may be referred to herein as CR algorithm.
[00342] The cancer in each of the images is shown at cancer lesions 1401 -
1409 in Figures
14a-14i, respectively. Cancer 1esion1402, cancer lesion 1405, and cancer
lesion 1408 all reveal
similar patterns for the cancer even though they were generated using
different imaging
modalities and embodiments described herein. Similarly, cancer lesion1403,
cancer lesion 1406,
and cancer lesion 1409 reveal the densely-packed contour patterns associated
with cancerous
lesions, even though the originating images were generated from different
imaging modalities.
[00343] In some embodiments, the CR algorithm provides visualizations that are
designed to
reveal details in an image (e.g., original mammogram) that are mapped as
contours within areas
of abnormalities that can characterize differences between types of
abnormalities. The luminance
52
CA 03108862 2021-02-05
WO 2019/032558
PCT/US2018/045567
values of contour lines can vary in intensity depending on the relative
contrast within the
abnormalities. Additionally, contours that are very tightly spaced provide
different diagnostic
properties than those that are wider or more broadly distributed. For example,
Figure 15a shows
a subsection of a mammogram containing a very diffuse benign lesion 1501 in
dense breast
tissue. Figure 15b shows the resultant contour pattern of the benign lesion
502 after processing
with the CR algorithm. The pattern is very diffuse with many light contour
patterns not
containing a central core. Figure 15c shows a mammogram taken following breast
surgery and
there is a remaining scar representation 1503 that appears white at Figure
1503. Contours of the
scar representation 1504 revealed from the original mammogram in Figure 15c by
the CR
algorithm are shown in Figure 15d. Scar representation 1504 shows a small core
but wide areas
of either no contours or very light contours. Figure 15e shows a magnified
view of a
mammogram image containing cancer represented by cancer lesion 1505. After
processing the
image shown in Figure 15e using the CR algorithm, the image shown in Figure
15f is generated.
Contours of the cancer lesion 1506 reveals very tightly packed contours with a
dark core that is
associated with cancers of this type.
[00344] Some embodiments of the invention, described herein, include methods
that utilize
more than one algorithmic approach for processing digital image data for the
purposes of
visualizing and characterizing tissue structures, as described herein. Figure
16a shows a close-up
of a mammogram with a cancerous mass and large cluster of calcifications 1601.
Figure 16b is a
resultant image created from processing the original image in Figure 16a using
the MC
algorithm. This algorithmic sequence can be designed to remove darker
luminance values having
a value below 100 in an 8-bit grayscale image to isolate high luminance pixel
values from their
background. This provides a mechanism for subtracting areas containing fatty
breast tissue (fat
subtraction, where fat is represented as a darker color than breast tissue) in
mammograms to
assist clinicians in better assessing the image and locating calcifications
and their shapes in
diagnosing cancer.
[00345] In another embodiment, Figure 16c shows the result of processing the
original image
in Figure 16a using the LD algorithm. This algorithm differentiates low
luminance pixel value
relationships in the image while still preserving the highest luminance value
pixels. In Figure 16c
.. at element 1603 and element 1604, the cancerous mass associated with the
calcifications is
clearly defined as compared with the diffuse areas in the original image shown
in Figure 16a. At
53
CA 03108862 2021-02-05
WO 2019/032558
PCT/US2018/045567
element 1605 and element 1606, the furthest extent of the boundaries (margins)
of the mass are
also more clearly defined as compared with the original image Figure 16a.
Embodiments of the
invention utilizing the local micro-contrast convergence algorithmic approach
provide the basis
for visually characterizing tissues in medical images or materials in
industrial applications that
support feature identification and assessment for machine learning
methodologies.
[00346] Figure 17 shows an exemplary process for creating areas of interest
(AO') for
machine learning using an exemplary local micro-contrast convergence
algorithmic sequence,
AOI extraction, feature extraction, feature analysis, principal component
analysis, and generating
probabilities of the occurrence of cancer according to at least some
embodiments of the
invention. Image 1709 shows the result of processing a close-up view of a
mammogram using
the CI algorithm as described in Figure 4k. Areas of interest associated with
known patterns of
abnormalities in mammograms are shown at element 1701 of image 1709. This
element 1701 is
then isolated as shown at element 1702 in image 1710 using metrics associated
with color
patterns. In this example, colors containing yellow-gold, red, blue, and the
black boundary of the
abnormality are isolated from the processed image 1709. The isolated pixel
values of the colors
in element 1702 are extracted in step 1703 and a new image is made of only the
extracted
processed pixel values represented by element 1708 in image 1711. The area of
interest 1702 is
identified by scanning the pixels of the processed image to identify certain
expressed color
patterns (e.g., gold and red). In one possible embodiment, a second step
involves mathematically
determining the central point within any area of certain color pixels (e.g.,
gold pixels). This
central point becomes the anchor or center for creating concentric circles
outward from the
center to identify the location of the pixels forming a color boundary (e.g.,
black boundary) of
the cancer as revealed consistently by the CI algorithm. All pixels outside of
the color boundary
are then removed from the AOI image. In another embodiment, other local micro-
contrast
convergence algorithms can be used to determine the margins of the
abnormality, such as the CR
algorithm, as shown in Figure 15f. Once the pixels within the margins has been
identified, those
pixels are copied and used to create a new image containing only the pixels
within the area of
interest as shown in image 1711. The element 1708 is then analyzed using
quantitative feature
extraction metrics at step 1704. Quantitative feature extraction such as High-
separability feature
.. extraction (HSFE) from data, basing on both standard and advanced
characteristics of images can
include such metrics as: color patterns and their distribution, the presence
and relationship of
54
CA 03108862 2021-02-05
WO 2019/032558
PCT/US2018/045567
black boundary patterns of AOI margins, Co-Occurrences, Gabor, Local Binary
Pattern (LBP)
analysis, Histograms of Oriented Gradients, Random Ferns, and Hough Forests.
One million, or more, features are then used to mathematically evaluate the
values in the
extracted image in step 1705 using both spatial and frequency domains of
analytics. The features
assembled in step 1705 are then analyzed using mathematical models in step
1706 involving
principal component analysis methodologies such as neural networks and support
vector
machines (SVM). The use of this analysis in machine learning, such as
supervised
learning models, are used to analyze data for classification and regression
analysis. Given a set
of training examples, the output classifies the object as belonging to one or
the other of two
categories. The SVM training algorithm builds a model that becomes a non-
probabilistic binary linear classifier.
[00347] At step 1707, the location and probability of disease for the
area of interest in the
original mammogram at step 1707 is determined. The use of feature extraction
after processing
the original image using the CI algorithm provides higher levels of tissue
characterization
resulting in higher sensitivity and specificity of diagnosis than is
accomplished using only the
very diffuse gray and white pixel values in the original grayscale image as a
basis for machine
learning and predictive modeling.
[00348] Figure 18 illustrates an exemplary methodology for correlating metrics
from each of a
plurality of processed images using different local micro-contrast convergence
algorithms
described herein, according to at least some embodiments of the invention. In
some
embodiments, utilizing local micro-contrast convergence algorithmic processing
for feature
extraction and machine learning, more than one local micro-contrast
convergence algorithmic
sequence can be employed. An isolated area of interest (AO') from a mammogram
is shown in
image 1820 with the core of the cancer shown at element 1818. This AOI was
generated by
applying steps 1703 to 1707 of Figure 17 after processing an original
mammogram image with
an exemplary local micro-contrast convergence algorithmic sequence. Having
isolated the
original pixel values, the original AOI pixels are duplicated n times. In this
example, images
shown from 1812 to 1817 (with the core of the cancer shown at elements 1830-
1835,
respectively) were created with the HD, LD, RF, CR, ED, and CI local micro-
contrast
convergence algorithms respectively. Each of the duplicated images 1812-1817
are then
processed with different local micro-contrast convergence algorithms,
described herein. In some
CA 03108862 2021-02-05
WO 2019/032558
PCT/US2018/045567
embodiments, any number of local micro-contrast convergence algorithms that
can be utilized to
create duplicated images. The duplicated images, 1812 to 1817, can then be
analyzed
individually as shown in the process described in Figure 17. Additionally, the
metrics generated
from the analytical process shown in Figure 17 can be used to correlate
features and probabilities
generated from each of the newly-generated images. Element 1840 illustrates an
additional
methodology for correlating metrics from each of the images 1812-1817 as
depicted with lines
1802 to 1808 representing each of the images. The rectangles in element 1840
represent the
AOIs from each of the additional local micro-contrast convergence algorithmic
processes.
Arrows represent a connection from each of the images 1812-1817 to their
respective layer and
AOIs. This combination of layering creates a synthesized "multi-spectral" set
of voxels that can
be analyzed through the layers as shown with arrow 1800 and processed using
steps 1704, 1705,
and 1706 in Figure 17 incorporated into the Multi-LMCC (local micro-contrast
convergence)
principle component analysis shown in step 1809. The output of the analysis
1810 is expressed
as a probability of disease in step 1811.
[00349] Embodiments of the invention regarding the RB algorithm provide
visualizations that
are designed to reveal details in an image that are of low contrast, subtle in
their differences from
surrounding objects, and of clinical importance. The CT brain scan in Figure
19a shows a very
small hemorrhage at 1901 that was missed in diagnosis and the patient was sent
home. The
patient returned the following day with increased symptoms and a second CT
scan Figure 19b
was performed and revealed a large right Sylvian subarachnoid hemorrhage (SAH)
1902 that
was very visible in the image. Figure 19c shows the results of processing the
CT image in Figure
19a with the RB local micro-contrast convergence algorithmic sequence
described in Figure
lOw. In this example, the resultant image from the RB algorithm was not
converted to grayscale,
but in other embodiments, the resultant image can be converted to grayscale.
The small
hemorrhage that was missed in diagnosis is visible as hemorrhage 1903 in red.
The hemorrhage
visible in Figure 19b is shown in Figure 19d at hemorrhage 1904. Different
densities of the fluid
are revealed in the boundary and interior colors at hemorrhage 1904.
[00350] Embodiments of the local micro-contrast convergence algorithmic
process can be
employed in visualizing, characterizing, and analyzing a wide range of image
types, from
different imaging modalities, diseases, and tissue types. Figure 20a is a
chest CT with areas of
the lungs 2001, 2002. A more detailed and textured expression of the tissues
in Figure 20a are
56
CA 03108862 2021-02-05
WO 2019/032558
PCT/US2018/045567
shown in Figure 20b after having been processed using the LD local micro-
contrast convergence
algorithm. The increased textural visual and frequency-based representation of
the tissues shown
at elements 2003 and elements 2004 make it easier for clinicians to make
assessments and
greatly increases the accurate diagnostic potential in machine learning.
Embodiments of the local
micro-contrast convergence algorithmic process can be employed in visualizing,
characterizing,
and analyzing a wide range of image types for industrial and security
applications. Since the
local micro-contrast convergence algorithmic approach works on pixel
relationships, the
sequencing of steps to achieve convergence for a given application can be
easily modified and
applied to other image processing requirements. Figure 21a is an X-ray image
of a structural
defect of a rusting pipe with the center of the rust shown at element 2101.
Figure 21b shows the
boundaries of the rust-generated structural defect at the edge of the contours
at element 2102
utilizing the CR algorithm. The rust is further visualized in color in Figure
21c after being
processed with the CI algorithm. The boundary of the rust is shown at element
2104 and the
variation and degree of rust can be seen as differences in color patterns with
the greatest
.. corrosion at element 2105.
[00351] All of the broad range of applications related to the adaptability of
LMCC to many
domains of image processing are possible because effective image analytics is
an imaging
problem, not a medical or industrial problem. Consequently, embodiments of the
local micro-
contrast convergence algorithmic process can be employed in visualizing,
characterizing, and
analyzing a wide range of image types related to both human and animal health
applications.
[00352] Local Micro-Contrast Convergence Algorithm
[00353] Further embodiments of the local micro-contrast convergence
algorithmic process are
depicted in Figures 22a-23b. Figure 22a is an original X-ray image of a dog's
leg taken at a
veterinary clinic in a first visit with the doctor. While the dog was brought
in for treatment of a
leg problem, no diagnosis of pathology was made at this time. The veterinarian
retrospectively
placed arrows around the area suspected of having the sarcoma, shown in area
2201 and area
2202. In contrast, after utilizing the LD algorithm, Figure 22b shows the
extent of the sarcoma
present, in area 2203, area 2204, and area 2205, in the original X-ray in
Figure 22a.
57
CA 03108862 2021-02-05
WO 2019/032558
PCT/US2018/045567
Figure 23a is an original X-ray image of the same dog's leg as imaged in
Figure 22a. This image
was generated 3 months after the image depicted in Figure 22a. The
veterinarian placed arrows
around the area suspected of having the sarcoma, as depicted by area 2301 and
area 2302.
[00354] In contrast, Figure 23b shows the extent of the sarcoma present in
area 2303, area
.. 2304, and area 2305, in the original X-ray in Figure 23a, utilizing the LD
algorithm. The LD
algorithm visualizes the true extent of the sarcoma, beyond the area where the
veterinarian
originally indicated.
[00355] Multi-Algorithmic, Multi-Dimensional Computer Based Processes
[00356] Embodiments of the invention, described herein, include methods that
utilize a multi-
algorithmic, multi-dimensional, computer-based process for the visualization
and
characterization of features of both biological and non-biological materials,
in context, in images
acquired from different imaging modalities. Figure 24a is a resultant first-
generation color image
generated from a dual-energy X-ray system designed to scan baggage at airports
and other
security check points. The composite color image may be created by combining
pixel densities
of two X-ray images captured simultaneously, one for high energy and a second
for low energy
beams. By mathematically analyzing the two images and the relationships
between their
respective pixel values, the average atomic numbers of screened objects can be
estimated to
enable their classification into three categories: inorganic, organic and
mixed materials. In Figure
24a, organics 2401 are colored orange and inorganic materials 2402, with high
average atomic
numbers colored dark blue.
[00357] Figures 24a and 24b were created by applying the LD algorithm
illustrated in Figure
Si from step 501 to step 507 to the first-generation dual-energy X-ray shown
in Figure 24a.
Figure 24b and Figure 24c were processed identically from step 501 to step
504. In step 506, the
saturation values of both images were set to zero. With saturation values set
to zero, the image
appears as a grayscale and hue adjustments have no meaning. In step 506 as
shown in Figure Si,
the results shown in Figures 24b and 24c differ in the luminance value,
settings were adjusted to
transform each of six initial color values in Figure 24a. By adjusting the
color values in Figure
24a, organic materials 2403 are visualized while deemphasizing other material
including
inorganic materials 2404. By again adjusting the color values in Figure 24a,
Figure 24c shows
inorganic materials 2406 while deemphasizing other material including the
organic materials
2405.
58
CA 03108862 2021-02-05
WO 2019/032558
PCT/US2018/045567
[00358] A person familiar with image processing software may easily observe
the real-time
resultant variations of image transformation in HSL color space on their
computer screen as
luminance values of each color range are adjusted using a standard software-
based slider bar or
by typing different numerical values for each color range.
[00359] Embodiments of the invention exemplifying the methodology of the LMCC
algorithms are detailed in Figures 4a through lOw.
[00360] Embodiments of the invention regarding the CI algorithm provide
visualizations that
are designed to characterize tissue structures even when the details in an
image (e.g., original
mammogram) as shown in Figure 27a are very close in grayscale tonal values as
measured by a
histogram between a lesion and the surrounding fatty tissue area. Figure 27a
is an original X-ray
mammographic image showing the gray pattern of fatty breast tissue 2701. The
pattern of the
presence of a higher luminance value cancerous lesion 2702 is visible in the
image against the
gray pattern of the surrounding fatty breast tissue 2701. The histogram
measures the luminance
value of 155 (on a scale of 0 to 255) at the margins of the cancerous lesion
2702 while the
adjacent area measures 145.
[00361] While some components of Imago's LMCC algorithmic sequences can
distinctly
express and differentiate tissue characteristics based on topology, others
express fractal
dimensions which can be expressed in non-integer values. Practically, this
means that there are
distinct "linear" patterns that reflect different tissue types.
[00362] Figure 25a is a digital photograph of a winter scene. Curved objects
2502 on the
ground are of a playground that reflect the use of Euclidian-based geometry
patterns (circles,
squares, rectangles, spheres, etc.) in the design of many human made objects.
The trees 2501 in
the image reflect the fractal-geometry-based branching patterns inherent in
biological and
physical natural systems. Figure 25b is an example of a computer-generated
pattern known as a
Mandelbrot Set. It is named after the mathematician who created the iterated
mathematical
function used to create the pattern.
[00363] Embodiments of the invention regarding the CI algorithm provide
visualizations that
are designed to characterize tissue structures even when the details in an
image (e.g., original
mammogram) as shown in Figure 26a are obscured by the patient having dense
breasts as
defined by the American College of Radiology (ACR) density classification
system. Figure 26a
is an original X-ray mammographic image showing the white pattern of dense
breast tissue.
59
CA 03108862 2021-02-05
WO 2019/032558
PCT/US2018/045567
Patterns of the presence of infiltrating ductal carcinoma, which are also
white, is not visible in
the image as presented. Figure 26a depicts the location of underlying lesions
that are not visible,
2601 and 2602 as well as an area of the breast that is declared fatty, 2603 as
defined by the
American College of Radiology (ACR) density classification system. Figure 26b
shows the
results after applying an exemplary local micro-contrast convergence
algorithmic (CI) sequence
to the original image in Figure 26a. Figure 26b, depicts underlying lesions
2604 and 2605
depicted in red and gold colors.
[00364] Figure 27b shows the results after applying an exemplary local micro-
contrast
convergence algorithmic (CI) sequence to the original image in Figure 27a. The
gold and red
colored patterns 2703 visualize the cancerous lesion 2702 and show that it is
separated from the
surrounding fatty breast tissue shown in blue.
[00365] Embodiments of the invention regarding cancer detection rates in
mammograms is to
decrease the rate of false positives from those of current technologies.
[00366] Figure 28a shows a set of original X-ray mammographic images revealing
both the
left and right breast views. The top view is a view from a cranial-caudal
perspective. The lower
view is from a medial lateral oblique perspective. Two marks placed on the
lower left image
(right medial lateral oblique view) were automatically generated and marked as
possible
abnormalities 2801 and 2802 by computer aided detection (CAD) software used in
radiology
today. Follow up procedures determined that this breast was normal and did not
have any
pathology. Both of the possible abnormalities 2801 and 2802 therefore are
false positives. CAD
is known to have a very high rate of false positives where marks are placed on
a mammogram
where there is no abnormality or pathology.
[00367] Figure 28b shows the results after applying an exemplary local micro-
contrast
convergence algorithmic (RF) sequence to the original lower left image (right
medial lateral
oblique view) in Figure 28a. The LMCC algorithmic RF, Figure 28b shows no
pattern of
abnormality shown by area 2803. The view does not require placing marks on the
image since
clinicians can readily view the patterns of all tissues, including those of
normal and abnormal
tissues. The multi-dimensional views created with the LMCC approach allows the
clinicians to
utilize their expertise and experience to more fully interpret the
mammographic images and
eliminate the need for many additional, but unnecessary, expensive, and
sometimes painful
procedures for the patient.
CA 03108862 2021-02-05
WO 2019/032558
PCT/US2018/045567
[00368] Embodiments of the invention regarding the CI algorithm provide
visualizations as
shown in Figure 29b, that are designed to characterize tissue structures even
when the details in
an image (e.g., original mammogram) as shown in Figure 29a are very close in
grayscale tonal
values between a lesion and the similar surrounding tissue area.
[00369] Figure 29a is an original X-ray mammographic image. The patient was
initially told
that she did not have any benign or cancerous lesions. Additional testing with
ultrasound and
contrast-enhanced MM did not reveal any abnormalities. Pathology analysis of
her breast tissue
after she decided to have a mastectomy indicated the presence of Atypical
Hyperplasia
transforming into Ductal Carcinoma in Situ (DCIS) spiculated type.
[00370] Figure 29b shows the results after applying an exemplary local micro-
contrast
convergence algorithmic (CI) sequence to the original mammogram in Figure 29a.
Lesion 2901
is depicted in gold and red colors while the surrounding area is purple and
blue. Pathology
confirms the presence of the lesion 2901.
[00371] Figure 29c is close up view of the lower left section of the original
mammographic
image shown in Figure 29a. Figures 29d shows the results after applying an
exemplary local
micro-contrast convergence algorithmic (RF) sequence to the close up of the
original
mammogram in Figure 29c. Lesion 2902 is shown, separated visually from the
surrounding area.
Figures 29e shows the results after applying an exemplary local micro-contrast
convergence
algorithmic (CR) sequence to the close up of the original mammogram in Figure
29c. Lesion
2903 is shown, separated visually from the surrounding area while a second
lesion 2904 is shown
in Figure 29e. Figures 29f shows the results after applying an exemplary local
micro-contrast
convergence algorithmic (CI) sequence to the close up of the original
mammogram in Figure
29c.Lesion 2905 is shown, separated visually from the surrounding area, while
lesion 2906
depicts a second lesion in Figure 29f Pathology confirms the presence of
lesions 2904 and 2906.
[00372] Embodiments of the invention regarding consistency of local micro-
contrast
convergence algorithms over a range of both human and animal health
applications.
[00373] Figure 30a is a first-generation X-ray image of a mouse known to have
breast cancer
on the right side of its body shown by tumor 3001.
[00374] Figure 30b shows the results after applying an exemplary local micro-
contrast
convergence algorithmic (LD) sequence to the original X-ray in Figure 30a.
61
CA 03108862 2021-02-05
WO 2019/032558
PCT/US2018/045567
[00375] Figure 30c shows the results after applying an edge detection filter
to Figure 30b.
Geometric patterns are created for all tissues i.e. bone, organs, and cancer.
Figure 30c shows
fractal-like patterns 3002. Also shown are consistent, near parallel tissue
structures 3003 on the
left side of the mouse as well as a disruptive pattern 3004 on the right side,
where the breast
.. cancer was growing.
[00376] Figure 30d is a close up of the left side of the X-ray of the mouse in
Figure 30c. The
near parallel structure of the body tissue appears as laminar-like flow
patterns 3005 consistent
with normal tissue geometric patterns.
[00377] Figure 30e is a close up of the right side of the mouse in Figure 30c.
The convoluted
geometric patterns 3006 within the cancer tissue reflects the chaotic nature
of cancer growth.
This LMCC algorithm consistently expresses geometric patterns associated with
the fractal
dimensions of each tissue type in an image. Normal tissue patterns 3005 have
straighter lines per
square area than an identical square area with abnormal tissues 3006. Using
this Euclidean-based
analytic approach, a line is expressed as one dimension and an area is
expressed as two
.. dimensions. Applying the concepts of fractal geometry, the area of a one-
dimension element in a
two-dimension area can be used to quantify the degree to which a given tissue
is either normal or
contains pathology. Fractal patterns can be mapped for each tissue, or
inorganic material, in a
given imaging modality.
[00378] Consequently, normal tissue linear patterns might appear to occupy 60%
of an area of
an image (fractal dimension of 1.6) as compared with an abnormality with lines
covering 83% of
the same area size (fractal dimension of 1.83.)
[00379] Changes in the fractal dimensions of a tissue structure, in response
to drug or
immunotherapy procedures, may provide very early indications related to the
progression or
regression of cancer in response to cancer treatments.
[00380] Embodiments of the invention regarding consistency of local micro-
contrast
convergence algorithm performance extends over a wide range of sensor types
and initiating
energy sources.
[00381] Figure 31a is a first-generation color (fundus) image of the retina of
an eye. These
images are captured using visible light and some recording device that can be
as compact as a
camera in a cell phone. The retina in this image contains features such as the
bright-appearing
62
CA 03108862 2021-02-05
WO 2019/032558
PCT/US2018/045567
hard exudates pattern of diabetic retinopathy 3101. This is one of many
abnormalities of the
retina that are the result of having diabetes.
[00382] Figure 3 lb shows the results after applying an exemplary local micro-
contrast
convergence algorithmic sequence to the original fundus image in Figure 31a
according to at
least some embodiments of the invention and as further defined in Figure 8u.
This LMCC
algorithm emphasizes patterns in an image and provides a "textured" appearance
that helps
separate materials/tissues in an image.
[00383] Embodiments of the invention regarding consistency of local micro-
contrast
convergence algorithm performance extends to use in additional modalities
using multi-slice 3D
imaging devices such as CT and MM scans.
[00384] Figure 32a is a first-generation CT scan of a patient with lung
cancer. The red
rectangle 3201 indicates the location of a lung cancer nodule.
[00385] Figure 32b shows the results after applying an exemplary local micro-
contrast
convergence algorithmic (CR) sequence to the original X-ray in Figure 32a
according to at least
some embodiments of the invention and as further defined in Figure 10w, then
applying an edge
detection filter. The lung cancer nodule 3202 remains as an object in the area
of the lung while
most of the other normal tissue structures such as blood vessels are no longer
visible. Locating
and characterizing lung cancer nodules in CT scans is a major problem for
clinicians in the effort
to determine the presence and extent of lung cancer in patients. Patterns
within the lung nodules
utilizing this LMCC algorithm can characterize structures, and their
associated patterns within
nodules, to provide geometric information to help distinguish normal from
benign and benign
from cancerous tissue structures.
[00386] Embodiments of the invention regarding consistency of local micro-
contrast
convergence algorithm performance can be applied to applications where the
imaging modality
is limited in its ability to differentiate tissue patterns when obscured by
overlying or surrounding
tissues such as tissues on top of tissues or for mapping the distribution and
flow of fluids.
[00387] Figure 33a shows a set of original X-ray mammographic images revealing
both a left
and right breast view. The patient associated with this mammogram has had
silicone breast
implants. The implants were shown to be leaking into the surrounding breast
tissue as seen at
leaking areas 3301 to 3305. The high X-ray attenuating characteristics of the
silicone make it
63
CA 03108862 2021-02-05
WO 2019/032558
PCT/US2018/045567
difficult, and sometimes impossible, for clinicians to view the breast tissue,
and possible
presence of abnormalities hidden within the white opaque densities in the
mammogram.
[00388] Figure 33b shows the results after applying an exemplary local micro-
contrast
convergence algorithmic (CR) sequence to the original X-ray in Figure 33a.
This LMCC
algorithm reveals the flow patterns 3306, 3307, 3310 and 3311 of the silicone
material within the
implant as a result of the leakage from the implant into the surrounding
tissue. There is no
leakage indicated on the most lateral position of the right breast. The almost-
circular pattern
3308 reveals the normal symmetry expected with a fluid that is no in dynamic
flux. The silicone
leakage 3304 as indicated in Figure 33a has pulled fluid from within the
interior of the left
breast. The parabolic pattern 3309 of the breast shown in Figure 33b indicates
the flow outward
of the silicone from within the implant.
[00389] Embodiments of the invention regarding consistency of local micro-
contrast
convergence algorithm performance can be applied to applications utilizing
time-based imaging
modalities used for functional analysis such as contrast-based Mill and a
Positron Emission
Tomography (PET) scans.
[00390] Figure 34a shows a view of a patient's abdomen resulting from a PET
scan. A PET
scan is useful in revealing or evaluating several conditions, including many
cancers. The scan
uses a special dye that has radioactive tracers. Abnormalities, such as
cancers, can show up as
spots in a captured image. This patient is known to have lung cancer with it
at least one location
indicated by a black arrow at possible lesion 3401.
[00391] Figure 34b shows the results after applying an exemplary local micro-
contrast
convergence algorithmic (CR) sequence to the original X-ray in Figure 34a. The
higher fractal
dimensional disruptive pattern 3402 of the cancer is consistent with the
pattern of cancer as seen
in other tissues, using other imaging modalities as seen in Figures 30d and
32b.
[00392] Embodiments of the invention regarding consistency of local micro-
contrast
convergence algorithm performance can be applied to applications involving
difficult to detect
abnormalities in body parts where surgery has been the only diagnostic tool
available to
clinicians for applications in both human and animal medicine.
[00393] Figure 35a is a first-generation X-ray image of the head of a dog. The
dog had
recently developed what appeared to be sinus infections with accompanying nose
bleeds.
64
CA 03108862 2021-02-05
WO 2019/032558
PCT/US2018/045567
[00394] Figure 35b was created by applying the LD algorithm illustrated in
Figure 5i from
step 501 to step 507 to the first-generation dual-energy X-ray shown in Figure
35a. The end of
the arrow pointing from lesion 3501 shows the presence of a nasal carcinoma.
Normally, a
veterinarian would perform exploratory surgery to identify the abnormality.
This LMCC LD
algorithm reveals both the presence and the extent of the cancer.
[00395] Embodiments of the local micro-contrast convergence algorithmic
process can be
employed in visualizing, characterizing, and analyzing a wide range of image
types including
those in scientific investigation in photo microscopy, material analysis in
the aviation industry,
and in astrophysics.
.. [00396] Figure 36a is a set of multiple-exposure images created by the
Hubble Space
Telescope of a Kuiper Belt Object (KBO) 6.4 billion Km away from Earth. The
image was
generated by the KBO Search Team. The circled white spots 3601 to 3605 show
the transit of the
object against the background star field over the multiple-exposure time
periods.
[00397] Figure 36b shows the results after applying an exemplary local micro-
contrast
convergence algorithmic sequence to the original image in Figure 36a according
to at least some
embodiments of the invention. The LMCC algorithmic sequence first utilized the
process defined
in Figure 4k. A second copy of the image shown in Figure 36a was then
processed using a high-
pass filter. The two images were then merged where the lightest colors are
subtracted from the
darker colors. In the process, white inverts the base color and black produces
no change. Finally,
.. green and cyan colors are altered by having the image placed in HLS color
space and
desaturating those two tonal ranges. The result is to isolate the Kuiper Belt
objects 3606 to 3610
visually from the rest of the small white objects.
[00398] Alternative Embodiments ¨ Different Processing Combinations
[00399] While the preceding paragraphs describe different embodiments for
image
visualization of local micro-contrast convergence, one of ordinary skill in
the art will appreciate
that one or more of the processing steps performed in one embodiment may be
applied in any
order and/or to other embodiments, including, but not limited to: gamma level
adjustment or
leveling, convolution filtering, sharpening filters, smoothing filters, median
filters, high-pass
filters, low-pass filters, merging functions, image multiplication functions,
image subtraction
.. functions, image addition functions, image blending functions, wavelet
functions, and image
layering functions, among others described herein.
CA 03108862 2021-02-05
WO 2019/032558
PCT/US2018/045567
[00400] Alternative Embodiments ¨ Different Modalities
[00401] Embodiments of the invention have applicability to a number of
different fields,
including, but not limited to: medical imaging (e.g., mammography, Mill, PET
or CAT scans,
ultrasound, 3-D Tomosynthesis), bomb detection, liquid explosive detection,
satellite imaging,
structural analysis, industrial, stress, quality control, weld and material
analysis (e.g., checking
for cracks or breaks in high-tension wires, airplane wings, pipes in nuclear
power plants),
printing standards analysis (e.g., money stamps), and forensics, among others.
Thus, different
imaging modalities (e.g., mammogram, x-ray, ultrasound, infra-red, ultra-
violet, MitI, CT scans,
PET scans, grayscale, color, visible light (e.g., photo microscopy), laser
scans) may be processed
using different visualization methodologies described herein. One of ordinary
skill in the art
would also appreciate that embodiments of the invention are not limited to the
fields described
herein, but instead are applicable to any field requiring pixel data analysis
in an image,
regardless of the imaging modality or energy source generating the images.
[00402] Alternative Embodiments ¨ Cancer/Diseases
[00403] Embodiments of the invention have applicability to visualizing,
characterizing, and
detecting several different cancers including, but not limited to: prostate,
kidney, liver, bone,
lung, brain, and skin of both humans and animals. One of ordinary skill in the
art would also
appreciate that embodiments of the invention are not limited to the cancers
described herein, but
instead are applicable to other similar cancers.
[00404] Embodiments of the invention have applicability to detecting several
different
diseases including, but not limited to: cardiovascular diseases, detection of
Alzheimer's disease
in retinal scans, diseases of the eye, multiple sclerosis lesion mapping,
photo microscopy. One
of ordinary skill in the art would also appreciate that embodiments of the
invention are not
limited to the diseases described herein, but instead are applicable to other
similar diseases.
[00405] Embodiments for improving false positive/false negative rates
[00406] Applying one or more of the micro-contrast convergence algorithms,
described herein
in medical applications for example, produce an image visualization that
facilitates users (e.g.,
radiologists) with detecting structures of interest (e.g., cancer). As a
result, the false positive
rates and false negative rates are considerably reduced.
[00407] In some embodiments, the false positive rate for breast cancer
detection in a
mammogram image, where the breast includes at least a portion of dense breast
tissue, over a
66
CA 03108862 2021-02-05
WO 2019/032558
PCT/US2018/045567
series of 100 trials, is less than 10% as determined by a physician. In some
embodiments, the
false positive rate for breast cancer detection in a mammogram image, where
the breast includes
at least a portion of dense breast tissue, over a series of 100 trials, is
less than 5% as determined
by a physician. In some embodiments, the false positive rate for breast cancer
detection in a
mammogram image, where the breast includes at least a portion of dense breast
tissue, over a
series of 100 trials, is less than 1% as determined by a physician.
[00408] In some embodiments, the false negative rate for breast cancer
detection in a
mammogram image, where the breast includes at least a portion of dense breast
tissue, over a
series of 100 trials, is less than 60% as determined by a physician. In some
embodiments, the
false negative rate for breast cancer detection in a mammogram image, where
the breast includes
at least a portion of dense breast tissue, over a series of 100 trials, is
less than 50% as determined
by a physician. In some embodiments, the false negative rate for breast cancer
detection in a
mammogram image, where the breast includes at least a portion of dense breast
tissue, over a
series of 100 trials, is less than 45% as determined by a physician. In some
embodiments, the
false negative rate for breast cancer detection in a mammogram image, where
the breast includes
at least a portion of dense breast tissue, over a series of 100 trials, is
less than 40% as determined
by a physician. In some embodiments, the false negative rate for breast cancer
detection in a
mammogram image, where the breast includes at least a portion of dense breast
tissue, over a
series of 100 trials, is less than 35% as determined by a physician. In some
embodiments, the
false negative rate for breast cancer detection in a mammogram image, where
the breast includes
at least a portion of dense breast tissue, over a series of 100 trials, is
less than 30% as determined
by a physician. In some embodiments, the false negative rate for breast cancer
detection in a
mammogram image, where the breast includes at least a portion of dense breast
tissue, over a
series of 100 trials, is less than 25% as determined by a physician. In some
embodiments, the
false negative rate for breast cancer detection in a mammogram image, where
the breast includes
at least a portion of dense breast tissue, over a series of 100 trials, is
less than 20% as determined
by a physician. In some embodiments, the false negative rate for breast cancer
detection in a
mammogram image, where the breast includes at least a portion of dense breast
tissue, over a
series of 100 trials, is less than 15% as determined by a physician. In some
embodiments, the
false negative rate for breast cancer detection in a mammogram image, where
the breast includes
at least a portion of dense breast tissue, over a series of 100 trials, is
less than 10% as determined
67
CA 03108862 2021-02-05
WO 2019/032558
PCT/US2018/045567
by a physician. In some embodiments, the false negative rate for breast cancer
detection in a
mammogram image, where the breast includes at least a portion of dense breast
tissue, over a
series of 100 trials, is less than 5% as determined by a physician. In some
embodiments, the
false negative rate for breast cancer detection in a mammogram image, where
the breast includes
at least a portion of dense breast tissue, over a series of 100 trials, is
less than 4% as determined
by a physician. In some embodiments, the false negative rate for breast cancer
detection in a
mammogram image, where the breast includes at least a portion of dense breast
tissue, over a
series of 100 trials, is less than 3% as determined by a physician. In some
embodiments, the
false negative rate for breast cancer detection in a mammogram image, where
the breast includes
at least a portion of dense breast tissue, over a series of 100 trials, is
less than 2% as determined
by a physician. In some embodiments, the false negative rate for breast cancer
detection in a
mammogram image, where the breast includes at least a portion of dense breast
tissue, over a
series of 100 trials, is less than 1% as determined by a physician.
[00409] In some embodiments, the false negative rate for breast cancer
detection in a
mammogram image, where the breast includes normal breast tissue, over a series
of 100 trials, is
less than 16% as determined by a physician. In some embodiments, the false
negative rate for
breast cancer detection in a mammogram image, where the breast is normal
breast tissue, over a
series of 100 trials, is less than 15% as determined by a physician. In some
embodiments, the
false negative rate for breast cancer detection in a mammogram image, where
the breast includes
normal breast tissue, over a series of 100 trials, is less than 10% as
determined by a physician. In
some embodiments, the false negative rate for breast cancer detection in a
mammogram image,
where the breast includes normal breast tissue, over a series of 100 trials,
is less than 5% as
determined by a physician. In some embodiments, the false negative rate for
breast cancer
detection in a mammogram image, where the breast includes normal breast
tissue, over a series
of 100 trials, is less than 1% as determined by a physician.
[00410] Feature Extraction
[00411] By implementing embodiments of the invention, images are generated
that visualize
and characterize tissue structures in an enhanced manner that improves feature
identification
(e.g., by radiologists).
.. [00412] In some embodiments, processor 252 may implement one or more
computer aided
detection (CAD) techniques on one or more generated image visualizations to
identify cancerous
68
CA 03108862 2021-02-05
WO 2019/032558
PCT/US2018/045567
structures. Large-scale pattern recognition systems applicable to millions of
informational
features may include such features first, second, and third order image
analysis any may employ
image comparisons (e.g., between a known cancerous structure and portions of
the image
visualizations).
[00413] The process employed in this application using local micro-contrast
convergence
algorithmic approaches causes such tissue type in an image, such as a
mammogram, to assume
characteristics color and grayscale properties that uniquely characterize the
tissues and their
boundaries, making feature identification and extraction highly effective for
accurate
identification. These properties include, but are not limited to: morphology,
geometry, color,
texture, relationships among different tissue structures (such as correlating
the presence of
lesions with microcalcifications in breast tissue), shapes of lesion
boundaries, presence of
spiculations, edge-gradients, cumulative edge-gradient distributions,
architectural distortions,
distribution of colors within lesions, contrast, temporal stability (changes
between
mammographic exams), and correlation of features between different views
(multiple view
correlation between CC and MLO mammographic image views).
[00414] The Machine Learning process in the breast cancer detection domain
begins by
extracting features correlated with disease such as benign cysts, fibro
adenomas, carcinomas, and
invasive cancers. A training set of images is used to develop criteria for
comparison between
cancer and non-cancer areas of a mammogram.
[00415] Relevant features are extracted as clusters of pixel luminance and
color values that
have resulted in local micro-contrast convergence process tissue
characterization patterns from a
given coordinate area in each processed image. A multiplicity of local micro-
contrast
convergence processed images can be analyzed and features extracted from each
of the separate
images that have been created through one or more visualization algorithmic
sequences,
described herein. All processed images being examined may be superimposed so
there is
complete registration in areas of interest among the different processed
images.
[00416] In some embodiments, processor 252 may generate one or more non-linear
transfer
functions to apply to an image to identify a feature of interest. In these
embodiments, processor
252 may run different trials, with a different set of local micro-contrast
convergence transfer
functions used for each trial. In some embodiments, the local micro-contrast
convergence
transfer functions may be generated at random. In some embodiments, the local
micro-contrast
69
CA 03108862 2021-02-05
WO 2019/032558
PCT/US2018/045567
convergence transfer functions are generated based on default functions (e.g.,
trigonometric
functions). Examples for generating local micro-contrast convergence transfer
functions based
on default functions are illustrated in Figure 2a.
[00417] The range of luminance values available for mapping luminance values
in this
coordinate plot is unbounded. As a result of the trials, processor 252 may
select a preferred set of
non-linear transfer functions to apply to an image based on the lowest
probability of a false
positive and/or false negative.
[00418] Feature analysis may include high separability feature extraction
(HSFE) from data,
basing on both standard and advanced characteristics of images and time
series, including: Co-
Occurrences, Gabor, SIFT, LBP, Histograms of Oriented Gradients, Random Ferns
and Hough
Forests.
[00419] Machine learning, data mining, and statistical modeling techniques can
be applied for
real-time object recognition and localization in the processed images using
such processes as
Adaboost, genetic programming, support vector machines, neural networks,
global optimization,
and learning vector quantization.
[00420] There is no theoretical limit to the number of features that can be
extracted or the
number of correlations that can be created among them. Algorithmic development
can be
employed for Big Data applications using R, Pig, Storm, My SQL, MongoDB, and
Hadoop.
[00421] In some embodiments, the functions utilized within a local micro-
contrast
convergence algorithmic sequence can be used to locate abnormalities, guide
interventional
procedures, tissue excisions, and monitor patient progress following the
procedure thereby
improving correct diagnoses by the clinician for the patient and improving
prognoses for the
patient. In one embodiment, patient monitoring can be accomplished by applying
the local
micro-contrast convergence algorithms to images taken of a patient undergoing
cancer treatment
to assist clinicians in determining if the chemo/radiation/hormone therapy
regimes are effective,
and if not, then change the procedure and perhaps move to surgical
intervention. In another
embodiment, multiple images generated in a stereotactic biopsy procedure can
be processed by
the local micro-contrast convergence algorithms to better identify the core of
a cancerous lesion
and be marked by the clinician for more precise 3-D location of the lesion and
extraction of
tissues.
CA 03108862 2021-02-05
WO 2019/032558
PCT/US2018/045567
[00422] In some embodiments, the functions utilized within a local micro-
contrast
convergence algorithmic sequence can be used to monitor the effectiveness of
interventional
medical procedures such as the use of nanotechnology. The capability of the
local micro-contrast
convergence algorithms to visualize and characterize abnormalities at very
small sizes, can assist
.. clinicians in first finding all the abnormalities (cancers), then monitor
changes in not only the
large lesions but the small lesions as well. Because the local micro-contrast
convergence
algorithms are effective at visualizing and characterizing cancer in different
body parts using
different imaging modalities, they can be employed to identify and
characterize the distribution
of lesions in other parts of the body where the cancer may have metastasized.
[00423] In some embodiments, the functions utilized within a local micro-
contrast
convergence algorithmic sequence can be used to monitor the effectiveness of
interventional
medical procedures, such as the use of nanotechnology and effectiveness of
immunotherapy
regimes. The effectiveness of measuring the effectiveness of immunotherapy
regimes can be
challenging because most therapies utilize the injection of drugs or materials
systemically where,
only a small percentage of the drug may reach the cancer area. The local micro-
contrast
convergence algorithms can reveal minute changes over time at the boundaries
and internal
structures of the cancer. Because the local micro-contrast convergence
algorithms can
characterize all tissues, not just the abnormalities, changes in the tumor
micro environment
(TME) surrounding the lesion can also be revealed to show either tumor
shrinkage or a
continuation of cancer growth into the surrounding tissues.
[00424] In some embodiments, the functions utilized within a local micro-
contrast
convergence algorithmic sequence can be used to assess the extent of cancer in
breast tissue
excision procedures to determine the extent of the cancer in a mammogram of
the tissue before
the tissue is examined microscopically for pathology. The boundaries of
cancerous lesions are
well defined in known patterns utilizing the local micro-contrast convergence
algorithms and can
be employed during the surgical procedure when the excised tissue is X-rayed
and examined by
the clinician after processing the image with local micro-contrast convergence
algorithms.
[00425] In some embodiments, the functions utilized within a local micro-
contrast
convergence algorithmic sequence can be utilized to monitor changes in small
lesions in medical
images that may be difficult to see visually without processing with local
micro-contrast
convergence algorithms.
71
CA 03108862 2021-02-05
WO 2019/032558
PCT/US2018/045567
[00426] In some embodiments, the functions utilized within a local micro-
contrast
convergence algorithmic sequence can be used to visualize and characterize
density and internal
patterns within and at the boundaries of tissues and monitor changes of tissue
growth when
incubated in cultures.
[00427] In some embodiments, the functions utilized within a local micro-
contrast
convergence algorithmic sequence can form the basis for feature extraction of
tissues/materials
for machine learning and artificial intelligence by providing distinctive
margins and tissue
structure characterizations that are unique properties for objects of
interest.
[00428] In a further embodiment, initial steps in a local micro-contrast
convergence
algorithmic sequence can characterize and visualize all materials/tissues,
while subsequent steps
in the algorithm can subtract out non-diagnostic tissues/materials to provide
improved visual
discrimination to important diagnostic areas of the image such as performing
fat subtraction in a
mammogram to further reveal microcalcifications in the image.
[00429] In a further embodiment, the functions utilized within multiple local
micro-contrast
convergence algorithmic sequences can create multiple visualizations
expressing different
characteristics in both the spatial and frequency domains of the same object
of interest to achieve
higher rates of sensitivity and specificity in machine learning applications.
[00430] In a further embodiment, the functions utilized within multiple local
micro-contrast
convergence algorithmic sequences can create multiple visualizations
expressing different
characteristics of the same object of interest with images from different
imaging modalities to
achieve higher rates of sensitivity and specificity in machine learning
applications.
[00431] In at least one embodiment, there is included one or more computers
having one or
more processors and memory (e.g., one or more nonvolatile storage devices). In
some
embodiments, memory or computer readable storage medium of memory stores
programs,
modules and data structures, or a subset thereof for a processor to control
and run the various
systems and methods disclosed herein. In one embodiment, a non-transitory
computer readable
storage medium having stored thereon computer-executable instructions which,
when executed
by a processor, perform one or more of the methods disclosed herein.
[00432] It will be appreciated by those skilled in the art that changes could
be made to the
exemplary embodiments shown and described above without departing from the
broad inventive
concept thereof. It is understood, therefore, that this invention is not
limited to the exemplary
72
CA 03108862 2021-02-05
WO 2019/032558
PCT/US2018/045567
embodiments shown and described, but it is intended to cover modifications
within the spirit and
scope of the present invention as defined by the claims. For example, specific
features of the
exemplary embodiments may or may not be part of the claimed invention and
features of the
disclosed embodiments may be combined. Unless specifically set forth herein,
the terms "a",
"an" and "the" are not limited to one element but instead should be read as
meaning "at least
one".
[00433] It is to be understood that at least some of the figures and
descriptions of the
invention have been simplified to focus on elements that are relevant for a
clear understanding of
the invention, while eliminating, for purposes of clarity, other elements that
those of ordinary
skill in the art will appreciate may also comprise a portion of the invention.
However, because
such elements are well known in the art, and because they do not necessarily
facilitate a better
understanding of the invention, a description of such elements is not provided
herein.
[00434] Further, to the extent that the method does not rely on the particular
order of steps set
forth herein, the particular order of the steps should not be construed as
limitation on the claims.
The claims directed to the method of the present invention should not be
limited to the
performance of their steps in the order written, and one skilled in the art
can readily appreciate
that the steps may be varied and still remain within the spirit and scope of
the present invention.
73