Note: Descriptions are shown in the official language in which they were submitted.
1VIICROARRAY BASED SAMPLE DETECTION SYSTEM
[0001] This application is a divisional application of co-pending application
Serial No.
2,870,069, filed April 13, 2012.
FIELD
[0002] The technical field is microfluidic systems and, in particular,
microfluidic
systems having a microarray for sample detection.
BACKGROUND
[0003] Microarrays are most prevalent in research laboratories as tools for
profiling
gene expression levels because thousands of probes can interrogate a single
sample. Their
utility is less ubiquitous as diagnostics for clinical, environmental, and
agricultural
applications despite their information density, redundancy, embedded controls
(positive,
negative), and analytical sensitivity. The barrier to adoption of microarrays
as diagnostics
tests is predominantly due to their operational complexity and cost (often
hundreds of dollars
per test), as well as technical problems associated with microfluidic devices
containing a
microarray, such as the unpredictable behavior of fluid flow caused by air
bubbles in the
microfluidic devices. For example, bubbles can clog channels, interfere with
biochemical
reactions (particularly those that require surface interactions), cause
improper proportioning,
interfere with optical reads, and result in unpredictable flow. Unpredictable
flow is
particularly a problem for systems that rely on steady diffusion of an analyte
to a binding
partner, such as an oligonucleotide or a capturing antibody. Accordingly,
there still exists a
need for microarray-based microfluidic detection systems that are designed to
provide
predictable fluid flow and can be manufactured at a low cost.
SUMMARY
[0004] One aspect of the present application relates to a microarray assembly
for
detection of a target molecule in a sample. In one embodiment, the microarray
assembly
1
Date Recue/Date Received 2021-05-27
comprises: an array chamber with a sample inlet at a first end, a sample
outlet at a second
end, a top interior surface, a bottom interior surface, side walls and a
microarray located on
the bottom interior surface; and a waste chamber that is in fluid
communication with the
outlet of the array chamber, wherein the array chamber comprises a hydrophilic
interior
surface positioned to facilitate complete filling of the array chamber by a
water-based fluid
and the continuous flow of the fluid from the sample inlet to the sample
outlet and wherein
the cross-sectional area at the first end of the array chamber is larger than
the cross-sectional
area at the second end of the array chamber.
[0005] In another embodiment, the microarray assembly comprises: an array
chamber with a sample inlet, a sample outlet, a top interior surface, a bottom
interior surface,
side walls and a microarray located on the bottom interior surface; a waste
chamber
comprising a waste inlet and an absorbent material; and a channel having an
expansion
section with a first end proximate to the outlet of the array chamber and a
second end
proximate to the inlet of the waste chamber, wherein the top interior surface
is a hydrophilic
surface that facilitates complete filling of the array chamber by an aqueous
fluid and
wherein the cross-sectional area at the first end of the expansion section is
smaller than the
cross-sectional area at the second end of the expansion section.
100061 In another embodiment, the microarray assembly comprises: an array
chamber with a sample inlet at a first end, a sample outlet at a second end, a
top interior
surface, a bottom interior surface, side walls and a microarray located on the
bottom surface;
and a waste chamber that is in fluid communication with the outlet of the
array chamber,
wherein the array chamber comprises a hydrophilic interior surface positioned
to facilitate
complete filling of the array chamber by an aqueous-based fluid and channels
with
rectangular cross-sectional areas patterned onto the bottom interior surface
and/or the top
interior surfaces to promote drying.
100071 Another aspect of the present application relates to a method for
controlling
the quality of manufacturing array elements in a microarray. The method
comprises the
steps of illuminating a microarray having a plurality of array spots with
light waves to
produce fluorescence from each array spot; measuring fluorescence intensity
for each array
spot wherein the fluorescence is produced by an internal quality control
fluorophore;
producing a fluorescent image of the microarray; determining information for
each array
spot based on the fluorescent image; and encoding the information in a
barcode, memory
device or RFID tag, wherein the barcode, memory device or RFID tag is
associated with the
microarray.
2
Date Recue/Date Received 2021-05-27
[0008] Another aspect of the present application relates to a method for
making a
microarray assembly. The method comprises the steps of unrolling a substrate
film by one
or more substrate film reels; printing microarrays onto the unrolled substrate
film;
laminating a spacer film on top of the printed substrate film, wherein the
spacer film is pre-
cut to provide space for an array chamber prior to the placing step and is
placed on top of the
printed substrate film by one or more spacer film reels; laminating a cover
film on top of the
spacer film to form a layered microarray structure; and cutting the layered
microarray
structure into individual microarray assemblies.
BRIEF DESCRIPTION OF THE DRAWINGS
[0009] The detailed description will refer to the following drawings:
[0010] Figure lA is a schematic of an embodiment of a microarray assembly that
contains a reservoir, a decreasing cross-sectional area array chamber, an
array of spots, a
waste chamber, and an absorbent. Figure 1B is a cross-sectional view of the
array assembly
in Figure 1A.
[0011] Figure 2 is a close-up view of the array chamber showing a linear array
of
spots printed at the bottom of the chamber that has a decreasing cross-
sectional area.
[0012] Figure 3 is a microarray assembly with an expanding channel connecting
the
array chamber to the waste chamber.
[0013] Figure 4A is a schematic showing an array chamber with small
rectangular
channels that are perpendicular to the direction of the liquid flow inside the
chamber. Figure
4B is a schematic showing an array chamber with small rectangular channels
that are
parallel to the direction of the liquid flow inside the reaction chamber.
Figure 4C is a
schematic showing an array chamber with small rectangular channels that are
perpendicular
or parallel to the direction of the liquid flow within the reaction chamber.
Figure 4D is a
schematic showing an array chamber with small rectangular channels that form
an angle to
the direction of the liquid flow within the reaction chamber.
[0014] Figure 5 shows a schematic of a continuous assembly line for
manufacturing
lab-on-a-film devices.
[0015] Figure 6 shows an array map with a serial dilution of Cy5 and Cy3
spots.
[0016] Figure 7 shows an image of a blunt-pin print head.
[0017] Figure 8 shows bright field images of arrays printed on a polyester
thin film
with the vacuum manifold before polymerization and after polymerization, as
well as a
fluorescence image of a Cy3 array.
3
Date Recue/Date Received 2021-05-27
[0018] Figure 9 shows a picture of a thin-film vacuum manifold for blunt pin
printing.
[0019] Figure 10 shows a fluorescence image following PCR of materials that
were
assembled with rollable materials including a polyester film that the array
was printed on.
[0020] Figure 11 is a composite of pictures showing a reel-to-reel printing
setup with
a BioDot Ultranon-contact array printer (top panel) and video frames of non-
contact printing
using the BioDot Ultra on a moving film that has not been chemically treated
or modified
(bottom panels).
[0021] Figure 12 shows a red channel fluorescence image of the MRSA array
captured during factory QC to extract spot parameters.
[0022] Figure 13 shows a green channel fluorescence image of hybridized array
imaged by end-user's imager. The imager software utilized the array QC data to
place the
grid and circles around each individual spot.
[0023] Figure 14 shows a fluorescence image of hybridized array imaged by end-
user equipment without the use of QC data, making it more challenging to place
the grid
and circles around each individual spot.
DETAILED DESCRIPTION
[0024] This description is intended to be read in connection with the
accompanying
drawings, which are to be considered part of the entire written description of
this invention.
The drawing figures are not necessarily to scale and certain features of the
invention may be
shown exaggerated in scale or in somewhat schematic form in the interest of
clarity and
conciseness. In the description, relative terms such as "front," "back" "up,"
"down," "top"
and "bottom," as well as derivatives thereof, should be construed to refer to
the orientation
as then described or as shown in the drawing figure under discussion. These
relative terms
are for convenience of description and noimally are not intended to require a
particular
orientation. Terms concerning attachments, coupling and the like, such as
"connected" and
"attached," refer to a relationship wherein structures are secured or attached
to one another
either directly or indirectly through intervening structures, as well as both
movable or rigid
attachments or relationships, unless expressly described otherwise.
[0025] The term "microarray," as used herein, refers to an ordered array of
spots
presented for binding to ligands of interest. A microarray consists of at
least two spots. The
ligands of interest include, but are not limited to, nucleic acids (e.g.,
molecular beacons,
4
Date Recue/Date Received 2021-05-27
aptamers, locked nucleic acids, peptide nucleic acids), proteins, peptides,
polysaccharides,
antibodies, antigens, viruses, and bacteria.
[0026] The term "hydrophilic surface" as used herein, refers to a surface that
would
form a contact angle of 45 or smaller with a drop of pure water resting on
such a surface.
The term "hydrophobic surface" as used herein, refers to a surface that would
form a contact
angle greater than 45 with a drop of pure water resting on such a surface.
Contact angles
can be measured using a contact angle goniometer.
[0027] The term "array chamber," as used herein, refers to an enclosed space
around
a microarray that has fluid communication with an inlet and an outlet either
directly or
indirectly. The array chamber, when filled with a liquid sample, allows the
microarray to be
submerged in the liquid sample so that target molecules in the liquid sample
can maintain
intimate contact with the microarray probes.
Microarray System Designed to Facilitate Fluid Flow Within the System
[0028] One aspect of the present application relates to a microarray-based
detection
system comprising a microarray assembly comprising an array chamber with a
sample inlet,
a sample outlet and a microarray located therein, and a waste chamber that is
in fluid
communication with the array chamber. The array chamber has a hydrophilic
surface
positioned to facilitate complete filling of the array chamber and the fluid
flow from the
array chamber to the waste chamber. The hydrophilic surface contacts a liquid
as it enters
the array chamber from the sample inlet and allows complete filling of the
array chamber.
In certain embodiments, the array chamber is in the shape of an elongated
channel of
variable width and is directly connected to the waste chamber. In other
embodiments, the
array chamber is connected to the waste chamber through a waste channel.
[0029] Surface tension of a liquid sample or a reaction mixture often prevent
the
liquid sample or reaction mixture from completely filling a small space, such
as the array
chamber of a microarray system. Surface tension is the result of the
attraction between the
molecules of the liquid sample by various intermolecular forces. In the bulk
of the liquid
sample, each molecule is pulled equally in all directions by neighboring
liquid molecules,
resulting in a net force of zero. At the surface of the liquid sample, the
molecules are pulled
inwards by other molecules deeper inside the liquid and are not attracted as
intensely by the
molecules in the neighboring medium (be it vacuum, air or another fluid).
Therefore all of
the molecules at the surface are subject to an inward force of molecular
attraction which can
be balanced only by the resistance of the liquid sample to compression. This
inward pull
tends to diminish the surface area, and in this respect a liquid surface
resembles a stretched
Date Recue/Date Received 2021-05-27
elastic membrane. Accordingly, the liquid squeezes itself together until it
has the locally
lowest surface area possible. The net result is that the liquid sample may
maintain a near-
spherical shape inside the small space and does not fill the comers,
especially square corners
of the small space. The typical small gap that separates the cover from the
microarray
surface in an array chamber often compresses the liquid into a cylindrical
shape.
[0030] In the case of microarray systems, the liquid that fills the array
chamber is
most likely an aqueous solution, such as a hybridization buffer or washing
buffer. The
surface tension of the aqueous solution may be overcome by coating at least a
portion of the
interior surface of the array chamber with a hydrophilic material. In some
embodiments, the
microarray is located on the bottom surface of the array chamber and the top
surface, or at
least a portion of the top surface, of the array chamber is coated with a
hydrophilic coating.
[0031] Examples of the hydrophilic material include, but are not limited to,
hydrophilic polymers such as polyethylene glycols, polyhydroxyethyl
methacrylates,
Bionite, poly(N-vinyl lactams), poly(vinylpyrrolidone), poly(ethylene oxide),
poly(propylene oxide), polyacrylamides, cellulosics, methyl cellulose,
polyanhydrides,
polyacrylic acids, polyvinyl alcohols, polyvinyl ethers, alkylphenol
ethoxylates, complex
polyol mono-esters, polyoxyethylene esters of oleic acid, polyoxyethylene
sorbitan esters of
oleic acid, and sorbitan esters of fatty acids; inorganic hydrophilic
materials such as
inorganic oxide, gold, zeolite, and diamond-like carbon; and surfactants such
as Triton X-
100, Tween, Sodium dodecyl sulfate (SDS), ammonium lauryl sulfate, alkyl
sulfate salts,
sodium lauryl ether sulfate (SLES), alkyl benzene sulfonate, soaps, fatty acid
salts, cctyl
trimethylammonium bromide (CTAB) a.k.a. hexadecyl trimethyl ammonium bromide,
alkyltrimethylammonium salts, cetylpyridinium chloride (CPC), polyethoxylated
tallow
amine (POEA), benzalkonium chloride (BAC), benzethonium chloride (BZT),
dodecyl
betaine, dodecyl dimethylamine oxide, cocamidopropyl betaine, coco ampho
glycinate alkyl
poly(ethylene oxide), copolymers of poly(ethylene oxide) and poly(propylene
oxide)
(commercially called Poloxamers or Poloxamines), alkyl polyglucosides, fatty
alcohols,
cocamide MEA, cocamide DEA, cocamide TEA.
[0032] In some embodiments, one or more surfactants are mixed with reaction
polymers such as polyurethanes and epoxies to serve as a hydrophilic coating.
In other
embodiments, the top surface or the bottom surface of the array chamber is
made
hydrophilic by surface treatment such as atmospheric plasma treatment, corona
treatment or
gas corona treatment.
6
Date Recue/Date Received 2021-05-27
[0033] Examples of hydrophilic tape include, but are not limited to, Adhesives
Research (AR) tape 90128, AR tape 90469, AR tape 90368, AR tape 90119, AR tape
92276,
and AR tape 90741 (Adhesives Research, Inc., Glen Rock, PA). Examples of
hydrophilic
film include, but are not limited to, Vistex and Visguard films (Film
Specialties Inc.,
Hillsborough, NJ), and Lexan HPFAF (GE Plastics, Pittsfield, MA). Other
hydrophilic
surfaces are available from Surmodics, Inc. (Eden Prairie, MN), Biocoat Inc.
(Horsham,
PA), Advanced Surface Technology (Billerica, MA), and Hydromer, Inc.
(Branchburg, NJ).
[0034] In some embodiments, the hydrophilic tape or film has sufficient
transparency to allow optical interrogation of the microarray from the top of
the array
chamber.
[0035] The microarray can be any type of microarray, including but not limited
to
oligonucleotide microarrays and protein microarrays. In one embodiment, the
microarray is
an antibody array and the microarray system is used for capturing and labeling
target
antigens. In one embodiment, the microarray is formed using the printing gel
spots method
described in e.g., US patent numbers 5,741,700; 5,770,721; 5,981,734; and
6,656,725. In
certain embodiments, the microarray comprises a plurality of array spots
printed on an array
substrate that forms the bottom of the array chamber. In some embodiments, the
array
substrate is glass or plastic.
[0036] In certain embodiments, the array spots contain an internal control
fluorophore having an emission spectrum that is different from those of the
fluorophores
associated with target molecules (i.e., the target molecules will be labeled
with fluorophores
that have emission spectra that are different from the emission spectrum of
the internal
control fluorophore). This internal control may be analyzed in the field or
during
manufacturing to improve quality. The internal control would provide a
quantitative means
of assessing the fluorescence intensity (e.g., average, mean or integral) of
the spot, which
may vary due to drop diameter, morphology, porosity, or any factor that may
change the
reproducibility from spot to spot. Factors that influence these properties
include UV dosage,
temperature, surface properties, synthesis, viscosity, condensation, washing
(i.e., due to
effects caused by differences in temperature, viscosity, flow rate, stringency
or anything that
may influence the removal or distortion of the spots), depth of pin immersion
in the polymer
solution for pin printing technologies or any property that could influence
the morphology of
gel elements or concentration of the probes therein. Imaging in the field
would additionally
account for: misuse by the user, destruction of the gel elements due to poor
handling,
7
Date Recue/Date Received 2021-05-27
washing of the gel elements, increased brightness due to the presence of
salts,
thermocycling, high temperature conditions decreasing fluorescent yield, low
temperature
condition increasing fluorescent yield, shelf-life degradation, and/or
anything that
contributes to the change in fluorescence signal following the initial QA/QC
during
manufacture of the arrays.
[0037] Examples of fluorophores include, but are not limited to, pyrene, 7-
methoxycoumarin, cascade blue, 6-MI, 3-MI, 7-aminocoumarin-X (AMCA-X), 6-MAP,
pacific blue, marina blue, dimethylaminocoumarin, BODIPY 493/503, BODIPY-FI-X,
DTAF (5-DTAF), 6-FAM (fluorescein), dansyl-X, Oregon green 500, Oregon green
488 (5
isomer), rhodol green, Oregon green 514, rhodamine green-X, NBD-X, TET,
2'4'5'7'-
tetrabromosulfonefluorescein, BODIPY-FI BR2, BODIPY-R6G, 6-JOE, BODIPY
530/550,
HEX, carboxyrhodamine 6G, BODIPY 558/568, BODIPY-TMR-X, PyMPO, BODIPY
564/570, Cy3, TAMRA-X, Rhodamine Red-X, BODIPY 576/589, BODIPY 581/591, Texas
Red-X, Cy3.5, ROX, BODIPY-TR, Syto-81, Cy5, napthofluorescein, Cy5.5, VIC,
SYBR
green I, and SYBR green II.
[0038] In other embodiments, the internal control is a colorimetric signal
change,
which is distinct from spot to spot. In other embodiments, the internal
control is a
chemiluminescence signal change, which is distinct from spot to spot. In yet
other
embodiments, the internal control is an electrochemical signal change, which
is distinct from
spot to spot.
[0039] In certain embodiments, the array spots are gel spots containing a
first
fluorophore (e.g., Cy5). The targets in the sample are labeled with a second
fluorophore
(e.g., Cy3) during PCR and subsequently hybridize to probes that are
covalently attached to
the gel drop polymer. The first fluorophore has a different emission peak than
the second
fluorophore. In this setting, the first fluorophore (e.g., Cy5) serves to
allow exact location of
the gel spots with an imaging system that can detect both the first and the
second
fluorophores (e.g., Cy3 and Cy5).
[0040] In some embodiments, the imaging system is a component of the
microarray-
based sample detection system. In other embodiments, the imaging system is
part of a
machine vision system used during manufacturing the microarray assembly such
that the
coordinates of each spot can be precisely determined during inspection. These
coordinates
are uploaded onto a barcode or RFID tag that is attached to the microarray
assembly for
future analysis. For this approach to be effective, the first fluorophore
(i.e., the internal
control fluorophore) coordinates require that the second fluorophore (i.e.,
the target
8
Date Recue/Date Received 2021-05-27
fluorophore) reference fiducials are included as part of the assembly map, so
that the grid
can be placed. However, unlike conventional scheme that either attempt to
place a grid
based on precisely spaced spots or require two color fluorescence imagers, the
disclosed
scheme uses the coordinates from the barcode to place fixed circles for spot
detection.
Location of the first fluorophore (i.e., the internal control fluorophore)
spots can be used
with a thresholding algorithm to find the centers, which are then used for
placement of fixed
circles.
[0041] A benefit of the use of machine vision to identify spots is that the
same
system can be used to reject spots without rejecting the entire microarray,
which would
increase yield. Spots can be rejected based on a number of criteria such as
internal control
fluorescence intensity values that are out of bounds, asymmetry, and diameter.
Therefore,
some embodiments of the present application relate to a method for controlling
the quality of
manufacturing array elements in a microarray, comprising: illuminating a
microarray having
a plurality of array spots with light waves to produce fluorescence from each
array spot;
measuring fluorescence intensity for each array spot wherein the fluorescence
is produced
by an internal quality control fluorophore; producing a fluorescent image of
the microarray;
determining information for each array spot based on the fluorescent image;
and encoding
the information in a barcode, memory device or RFID tag, wherein the barcode,
memory
device or RFID tag is associated with the microarray. The information for each
array spot
may comprise the location of each spot, the fluorescence intensity of each
spot, the diameter
of each spot and the morphology of each spot. A microarray image analysis may
be
conducted by placing fixed circles for each microarray spot on the image of a
microarray
using the spot location information determined based the internal control
fluorescence.
[0042] In one embodiment, the present application provides a method for
microarray
image analysis. The method comprises the steps of obtaining an image of a
microarray,
placing a fixed spot border circle around each microarray spot on the image of
the
microarray based on the array spot location information obtained through the
internal control
fluorescence in the array spots as described above; measuring a target
fluorescence intensity
within the fixed spot border circle for each array spot, and determining the
amount of a
target molecule in a sample based on the ratio of the target fluorescence
intensity to the
internal fluorescence intensity at each array spot.
[0043] In another embodiment, a method for microarray image analysis includes
the
following steps: determining a target fluorescence intensity for a target spot
in a microarray;
determining an internal fluorescence intensity for the target spot in the
microarray;
9
Date Recue/Date Received 2021-05-27
determining a signal strength for the target spot in the microarray, wherein
the signal
strength is a ratio of the target fluorescence intensity to the internal
fluorescence intensity,
wherein the internal fluorescence intensity for the target spot in the
microarray is determined
as described earlier.
[0044] In another embodiment, the present application provides a method for
imaging array elements in a microarray. The method includes the steps of
illuminating a
microarray having a plurality of array spot with light waves of a first
wavelength to produce
fluorescence from an internal control fluorophore; determining location of
array spots of the
microarray based on fluorescence produced by the internal control fluorophore
(control
fluorescence); illuminating the microarray with light waves of a second
wavelength to
produce fluorescence from a target fluorophore that is associated, directly or
indirectly, to a
target molecule that binds to an array spot; measuring fluorescence produced
by the target
fluorophore (target fluorescence); and determining the amount of the target
molecule in the
sample based on the control fluorescence intensity-to-target fluorescence
intensity ratio in
relevant array spots.
[0045] The waste chamber can be of any shape and typically has a volume that
is
greater than the volume of the array chamber. In one embodiment, the waste
chamber is
formed in a gasket tape which is then attached to the substrate on which the
microarray is
printed. In yet another embodiment, the substrate has a cut-out on its top
surface. The cut-
out has a size and position that match the size and position of the waste
chamber in the
gasket so that the waste chamber, once formed between the substrate and the
gasket, would
have a thickness that is greater than the thickness of the array chamber. In
another
embodiment, the substrate is made of a plastic material so that a cut-out may
be easily made
on the substrate. In yet another embodiment, both the array chamber and the
waste chamber
are formed in the substrate without using the gasket. The waste chamber,
however, may
have a depth that is greater than the depth of the array chamber.
=
[0046] In one embodiment, the waste chamber contains an absorbent that, once
in
contact with the liquid in the array chamber, wicks the liquid from the array
chamber,
therefore allowing the microarray to be read in a dry state.
[0047] The absorbent can be any material capable of retention of a relatively
large
volume of liquid. In one embodiment, the absorbent is made of an aggregate of
fibers. In
another embodiment, the absorbent is a nonwoven fabric produced in a through-
air bonding
process. The constituent fibers of the nonwoven fabric can be hydrophilic
synthetic fibers,
natural cellulose fibers of pulp or the like, or regenerated cellulose fibers.
The fibers may be
Date Recue/Date Received 2021-05-27
coated or infiltrated with a surfactant or a hydrophilic oil to improve liquid
absorbance. Not
limited to the through-air bonding process, the nonwoven fabric for use herein
may be
produced in any other process such as a spun-bonding process, an air laying
process, a spun-
lacing process, etc. In one embodiment, the absorbent is a cellulose paper
(C048) from
Millipore (Billerica, MA).
100481 In some embodiments, the waste chamber is vented to the atmosphere
through a vent. In one embodiment, the vent is created by simply punching a
hole in the
cover of the waste chamber.
[0049] In another embodiment, the liquid in the array chamber is removed by
forcing
the liquid inside the reservoir into the array chamber and establishing a
contact between the
liquid in the array chamber and the absorbent in the waste chamber. The
contact may be
established by applying a pressure to the liquid in the array chamber to push
the liquid out of
the array chamber or by applying suction at a vent of the waste chamber to
pull the liquid
out of the array chamber. A pressure to the liquid in the array chamber may be
generated by
applying a pressure through a check valve (e.g., using a pipette or a
syringe). If the array
chamber is covered only with a hydrophilic tape or a hydrophilic film, a
pressure to the
liquid inside the array chamber may be generated by simply pressing the
hydrophilic tape or
film that form the top surface of the array chamber. Alternatively, the
contact between the
liquid in the array chamber and the absorbent may be established by placement
of the
absorbent near the array chamber such that the absorbent touches the liquid
inside the
channel.
100501 Once a contact is established, the liquid in the array chamber is
wicked into
the absorbent in the waste chamber through the array chamber. The flow rate of
the liquid is
determined by the size of the array chamber, the surface tension and viscosity
of the liquid,
and the wicking rate of the absorbent. In addition, the flow rate decreases as
the absorbent
becomes more saturated.
100511 In another embodiment, the rnicroarray system further contains a one-
way
valve for introducing a liquid (e.g., a sample, a PCR buffer with target, a
hybridization
buffer, or a washing buffer) into the array chamber. The sample is introduced
into the array
chamber through the one-way valve to prevent environmental contamination,
which is an
important concern in certain applications such as the detection of biological
warfare agents.
The one-way valve can be a check valve, a dome valve or a duckbill valve that
is placed at
the inlet of the array chamber. Dome valves of various sizes are commercially
available
e.g., from Minivalve International (Yellow Springs, OH).
11
Date Recue/Date Received 2021-05-27
[0052] In some embodiments, the side walls of the array chamber are
hydrophobic to
trap bubbles. In other embodiments, the array chamber has a hydrophilic cover
that is
configured such that a hydrophilic region is created near the outlet of the
array chamber. In
a related embodiment, the hydrophilic region is created with hydrophilic gel
elements.
100531 In another embodiment, the inlet of the array chamber contains a
pierceable
membrane/tape or a dome valve, check valve or duckbill valve to allow washing
to occur
without causing the content inside the array chamber to be liberated from the
microarray
assembly.
[0054] In another embodiment, the microarray system further contains a
reservoir for
introducing a liquid into the array chamber. In a related embodiment, the
reservoir is loosely
bound to the device so that it can be snapped off and removed for imaging in
conventional
microarray or colorimetric readers. In another embodiment, the array chamber
is connected
to multiple waste chambers to ensure that wicking occurs at the appropriate
interval.
[0055] In the event that an air bubble is introduced into the array chamber,
the air
bubble may be lodged in the array chamber and partially or completely block
liquid flow in
the array chamber. The air bubble may also stop the wicking action of the
absorbent if the
air bubble is located right at the interface of the liquid and the absorbent.
In some
embodiments, the array chamber of the microarray assembly is shaped to
facilitate bubble
movement within the array chamber. In some embodiments, the array chamber has
a cross-
sectional area that decreases continuously, or in a stepwise fashion, from one
end of the
chamber to the other end of the chamber so as to facilitate liquid movement,
as well as the
bubble movement, from the inlet of the array chamber to the outlet of the
array chamber.
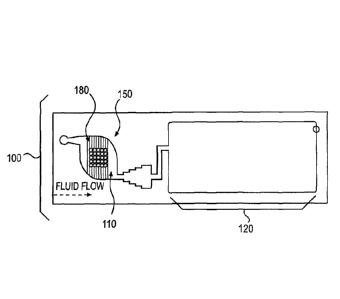
[0056] Figure lA shows an embodiment of a microarray assembly 100 designed to
facilitate the removal of air bubbles in the array chamber. The microarray
assembly 100
comprises a funnel-shaped array chamber 110 spanning from a sample inlet 112
to an outlet
114, which opens into a waste chamber 120 having an absorbent 122. The
microarray
chamber 110 contains a plurality of microarray spots 130 that are positioned
on top of a
substrate 150 (see Figure 1C), which also foul's the bottom of the array
chamber 110. In
certain embodiments, the array chamber 110 is connected to a reservoir 140. In
this
embodiment, the array chamber 110 has a progressively decreasing cross-
sectional area
towards the direction of the waste chamber 120, thus the capillary pressure
continuously
increases as the liquid in the array chamber 110 approaches the waste chamber
120. The
pressure difference leads to liquid movement towards the absorbent 122 in the
waste
chamber 120. In other words, the shape of the array chamber 110 provides
continuous
12
Date Recue/Date Received 2021-05-27
wicking of a liquid in the array chamber 110 in the direction of the waste
chamber 120 until
the liquid reaches the absorbent 122 in the waste chamber 120. In some
embodiments, the
cross section area at the inlet end of the array chamber 110 is at least 2-
times, 3-times, 4-
times or 5-times larger than the cross section area at the outlet end of the
array chamber 110.
[0057] In one embodiment, the array chamber 110 has a trapezoid shape with
dimensions that range from 0.5 to 20 mm on the inlet end and 0.1 to 5 mm on
the outlet end.
In another embodiment, the array chamber 110 comprises a series of steps that
have a
progressively smaller cross-sectional area from the inlet end to the outlet
end. These
features are designed to have a small radius of curvature on the advancing
front compared to
the receding front, so that air bubbles in the array chamber 110 advance
towards the waste
chamber 120, preventing the aforementioned issues associated with bubbles.
[0058] Figure 1B is a cross-sectional view of the microarray assembly 100
along
line AA in Figure 1A. In this embodiment, the microarray assembly 100
comprises the array
substrate layer 150, the spacer layer 160 and the cover layer 170. In one
embodiment, the
spacer layer is a double-sided tape, such as an inner gasket tape, with a
thickness of 0.25 mm
(available from 3M, Part No. 9087). In other embodiments, the array substrate
layer 150 is
injection molded plastic with features that create the walls of the array
chamber 110 and a
pocket for the waste chamber 120 and there is no spacer layer 160 in these
embodiments.
[0059] In other embodiments, a hydrophilic film is laminated to a plastic
array
substrate 150 with heat and/or pressure to form a hydrophilic surface on which
the
microarray is printed. The lamination may be performed with laser welding or
ultrasonic
welding.
[0060] Figure 2 provides a close-up view of the funnel shaped array chamber
110 of
Figure 1A. As shown in Figure 2, the decreasing chamber width or the "wedge"
shape of
the array chamber enables increasing capillary pressure on the side of the
waste chamber
120. This configuration allows bubbles to flow through the array chamber and
avoids
clogging of the array chamber 110 by air bubbles. This funnel-shaped narrow
chamber 110
also facilitates the diffusion of the target molecules in a sample to the
array spots 130. In
some embodiments, the sample is loaded into the reservoir 140 and continuously
flows
through the array chamber 110 and into the waste chamber 120.
[0061] In some embodiments, the microarray spots 130 are arranged in the form
of
multiple strips (e.g., protein strip array) that are perpendicular to the flow
in the array
chamber 110 so as to improve interaction between the target molecule in the
sample and the
array elements. In one embodiment, a protein array or a protein strip array is
printed inside
13
Date Recue/Date Received 2021-05-27
the array chamber 110. Proteins extracted from a sample are loaded into the
reservoir 140
and flow through the array spot 130 or strip 130 in a continuous fashion to
enter the waste
chamber 120.
[0062] A person of ordinary skill in the art would understand that the
microarray
assembly 100 may have many variations. For example, the entire microarray
assembly 100
may be molded in two halves creating a parting line that spans the center line
of the reservoir
140, the substrate 150 and the waste chamber 120. The parting line may take a
contoured
path to allow easy access for hydrophilic surface treatment of the top side of
the array
chamber 110, and/or printing the array spots 130 on the top surface of the
substrate 150.
The top half of the array assembly may be treated to be hydrophilic such as
with a plasma
treatment, a surfactant or any of the techniques described above, and bonded
into place using
ultrasonic welding, laser welding, snap fit design, glue, tape, or any bonding
method. In
some embodiments, the cover layer 170 is sized to cover only the chamber areas
but not the
complete top surface of the microarray assembly 100.
[0063] Figure 3 shows another embodiment of a microarray assembly 100 designed
to facilitate the removal of air bubbles in the array chamber 110 as well as
maintain the
sample within the array chamber 110 during prolonged exposure to extreme
temperatures
(up to 95 C). In this embodiment, the microarray assembly 100 comprises an
array chamber
110 having a sample inlet 112, a sample outlet 114 and a plurality of
microarray spots 130
positioned on top of the substrate 150, a waste chamber 120 having an
absorbent 122, an
inlet 116, and a vent 124 and a channel 118 that connects the sample outlet
114 of the array
chamber 110 to the inlet 116 of the waste chamber 120. In this embodiment, the
channel
118 has an expansion section 118A and a switchback section 118B. The expansion
section
118A has progressively increasing cross-sectional area towards the direction
of the waste
chamber 120, so that air bubbles in the array chamber 110, once entering the
channel 118,
are trapped on the side walls of the section 118A and do not block fluid flow
in the channel
118. The expansion section 118A helps to pin the contact line of the liquid on
the convex
corners of the section during sample expansion when the array chamber 110 is
exposed to
high temperatures. In one embodiment, the sidewall of channel 118 is
hydrophobic to trap
bubbles. In some embodiments, the cross-sectional area at the waste chamber
end of the
channel 118A is at least 2-times, 3-times, 4-times or 5-times larger than the
cross-sectional
area at the array chamber end of the channel 118A. In some embodiments, the
switchback
14
Date Recue/Date Received 2021-05-27
section 118B contains two turns to form an S-shaped or Z-shaped channel
section. In one
embodiment, the two turns are 900 turns.
[0064] In other embodiments, the array chamber 110 is fabricated with small
rectangular channels 180 (i. e. , channels with rectangular cross-sectional
areas) that are
perpendicular to the direction of the flow to provide a means of drying the
array (see Figure
4A). These channels 180 have sharp comers that result in small radius of
curvature of the
liquid-air interface, and thus provide high capillary pressures that advance
liquids along the
side walls and to the waste chamber 120. In another embodiment, the
rectangular channels
180 arc parallel to the liquid flow path (see Figure 4B). In another
embodiment, the
rectangular channels 180 are both parallel and perpendicular to the liquid
flow path (see
Figure 4C). In another embodiment the rectangular channels 180 intersect the
liquid flow
path at angles that range from 30 to 120 degrees (see Figure 4D). In another
embodiment,
the top surface of the substrate 150 is roughened to provide the same wicking
action along
the crevices of the surface.
The top surface could also be roughened such that there are square
microchannels
that are parallel, intersect, perpendicular, or some or all of these. The
contact angle at the
corners should be lower than 90 degrees so as to advance the liquid along
these channels
towards the waste chamber (absorbent). This approach is similar to that of the
tracheids
(square capillaries) in conifer trees that allow liquid to advance up the
length of trees,
overcoming the effects of hydrostatic pressure
Detection of Target Molecules With The Microarray Assembly
[0065] Another aspect of the present application relates to a method of using
the
microarray assembly described above to detect a target molecule in a sample.
The sample
can be any biological sample, such as a swab, nasopharyngeal aspirate or whole
blood
sample. The total nucleic acids may be isolated using techniques well-known to
a person of
ordinary skill in the art. In one embodiment, the total nucleic acids are
isolated with
commercially-available nucleic acid isolation reagents or kits, such as the
Qiagen reagents.
In another embodiment, the total nucleic acids are isolated with a sample
preparation device
developed by Akonni Biosystems. The generalized sequence of events for
Akonni's sample
preparation methods includes denaturing the sample in a lysis buffer;
continuous perfusion
of the lysed sample over the sample preparation device; washing and eluting
the nucleic
acids from the sample preparation device.
[0066] The isolated nucleic acids are loaded into the microarray system and
amplified within the microarray assembly using methods well-known to one
skilled in the
Date Recue/Date Received 2021-05-27
art. After amplification, the microarray assembly is incubated for a period of
time at a
desired temperature (e.g., 10-60 min at 50-65 C) to allow the amplicons to
hybridization to
the microarray. After incubation, the microarray system is washed (e.g., with
water) and
imaged on a microarray reader (e.g., Alconni's portable microarray reader). In
one
embodiment, the microarray system is dried prior to imaging. In another
embodiment, the
drying procedure is accomplished with acetone introduction to the array
chamber and/or
heating the array chamber. In another embodiment, amplification of the
isolated nucleic
acids and labeling of the amplification products occur in an asymmetric PCR
master mix
containing fluorescently labeled "reverse" primers in large excess (e.g., 5-20
fold excess)
over unlabeled, "forward" primers. This strategy generates predominantly
single-stranded
targets with a single label on their 5' end.
100671 The array test can be performed with many variations. In one
embodiment,
the amplified product remains in the reaction chamber after hybridization and
there is no
washing before imaging of the microarray. In another embodiment, the amplified
product
remains in the array chamber, and the array spots are imaged in real-time
during
hybridization in order to show growth curves as described by Khodakov et al.,
2008. In yet
another embodiment, the array chamber supports a series of incubation and wash
steps for
multi-step assays such as ELISAs. In one embodiment, the incubation step is
performed
under periodic or continuous vibration to improve interaction between the
array elements
and the target proteins.
Manufacturing of the Microarray Assembly
[0068] Another aspect of the instant application relates to a method for
manufacturing microarray assemblies having a substrate layer, a spacer layer
and a cover
layer using rollable thin film materials and reel-to-reel equipment. Briefly,
rollable film
materials are used for the substrate layer, the spacer layer and the cover
layer of the
microarray assembly. The films are layered together by unraveling several
reels on top of
one another, creating a sandwich of desired components, which are cut to size
at the end of
the manufacturing line. Specifically, a rollable substrate film is advanced
onto a
manufacturing platform. Array spots are printed onto the film, foiming
microarrays with a
fixed interval between arrays. The printed substrate film is then laminated
with a rollable
spacer tape that has been pre-cut with a separate reel-to-reel manufacturing
method to create
space for the array chamber. A rollable cover film is then laminated on top of
the spacer
film to seal off the array chamber. In some embodiments, the rollable spacer
tape is pre-cut
to create space for the array chamber and one or more waste chambers. An
absorbent is
16
Date Recue/Date Received 2021-05-27
placed into each waste chamber prior to the lamination of the cover film to
the spacer film.
The virtue of this manufacturing method is that high volume production can be
very cost
effective because with standard production equipment, assembly of the
microarray
assemblies can be completely automated at very high speeds.
[0069] The substrate film can be any thin film having a surface that has
double
bonded carbon atoms. Preferably, the substrate film has a hydrophobic surface.
Examples
of the substrate film include, but are not limited to, polyester films,
polyester/polycarbonate
blend films, polytetrafluoroethylene, polyethylene, polyetherimide, polyether
ether ketone,
and polystyrene. In some embodiments, the substrate film has a thickness in
the range of
20-200 microns, preferably 50-125 microns.
[0070] The spacer film can be any double-sided tape with a desired thickness.
In
certain embodiments, the spacer film is made from a hydrophobic material and
has a
thickness in the range of 20-500 micron, preferably 100-300 microns. Examples
of the
spacer film include, but are not limited to, polyester films,
polyester/polycarbonate blend
films, polypropylene, polycarbonate, acetal, poly(methyl methyacrylate), 256M
tape from
Adchem, and polytetrafluoroethylene. The cover film can be any thin film with
a
hydrophilic surface. Examples of hydrophilic film include, but are not limited
to, Vistex
and Visguard films (Film Specialties Inc., Hillsborough, NJ), and Lexan HPFAF
(GE
Plastics, Pittsfield, MA). Other hydrophilic surfaces are available from
Surmodics, Inc.
(Eden Prairie, MN), Biocoat Inc. (Horsham, PA), Advanced Surface Technology
(Billerica,
MA), and Hydromer, Inc. (Branchburg, NJ).
[0071] In some embodiments, the cover film has a thickness in the range of 25-
250
microns, preferably 50-150 microns.
[0072] In some embodiments, the microarray is a gel spot microarray printed
onto
the substrate film with a non-contact microarray printer (e.g., a
piezoelectric printer) that
allows for printing on a moving film. In some embodiments, the gel spots
comprise probes,
such as protein probes or nucleotide probes that are covalently cross-linked
to the polymer
backbone by UV-induced co-polymerization.
[0073] Figure 5 shows an embodiment of a reel-to-reel assembly line for the
manufacturing of the microarray device of the present application. Briefly, a
substrate film
510 is laid onto the assembly line 500 by the substrate film reel 512. A gel
spot printer 514
prints array spots onto the substrate film 510. Probes in the gel spots are
covalently cross-
linked to the polymer backbone by UV illumination. In one embodiment, the
crosslinking is
accomplished via a single-step, Argon-atmosphere, UV-induced co-polymerization
process
17
Date Recue/Date Received 2021-05-27
in a UV chamber 516. In one embodiment, the thin films are held in place using
the inherent
tension between reels on the system. This improves UV illumination uniformity
on the
surface of the thin film by keeping the films flat in the UV chambers during
polymerization.
The crosslinked microarray is washed at the wash station 518, dried by air
knives 520 and
examined by the quality control (QC) camera 522. Defective arrays can be
marked by a
reject marker 524 and a spacer film 526 is laminated onto the substrate film
510 by the
spacer tape reel 528. The spacer film 526 can be pre-cut prior to lamination
to create space
for an array chamber and one or more waste chambers. Absorbents 530 are then
added to
the waste chambers using, such that size-on precut pieces of absorbent with an
adhesive
backing are placed in the open waste chamber via the absorbent reel 532. A
cover film 534
is then laminated on top of the substrate/spacer layer structure by the cover
film reel 536.
The assembled layer structure is then cut by the guillotine 538 to produce
individual
microarray assemblies.
EXAMPLES
Example 1
Method for compensating microarray printing variations
[0074] Gel drop microarrays with Cy3 and Cy5 fluorophores were printed on ten
separate slides according to the following assembly map. The following steps
arc used for
printing the microarray: (1) prepare the appropriate Cy3/Cy5 oligo mixture and
dry it down
on a CentriVap, (2) prepare a copolymer solution (monomer+cross-
linker+glycerol buffer),
(3) dissolve the dried oligo in copolymer solution, (4) place solution into a
source plate, and
(5) use the source plate for array printing/polymerization/washing.
Assembly Map
1 2 3 4 5 7 8 9 6 10 10
1 Cy3:Cy5(1:1) Cy3:Cy5(1:1) Cy3:Cy5(1:1) Cy3:Cy5(1:1) Cy3:Cy5(1:1)
Cy3:Cy5(1:1) Cy3:Cy5(1:1) Cy3:Cy5(1:1) Cy3:Cy5(1:1) Cy3:Cy:5(111) Cy3:Cy5(1:1)
2 Cy3:Cy5(1:1) Cy3:Cy5(1:1) Cy3:Cy5(1:1) Cy3:Cy5(1:1)
Cy3:Cy5(1:1) Cy3:Cy5(1:1) Cy3:Cy5(1:1) Cy3:Cy5(1:1) Cy3:Cy5(1:1)
Cy3:Cy5(1: 1) Cy3:Cy5(1:1)
3 Cy3:Cy5(1:1) Cy3:Cy5(1:1) Cy3:Cy5(1:1) Cy3:Cy5(1:1)
Cy3:Cy5(1:1) Cy3:Cy5(1 :1) Cy3:Cy5(1:1) Cy3:Cy5(1:1) Cy3: Cy5(1:
1) Cy3:Cy5(1:1) Cy3:Cy5(1: 1)
4 (:3(:s(1 :1) Cy3:Cy5(1:1) Cy3:Cy5(1:1) Cy3:Cy5(1 :1)
Cy3:Cy5(1:1) Cy3:Cy5(1:1) Cy3:Cy5(1:1) Cy3:Cy5(1:1) Cy3:Cy5(1:1)
Cy3:Cy5(1:1) Cy3:Cy5(1:1)
Cy3:Cy5(1:1) Cy3:Cy5(1:1) Cy3:Cy5(1:1) Cy3:Cy511:1) Cy3:Cy5(1:1) Cy3:Cy5(1:1)
Cy3:Cy5(1:1) Cy3:Cy5(1:1) Cy3:Cy5(1:1) Cy3:Cy5(1:1) Cy3:Cy5(1:1)
6 Cy3:Cy5(1:1) Cy3:Cy5(1:1) Cy3:Cy5(1:1) Cy3:Cy5(1:1) Cy3:Cy5(1:1)
Cy3:Cy5(1:1) Cy3:Cy5(1:1) Cy3:Cy5(1:1) Cy3:Cy5(1:1) Cy3:Cy5(1:1) Cy3:Cy5(1:1)
7 Cy3:Cy5(1:1) Cy3:Cy5(1:1) Cy3:Cy5(1:1) Cy3:Cy5(1:1) Cy3:Cy5(1:1)
Cy3:Cy5(1:1) Cy3:Cy5(1:1) Cy3:Cy5(1:1) Cy3:Cy5(1:1) Cy3:Cy5(1,1) Cy3:Cy5(1:1)
8 Cy3:Cy5(1:1) Cy3:Cy5(1:1) Cy3:Cy5(1:1) Cy3:Cy5(1:1) Cy3:Cy5(1:1)
Cy3:Cy5(1:1) Cy3:Cy5(1:1) Cy3:Cy5(1:1) Cy3:Cy5(1:1) Cy3:Cy5(1:1) Cy3:Cy5(1,1)
9 Cy3:Cy5(1:1) Cy3:Cy5(1:1) Cy3:Cy5(1:1) Cy3:Cy5(1:1)
Cy3:Cy5(1:1) Cy3:Cy5(1:1) Cy3:Cy5(1:1) Cy3:Cy5(1:1) Cy3:Cy5(1:1)
Cy3:Cy5(1 :1) Cy3:Cy5(1:1)
Cy3:Cy5(1:1) Cy3:Cy5(1:1) Cy3:Cy5(1 :1) Cy3:Cy5(1:1)
Cy3:Cy5(1:1) Cy3:Cy5(I :I ) Cy3:Cy5(1:1) Cy3:Cy5(1:1) Cy3:Cy5(1.1)
Cy3:Cy9(1.1) Cy3:Cy5(1:1)
11 Cy3:Cy5(1:1) Cy3:Cy5(1:1) Cy3:Cy5(1:1) Cy3:Cy5(1:1)
Cy3:Cy5(1:1) Cy3:Cy5(1:1=1 Cy3:Cy5(1:1) Cy3:Cy5(1:1) Cy3:Cy5(1:1)
Cy3:Cy5(1 : 1) Cy3:Cy5(1:1)
18
Date Recue/Date Received 2021-05-27
12 Cy3:Cy5(1:1) Cy3:Cy5(1:1) Cy3:Cy5(1:1) Cy3:Cy5(1:1) Cy3:Cy5(1:1)
Cy3:Cy5(1:1) Cy3:Cy5(1:1) Cy3:Cy5(1:1) Cy3:Cy5(1:1) Cy3:Cy5(1:1) Cy3:Cy5(1:1)
13 Cy3:Cy5(1:1) Cy3:Cy5(1:1) Cy3:Cy5(1:1) Cy3:Cy5(1:1) Cy3:Cy5(1:1)
Cy3:Cy5(1:1) Cy3:Cy5(1:1) Cy3:Cy5(1:1) Cy3:Cy5(1:1) Cy3:Cy5(1:1) Cy3tCy5(1:1)
14 Cy3:Cy5(1:1) Cy3:Cy5(1:1) Cy3:Cy5(1:1) Cy3:Cy5(1:1) Cy3:Cy5(1: Cy3:Cy5(1:1)
Cy3:Cy5(1:1) Cy3:Cy5(1:1) Cy3:Cy5(1:1) Cy3:Cy5(1:1) Cy3:Cy5(1:1)
15 Cy3:Cy5(1:1) Cy3:Cy5(1:1) Cy3:Cy5(1:1) Cy3:Cy5(1:1) Cy3:Cy5(1:1)
Cy3:Cy5(1:1) Cy3:Cy5(1:1) Cy3:Cy5(1:1) Cy3:Cy5(1:1) Cy3:Cy5(1:1) Cy3:Cy5(1:1)
16 Cy3:Cy5(1:1) Cy3:Cy5(1:1) Cy3:Cy5(1:1) Cy3:Cy5(1:1) Cy3:Cy5(1:1)
Cy3:Cy5(1:1) Cy3:Cy5(1:1) Cy3:Cy5(1:1) Cy3:Cy5(1:1) Cy3:Cy5(1:1) Cy3:Cy5(1:1)
17 Cy3:Cy5(1:1) Cy3:Cy5(1:1) Cy3:Cy5(1:1) Cy3:Cy5(1:1)
Cy3:Cy5(1:1) Cy3:Cy5(1:1) Cy3:Cy5(1: I) Cy3:Cy5(1:1) Cy3:Cy5(1:1)
Cy3:Cy5(1:1) Cy3:Cy5(1:1)
18 Cy3:Cy5(1:1) Cy3:Cy5(1:1) Cy3:Cy5(1:1) Cy3:Cy5(1:1) Cy3:Cy5(1:1)
Cy3:Cy5(1:1) Cy3:Cy5(1:1) Cy3:Cy5(1:1) Cy3:Cy5(1:1) Cy3:Cy5(1:1) Cy3:Cy5(1:1)
A GenePix 4000B with the following settings was used for analysis: 100% Laser
power for
both colors, gain of 500 for the red channel and gain of 375 for the green
channel
photomultiplier tube voltage setting, 5 vim resolution, and 175 tun diameter
circles.
Integrated intensities were calculated for each spot using the GenePix
software, and relative
standard deviations (RSD) were calculated for all 198 Cy5 spots, 198 Cy3 spots
and the ratio
of Cy3/Cy5 spots. As seen in Table 1, the coefficient of variation (CV) is
lower for all 10
slides when using a ratio of the Cy3/Cy5 integrated intensity compared to the
intensity of the
Cy3 or Cy5 signals, in some cases by a factor as high as 3. This data support
the
implementation of an internal fluorescence control, such as a Cy5 dye, that is
scanned or
imaged as part of the manufacturing QC to compensate for variability due to UV
dosage,
temperature, surface properties, synthesis, viscosity, condensation, washing
(i. e. , due to
effects caused by differences in temperature, viscosity, flow rate, stringency
or anything that
may influence the removal or distortion of the spots), depth of pin immersion
in the polymer
solution for pin printing technologies or any property that could influence
the
morphologyand or concentration of the probes within a given spot.
Table 1
Slide Cy5 RSD Cy3 RSD Cy3/Cy5 RSD
1 17.5% 12.1% 7.6%
2 14.3% 10.0% 5.5%
3 10.8% 8.5% 3.1%
4 5.5% 3.7% 3.0%
7.5% 6.0% 2.5%
6 5.1% 5.0% 1.4%
7 8.5% 6.0% 4.1%
8 11.7% 7.8% 5.1%
9 6.6% 5.0% 3.6%
4.6% 4.5% 3.5%
Example 2
Method of image analysis
19
Date Recue/Date Received 2021-05-27
[0075] The internal fluorescence control has been implemented on Akonni's MRSA
microarrays and shown to be effective in compensating for the variability in
the intensity of
fluorescence. Table 2 shows the fluorescence data of one set of 4 gel drops in
MRSA
microarrays doped with Cy5 fluorophores and MecA probes. Integral signal
intensities were
tabulated for all 4 replicate drops taken during factory QC (red-channel) and
post-
hybridization (green-channel). Due to physical damage to replicate 3, both the
red-channel
and green-channel showed significantly reduced integral signal intensities for
replicate 3.
As the result of the reduced replicate 3, signal intensity, the relative
deviation is 23.8% and
29.5% for red-channel and green-channels, respectively. When the green-channel
and red-
channel data is calculated as a ratio, the relative deviation is reduced to
12.2%. This
demonstrates that internal fluorescence control data (red-channel) can be used
to reduce the
variability of the microarray image and/or microarray production.
Table 2
Integral of Signal Intensities
Replicate 1 Replicate 2 Replicate 3 Replicate 4 Mean
Standard%RSD
Deviation
Red-Channel 1031897 1095959 613676 1063218 951187 226522 23.8%
Green-Channel 2812769 3707689 1909522 3874995 3076244 906896
29.5%
Green/Red
2.725823 3.383054 3.111613 3.644591 3.21627 0.392754 12.2%
Ratio
Example 3
Algorithms for image generation
Algorithm 1
[0076] This algorithm takes a pre-hybridization Cy5 QC image of the array and
generates a data file containing QC parameters of the array.
1. Read the Cy5 QC image and create two local copies, one is the un-altered
original
(CY5_Original), and another one will be transformed into a binary image
(Cy5_Processed)
in steps 2 and 3.
2. Take the Cy5_Processed image, apply digital filtering and pixel
operation to produce
an image with uniform and zero-valued background.
3. Threshold the image into a binary image and save as Cy5_Processed.
Date Recue/Date Received 2021-05-27
4. Apply particle analysis to the binary image (Cy5_Processed) to
identified, filtered
objects based on size. Measure and record parameters of the objects: center of
mass,
bounding box, particle area and ellipticity.
5. Check to see if the number of objects identified in step 4 meets
minimum
requirement, otherwise reject the slide.
6. Find grid.
a. Select one object and assume its center of mass is the grid origin.
b. Form the grid and calculate the pixel location of each grid cell.
c. Apply all objects to the grid and check if at least 80% of the grid cell
that should
contain a Cy3 drop, has objects inside. If yes, the grid has been found and
proceed to step
7. If not, repeat 6A through 6C with a different object's center of mass as
the grid origin.
7. Rotate the image so the angle formed by the Cy3 drops is less than
0.2 degree from
the horizontal axis.
8. Fine-tune the grid. Because in step 6, grid origin is determined by
center of mass
from an object in the binary image, the center of mass could deviate slightly
from the true
center of the object.
a. Move the grid origin by (0,1), i.e, subtract X-coordinate by 0 pixel
and Y-coordinate
by 1 pixel.
b. For each Cy3 drop, calculate the following:
i. Deviation X: Distance in X coordinate between center of Cy3 drop and center
of
its grid cell.
ii. Deviation Y: Distance in Y coordinates between center of Cy3 drop and
center of
its grid cell.
c. Summarize the deviations for all Cy3 drops, using
score=Sum(abs(DeviationX) abs(DeviationY)). A lower score means better grid
placement.
d. Repeat 8A through 8C for a total of 24 combinations, shown in the
table below.
e.
-2,2 -1,2 0,2 1,2 2,2
-2,1 -1,1 0,1 1,1 2,1
-2,0 -1,0 -1,0 2,0
-2,-1 -1,-1 0,-1 1,-1 2,-1
-2,-2 -1,-2 0,-2 1,-2 2,-2
f. Choose the grid center so its score is the lowest.
9. Calculate QC data of each spot.
21
Date Recue/Date Received 2021-05-27
a. Deviation X: X coordinate of center of drop MINUS X coordinate of center
of grid cell.
b. Deviation Y: Y coordinate of center of drop MINUS Y coordinate of center
of grid cell.
c. Reject Flag: Reject a spot based on diameter, ellipticity, etc.
d. Spot Intensity
e. Diameter
10. Write QC data to a text file, refer to Table 3.
Table 3. Example Array QC Data.
Grid Grid Spot Grid Center Spot Diamete
Reject? Grid Center Y Deviation X Deviation Y
Intensity r
Row Column Type X
1 1 Cy3 FALSE 105 88 3 1 214381 8.85
__________________________________________________________ 8
1 2 Empty FALSE 135 88 0 0 261 0.00
1 3 Empty FALSE 166 88 0 0 568 0.00
1 4 Empty FALSE 196 88 0 0 -87 0.00
1 5 Empty , FALSE 226 88 0 0 228 , 0.00
1 , 6 Cy3 FALSE 257 88 ' 0 3 1612600 9.72
,
1 7 Cy3 FALSE 287 88 , 1 3 1567664 9.02
1 8 Empty FALSE 318 , 88 0 0 , 506 0.00
1 9 Empty FALSE 348 88 0 0 1426 0.00
1 10 Empty FALSE 378 , 88 0 0 , 3420 0.00
1 II Empty , FALSE 409 88 0 0 991 0.00
1 12 Cy3 FALSE 439 88 -1 3 2216029 9.65
2 1 Empty FALSE 105 119 0 0 , -319 , 0.00
2 2 Empty FALSE 135 119 0 0 334 0.00
2 3 Probe 31 FALSE 166 119 5 0 1618379 ,10.12
2 4 Empty FALSE 196 119 0 0 486 0.00
2 5 Empty FALSE 226 119 , 0 , 0 83 , 0.00
2 6 H FALSE 257 119 -1 -1 175039 8.99
6
2 7 Empty FALSE 287 119 0 0 40709 0.00
2 ,8 Empty FALSE 318 119 0 0 -162 0.00
2 9 Probe 31 FALSE 348 119 0 3 206106 10.61
4
2 , 10 Empty FALSE -378 119 0 0 127 0.00
2 11 Empty FALSE 409 119 0 0 , 289 ,
0.00,
2 12 H FALSE 439 119 -1 3 203063 9.19
3 1 Empty FALSE 105 149 0 0 1143 0.00
3 2 Probe 14 FALSE 135 149 4 1 222256 9.43
5
22
Date Recue/Date Received 2021-05-27
Grid Grid Spot Grid Center Spot Diamete
Reject? Grid Center Y Deviation X Deviation Y
Intensity r
Row Column Type X
,
3 3 Probe 35 FALSE 166 149 2 1 208847 9.16
8
3 4 Empty FALSE 196 149 0 0 3938 0.00
3 5 Empty FALSE 226 149 0 0 -96 0.00
3 6 Empty FALSE 257 149 0 0 -33 0.00 _
3 7 Empty FALSE 287 149 0 0 582 0.00
3 8 Probe 14 FALSE 318 149 0 1 207326 9.90
1
3 9 Probe 35 FALSE 348 149 2 1 165117 8.86
0
3 10 Empty FALSE 378 149 0 0 837 0.00
3 11 Empty FALSE 409 149 0 0 370 0.00
3 12 Empty FALSE 439 149 0 0 315 0.00
4 1 Empty FALSE 105 180 0 0 162 0.00
4 2 Empty FALSE 135 180 0 0 -179 0.00
4 3 Probe 36 FALSE 166 180 3 2 178271 8.49
4 4 Empty FALSE , 196 180 0 0 633 0.00
4 5 Probe 29 FALSE 226 180 3 0 171520 9.51
5
4 6 Empty FALSE 257 180 0 0 274 0.00
4 7 Empty FALSE , 287 180 0 0 242 0.00
4 8 Empty FALSE 318 180 0 0 329 0.00
4 9 Probe 36 FALSE 348 180 -1 -1 166654 9.66
5
4 10 Empty FALSE 378 , 180 0 0 12157 0.00
4 11 Probe 29 FALSE 409 180 -1 1 170659 10.47
0
4 12 Empty FALSE 439 180 0 0 1180 0.00
5 1 Empty FALSE 105 210 0 0 308 0.00
5 2 Empty FALSE 135 210 0 0 180 0.00
153745
5 3 Probe 37 FALSE 166 210 2 1 9.70
5
5 4 dN20 FALSE 196 210 1 0 185484 10.35
9
5 5 Empty FALSE 226 210 0 0 486 0.00
5 6 Probe 90 FALSE 257 210 2 1 169765 9.01
1
5 7 Empty FALSE 287 210 0 0 -115 0.00
5 8 Empty FALSE 318 210 0 0 -382 0.00
5 9 Probe 37 FALSE 348 210 1 2 200971 9.84
5 .
5 10 dN20 FALSE 378 210 0 1 218769 10.80
__________________________________________________________ 5
5 11 Empty FALSE 409 210 0 0 1099 0.00
5 12 Probe 90 FALSE 439 210 0 0 200750 10.03
4 ,
6 1 Cy3 FALSE 105 240 5 0 126467 8.35
1
6 2 Empty FALSE 135 240 0 0 -203 0.00
23
Date Recue/Date Received 2021-05-27
Grid Grid Spot Grid Center Spot Diamete
Reject? Grid Center Y Deviation X Deviation Y
Intensity r
Row Column Type X
6 3 Empty FALSE , 166 240 0 0 = 476 0.00
6 4 Empty FALSE 196 240 0 0 214 0.00
6 5 Empty FALSE 226 240 0 0 695 0.00
6 6 Empty FALSE 257 240 0 0 218 0.00
6 7 Cy3 FALSE 287 240 1 3 112595 9.57
9
6 8 Empty FALSE 318 240 0 0 107 0.00
6 9 Empty FALSE 348 240 0 0 874 0.00
6 10 Empty , FALSE 378 240 0 0 617 0.00
6 11 Empty FALSE 409 240 0 0 528 0.00
6 12 Empty FALSE 439 240 0 0 580 0.00
7 1 Cy3 FALSE 105 271 = 1 -1 173487 9.71
7
7 2 Empty FALSE 135 271 0 0 -634 0.00
7 3 Empty FALSE 166 271 0 0 -69 0.00
7 4 Empty FALSE 196 271 0 0 276 0.00
7 5 Empty FALSE 226 271 0 0 -199 0.00
7 6 Cy3 FALSE 257 271 0 -2 158173 10.49
__________________________________________________________ 7
7 7 Cy3 FALSE 287 271 0 0 152202
6
7 8 Empty FALSE 318 271 0 , 0 -748 0.00
7 9 Empty FALSE 348 271 0 0 2635 0.00
7 10 Empty FALSE 378 271 0 0 747 0.00
7 11 Empty FALSE 409 271 0 0 246 0.00
7 12 Cy3 FALSE 439 271 -1 0 164010 10.37
4
8 1 Empty FALSE 105 301 0 0 586 0.00
8 2 Empty FALSE 135, 301 0 0 439 0.00
8 3 Probe 31 FALSE 166 301 1 -1 200884 10.06
3
8 4 Empty FALSE 196 301 0 0 247 0.00
8 5 Empty FALSE 226 301 0 0 319 0.00
8 6 H FALSE 257 301 -1 0 153413 10.46
2
8 7 Empty FALSE 287 301 0 0 -477 0.00
8 8 Empty FALSE 318 301 0 0 13815 0.00
8 9 Probe 31 FALSE 348 301 -1 -1 170482 10.04
8
'
8 10 Empty FALSE 378 301 0 0 = 260 0.00
8 11 Empty FALSE 409 301 0 0 2993 0.00
8 12 H FALSE 439 301 0 2 156967 9.96
1
9 1 Empty FALSE 105 332 0 0 148 0.00
9 2 Probe 14 FALSE 135 332 2 -3 196928 9.77
6
9 3 Probe 35 FALSE 166 332 3 -1 163638 9.53
1
9 4 Empty FALSE 196 332 0 0 792 0.00
24
Date Recue/Date Received 2021-05-27
Grid Grid Spot Grid Center Spot Diamete
Reject? Grid Center Y Deviation X Deviation Y
Intensity r
Row Column Type X
9 5 Empty FALSE 226 332 0 0 -377 0.00
9 6 Empty FALSE 257 332 0 0 594 0.00
9 7 Empty FALSE 287 332 0 0 570 0.00
9 8 Probe 14 FALSE 318 332 1 -3 181267 10.36
7
9 9 Probe 35 FALSE 348 332 0 -2 188176 9.97
4
,
9 10 Empty FALSE 378 332 0 0 444 0.00
9 11 Empty FALSE 409 332 0 0 -423 0.00
9 12 Empty FALSE 439 332 0 0 287 0.00
1 Empty FALSE 105 362 0 0 426 0.00
10 , 2 Empty FALSE 135 362 0 0 -23 0.00
10 3 Probe 36 FALSE 166 362 1 4 158221 9.85
2
10 4 Empty FALSE 196 362 0 0 1518 0.00
10 5 Probe 29 FALSE 226 362 1 -1 162929 11.09
1
10 6 Empty FALSE 257 362 0 0 4511 0.00
10 7 Empty FALSE 287 362 0 0 201 0.00
10 8 Empty FALSE 318 362 0 0 -397 0.00
10 9 Probe 36 FALSE 348 362 -1 1 168358 9.69
9
10 10 Empty FALSE 378 362 0 0 75 0.00
10 11 Probe 29. FALSE 409 362 0 1 176395 10.31
1
10 12 Empty FALSE 439 362 0 0 607 0.00
11 1 Empty FALSE 105 392 0 0 -321 0.00
11 2 Empty FALSE 135 392 0 0 437 0.00
11 3 Probe 37 FALSE 166 392 0 4 178213 9.95
__________________________________________________________ 0
11 4 dN20 FALSE 196 392 3 -2 188673 10.28
5
11 5 Empty FALSE 226 392 0 0 293 0.00
11 6 Probe 90 FALSE 257 392 0 -4 156956 10.77
7
11 7 Empty , FALSE 287 392 0 0 1805 0.00
11 8 Empty FALSE 318 392 0 , 0 -262 0.00
11 9 Probe 37 FALSE 348 392 -1 -3 187281 9.83
9
11 10 dN20 FALSE 378 392 1 4 203419 10.21
__________________________________________________________ 4
11 11 Empty FALSE 409 392 0 0 -258 0.00
169353
11 12 Probe 90 FALSE 439 392 0 0 10.95
4
12 1 Cy3 FALSE 105 423 3 -1 165843 8.06
3
12 2 Empty FALSE 135 423 0 0 521 0.00
12 3 Empty FALSE 166 423 0 0 285 0.00
12 4 Empty FALSE 196 423 0 0 -447 0.00
12 5 Empty FALSE 226 423 0 0 -436 0.00
Date Recue/Date Received 2021-05-27
Grid Grid Spot Grid Center Spot Diamete
Reject? Grid Center Y Deviation X Deviation Y Row Column Type
X Intensity r
12 6 Empty FALSE 257 423 0 0 -129 0.00
12 7 Cy3 FALSE 287 423 1 0 139285 8.72
3
12 8 Empty FALSE 318 423 0 0 257 0.00
12 9 Empty FALSE 348 423 0 0 649 0.00
12 10 Empty FALSE 378 423 0 0 -108 0.00
12 11 Empty FALSE 409 423 0 0 64 0.00
12 12 Empty FALSE 439 423 0 0 -84 0.00
Algorithm 2
100771 This process takes two pictures of the post-hybridization array: one
with
normal exposure (Image_NormalExposure) and one with high-exposure to emphasize
the
Cy3 beacon (Image_HighExposure).
1. Read Image_HighExposure and Image_NormalExposure into memory.
2. Read from QC text file.
3. Operate on Image_HighExposure Image to find grid.
a. Take the Cy5 HighExposure image, apply digital filtering and pixel
operation to
produce an image with uniform and zero-valued background.
b. Threshold the image to into a binary image.
c. Apply particle analysis to the binary image to identified, filtered
objects based on
size. Measure and record parameters of the objects: center of mass, bounding
box, particle
area and ellipticity.
d. Check to see if the number of objects identified in step 3C meets the
minimum
requirement, otherwise reject the slide.
e. Find grid, similar to step 6 in Algorithm 1.
f. Rotate the image so the angle formed by the Cy3 drops is less than 0.2
degree from
the horizontal axis.
g. Fine-tune the grid, similar to step 8 in Algorithm 1.
4. Apply the grid found in Image HighExposure to the
Image_NormalExposure.
5. Using X-Deviation, Y-Deviation, diameter and reject flag from the QC
file to
determine the relevant spot parameters.
a. If Reject Flag is true, then exclude the spot from analysis.
b. Spot X coordinate: X coordinate of the center of the grid PLUS X-
Deviation.
c. Spot X coordinate: Y coordinate of the center of the grid PLUS Y-
Deviation.
d. Spot diameter: Spot diameter from QC data.
26
Date Recue/Date Received 2021-05-27
6. Calculate intensity of spot and background.
7. Perform final calculation to determine analytical results.
Example 4
[0078] A protein microarray assembly is constructed using gel drop elements
containing antibodies. Glass slides with printed gel element microarrays are
blocked with
PBS containing 1% BSA for 1 hour at room temperature. The slides are rinsed
with DI
water and allowed to air dry in a dust-free environment. The microarray
assembly is then
assembled with the blocked glass slide, laser cut 256M tape from Adchem,
hydrophilic
Lexan film, and a reservoir. Approximately 0.5 mL of SEB (1 1.1g/mL in PBS
with 0.05%
Tween-20 and 1% BSA) is pipetted into the reservoir of the microarray system,
and
continuously imbibes through the array chamber at room temperature. Next, 0.2
mL of anti-
SEB monoclonal antibody dilution in PBST with 1% BSA is pipetted into the
reservoir of
the microarray system, which continuously imbibes through the array chamber
and into the
waste chamber. Then, 0.2 mL of PBST is pipetted into the reservoir of the
microarray
system, which continuously imbibes through the array chamber and into the
absorbent of the
waste chamber. Subsequently, 0.1 mL of Alexa 568 labeled anti-mouse antibody
at 2 tg/mL
in PBST with 1% BSA is pipetted into the reservoir of the microarray system,
which
continuously imbibes through the array chamber and into the absorbent of the
waste
chamber. An additional 0.2 mL of PBST wash is pipetted into the reservoir of
the
microarray system, which continuously imbibes through the array chamber and
into the
absorbent of the waste chamber. The microarray system is then imaged using a
green laser
(532 nm) with 605 nm filter on Aurora PortArray 5000.
Example 5
[0079] Oligonucleotide mixtures are synthesized for MRSA according to the
array
map shown in Figure 9. Each probe is synthesized along with the internal
control probe
Cy5. Additional Cy3 control probes, attached to the same oligonucleotide
sequence, are also
mixed with the Cy5 control probes. Cy3/Cy5 spots are printed in concentrations
that range
from 0.1 nM to 10 M in 1 log concentration changes for the purposes of
establishing a
calibration curve. An imaging system consists of two optical trains. Both
optical trains
consist of an LED and a non-cooled CCD camera. One optical train is for
detecting Cy3
spots (550nm excitation and 570nm emission), and the other optical train is
for detecting
Cy5 spots (650nm excitation and 670nna emission). The optical trains are fixed
in space in
relation to the instrument. A moving stage moves the array to the green
channel and 10
27
Date Recue/Date Received 2021-05-27
images are acquired to improve the dynamic range; acquisition of multiple
images at short
exposure times prevents saturation that may occur as a result of using
materials with high
autofluorescence while also allowing signal averaging to reduce the effect of
random noise.
The stage moves the array to the red channel and 10 images are acquired. The
process
repeats 5 times to account for possible misalignment due to positional
accuracies, improper
exposure time, out of focus spots and/or any other anomalies that might
compromise proper
imaging. A calibration curve is plotted with respect to the Cy3/Cy5 serial
dilution of
concentrations as shown by the outer boundary of the array in the assembly map
below. The
calibration curve, derived from this concentration gradient, is intended to
correct for factors
that affect the entire assembly such as shelf-life degradation of the probes,
temperature,
changes in UV dosage, synthesis variations, or any systemic artifact that can
result in
irreproducible behavior. The calibration curve for Cy5 is plotted during
analysis with the
calibration curve for Cy3.
/a ntrea X Trioles(C275)-1- brad
1 green = Trigreen X rnoles(C3,T3) 4- bgreen
where 'red and 'given are background-subtracted integral intensities. The
slopes, m red and
Mgreenl and the intercepts, bred and b
green, are calculated from these calibration curves.
Averages of the calibration curves are plotted and outliers are rejected. To
account for
irreproducibility from spot-to-spot, assembly-to-assembly and lot-to-lot, the
Cy5
background-subtracted integral intensity value is calculated for each spot.
During synthesis,
the probe (14, 31, 35, 36, 37, 29, 90, H, or dN20) concentrations for each
spot have an
equimolar concentration of oligonucleotide probe and Cy5 fluorophores for each
spot. Thus,
the following relationship holds:
Cy3 concentration =irt; Cy5 concentration.
Therefore,
Ifireen,,saturation re. mow, x Inc res(Cy5) + !larger,
where ig
reen,saturation represents the hypothetical situation where all probes in the
gel element
are bound to labeled-Cy3 molecules. Note, moles(Cy5) replaces moles(Cy3)
because of
equimolar equivalency in the equation above. The background-corrected integral
intensity
of the probes for spots that determine presence of MRSA is measured at the
representative
spots, and calculated. If this intensity meets the following criteria:
_______________ > 0.001
J.7 gYL Z-U tl-Z. 0 n
28
Date Recue/Date Received 2021-05-27
the value is considered positive. That is, more than 0.1% of the possible
probe molecules
have bound target with Cy3 labels. This method may also be used for
quantitation.
Example 6
[0080] Kiss-cut tape reels are manufactured for the spacer tape reel, which
contains
the spacer cut out, and the cover tape reel are pre-punched with the inlet and
vent fill holes.
As shown in Figure 5, during production, the substrate film reel unravels and
the release
liner is collected on the top reel. The gel element printer prints the gel
elements on the
substrate fiLm. The film is then exposed to UV under an inert atmosphere
(e.g., Argon gas).
Positive pressure of Argon is slowly added to the Argon chamber, and since its
density is
greater than air, it settles to the bottom of the chamber where the substrate
is. This allows
for a low flow rate of Argon into the chamber, and thus requires minimal
demand on room
make-up air. To ensure that no unpolymerized polymer is left on the substrate,
the substrate
travels through a wash station, which is positioned in such a way as to
eliminate any splash
into the polymerization chamber. The washed arrays are dried with a
conventional air knife
assembly. A QC camera ensures that that the elements are printed within
specification and a
rejection marker alerts the operator to discard assemblies out of
specification. The double-
sided spacer tape, which defines the microarray chamber, is unraveled and
bonded to the
substrate. The openings in the spacer tape are designed to allow for fairly
loose tolerances
during the lamination of the spacer tape to the substrate, which allows the
manufacture of
gel element arrays of variable geometry and complexity without modifying the
assembly
line. A rollable absorbent is unwound and mounted to the waste chamber of the
assembly
where it is sealed in place with either an adhesive or double-sided tape. An
alternative
strategy for including the absorbent is to use a pick-and-place robot to
insert the absorbent
into a waste chamber. The current flow cell design uses an additional spacer
layer to
accommodate an absorbent that is twice as thick as the reaction chamber.
Finally, the cover
film, which has fill holes, is applied. The fill holes can be considerably
larger or smaller
than the holes in the spacer allowing for loose tolerances during alignment. A
guillotine
then cuts the tape into the appropriate size.
[0081] Pin-printing robots typically feature a print head that is populated
with
precisely machined pins. The print head is attached to a precision xyz-axis
control arm
(Figure 7). The control arm is responsible for moving the print head with
micron-accuracy
between the printing solution source plate (e.g., a 384 well microtiter
plate), the substrate
printing station (the platen), and a wash station (for cleaning the pins
between deposition of
29
Date Recue/Date Received 2021-05-27
unique solutions). Alternatively, a high-throughput, non-contact print head
deposits multiple
solutions simultaneously within the microarray-PCR reaction chamber.
[0082] In some embodiments, the entire microarray is printed in a single-
stroke.
Electrical Discharge Machining (EDM) can be used to create print heads with
125 micron
pins (diameter of pins currently used) and the presently-used 300 micron
centers.
Additionally, Parallel Synthesis Designs offers 24576 well plates, which has
wells with 560
micron centers. This translates to approximately 350 spots per square cm.
While this many
spots is sufficiently adequate for most diagnostic applications, tests that
require additional
spots can be accommodated by arranging multiple printers serially in the
assembly line,
increasing printing time only by the travel from one printer to the next.
Another
embodiment for printing on a moving film includes the use of a non-contact
printer, which
implements a piezoelectric crystal and a capillary that aspirates the
microarray printing
solution and dispenses picoliter to nanoliter drops onto the substrate. The
printing head may
include multiple capillaries for simultaneously printing an array of unique
micro arrays spots
with distinct probes. Furthermore, this print head may be a high density array
of capillaries
for increasing the number of unique microarray spots. Alternatively, the print
head may
raster across and up and down the substrate film to print replicate spots or
the print head
raster method may be used to aspirate a separate polymer-probe suspension for
printing
multiple unique spots using the same print head. Another option is to have the
substrate film
re-loaded onto the reel-to-reel system following a first print pass, so as to
rc-print additional
(unique) spots for each microarray on the roll of substrate film. This re-
printing approach
may include fiducials to properly align the film when printing on the second,
third or itth
pass. One example of a relevant fiducial is the use of perforated edges, such
as those used
with 35 mm film. Another printing option includes acoustic ejection, a non-
contact method
available from Labcyte, in which high frequency sound waves eject nL droplets
from a
source plate to a destination plate
Example 7
[0083] Figure 8 shows the result of printing Cy3 gel elements on a 0.005"
polyester
film that was purchased from McMaster-Carr (Santa Fe Springs, CA) in a roll
format. The
film was placed in the vacuum chuck shown in Figure 9 and printed on. It was
imaged
using bright field illumination before and after polymerization. This array
was also imaged
with an Akonni imager that consists of an LED and a non-cooled camera.
Subsequent to this
printing, an MRSA array, described above, was printed on the polyester film
and exposed to
a Qiagen MasterMix using 300pg of purified MRSA DNA. Thennocycling was
perfonned
=
Date Recue/Date Received 2021-05-27
on a Quanta Bioscience slide block thermocycler. The result when using a
rollable film for
the top and bottom surfaces as well as the spacer tape is shown in Figure 10,
which shows
positive identification of MRSA. Figure 11 shows a reel-to-reel printing setup
with a
BioDot Ultranon-contact array printer (top panel) and video frames of non-
contact printing
using the BioDot Ultra on a moving film that has not been chemically treated
or modified
(bottom panels). These results demonstrate the feasibility of printing
microarrays on a
moving film with a non-contact array printer, which allows for high speed and
low cost
production of microarray assemblies of the present application.
Example 8
[0084] Figures 12-14 show the array image analysis process. Figure 12 is an
image
of an array taken at factory QC with red channel imager to extract array QC
data. The QC
software algorithm automatically finds each spot in the array and associates
each spot to its
perspective location in the array grid. The software displays the 12 by 12
square grid and
draws circle around each drop. The QC software calculates the relative
location (Deviation
X, Deviation Y) of each circle within its bounding square grid box and stores
the
information as part of the QC data to assist in post-hybridization image
analysis.
[0085] Figure 13 is an image of the array is taken after hybridization with
end-user's
green channel imager. The image analysis software locates the array grid based
on Cy3
fluorescent beacons and draws the 12 by 12 square grid. The image analysis
then use the
relative location of the spot (Deviation X and Deviation Y from the array QC
file) to locate
each spot and draws circle around the spot for visual indication. Note that
with the
assistance of array QC data, the software was able to locate every spot on the
arrays and
draw circles that fully enclose each spot.
[0086] Figure 14 is an image of the array is taken after hybridization with
end-user's
green channel imager. The image analysis software locates the array grid based
on Cy3
fluorescent beacons and draws the 12 by 12 square grid. For this image, image
analysis
software does not have access to information on relative spot location from
the array QC
file. Instead, the image analysis software identified each spot by assume the
center of each
square grid cell is the center of the spot. The software has incorrectly
identified several
spots, by drawing circles that do not fully enclose the spot. The incorrectly
identified spots
include spots located in: row 2 column 2, row 11 column 6. Note this method of
image
analysis without array QC data is less robust in spot identification than
image analysis with
array QC data shown in Figure 13.
31
Date Recue/Date Received 2021-05-27