Note: Descriptions are shown in the official language in which they were submitted.
CA 03127894 2021-07-26
WO 2020/163403 PCT/US2020/016673
DETECTING CANCER, CANCER TISSUE OF ORIGIN, AND/OR A CANCER CELL
TYPE
CROSS-REFERENCE
[0001] This application claims the benefit of U.S. Provisional Application No.
62/801,556, filed
February 5, 2019; U.S. Provisional Application No. 62/801,561, filed February
5, 2019; U.S.
Provisional Application No. 62/965,327, filed January 24, 2020; U.S.
Provisional Application
No. 62/965,342, filed January 24, 2020; and PCT International Application No.
PCT/US2020/015082, filed January 24, 2020, which applications are incorporated
herein by
reference in their entireties.
SEQUENCE LISTING
[0002] The instant application contains a Sequence Listing which has been
electronically
submitted in ASCII format and is hereby incorporated by reference in its
entirety. Said ASCII
copy, created on February 3, 2020, is named 50251-851 601 SL.txt and is
16,952,822 bytes in
size.
BACKGROUND
[0003] Hematopoietic stem cells (HSCs) and hematopoietic progenitor cells
(HPCs) divide to
produce blood cells by a continuous regeneration process. As the cells divide,
they are prone to
accumulating mutations that generally do not affect function. About 3-5% of
normal individuals
above the age of 50 and approximately 10% of people aged 70 to 80 are
determined to have
clonal hematopoiesis of indeterminate potential (CHIP) defined by the presence
of low-level
mutations in the peripheral blood in clinically normal individuals.
[0004] Some mutations confer advantages in self-renewal, proliferation or
both, resulting in
clonal expansion of the cells comprising the mutations in question. Although
these mutations are
not necessarily indicative of a hematological disease, the accumulation of
mutations during
clonal expansion can, eventually, lead to a disease state (e.g., cancer).
Having clonal
hematopoiesis has been linked to a more than 10-fold increased risk of
developing a blood
cancer. Detection of the clonal hematopoiesis can therefore allow an early
detection of cancer,
which in turn allows for earlier treatment and therefore a greater chance for
survival.
Differentiation of CHIP from other hematological disorders, such as leukemia,
multiple
myeloma, and lymphoma, further enables proper treatments and prophylactic
activities.
[0005] Recent sequencing studies have identified a set of recurrent mutations
in several types of
hematological malignancies (see, e.g., Mardis E R et al. The New England
Journal of Medicine
1
CA 03127894 2021-07-26
WO 2020/163403 PCT/US2020/016673
2009; Bejar R et al. The New England Journal of Medicine 2011; Papaemmanuil E
et al. The
New England Journal of Medicine 2011; and Walter et al. Leukemia 2011).
However, the
frequency of these somatic mutations in the general population is unknown.
[0006] Accordingly, a cost-effective method of accurately detecting various
hematological
disorders by detecting differentially methylated regions has not yet been
available.
SUMMARY
[0007] Provided herein are compositions comprising a plurality of different
bait
oligonucleotides, wherein the plurality of different bait oligonucleotides are
configured to
collectively hybridize to DNA molecules derived from at least 100 target
genomic regions,
wherein each genomic region of the at least 100 target genomic regions is
differentially
methylated in at least a first hematological disorder or hematological cancer
relative to another
hematological disorder or non-hematological cancer type, wherein the first
hematological
disorder and the another hematological disorder are selected from leukemia,
lymphoid
neoplasms (e.g., lymphoma), multiple myeloma, and a myeloid neoplasm.
[0008] In some embodiments, the plurality of bait oligonucleotides are
configured to hybridize
to DNA molecules derived from at least 20%, at least 25% or at least 50% of
the target genomic
regions of any one of Lists 1-8. In some embodiments, the plurality of bait
oligonucleotides are
configured to hybridize to DNA molecules derived from at least 20%, at least
25% or at least
50% of the target genomic regions of Lists 1-8. In some embodiments, the
plurality of bait
oligonucleotides are configured to hybridize to DNA molecules derived from at
least 20% of the
target genomic regions of Lists 1 or 8. In some embodiments, the DNA molecules
are derived
from at least 25%, 30%, 40%, 50%, 60%, 70%, or 80% of the target genomic
regions of Lists 1
or 8. In some embodiments, the plurality of bait oligonucleotides are
configured to hybridize to
DNA molecules derived from at least 20% the target genomic regions of any one
of Lists 2-4. In
some embodiments, the plurality of bait oligonucleotides are configured to
hybridize to DNA
molecules derived from at least 20% of the target genomic regions of Lists 2-
4. In some
embodiments, the plurality of bait oligonucleotides are configured to
hybridize to DNA
molecules derived from at least 25%, 30%, 40%, 50%, 60%, 70%, or 80% of the
target genomic
regions of Lists 2-4. In some embodiments, the plurality of bait
oligonucleotides are configured
to hybridize to DNA molecules derived from at least 20% of the target genomic
regions of any
one of Lists 5-7. In some embodiments, the plurality of bait oligonucleotides
are configured to
hybridize to DNA molecules derived from at least 20% of the target genomic
regions of Lists 5-
7. In some embodiments, the plurality of bait oligonucleotides are configured
to hybridize to
DNA molecules derived from at least 25%, 30%, 40%, 50%, 60%, 70%, or 80% of
the target
2
CA 03127894 2021-07-26
WO 2020/163403 PCT/US2020/016673
genomic regions of Lists 5-7. In some embodiments, the first hematological
disorder and the
another hematological disorder are selected from lymphoid neoplasm, multiple
myeloma, and
myeloid neoplasm.
[0009] Also provided herein are compositions comprising a plurality of
different bait
oligonucleotides configured to hybridize to DNA molecules derived from at
least 20% of the
target genomic regions of any one of Lists 1-7. In some embodiments, the
plurality of bait
oligonucleotides are configured to hybridize to DNA molecules derived from at
least 20% of the
target genomic regions of Lists 1 or 8. In some embodiments, the DNA molecules
are derived
from at least 25%, 30%, 40%, 50%, 60%, 70%, or 80% of the target genomic
regions of Lists 1
or 8. In some embodiments, the plurality of bait oligonucleotides are
configured to hybridize to
DNA molecules derived from at least 20% the target genomic regions of any one
of Lists 2-4. In
some embodiments, the plurality of bait oligonucleotides are configured to
hybridize to DNA
molecules derived from at least 20% of the target genomic regions of Lists 2-
4. In some
embodiments, the plurality of bait oligonucleotides are configured to
hybridize to DNA
molecules derived from at least 20% of the target genomic regions of any one
of Lists 5-7. In
some embodiments, the plurality of bait oligonucleotides are configured to
hybridize to DNA
molecules derived from at least 20% of the target genomic regions of Lists 5-
7.
[0010] Also provided herein are compositions provided above, wherein the
plurality of different
bait oligonucleotides are configured to hybridize to DNA molecules derived
from at least 20% of
the target genomic regions of List 2. In some embodiments, the DNA molecules
are derived from
at least 25%, 30%, 40%, 50%, 60%, 70%, or 80% of the target genomic regions of
List 2.
[0011] Also provided herein are compositions provided above, wherein the
plurality of different
bait oligonucleotides are configured to hybridize to DNA molecules derived
from at least 20% of
the target genomic regions of List 3. In some embodiments, the DNA molecules
are derived from
at least 25%, 30%, 40%, 50%, 60%, 70%, or 80% of the target genomic regions of
List 3.
[0012] Also provided herein are compositions provided above, wherein the
plurality of different
bait oligonucleotides are configured to hybridize to DNA molecules derived
from at least 20% of
the target genomic regions of List 4. In some embodiments, the DNA molecules
are derived from
at least 25%, 30%, 40%, 50%, 60%, 70%, or 80% of the target genomic regions of
List 4.
[0013] Also provided herein are compositions provided above, wherein the
plurality of different
bait oligonucleotides are configured to hybridize to DNA molecules derived
from at least 20% of
the target genomic regions of List 5. In some embodiments, the DNA molecules
are derived from
at least 25%, 30%, 40%, 50%, 60%, 70%, or 80% of the target genomic regions of
List 5.
3
CA 03127894 2021-07-26
WO 2020/163403 PCT/US2020/016673
[0014] Also provided herein are compositions provided above, wherein the
plurality of different
bait oligonucleotides are configured to hybridize to DNA molecules derived
from at least 20% of
the target genomic regions of List 6. In some embodiments, the DNA molecules
are derived from
at least 25%, 30%, 40%, 50%, 60%, 70%, or 80% of the target genomic regions of
List 6.
[0015] Also provided herein are compositions provided above, wherein the
plurality of different
bait oligonucleotides are configured to hybridize to DNA molecules derived
from at least 20% of
the target genomic regions of List 7. In some embodiments, the DNA molecules
are derived from
at least 25%, 30%, 40%, 50%, 60%, 70%, or 80% of the target genomic regions of
List 7.
[0016] Also provided herein are compositions provided above, wherein the
plurality of different
bait oligonucleotides are configured to hybridize to DNA molecules derived
from at least 20% of
the target genomic regions of List 8. In some embodiments, the DNA molecules
are derived from
at least 25%, 30%, 40%, 50%, 60%, 70%, or 80% of the target genomic regions of
List 8.
[0017] Also provided herein are compositions provided above, wherein the total
size of the of
the target genomic regions is less than 2000 kb, less than 1500 kb, less than
1200 kb, less than
1000 kb, less than 500 kb, or less than 300 kb.
[0018] Also provided herein are compositions provided above, wherein the DNA
molecules are
converted cfDNA fragments. In some embodiments, the target genomic regions are
hypermethylated regions, hypomethylated regions, or binary regions that can be
either
hypermethylated or hypomethylated, as indicated in the sequence listing. In
some embodiments,
the bait oligonucleotides are configured to hybridize to hypermethylated
converted DNA
molecules, hypomethylated converted DNA molecules, or both hypermethylated and
hypomethylated converted DNA molecules derived from each targeted genomic
region, as
indicated in the sequence listing.
[0019] Also provided herein are compositions provided above, wherein the bait
oligonucleotides
are each conjugated to an affinity moiety. In some embodiments, the affinity
moiety is biotin. In
some embodiments, the bait oligonucleotides are each conjugated to a solid
surface. In some
embodiments, the solid surface is a microarray or chip.
[0020] Also provided herein are compositions provided above, wherein the bait
oligonucleotides
each have a length of 45 to 300 nucleotide bases, 75-200 nucleotide bases, 100-
150 nucleotide
bases, or about 120 nucleotide bases.
[0021] Also provided herein are compositions provided above, wherein the bait
oligonucleotides
comprise a plurality of sets of two or more bait oligonucleotides, wherein
each bait
oligonucleotide within a set of bait oligonucleotides is configured to bind to
converted DNA
molecules derived from the same target genomic region. In some embodiments,
each set of bait
4
CA 03127894 2021-07-26
WO 2020/163403 PCT/US2020/016673
oligonucleotides comprises 1 or more pairs of a first bait oligonucleotide and
a second bait
oligonucleotide, each bait oligonucleotide comprises a 5' end and a 3' end, a
sequence of at least
X nucleotide bases at the 3' end of the first bait oligonucleotide is
identical to a sequence of X
nucleotide bases at the 5' end the second bait oligonucleotide, and X is at
least 25, 30, 35, 40, 45,
50, 60, 70, 75 or 100. In some embodiments, the first bait oligonucleotide
comprises a sequence
of at least 31, 40, 50 or 60 nucleotide bases that does not overlap a sequence
of the second bait
oligonucleotide.
[0022] Also provided herein are compositions provided above, wherein the at
least 100 target
regions comprises at least 200, at least 500, at least 1000, at least 1500, at
least 2000, at least
3000, at least 4000, at least 5000, at least 8000, at least 10,000, at least
15,000, or at least 20,000
genomic regions genomic regions.
[0023] Also provided herein are compositions provided above, further
comprising converted
cfDNA from a test subject.
[0024] Also provided herein are compositions provided above, wherein the cfDNA
from the test
subject is converted by a process comprising treatment with bisulfite or a
cytosine deaminase.
[0025] Also provided herein are methods of enriching converted cfDNA fragments
informative
of a type of hematological disorder, the method comprising: contacting the
bait oligonucleotide
composition provided above with DNA derived from a test subject, and enriching
the sample for
cfDNA corresponding to genomic regions associated with the type of cancer by
hybridization
capture.
[0026] Also provided herein are methods for obtaining sequence information
informative of a
presence or absence of a type of hematological disorder, a method comprising
enriching
converted DNA from a test subject by contacting the DNA with a bait
oligonucleotide
composition provided above, and sequencing the enriched converted DNA.
[0027] Also provided herein are methods for determining that a test subject
has a type of
hematological disorder (HD), a method comprising capturing cfDNA fragments
from the test
subject with a bait oligonucleotide composition provided above, sequencing the
captured cfDNA
fragments, and applying a trained classifier to the cfDNA sequences to
determine that the test
subject has the type of HD. Also provided herein are methods for determining
that a test subject
has a type of hematological disorder (HD), a method comprising capturing cfDNA
fragments
from the test subject with a bait oligonucleotide composition provided above,
detecting the
captured cfDNA fragments by DNA microarray, and applying a trained classifier
to the DNA
fragments hybridized to the DNA microarray to determine that the test subject
has the type of
HD.
CA 03127894 2021-07-26
WO 2020/163403 PCT/US2020/016673
[0028] In some embodiments, the trained classifier determines a presence or
absence of cancer
and, if the classifier determines a presence of cancer, the classifier
determines a cancer type. In
some embodiments, the cancer type is selected from the group consisting of
uterine cancer,
upper GI squamous cancer, all other upper GI cancers, thyroid cancer, sarcoma,
urothelial renal
cancer, all other renal cancers, prostate cancer, pancreatic cancer, ovarian
cancer,
neuroendocrine cancer, multiple myeloma, melanoma, lymphoma, small cell lung
cancer, lung
adenocarcinoma, all other lung cancers, leukemia, hepatobiliary carcinoma,
hepatobiliary biliary,
head and neck cancer, colorectal cancer, cervical cancer, breast cancer,
bladder cancer, and
anorectal cancer. In some embodiments, the cancer type is selected from the
group consisting of
anal cancer, bladder cancer, colorectal cancer, esophageal cancer, head and
neck cancer,
liver/bile-duct cancer, lung cancer, lymphoma, ovarian cancer, pancreatic
cancer, plasma cell
neoplasm, and stomach cancer. In some embodiments, the cancer type is selected
from the group
consisting of thyroid cancer, melanoma, sarcoma, myeloid neoplasm, renal
cancer, prostate
cancer, breast cancer, uterine cancer, ovarian cancer, bladder cancer,
urothelial cancer, cervical
cancer, anorectal cancer, head & neck cancer, colorectal cancer, liver cancer,
bile duct cancer,
pancreatic cancer gallbladder cancer, upper GI cancer, multiple myeloma,
lymphoid neoplasm,
and lung cancer. In some embodiments, the cancer type is a HD and the HD is
selected from the
group consisting of CHIP, leukemia, lymphoid neoplasms (e.g., lymphoma),
multiple myeloma,
and a myeloid neoplasm. In some embodiments, the type of hematological
disorder is selected
from lymphoid neoplasm, multiple myeloma, and myeloid neoplasm. In some
embodiments, the
trained classifier is a mixture model classifier. In some embodiments, the
classifier was trained
on converted DNA sequences derived from at least 1000, at least 2000, or at
least 4000 target
genomic regions selected from any one of Lists 1-8. In some embodiments, the
trained classifier
determines the presence or absence of cancer or a cancer type by: (i)
generating a set of features
for the sample, wherein each feature in the set of features comprises a
numerical value; (ii)
inputting the set of features into the classifier, wherein the classifier
comprises a multinomial
classifier; (iii) based on the set of features, determining, at the
classifier, a set of probability
scores, wherein the set of probability scores comprises one probability score
per cancer type
class and per non-cancer type class; and (iv) thresholding the set of
probability scores based on
one or more values determined during training of the classifier to determine a
final cancer
classification of the sample. In some embodiments, the set of features
comprises a set of
binarized features. In some embodiments, the numerical value comprises a
single binary value.
In some embodiments, the multinomial classifier comprises a multinomial
logistic regression
ensemble trained to predict a source tissue for the cancer. In some
embodiments, the method
6
CA 03127894 2021-07-26
WO 2020/163403 PCT/US2020/016673
further comprises determining the final cancer classification based on a top-
two probability score
differential relative to a minimum value, wherein the minimum value
corresponds to a
predefined percentage of training cancer samples that had been assigned the
correct cancer type
as their highest score during training of the classifier. In some embodiments,
(i) in accordance
with a determination that the top-two probability score differential exceeds
the minimum value,
assign a cancer label corresponding to the highest probability score
determined by the classifier
as the final cancer classification; and (ii) in accordance with a
determination that the top-two
probability score differential does not exceed the minimum value, assigning an
indeterminate
cancer label as the final cancer classification. In some embodiments, the type
of hematological
disorder is selected from CHIP, leukemia, lymphoid neoplasms (e.g., lymphoma),
multiple
myeloma, and a myeloid neoplasm. In some embodiments, the type of
hematological disorder is
selected from lymphoid neoplasm, multiple myeloma, and myeloid neoplasm. In
some
embodiments, the subject is determined to have a cancer and the specificity is
at least 0.990. In
some embodiments, the ratio of the likelihood of accurately determining a
hematological
disorder to the likelihood of inaccurately determining a solid tumor is at
least 25:1 or at least
50:1. In some embodiments, the ratio of the likelihood of accurately
determining a hematological
disorder to the likelihood of inaccurately determining a hematological
disorder is at least 8:, at
least 12:1, or at least 16:1. In some embodiments, the likelihood of
accurately determining a
cancer type is at least 80%, at least 85%, or at least 89%. In some
embodiments, the cancer is a
stage I cancer and the likelihood of accurately determining a cancer type is
at least 65%, at least
70%, at least 75%, or at least 80%. In some embodiments, the cancer is a stage
II cancer and the
likelihood of accurately determining a cancer type is at least 75%, at least
80%, at least 85%, or
at least 90%. In some embodiments, the cancer is a stage III cancer or a stage
IV cancer and the
likelihood of accurately determining a cancer type is at least 85% or at least
90%. In some
embodiments, the sensitivity for multiple myeloma is at least 55%, at least
65%, at least 75% or
at least 85%. In some embodiments, the sensitivity for stage I multiple
myeloma is at least 60%,
at least 65%, or at least 70%. In some embodiments, the sensitivity for stage
II multiple myeloma
is at least 60%, at least 75%, or at least 85%. In some embodiments, the bait
oligonucleotide
composition is configured to hybridize to cfDNA derived from target genomic
regions of list 3 or
list 6. In some embodiments, the sensitivity for lymphoid neoplasm is at least
55%, at least 60%,
at least 65% or at least 70%. In some embodiments, the sensitivity for stage I
lymphoid
neoplasm is at least 30%. In some embodiments, the sensitivity for stage II
lymphoid neoplasm
is at least 65%, at least 75%, at least 85% or at least 90%. In some
embodiments, the bait
7
CA 03127894 2021-07-26
WO 2020/163403 PCT/US2020/016673
oligonucleotide composition is configured to hybridize to cfDNA derived from
target genomic
regions of list 2 or list 5.
[0029] Also provided herein are hematological disorder (HD) assay panels,
comprising: at least
500 pairs of probes, wherein each pair of the at least 500 pairs comprise two
probes configured
to overlap each other by an overlapping sequence, wherein the overlapping
sequence comprises a
sequence of at least 30-nucleotides, and wherein the at least 30-nucleotide
sequence is
configured to hybridize to a converted cfDNA molecule corresponding to, or
derived from one or
more of genomic regions, wherein each of the genomic regions comprises at
least five
methylation sites, and wherein the at least five methylation sites have an
abnormal methylation
pattern in HD samples. In some embodiments, each probe of the of the at least
5 pairs of probes
comprises a non-overlapping sequence of at least 31 nucleotides. In some
embodiments, the
converted cfDNA molecules comprise cfDNA molecules treated to covert
unmethylated C
(cytosine) to U (uracil). In some embodiments, each of the at least 500 pairs
of probes is
conjugated to a non-nucleotide affinity moiety. In some embodiments, the non-
nucleotide
affinity moiety is a biotin moiety. In some embodiments, the HD samples are
from subjects
having a hematological disorder selected from the group consisting of CHIP,
leukemia, multiple
myeloma, and lymphoma. In some embodiments, the abnormal methylation pattern
has at least a
threshold p-value rarity in the HD samples. In some embodiments, each of the
probes is designed
to have sequence homology or sequence complementarity with less than 20 off-
target genomic
regions. In some embodiments, the less than 20 off-target genomic regions are
identified using a
k-mer seeding strategy. In some embodiments, the less than 20 off-target
genomic regions are
identified using k-mer seeding strategy combined to local alignment at seed
locations. In some
embodiments, the HD assay panel comprises at least 1,000, 2,000, 5,000,
10,000, 50,000,
100,000, 150,000, 200,000, or 250,000 probes. In some embodiments, the at
least 500 pairs of
probes together comprise at least 10,000, 20,000, 30,000, 40,000, 50,000,
60,000, 70,000,
80,000, 90,000, 100,000, 120,000, 140,000, 160,000, 180,000, 200,000, 240,000,
260,000,
280,000, 300,000, 320,000, 400,000, 450,000, 500,000, 550,000, 600,000,
650,000, 700,000,
750,000, 800,000, 850,000, 900,000, 1 million, 1.5mi11ion, 2 million, 2.5
million, 3 million, 3.5
million, 4 million, 4.5 million, or 5 million nucleotides. In some
embodiments, of the probes
comprises at least 50, 75, 100, or 120 nucleotides. In some embodiments, each
of the probes
comprises less than 300, 250, 200, or 150 nucleotides. In some embodiments,
each of the probes
comprises 100-150 nucleotides. In some embodiments, each of the probes
comprises less than
20, 15, 10, 8, or 6 methylation sites. In some embodiments, at least 80, 85,
90, 92, 95, or 98% of
the at least five methylation sites are either methylated or unmethylated in
the HD samples. In
8
CA 03127894 2021-07-26
WO 2020/163403 PCT/US2020/016673
some embodiments, at least 3%, 5%, 10%, 15%, or 20% of the probes comprise no
G (Guanine).
In some embodiments, each of the probes comprise multiple binding sites to the
methylation
sites of the converted cfDNA molecule, wherein at least 80, 85, 90, 92, 95, or
98% of the
multiple binding sites comprise exclusively either CpG or CpA. In some
embodiments, each of
the probes is configured to have sequence homology or sequence complementarity
with less than
15, 10 or 8 off-target genomic regions. In some embodiments, at least 30% of
the genomic
regions are in exons or introns. In some embodiments, at least 15% of the
genomic regions are in
exons. In some embodiments, at least 20% of the genomic regions are in exons.
In some
embodiments, less than 10% of the genomic regions are in intergenic regions.
In some
embodiments, the genomic regions are selected from List 1. In some
embodiments, the genomic
regions comprise at least 20%, 30%, 40%, 50%, 60%, 70%, 80%, 90%, 95% or 100%
of the
genomic regions in List 1. In some embodiments, the genomic regions comprise
at least 100,
200, 300, 400, 500, 1,000, 5000, 10,000, 15,000, 16,000, 17,000, 18,000,
19,000, 20,000, 21,000
or 23,000 genomic regions in List 1.
[0030] Also provided herein are methods of detecting a hematological disorder
(HD),
comprising: receiving a sample comprising a plurality of cfDNA molecules;
treating the plurality
of cfDNA molecules to convert unmethylated C (cytosine) to U (uracil), thereby
obtaining a
plurality of converted cfDNA molecules; applying the HD assay panel of any one
of the above
embodiments to the plurality of converted cfDNA molecules, thereby enriching a
subset of the
converted cfDNA molecules; and sequencing the enriched subset of the converted
cfDNA
molecule, thereby providing a set of sequence reads. In some embodiments, the
method further
comprises the step of: determining a health condition by evaluating the set of
sequence reads,
wherein the health condition is a presence or absence of a hematological
disorder; a stage of a
hematological disorder; a presence or absence of a type of blood cancer; or a
presence or absence
of at least 1, 2, or 3 different types of hematological disorders. In some
embodiments, the sample
comprising a plurality of cfDNA molecules was obtained from a human subject.
In some
embodiments, the hematological disorder is selected from the group consisting
of: lymphoid
neoplasm, multiple myeloma, and myeloid neoplasm.
[0031] Also provided herein are methods for detecting a hematological disorder
(HD),
comprising the steps of: obtaining a set of sequence reads by sequencing a set
of nucleic acid
fragments from a subject, wherein each of the nucleic acid fragments
corresponds to or is
derived from a plurality of genomic regions selected from any one of Lists 1-
8; for each of the
sequence reads, determining methylation status at a plurality of CpG sites;
and detecting a
hematological disorder of the subject by evaluating the methylation status for
the sequence reads,
9
CA 03127894 2021-07-26
WO 2020/163403 PCT/US2020/016673
wherein the hematological disorder detected comprises one or more of: (i) a
presence or absence
of a hematological disorder; (ii) a stage of a hematological disorder; (iii) a
presence or absence
of a type of blood cancer; and (iv) a presence or absence of at least 1, 2, or
3 different types of
hematological disorders. In some embodiments, the plurality of genomic regions
comprises at
least 20%, 30%, 40%, 50%, 60%, 70%, 80%, 90%, 95%, or 100% of the genomic
regions of List
1. In some embodiments, the plurality of genomic regions comprises 100, 200,
300, 400, 500,
1,000, 5000, 10,000, 15,000, 16,000, 17,000, 18,000, 19,000, 20,000, 21,000 or
23,000 of the
genomic regions of any one of Lists 1-8.
[0032] Also provided herein are methods of designing a hematological disorder
(HD) assay
panel comprising the steps of: identifying a plurality of genomic regions,
wherein each of the
plurality of genomic regions (i) comprises at least 30 nucleotides, and (ii)
comprises at least five
methylation sites, selecting a subset of the genomic regions, wherein the
selection is made when
cfDNA molecules corresponding to, or derived from each of the genomic regions
in HD samples
have an abnormal methylation pattern, wherein the abnormal methylation pattern
comprises at
least five methylation sites either hypomethylated or hypermethylated, and
designing an HD
assay panel comprising a plurality of probes, wherein each of the probes is
configured to
hybridize to a converted cfDNA molecule corresponding to, or derived from one
or more of the
subset of the genomic regions. In some embodiments, the converted cfDNA
molecules comprise
cfDNA molecules treated to convert unmethylated cytosines to uracils.
[0033] Also provided herein are hematological disorder (HD) assay panels
comprising a
plurality of probes, wherein each of the plurality of probes is configured to
hybridize to a
converted cfDNA molecule corresponding to one or more of the genomic regions
in List 1. In
some embodiments, the converted cfDNA molecules comprise cfDNA molecules
treated to
convert unmethylated cytosines to uracils. In some embodiments, the plurality
of probes is
configured to hybridize to a plurality of converted cfDNA molecules
corresponding to or derived
from at least 20%, 30%, 40%, 50%, 60%, 70%, 80%, or 90%, 95% or 100% of the
genomic
regions of any one of Lists 1-8. In some embodiments, the plurality of probes
is configured to
hybridize to a plurality of converted cfDNA molecules corresponding to or
derived from at least
100, 200, 300, 400, 500, 1,000, 5000, 10,000, 15,000, 16,000, 17,000, 18,000,
19,000, 20,000,
21,000 or 23,000 genomic regions of any one of Lists 1-8. In some embodiments,
at least 3%,
5%, 10%, 15%, or 20% of the probes comprise no G (Guanine). In some
embodiments, each of
the probes comprise multiple binding sites to methylation sites of the
converted cfDNA
molecule, wherein at least 80, 85, 90, 92, 95, or 98% of the multiple binding
sites comprise
exclusively either CpG or CpA. In some embodiments, each of the probes is
conjugated to a non-
CA 03127894 2021-07-26
WO 2020/163403 PCT/US2020/016673
nucleotide affinity moiety. In some embodiments, the non-nucleotide affinity
moiety is a biotin
moiety.
INCORPORATION BY REFERENCE
[0034] All publications, patents, and patent applications mentioned in this
specification are
herein incorporated by reference to the same extent as if each individual
publication, patent, or
patent application was specifically and individually indicated to be
incorporated by reference.
BRIEF DESCRIPTION OF THE DRAWINGS
[0035] The novel features of the disclosure are set forth with particularity
in the appended
claims. A better understanding of the features and advantages of the present
disclosure will be
obtained by reference to the following detailed description that sets forth
illustrative
embodiments, in which the principles of the disclosure are utilized, and the
accompanying
drawings of which:
[0036] FIG. 1A illustrates a 2x tiled probe design, with three probes
targeting a small target
region, where each base in a target region (boxed in the dotted rectangle) is
covered by at least
two probes, according to an embodiment.
[0037] FIG. 1B illustrates a 2x tiled probe design, with more than three
probes targeting a larger
target region, where each base in a target region (boxed in the dotted
rectangle) is covered by at
least two probes, according to an embodiment.
[0038] FIG. 1C illustrates probe design targeting hypomethylated and/or
hypermethylated
fragments in genomic regions, according to an embodiment.
[0039] FIG. 2 illustrates a process of generating a Heme assay panel,
according to an
embodiment.
[0040] FIG. 3A is a flowchart describing a process of creating a data
structure for a control
group, according to an embodiment.
[0041] FIG. 3B is a flowchart describing an additional step of validating the
data structure for
the control group of FIG. 3A, according to an embodiment.
[0042] FIG. 4 is a flowchart describing a process for selecting genomic
regions for designing
probes for an HD assay panel, according to an embodiment.
[0043] FIG. 5 is an illustration of an example p-value score calculation,
according to an
embodiment.
[0044] FIG. 6A is a flowchart describing a process of training a classifier
based on
hypomethylated and hypermethylated fragments indicative of a hematological
disorder,
according to an embodiment.
11
CA 03127894 2021-07-26
WO 2020/163403 PCT/US2020/016673
[0045] FIG. 6B is a flowchart describing a process of identifying fragments
indicative of cancer
determined by probabilistic models, according to an embodiment.
[0046] FIG. 7A is a flowchart describing a process of sequencing a fragment of
cell-free (cf)
DNA, according to an embodiment.
[0047] FIG. 7B is an illustration of the process of FIG. 7A of sequencing a
fragment of cell-free
(cf) DNA to obtain a methylation state vector, according to an embodiment.
[0048] FIG. 8 is a graph of the amounts of DNA fragments hybridizing to probes
depending on
the sizes of overlaps between the DNA fragments and the probes.
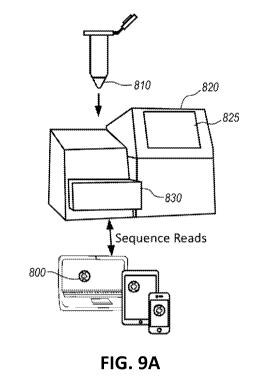
[0049] FIG. 9A illustrates a flowchart of devices for sequencing nucleic acid
samples according
to one embodiment. FIG. 9B illustrates an analytic system that analyzes
methylation status of
cfDNA according to one embodiment.
[0050] FIG. 10 is a receiver operator curve comparing the true positive rate
and false positive
rate of cancer detection by a trained classifier utilizing methylation status
information from a
random 50% of the target genomic regions of List 8.
DETAILED DESCRIPTION
Definitions
[0051] Unless defined otherwise, all technical and scientific terms used
herein have the meaning
commonly understood by a person skilled in the art to which this description
belongs. As used
herein, the following terms have the meanings ascribed to them below.
[0052] As used herein any reference to "one embodiment" or "an embodiment"
means that a
particular element, feature, structure, or characteristic described in
connection with the
embodiment is included in at least one embodiment. The appearances of the
phrase "in one
embodiment" in various places in the specification are not necessarily all
referring to the same
embodiment, thereby providing a framework for various possibilities of
described embodiments
to function together.
[0053] As used herein, the terms "comprises," "comprising," "includes,"
"including," "has,"
"having" or any other variation thereof, are intended to cover a non-exclusive
inclusion. For
example, a process, method, article, or apparatus that comprises a list of
elements is not
necessarily limited to only those elements but may include other elements not
expressly listed or
inherent to such process, method, article, or apparatus. Further, unless
expressly stated to the
contrary, "or" refers to an inclusive or and not to an exclusive or. For
example, a condition A or
B is satisfied by any one of the following: A is true (or present) and B is
false (or not present), A
is false (or not present) and B is true (or present), and both A and B are
true (or present).
12
CA 03127894 2021-07-26
WO 2020/163403 PCT/US2020/016673
[0054] In addition, use of the "a" or "an" are employed to describe elements
and components of
the embodiments herein. This is done merely for convenience and to give a
general sense of the
description. This description should be read to include one or at least one
and the singular also
includes the plural unless it is obvious that it is meant otherwise.
[0055] As used herein, ranges and amounts can be expressed as "about" a
particular value or
range. About also includes the exact amount. Hence "about 5 g" means "about 5
g" and also
"5 [lg." Generally, the term "about" includes an amount that would be expected
to be within
experimental error. In some embodiments, "about" refers to the number or value
recited, "+" or
"-" 20%, 10%, or 5% of the number or value. Additionally, ranges recited
herein are understood
to be shorthand for all of the values within the range, inclusive of the
recited endpoints. For
example, a range of 1 to 50 is understood to include any number, combination
of numbers, or
sub-range from the group consisting of 1, 2, 3, 4, 5, 6, 7, 8, 9, 10, 11, 12,
13, 14, 15, 16, 17, 18,
19, 20, 21, 22, 23, 24, 25, 26, 27, 28, 29, 30, 31, 32, 33, 34, 35, 36, 37,
38, 39, 40, 41, 42, 43, 44,
45, 46, 47, 48, 49, and 50.
[0056] The term "hematological disorder" or "HD" as used herein refers to a
disorder which
primarily affecting the blood, selected from the group consisting of CHIP,
leukemia, lymphoid
neoplasms (e.g. lymphoma), multiple myeloma, and myeloid neoplasm.
[0057] The term "methylation" as used herein refers to a process by which a
methyl group is
added to a DNA molecule. For example, a hydrogen atom on the pyrimidine ring
of a cytosine
base can be converted to a methyl group, forming 5-methylcytosine. The term
also refers to a
process by which a hydroxymethyl group is added to a DNA molecule, for example
by oxidation
of a methyl group on the pyrimidine ring of a cytosine base. Methylation and
hydroxymethylation tend to occur at dinucleotides of cytosine and guanine
referred to herein as
"CpG sites."
[0058] The term "methylation" can also refer to the methylation status of a
CpG site. A CpG site
with a 5-methylcytosine moiety is methylated. A CpG site with a hydrogen atom
on the
pyrimidine ring of the cytosine base is unmethylated.
[0059] In such embodiments, the wet laboratory assay used to detect
methylation may vary from
those described herein as is well known in the art.
[0060] The term "methylation site" as used herein refers to a region of a DNA
molecule where a
methyl group can be added. "CpG" sites are the most common methylation site,
but methylation
sites are not limited to CpG sites. For example, DNA methylation may occur in
cytosines in
CHG and CHH, where H is adenine, cytosine or thymine. Cytosine methylation in
the form of 5-
hydroxymethylcytosine may also assessed (see, e.g., WO 2010/037001 and WO
2011/127136,
13
CA 03127894 2021-07-26
WO 2020/163403 PCT/US2020/016673
which are incorporated herein by reference), and features thereof, using the
methods and
procedures disclosed herein.
[0061] The term "CpG site" as used herein refers to a region of a DNA molecule
where a
cytosine nucleotide is followed by a guanine nucleotide in the linear sequence
of bases along its
5' to 3' direction. "CpG" is a shorthand for 5'-C-phosphate-G-3' that is
cytosine and guanine
separated by only one phosphate group. Cytosines in CpG dinucleotides can be
methylated to
form 5-methylcytosine.
[0062] The term "CpG detection site" as used herein refers to a region in a
probe that is
configured to hybridize to a CpG site of a target DNA molecule. The CpG site
on the target
DNA molecule can comprise cytosine and guanine separated by one phosphate
group, where
cytosine is methylated or unmethylated. The CpG site on the target DNA
molecule can comprise
uracil and guanine separated by one phosphate group, where the uracil is
generated by the
conversion of unmethylated cytosine.
[0063] The term "UpG" is a shorthand for 5'-U-phosphate-G-3' that is uracil
and guanine
separated by only one phosphate group. UpG can be generated by a bisulfite
treatment of a DNA
that converts unmethylated cytosines to uracils. Cytosines can be converted to
uracils by other
methods known in the art, such as chemical modification, synthesis, or
enzymatic conversion.
[0064] The term "hypomethylated" or "hypermethylated" as used herein refers to
a methylation
status of a DNA molecule containing multiple CpG sites (e.g., more than 3, 4,
5, 6, 7, 8, 9, 10,
etc.) where a high percentage of the CpG sites (e.g., more than 80%, 85%, 90%,
or 95%, or any
other percentage within the range of 50%-100%) are unmethylated or methylated,
respectively.
[0065] The terms "methylation state vector" or "methylation status vector" as
used herein refers
to a vector comprising multiple elements, where each element indicates the
methylation status of
a methylation site in a DNA molecule comprising multiple methylation sites, in
the order they
appear from 5' to 3' in the DNA molecule. For example, < Mx, Mx+i, Mx+2>, <
Mx, Mx+i, Ux+2>,
. . <U,, Ux-pi, Ux-p2> can be methylation vectors for DNA molecules
comprising three
methylation sites, where M represents a methylated methylation site and U
represents an
unmethylated methylation site.
[0066] The term "abnormal methylation pattern" or "anomalous methylation
pattern" as used
herein refers to the methylation pattern of a DNA molecule or a methylation
state vector that is
expected to be found in a sample less frequently than a threshold value. In
one embodiment
provided herein, the expectedness of finding a specific methylation state
vector in a healthy
control group comprising healthy individuals is represented by a p-value. A
low p-value score
generally corresponds to a methylation state vector which is relatively
unexpected in comparison
14
CA 03127894 2021-07-26
WO 2020/163403 PCT/US2020/016673
to other methylation state vectors within samples from healthy individuals. A
high p-value score
generally corresponds to a methylation state vector which is relatively more
expected in
comparison to other methylation state vectors found in samples from healthy
individuals in the
healthy control group. A methylation state vector having a p-value lower than
a threshold value
(e.g., 0.1, 0.01, 0.001, 0.0001, etc.) can be defined as an abnormal/anomalous
methylation
pattern. Various methods known in the art can be used to calculate a p-value
or expectedness of a
methylation pattern or a methylation state vector. Exemplary methods provided
herein involve
use of a Markov chain probability that assumes methylation statuses of CpG
sites to be
dependent on methylation statuses of neighboring CpG sites. Alternate methods
provided herein
calculate the expectedness of observing a specific methylation state vector in
healthy individuals
by utilizing a mixture model including multiple mixture components, each being
an independent-
sites model where methylation at each CpG site is assumed to be independent of
methylation
statuses at other CpG sites.
[0067] The term "HD sample" as used herein refers to a sample comprising
genomic DNAs
from an individual diagnosed with a hematological disorder. The genomic DNAs
can be, but are
not limited to, cfDNA fragments or chromosomal DNAs from a subject with a
hematological
disorder. The genomic DNAs can be sequenced (or otherwise detected) and their
methylation
status can be assessed by methods known in the art, for example, bisulfite
sequencing. When
genomic sequences are obtained from public database (e.g., The Cancer Genome
Atlas (TCGA))
or experimentally obtained by sequencing a genome of an individual diagnosed
with a
hematological disorder, HD sample can refer to genomic DNAs or cfDNA fragments
having the
genomic sequences. The term "HD samples" as a plural refers to samples
comprising genomic
DNAs from multiple individuals, each individual has been diagnosed with a
hematological
disorder. In various embodiments, HD samples from more than 10, 20, 50, 100,
200, 300, 500,
1,000, 2,000, 5,000, 10,000, 20,000, 40,000, 50,000, or more individuals
diagnosed with a
hematological disorder are used.
[0068] The term "non-HD sample" or "healthy sample" as used herein refers to a
sample
comprising genomic DNAs from an individual not diagnosed with a hematological
disorder. The
genomic DNAs can be, but are not limited to, cfDNA fragments or chromosomal
DNAs from a
subject without a hematological disorder (e.g., a healthy subject). The
genomic DNAs can be
sequenced (or otherwise detected) and their methylation status can be assessed
by methods
known in the art, for example, bisulfite sequencing. When genomic sequences
are obtained from
public database (e.g., The Cancer Genome Atlas (TCGA)) or experimentally
obtained by
sequencing a genome of an individual without a hematological disorder, non-HD
sample can
CA 03127894 2021-07-26
WO 2020/163403 PCT/US2020/016673
refer to genomic DNAs or cfDNA fragments having the genomic sequences. The
term "non-HD
samples" as a plural refers to samples comprising genomic DNAs from multiple
individuals,
each individual is without a hematological disorder. In various embodiments,
healthy samples
from more than 10, 20, 50, 100, 200, 300, 500, 1,000, 2,000, 5,000, 10,000,
20,000, 40,000,
50,000, or more individuals without a hematological disorder are used.
[0069] The term "training sample" as used herein refers to a sample used to
train a classifier
described herein and/or to select one or more genomic regions for
hematological disorder
detection. The training samples can comprise genomic DNAs or a modification
there of, from
one or more healthy subjects and from one or more subjects having a
hematological disorder.
The genomic DNAs can be, but are not limited to, cfDNA fragments or
chromosomal DNAs.
The genomic DNAs can be sequenced (or otherwise detected) and their
methylation status can be
assessed by methods known in the art, for example, bisulfite sequencing. When
genomic
sequences are obtained from public database (e.g., The Cancer Genome Atlas
(TCGA)) or
experimentally obtained by sequencing a genome of an individual, a training
sample can refer to
genomic DNAs or cfDNA fragments having the genomic sequences.
[0070] The term "test sample" as used herein refers to a sample from a
subject, whose health
condition was, has been or will be tested using a classifier and/or an assay
panel described
herein. The test sample can comprise genomic DNAs or a modification there of
The genomic
DNAs can be, but are not limited to, cfDNA fragments or chromosomal DNAs.
[0071] The term "target genomic region" as used herein refers to a region in a
genome selected
for analysis in test samples. An assay panel is generated with probes designed
to hybridize to
(and optionally pull down) nucleic acid fragments derived from the target
genomic region or a
fragment thereof A nucleic acid fragment derived from the target genomic
region refers to a
nucleic acid fragment generated by degradation, cleavage, bisulfite
conversion, or other
processing of the DNA from the target genomic region.
Various target genomic regions are described according to their chromosomal
location in the
sequence listing filed herewith. Chromosomal DNA is double-stranded, so a
target genomic
region includes two DNA strands: one with the sequence provided in the listing
and a second
that is a reverse complement to the sequence in the listing. Probes can be
designed to hybridize
to one or both sequences. Optionally, probes hybridize to converted sequences
resulting from,
for example, treatment with sodium bisulfite.
[0072] The term "off-target genomic region" as used herein refers to a region
in a genome which
has not been selected for analysis in test samples, but has sufficient
homology to a target
genomic region to potentially be bound and pulled down by a probe designed to
target the target
16
CA 03127894 2021-07-26
WO 2020/163403 PCT/US2020/016673
genomic region. In one embodiment, an off-target genomic region is a genomic
region that
aligns to a probe along at least 45 bp with at least a 90% match rate.
[0073] The terms "converted DNA molecules," "converted cfDNA molecules," and
"modified
fragment obtained from processing of the cfDNA molecules" refer to DNA
molecules obtained
by processing DNA or cfDNA molecules in a sample for the purpose of
differentiating a
methylated nucleotide and an unmethylated nucleotide in the DNA or cfDNA
molecules. For
example, in one embodiment, the sample can be treated with bisulfite ion
(e.g., using sodium
bisulfite), as is well-known in the art, to convert unmethylated cytosines
("C") to uracils ("U").
In another embodiment, the conversion of unmethylated cytosines to uracils is
accomplished
using an enzymatic conversion reaction, for example, using a cytidine
deaminase (such as
APOBEC). After treatment, converted DNA molecules or cfDNA molecules include
additional
uracils which are not present in the original cfDNA sample. Replication by DNA
polymerase of
a DNA strand comprising a uracil results in addition of an adenine to the
nascent complementary
strand instead of the guanine normally added as the complement to a cytosine
or methylcytosine.
[0074] The terms "cell free nucleic acid," "cell free DNA," or "cfDNA" refers
to nucleic acid
fragments that circulate in an individual's body (e.g., bloodstream) and
originate from one or
more healthy cells and/or from one or more HD cells (i.e., cells from a
subject having a
hematological disorder). Additionally, cfDNA may come from other sources such
as viruses,
fetuses, etc.
[0075] The term "circulating tumor DNA" or "ctDNA" refers to nucleic acid
fragments that
originate from tumor cells, which may be released into an individual's
bloodstream as result of
biological processes such as apoptosis or necrosis of dying cells or actively
released by viable
tumor cells.
[0076] The term "fragment" as used herein can refer to a fragment of a nucleic
acid molecule.
For example, in one embodiment, a fragment can refer to a cfDNA molecule in a
blood or
plasma sample, or a cfDNA molecule that has been extracted from a blood or
plasma sample. An
amplification product of a cfDNA molecule may also be referred to as a
"fragment." In another
embodiment, the term "fragment" refers to a sequence read, or set of sequence
reads, that have
been processed for subsequent analysis (e.g., for in machine-learning based
classification), as
described herein. For example, as is well known in the art, raw sequence reads
can be aligned to
a reference genome and matching paired end sequence reads assembled into a
longer fragment
for subsequent analysis.
[0077] The term "individual" refers to a human individual. The term "healthy
individual" refers
to an individual presumed not to have a hematological disorder.
17
CA 03127894 2021-07-26
WO 2020/163403 PCT/US2020/016673
[0078] The term "subject" refers to an individual whose DNA is being analyzed.
A subject may
be a test subject whose DNA is be evaluated using a targeted panel as
described herein to
evaluate whether the person has a hematological disorder or another disease. A
subject may also
be part of a control group known not to have a hematological disorder or
another disease. A
subject may also be part of a hematological disorder or other disease group
known to have a
hematological disorder or another disease. Control and cancer/disease groups
may be used to
assist in designing or validating the targeted panel.
[0079] The term "sequence reads" as used herein refers to nucleotide sequences
reads from a
sample. Sequence reads can be obtained through various methods provided herein
or as known in
the art.
[0080] The term "sequencing depth" as used herein refers to the count of the
number of times a
given target nucleic acid within a sample has been sequenced (e.g., the count
of sequence reads
at a given target region). Increasing sequencing depth can reduce required
amounts of nucleic
acids required to assess a disease state (e.g., hematological disease state).
[0081] The term "tissue of origin" or "TOO" as used herein refers to the
organ, organ group,
body region or cell type that a hematological disease arises or originates
from. The identification
of a tissue of origin or cancer cell type typically allows for identification
of the most appropriate
next steps in the care continuum of cancer to further detect, diagnose, stage
and decide on
treatment.
[0082] The term "transition" generally refers to changes in base composition
from one purine to
another purine, or from one pyrimidine to another pyrimidine. For instance,
the following
changes are transitions: C4U, U4C, G4A, A4G, C4T, and T4C.
[0083] "An entirety of probes" of a panel or bait set or "an entirety of
polynucleotide-containing
probes" of a panel or bait set generally refers to all of the probes delivered
with a specified panel
or bait set. For instance, in some embodiments, a panel or bait set may
include both (1) probes
having features specified herein (e.g., probes for binding to cell-free DNA
fragments
corresponding to or derived from genomic regions set forth herein in one or
more Lists) and (2)
additional probes that do not contain such feature(s). The entirety of probes
of a panel generally
refers to all probes delivered with the panel or bait set, including such
probes that do not contain
the specified feature(s).
HD assay panel
[0084] In a first aspect, the present description provides an HD assay panel
comprising a
plurality of probes or a plurality of probe pairs. The assay panels described
herein can
alternatively be referred to as bait sets or as compositions comprising bait
oligonucleotides. The
18
CA 03127894 2021-07-26
WO 2020/163403 PCT/US2020/016673
probes can be polynucleotide-containing probes that are specifically designed
to target one or
more nucleic acid molecules corresponding to, or derived from genomic regions
differentially
methylated between HD and non-HD samples, between different HD types, between
CHIP and
other HD samples, between different cancer tissue of origin (TOO) types, or
between samples of
different stages of HD. In some embodiments, the target genomic regions (or
nucleic acid
molecules derived therefrom) are selected to maximize classification accuracy,
subject to a size
budget (which is determined by sequencing budget and desired depth of
sequencing).
[0085] The HD assay panel's design and utility is generally described in FIG.
2. For designing
the HD assay panel, an analytics system collects information on the
methylation status of CpG
sites of nucleic acid fragments from samples corresponding to various outcomes
under
consideration, e.g., samples known to have HD, samples with or without CHIP,
samples with
HD other than CHIP, samples considered to be healthy, samples from a known
TOO, etc. These
samples may be processed using one or more methods known in the art to
determine the
methylation status of CpG sites (e.g., with whole-genome bisulfite sequencing
(WGBS)), or the
information may be obtained from a public database (e.g., TCGA). The analytics
system may be
any generic computing system with a computer processor and a computer-readable
storage
medium with instructions for executing the computer processor to perform any
or all operations
described in this present disclosure.
[0086] Exemplary methodology for designing a hematological disorder assay
panel is generally
described in FIG. 2. For instance, to design a hematological disorder assay
panel, an analytics
system may collect information on the methylationn status of CpG sites of
nucleic acid
fragments from samples corresponding to various outcomes under consideration,
e.g., samples
known to have hematological disorder, samples considered to be healthy, etc.
These samples
may be processed (e.g., with whole-genome bisulfite sequencing (WGBS)) to
determine the
methylation status of CpG sites, or the information may be obtained from TCGA.
The analytics
system may be any generic computing system with a computer processor and a
computer-
readable storage medium with instructions for executing the computer processor
to perform any
or all operations described in this present disclosure.
[0087] The analytics system may then select target genomic regions based on
methylation
patterns of nucleic acid fragments. One approach considers pairwise
distinguishability between
pairs of outcomes for regions (or more specifically for CpG sites within
regions). Another
approach considers distinguishability for regions (or more specifically for
CpG sites within
regions) when considering each outcome against the remaining outcomes. From
the selected
target genomic regions with high distinguishability power, the analytics
system may design
19
CA 03127894 2021-07-26
WO 2020/163403 PCT/US2020/016673
probes to target fragments from the selected genomic regions. The analytics
system may
generate variable sizes of the hematological disorder assay panel, e.g., where
a small sized
hematological disorder assay panel includes probes targeting the most
informative genomic
regions, a medium sized hematological disorder assay panel includes probes
from the small sized
hematological disorder assay panel and additional probes targeting a second
tier of informative
genomic regions, and a large sized hematological disorder assay panel includes
probes from the
small-sized and the medium-sized hematological disorder assay panels along
with even more
probes targeting a third tier of informative genomic regions. With data
obtained such
hematological disorder assay panels (e.g., the methylation status on nucleic
acids derived from
the hematological disorder assay panels), the analytics system may train
classifiers with various
classification techniques to predict a sample's likelihood of having a
particular outcome or state,
e.g., hematological disorder, other disorder, other disease, etc.
[0088] In some embodiments, the HD assay panel comprises at least 500 pairs of
probes,
wherein each pair of the at least 500 pairs comprises two probes configured to
overlap each other
by an overlapping sequence, wherein the overlapping sequence comprises at
least 30-
nucleotides, and wherein each probe is configured to hybridize to a converted
DNA (e.g., a
cfDNA) molecule corresponding to one or more genomic regions. In some
embodiments, each of
the genomic regions comprises at least five methylation sites, and wherein the
at least five
methylation sites have an abnormal methylation pattern in HD samples or a
different methylation
pattern between samples of a different HD. For example, in one embodiment, the
at least five
methylation sites are differentially methylated between HD and non-HD samples,
between
different HD types, between CHIP and other HD samples, between blood cancer
and solid
cancer, between different cancer tissue of origin (TOO) types, or between
samples of different
stages of HD. In some embodiments, each pair of probes comprises a first probe
and a second
probe, wherein the second probe differs from the first probe. The second probe
can overlap with
the first probe by an overlapping sequence that is at least 30, at least 40,
at least 50, or at least 60
nucleotides in length.
[0089] The target genomic regions can be selected from any one of Lists 1-8
(TABLE 1). In
some embodiments, the HD assay panel comprises a plurality of probes, wherein
each of the
plurality of probes is configured to hybridize to a converted cfDNA molecule
corresponding to
one or more of the genomic regions in any one of Lists 1-8. In some
embodiments, the plurality
of different bait oligonucleotides is configured to hybridize to DNA molecules
derived from at
least 20% of the target genomic regions of any one of Lists 1-8. In some
embodiments, the
plurality of different bait oligonucleotides is configured to hybridize to DNA
molecules derived
CA 03127894 2021-07-26
WO 2020/163403 PCT/US2020/016673
from at least 30%, 4000, 5000, 6000, 7000, or 8000 of the target genomic
regions of any one of
Lists 1-8. For example, the plurality of different bait oligonucleotides can
be configured to
hybridize to DNA molecules derived from at least 2000, 30%, 40%, 50%, 60%,
70%, or 80% of
the target genomic regions of Lists 2-4, or from at least 20%, 30%, 40%, 50%,
60%, 70%, or
80% of the target genomic regions of Lists 5-7.
[0090] The target genomic regions can be selected from List 1. The target
genomic regions can
be selected from List 2. In some embodiments, a method for detecting lymphoid
neoplasm
comprises evaluating the methylation status for sequencing reads derived from
the target
genomic regions of List 2. The target genomic regions can be selected from
List 3. In some
embodiments, a method for detecting multiple myeloma comprises evaluating the
methylation
status for sequencing reads derived from the target genomic regions of List 3.
The target
genomic regions can be selected from List 4. In some embodiments, a method for
detecting
myeloid neoplasm comprises evaluating the methylation status for sequencing
reads derived
from the target genomic regions of List 4. The target genomic regions can be
selected from List
5. In some embodiments, a method for detecting lymphoid neoplasm comprises
evaluating the
methylation status for sequencing reads derived from the target genomic
regions of List 5. The
target genomic regions can be selected from List 6. In some embodiments, a
method for
detecting multiple myeloma comprises evaluating the methylation status for
sequencing reads
derived from the target genomic regions of List 6. The target genomic regions
can be selected
from List 7. In some embodiments, a method for detecting myeloid neoplasm
comprises
evaluating the methylation status for sequencing reads derived from the target
genomic regions
of List 7. The target genomic regions can be selected from List 8. In some
embodiments, a
method for detecting myeloid neoplasm comprises evaluating the methylation
status for
sequencing reads derived from the target genomic regions of List 8. In some
embodiments, the
genomic regions can be selected from two or more, three or more, four or more,
five or more, six
or more, of Lists 1-8.
[0091] Since the probes are configured to hybridize to a converted DNA or
cfDNA molecule
corresponding to, or derived from, one or more genomic regions, the probes can
have a sequence
different from the targeted genomic region. For example, a DNA containing
unmethylated CpG
site will be converted to include UpG instead of CpG because unmethylated
cytosines are
converted to uracils by a conversion reaction (e.g., bisulfite treatment). As
a result, a probe is
configured to hybridize to a sequence including UpG instead of a naturally
existing
unmethylated CpG. Accordingly, a complementary site in the probe to the
unmethylation site can
comprise CpA instead of CpG, and some probes targeting a hypomethylated site
where all
21
CA 03127894 2021-07-26
WO 2020/163403 PCT/US2020/016673
methylation sites are unmethylated can have no guanine (G) bases. In some
embodiments, at
least 3%, 5%, 10%, 15%, or 20% of the probes comprise no CpG sequences.
[0092] The HD assay panel can be used to detect the presence or absence of HD
generally and/or
provide an HD classification such as an HD type or a stage of HD. In some
embodiments, the
HD assay panel can be used to provide a cancer classification such as cancer
type, stage of
cancer such as non-cancer, cancer stage I, cancer stage II, cancer stage III,
or cancer stage IV.
The panel may include probes targeting nucleic acids derived genomic regions
differentially
methylated between HD and non-HD samples, between different HD types, between
CHIP and
other HD samples, between different cancer tissue of origin (TOO) types, or
between samples of
different stages of HD. For example, in some embodiments, an HD assay panel is
designed to
enrich nucleic acids derived from differentially methylated genomic regions
based on bisulfite
sequencing data generated from the cfDNA from HD and non-HD individuals.
[0093] Each probe, probe pair, or probe set can be designed to target nucleic
acid fragments
corresponding to or derived from one or more target genomic regions. The
target genomic
regions are selected based on several criteria designed to increase selective
enriching of
informative nucleic acid fragments while decreasing noise and non-specific
bindings.
[0094] In one example, a panel can include probes that can selectively
hybridize (i.e., bind to)
and optionally enrich cfDNA fragments that are differentially methylated in HD
samples. In this
case, sequence from the enriched fragments can provide information relevant to
detection of HD.
Furthermore, the probes are designed to target genomic regions that are
determined to have an
abnormal methylation pattern in HD samples, or in sample from a specific type
of HD. In one
embodiment, probes are designed to target genomic regions determined to be
hypermethylated or
hypomethylated in certain HDs, or cancer tissue of origins, to provide
additional selectivity and
specificity of the detection. In some embodiments, a panel comprises probes
targeting
hypomethylated fragments. In some embodiments, a panel comprises probes
targeting
hypermethylated fragments. In some embodiments, a panel comprises both a first
set of probes
targeting hypermethylated fragments and a second set of probes targeting
hypomethylated
fragments. (FIG. IC) In some embodiments, the ratio between the first set of
probes targeting
hypermethylated fragments and the second set of probes targeting
hypomethylated fragments
(Hyper:Hypo ratio) ranges between 0.4 and 2, between 0.5 and 1.8, between 0.5
and 1.6,
between 1.4 and 1.6, between 1.2 and 1.4, between 1 and 1.2, between 0.8 and
1, between 0.6
and 0.8 or between 0.4 and 0.6. Methods of identifying genomic regions (i.e.,
genomic regions
giving rise to differentially methylated DNA molecules or anomalously
methylated DNA
molecules) between HD and non-HD samples, between different HD types, between
CHIP and
22
CA 03127894 2021-07-26
WO 2020/163403 PCT/US2020/016673
other HD samples, between different cancer tissue of origin (TOO) types, or
between samples of
different stages of HD (e.g., non-cancer, cancer stage I, cancer stage II,
cancer stage III, cancer
stage IV) are provided in detail herein, and methods of identifying
anomalously methylated
DNA molecules or fragments that are identified as indicative of HD are
provided in detail herein.
[0095] In a second example, genomic regions can be selected when the genomic
regions give
rise to anomalously methylated DNA molecules in HD samples or samples with
known HD
types (e.g., CHIP, blood cancer). For example, as described herein, a Markov
model trained on a
set of non-HD samples can be used to identify genomic regions that give rise
to anomalously
methylated DNA molecules (i.e., DNA molecules having a methylation pattern
below a p-value
threshold).
[0096] Each of the probes can target a genomic region comprising at least
30bp, 35bp, 40bp,
45bp, 50bp, 60bp, 70bp, 80bp, 90bp, 100bp or more. In some embodiments, the
genomic regions
can be selected to have less than 30, 25, 20, 15, 12, 10, 8, or 6 methylation
sites.
[0097] The genomic regions can be selected when at least 80, 85, 90, 92, 95,
or 98% of the at
least five methylation (e.g., CpG) sites within the region are either
methylated or unmethylated
in non-HD or HD samples, samples of a specific type of HD (e.g., samples of
CHIP or cancer
samples from a tissue of origin (TOO)) or samples of a specific stage of HD.
[0098] Genomic regions may be further filtered to select only those that are
likely to be
informative based on their methylation patterns, for example, CpG sites that
are differentially
methylated between HD and non-HD samples (e.g., abnormally methylated or
unmethylated in
HD versus non-HD), between different HD types, between CHIP and other HD
samples, or
between samples of different stages of HD. For the selection, calculation can
be performed with
respect to each CpG or a plurality of CpG sites. For example, a first count is
determined that is
the number of HD-containing samples (HD count) that include a fragment
overlapping that
CpG, and a second count is determined that is the number of total samples
containing fragments
overlapping that CpG site (total). Genomic regions can be selected based on
criteria positively
correlated to the number of HD-containing samples (HD count) that include a
fragment
indicative of HD overlapping that CpG site, and inversely correlated with the
number of total
samples containing fragments indicative of HD overlapping that CpG site
(total). In one
embodiment, the number of non-HD samples (nnon-HD) and the number of HD
samples (nHD)
having a fragment overlapping a CpG site are counted. Then the probability
that a sample is HD
is estimated, for example as (nHD + 1)! (nHD + nnon-HD + 2).
23
CA 03127894 2021-07-26
WO 2020/163403 PCT/US2020/016673
[0099] CpG sites scored by this metric are ranked and greedily added to a
panel until the panel
size budget is exhausted. The process of selecting genomic regions indicative
of HD is further
detailed herein.
[0100] Different target regions may be selected depending on whether the assay
is intended to be
a pan-HD assay or a single-HD assay, or what kind of flexibility is desired. A
panel for detecting
a specific HD type can be designed using a similar process. In this
embodiment, for each HD
type, and for each CpG site, the information gain is computed to determine
whether to include a
probe targeting that CpG site. The information gain may be computed for
samples with a given
HD compared to all other samples. For example, consider two random variables,
"AF" and
"CT". "AF" is a binary variable that indicates whether there is an abnormal
fragment
overlapping a particular CpG site in a particular sample (yes or no). "CT" is
a binary random
variable indicating whether the HD is of a particular type (e.g., CHIP,
leukemia, lymphoid
neoplasms (e.g. lymphoma), multiple myeloma, and myeloid neoplasm). One can
compute the
mutual information with respect to "CT" given "AF." That is, how many bits of
information
about the HD type (e.g., CHIP vs. blood cancer) are gained if one knows
whether there is an
anomalous fragment overlapping a particular CpG site. This can be used to rank
CpG's based on
how CHIP-specific they are. This procedure is repeated for a plurality of HD
types. If a
particular region is differentially methylated only in CHIP (and not blood
cancer), CpG's in that
region would tend to have high information gains for CHIP. For each HD type,
CpG sites are
ranked by this information gain metric, and then greedily added to a panel
until the size budget
for that HD type is exhausted.
[0101] Further filtration can be performed to select probes with high
specificity for enrichment
(i.e., high binding efficiency) of nucleic acids derived from targeted genomic
regions. Probes can
be filtered to reduce non-specific binding (or off-target binding) to nucleic
acids derived from
non-targeted genomic regions. For example, probes can be filtered to select
only those probes
having less than a set threshold of off-target binding events. In one
embodiment, probes can be
aligned to a reference genome (e.g., a human reference genome) to select
probes that align to less
than a set threshold of regions across the genome. For example, probes can be
selected that align
to less than 25, 24, 23, 22, 21, 20, 19, 18, 17, 16, 15, 14, 13, 12, 11, 10, 9
or 8 off-target regions
across the reference genome. In other cases, filtration is performed to remove
genomic regions
when the sequence of the target genomic regions appears more than 5, 10, 15,
20, 21, 22, 23, 24,
25, 26, 27, 28, 29, 30, 31, 32, 33, 34 or 35 times in a genome. Further
filtration can be performed
to select target genomic regions when a probe sequence, or a set of probe
sequences that are
90%, 91%, 92%, 93%, 94%, 95%, 96%, 97%, 98% or 99% homologous to the target
genomic
24
CA 03127894 2021-07-26
WO 2020/163403 PCT/US2020/016673
regions, appear less than 25, 24, 23, 22, 21, 20, 19, 18, 17, 16, 15, 14, 13,
12, 11, 10, 9 or 8 times
in a reference genome, or to remove target genomic regions when the probe
sequence, or a set of
probe sequences designed to enrich for the targeted genomic region are 90%,
91%, 92%, 93%,
94%, 95%, 96%, 97%, 98% or 99% homologous to the target genomic regions,
appear more than
5, 10, 15, 20, 21, 22, 23, 24, 25, 26, 27, 28, 29, 30, 31, 32, 33, 34 or 35
times in a reference
genome. This is for excluding repetitive probes that can pull down off-target
fragments, which
are not desired and can impact assay efficiency.
[0102] In some embodiments, a fragment-probe overlap of at least 45 bp was
demonstrated to be
effective for achieving a non-negligible amount of pulldown (though as one of
skill in the art
would appreciate this number can very) as provided in Example 1. In some
embodiments, more
than a 10% mismatch rate between the probe and fragment sequences in the
region of overlap is
sufficient to greatly disrupt binding, and thus pulldown efficiency.
Therefore, sequences that can
align to the probe along at least 45 bp with at least a 90% match rate can be
candidates for off-
target pulldown. Thus, in one embodiment, the number of such regions are
scored. The best
probes have a score of 1, meaning they match in only one place (the intended
target region).
Probes with an intermediate score (say, less than 5 or 10) may in some
instances be accepted,
and in some instances any probes above a particular score are discarded. Other
cutoff values can
be used for specific samples.
[0103] Once the probes hybridize and capture DNA fragments corresponding to,
or derived from
a target genomic region, the hybridized probe-DNA fragment intermediates are
pulled down (or
isolated), and the targeted DNA is amplified and its methylation status is
determined by, for
example, sequencing or hybridization to a microarray, etc. The sequence read
provides
information relevant for detection of HD. For this end, a panel is designed to
include a plurality
of probes that can capture fragments that can together provide information
relevant to detection
of HD. In some embodiments, a panel includes at least 500, 1,000, 2,000,
2,500, 5,000, 6,000,
7,500, 10,000, 15,000, 20,000, 25,000, 30,000, 35,000, 40,000, 50,000, 60,000,
70,000, 80,000,
90,000, 100,000, 110,000 or 120,000 pairs of probes. In other embodiments, a
panel includes at
least 1,000, 2,000, 5,000, 10,000, 50,000, 100,000, 150,000, 200,000, 250,000,
300,000,
400,000, 500,000, 550,000, 600,000, 700,000, or 800,000 probes. The plurality
of probes
together can comprise at least 10,000, 20,000, 30,000, 40,000, 50,000, 60,000,
70,000, 80,000,
90,000, 100,000, 120,000, 140,000, 160,000, 180,000, 200,000, 240,000,
260,000, 280,000,
300,000, 320,000, 400,000, 450,000, 500,000, 550,000, 600,000, 650,000,
700,000, 750,000,
800,000, 850,000, 900,000, 1 million, 1.5mi11ion, 2 million, 2.5 million, 3
million, 3.5 million, 4
million, 4.5 million, or 5 million nucleotides.
CA 03127894 2021-07-26
WO 2020/163403 PCT/US2020/016673
[0104] The selected target genomic regions can be located in various positions
in a genome,
including but not limited to exons, introns, intergenic regions, and other
parts. In some
embodiments, probes targeting non-human genomic regions, such as those
targeting viral
genomic regions, can be added.
[0105] In some instances, primers may be used to specifically amplify
targets/biomarkers of
interest (e.g., by PCR), thereby enriching the sample for desired
targets/biomarkers (optionally
without hybridization capture). For example, forward and reverse primers can
be prepared for
each genomic region of interest and used to amplify fragments that correspond
to or are derived
from the desired genomic region. Thus, while the present disclosure pays
particular attention to
HD assay panels and bait sets for hybridization capture, the disclosure is
broad enough to
encompass other methods for enrichment of cell-free DNA. Accordingly, a
skilled artisan, with
the benefit of this disclosure, will recognize that methods analogous to those
described herein in
connection with hybridization capture can alternatively be accomplished by
replacing
hybridization capture with some other enrichment strategy, such as PCR
amplification of cell-
free DNA fragments that correspond with genomic regions of interest. In some
embodiments,
bisulfite padlock probe capture is used to enrich regions of interest, such as
is described in Zhang
et al. (US 2016/0340740). In some embodiments, additional or alternative
methods are used for
enrichment (e.g., non-targeted enrichment) such as reduced representation
bisulfite sequencing,
methylation restriction enzyme sequencing, methylation DNA immunoprecipitation
sequencing,
methyl-CpG-binding domain protein sequencing, methyl DNA capture sequencing,
or
microdroplet PCR.
Probes
[0106] The HD assay panel provided herein is a panel including a set of
hybridization probes
(also referred to herein as "probes") designed to, during enrichment, target
and pull down nucleic
acid fragments of interest for the assay. In some embodiments, the probes are
designed to
hybridize and enrich DNA or cfDNA molecules from HD samples that have been
treated to
convert unmethylated cytosines (C) to uracils (U). In other embodiments, the
probes are
designed to hybridize and enrich DNA or cfDNA molecules from a specific type
of HD that has
been treated to convert unmethylated cytosines (C) to uracils (U). The probes
can be designed to
anneal (or hybridize) to a target (complementary) strand of DNA or RNA. The
target strand can
be the "positive" strand (e.g., the strand transcribed into mRNA, and
subsequently translated into
a protein) or the complementary "negative" strand. In a particular embodiment,
an HD assay
panel may include sets of two probes, one probe targeting the positive strand
and the other probe
targeting the negative strand of a target genomic region.
26
CA 03127894 2021-07-26
WO 2020/163403 PCT/US2020/016673
[0107] For each target genomic region, four possible probe sequences can be
designed. DNA
molecules corresponding to, or derived from, each target region is double-
stranded, as such, a
probe or probe set can target either the "positive" or forward strand or its
reverse complement
(the "negative" strand). Additionally, in some embodiments, the probes or
probe sets are
designed to enrich DNA molecules or fragments that have been treated to
convert unmethylated
cytosines (C) to uracils (U). Because the probes or probe sets are designed to
enrich DNA
molecules corresponding to, or derived from the targeted regions after
conversion, the probe's
sequence can be designed to enrich DNA molecules of fragments where
unmethylated C's have
been converted to U's (by utilizing A's in place of G's at sites that are
unmethylated cytosines in
DNA molecules or fragments corresponding to, or derived from, the targeted
region). In one
embodiment, probes are designed to bind to, or hybridize to, DNA molecules or
fragments from
genomic regions known to contain HD-specific methylation patterns (e.g.,
hypermethylated or
hypomethylated DNA molecules), thereby enriching (or detecting) HD-specific
DNA molecules
or fragments. Targeting genomic regions, or HD-specific methylation patterns,
can be
advantageous allowing one to specifically enrich for DNA molecules or
fragments identified as
informative for pan-HD or a specific type of HD, and thus, lowering detection
needs and costs
(e.g., lowering sequencing costs). In other embodiments, two probe sequences
can be designed
per a target genomic region (one for each DNA strand).
[0108] In still other cases, probes are designed to enrich for all DNA
molecules or fragments
corresponding to, or derived from a targeted region (i.e., regardless of
strand or methylation
status). This might be because the HD methylation status is not highly
methylated or
unmethylated, or because the probes are designed to target small mutations or
other variations
rather than methylation changes, with these other variations similarly
indicative of the presence
or absence of an HD or the presence or absence of a specific HD. In that case,
all four possible
probe sequences can be included per a target genomic region.
[0109] In some embodiments, some probes are designed to detect variants and
mutations
indicative to the presence or absence of an HD or the presence or absence of a
specific HD. Such
probes are designed to enrich DNA molecules or fragments corresponding to or
derived from a
targeted region that can include such variants or mutations. Some of the
variants or mutations
can be one or more loci known to be associated with or suspected of being
associated with CHIP
or another HD. Some of the variants or mutations can be one or more loci
identified to be
indicative of CHIP or other HD by methods described in 4.5.
[0110] The probes can range in length from 10s, 100s, 200s, or 300s of base
pairs. The probes
can comprise at least 50, 75, 100, or 120 nucleotides. The probes can comprise
less than 300,
27
CA 03127894 2021-07-26
WO 2020/163403 PCT/US2020/016673
250, 200, or 150 nucleotides. In an embodiment, the probes comprise 100-150
nucleotides. In
one embodiment, the probes comprise 120 nucleotides.
[0111] In some embodiments, the probes are designed in a "2x tiled" fashion to
cover
overlapping portions of a target region. Each probe optionally overlaps in
coverage at least
partially with another probe in the library. In such embodiments, the panel
contains multiple
pairs of probes, with each probe in a pair overlapping the other by at least
25, 30, 35, 40, 45, 50,
60, 70, 75 or 100 nucleotides. In some embodiments, the overlapping sequence
can be designed
to be complementary to a target genomic region (or cfDNA derived therefrom) or
to be
complementary to a sequence with homology to a target region or cfDNA. Thus,
in some
embodiments, at least two probes are complementary to the same sequence within
a target
genomic region, and a nucleotide fragment corresponding to or derived from the
target genomic
region can be bound and pulled down by at least one of the probes. Other
levels of tiling are
possible, such as 3x tiling, 4x tiling, etc., wherein each nucleotide in a
target region can bind to
more than two probes.
[0112] In one embodiment, each base in a target genomic region is overlapped
by exactly two
probes, as illustrated in FIG. 1A. A single pair of probes is enough to pull
down a genomic
region if the overlap between the two probes is longer than the target genomic
region and
extends beyond both ends of the target genomic region. In some instances, even
relatively small
target regions may be targeted with three probes (see FIG. 1A). A probe set
comprising three or
more probes is optionally used to capture a larger genomic region (see FIG.
1B). In some
embodiments, subsets of probes will collectively extend across an entire
genomic region (e.g.,
may be complementary to non-converted or converted fragments from the genomic
region). A
tiled probe set optionally comprises probes that collectively include at least
two probes that
overlap every nucleotide in the genomic region. This is done to ensure that
cfDNAs comprising a
small portion of a target genomic region at one end will have a substantial
overlap extending into
the adjacent non-targeted genomic region with at least one probe, to provide
for efficient capture.
[0113] For example, a 100 bp cfDNA fragment comprising a 30 nt target genomic
region can be
guaranteed to have at least 65 bp overlap with at least one of the overlapping
probes. Other
levels of tiling are possible. For example, to increase target size and add
more probes in a panel,
probes can be designed to expand a 30 bp target region by at least 70 bp, 65
bp, 60 bp, 55 bp, or
50 bp. To capture any fragment that overlaps the target region at all (even if
by only lbp), the
probes can be designed to extend past the ends of the target region on either
side.
[0114] The probes are designed to analyze methylation status of target genomic
regions (e.g., of
the human or another organism) that are suspected to correlate with the
presence or absence of
28
CA 03127894 2021-07-26
WO 2020/163403 PCT/US2020/016673
HD generally, presence or absence of certain types of HD, HD stage, or
presence or absence of
other types of diseases (e.g., other types of cancer such as solid cancer).
[0115] Furthermore, the probes are designed to effectively hybridize to (or
bind to) and
optionally pull down cfDNA fragments containing a target genomic region. In
some
embodiments, the probes are designed to cover overlapping portions of a target
region, so that
each probe is "tiled" in coverage such that each probe overlaps in coverage at
least partially with
another probe in the library. In such embodiments, the panel contains multiple
pairs of probes,
where each pair comprises at least two probes overlapping each other by an
overlapping
sequence of at least 25, 30, 35, 40, 45, 50, 60, 70, 75 or 100 nucleotides. In
some embodiments,
the overlapping sequence can be designed to have sequence homology with or to
be
complementary to a target genomic region (or a converted version thereof),
thus a nucleotide
fragment derived from or corresponding to the target genomic region can be
bound and
optionally pulled down by at least one of the probes.
[0116] In one embodiment, the smallest target genomic region is 30bp. When a
new target
region is added to the panel (based on the greedy selection as described
above), the new target
region of 30bp can be centered on a specific CpG site of interest. Then, it is
checked whether
each edge of this new target is close enough to other targets such that they
can be merged. This is
based on a "merge distance" parameter which can be 200bp by default but can be
tuned. This
allows close but distinct target regions to be enriched with overlapping
probes. Depending on
whether close enough targets exist to the left or right of the new target, the
new target can be
merged with nothing (increasing the number of panel targets by one), merged
with just one target
either to the left or the right (not changing the number of panel targets), or
merged with existing
targets both to the left and right (reducing the number of panel targets by
one).
Methods of selecting target genomic regions based on methylation status
[0117] In another aspect, methods of selecting target genomic regions for
detecting HD and/or a
specific type or stage of HD are provided. The targeted genomic regions can be
used to design
and manufacture probes for an HD assay panel. Methylation status of DNA or
cfDNA molecules
corresponding to, or derived from, the target genomic regions can be screened
using the HD
assay panel. Alternative methods, for example by WGBS or other methods known
in the art, can
be also implemented to detect methylation status of DNA molecules or fragments
corresponding
to, or derived from, the target genomic regions.
Sample processing
[0118] FIG. 7A is a flowchart of a process 100 for processing a nucleic acid
sample and
generating methylation state vectors for DNA fragments, according to one
embodiment. While
29
CA 03127894 2021-07-26
WO 2020/163403 PCT/US2020/016673
the present disclosure pays particular attention to sequencing based
approaches for detecting
nucleic acids and determining methylation status, the disclosure is broad
enough to encompass
other methods for determining methylation status of nucleic acid sequences
(such as
methylation-aware sequencing approaches described in WO 2014/043763, which is
incorporated
herein by reference). As described in FIG. 7A, the method includes, but is not
limited to, the
following steps. For example, any step of the method may comprise a
quantitation sub-step for
quality control or other laboratory assay procedures known to one skilled in
the art.
[0119] In step 105, a nucleic acid sample (DNA or RNA) is extracted from a
subject. In the
present disclosure, DNA and RNA may be used interchangeably unless otherwise
indicated. That
is, the embodiments described herein may be applicable to both DNA and RNA
types of nucleic
acid sequences. However, the examples described herein may focus on DNA for
purposes of
clarity and explanation. The sample may be any subset of the human genome,
including the
whole genome. The sample may include blood, plasma, serum, urine, fecal,
saliva, other types of
bodily fluids, or any combination thereof In some embodiments, methods for
drawing a blood
sample (e.g., syringe or finger prick) may be less invasive than procedures
for obtaining a tissue
biopsy, which may require surgery. The extracted sample may comprise cfDNA
and/or ctDNA.
For healthy individuals, the human body may naturally clear out cfDNA and
other cellular
debris. If a subject has a cancer or disease, cfDNA and/or ctDNA in an
extracted sample may be
present at a level sufficient to detect the hematological disorder.
[0120] In step 110, the cfDNA fragments are treated to convert unmethylated
cytosines to
uracils. In one embodiment, the method uses a bisulfite treatment of the DNA
which converts the
unmethylated cytosines to uracils without converting the methylated cytosines.
For example, a
commercial kit such as the EZ DNA MethylationTm ¨ Gold, EZ DNA Methylation ¨
Direct or
an EZ DNA MethylationTm ¨ Lightning kit (available from Zymo Research Corp
(Irvine, CA)) is
used for the bisulfite conversion. In another embodiment, the conversion of
unmethylated
cytosines to uracils is accomplished using an enzymatic reaction. For example,
the conversion
can use a commercially available kit for conversion of unmethylated cytosines
to uracils, such as
APOBEC-Seq (NEBiolabs, Ipswich, MA).
[0121] In step 115, a sequencing library is prepared. In a first step, a ssDNA
adapter is added to
the 3'-OH end of a bisulfite-converted ssDNA molecule using a ssDNA ligation
reaction. In one
embodiment, the ssDNA ligation reaction uses CircLigase II (Epicentre) to
ligate the ssDNA
adapter to the 3'-OH end of a bisulfite-converted ssDNA molecule, wherein the
5'-end of the
adapter is phosphorylated and the bisulfite-converted ssDNA has been
dephosphorylated (i.e.,
the 3' end has a hydroxyl group). In another embodiment, the ssDNA ligation
reaction uses
CA 03127894 2021-07-26
WO 2020/163403 PCT/US2020/016673
Thermostable 5' AppDNA/RNA ligase (available from New England BioLabs
(Ipswich, MA)) to
ligate the ssDNA adapter to the 3'-OH end of a bisulfite-converted ssDNA
molecule. In this
example, the first UMI adapter is adenylated at the 5'-end and blocked at the
3'-end. In another
embodiment, the ssDNA ligation reaction uses a T4 RNA ligase (available from
New England
BioLabs) to ligate the ssDNA adapter to the 3'-OH end of a bisulfite-converted
ssDNA molecule.
In a second step, a second strand DNA is synthesized in an extension reaction.
For example, an
extension primer, that hybridizes to a primer sequence included in the ssDNA
adapter, is used in
a primer extension reaction to form a double-stranded bisulfite-converted DNA
molecule.
Optionally, in one embodiment, the extension reaction uses an enzyme that is
able to read
through uracil residues in the bisulfite-converted template strand.
Optionally, in a third step, a
dsDNA adapter is added to the double-stranded bi sulfite-converted DNA
molecule. Finally, the
double-stranded bisulfite-converted DNA is amplified to add sequencing
adapters. For example,
PCR amplification using a forward primer that includes a P5 sequence and a
reverse primer that
includes a P7 sequence is used to add P5 and P7 sequences to the bisulfite-
converted DNA.
Optionally, during library preparation, unique molecular identifiers (UMI) may
be added to the
nucleic acid molecules (e.g., DNA molecules) through adapter ligation. The
UMIs are short
nucleic acid sequences (e.g., 4-10 base pairs) that are added to ends of DNA
fragments during
adapter ligation. In some embodiments, UMIs are degenerate base pairs that
serve as a unique
tag that can be used to identify sequence reads originating from a specific
DNA fragment.
During PCR amplification following adapter ligation, the UMIs are replicated
along with the
attached DNA fragment, which provides a way to identify sequence reads that
came from the
same original fragment in downstream analysis.
[0122] In step 120, targeted DNA sequences may be enriched from the library.
This is used, for
example, where a targeted panel assay is being performed on the samples.
During enrichment,
hybridization probes (also referred to herein as "probes") are used to target,
and pull down,
nucleic acid fragments informative for the presence or absence of HD (or
disease), HD status, or
an HD classification (e.g., HD type or tissue of origin). For a given
workflow, the probes may be
designed to anneal (or hybridize) to a target (complementary) strand of DNA or
RNA. The target
strand may be the "positive" strand (e.g., the strand transcribed into mRNA,
and subsequently
translated into a protein) or the complementary "negative" strand. The probes
may range in
length from 10s, 100s, or 1000s of base pairs. Moreover, the probes may cover
overlapping
portions of a target region.
[0123] After a hybridization step 120, the hybridized nucleic acid fragments
are captured and
may also be amplified using PCR (enrichment 125). For example, the target
sequences can be
31
CA 03127894 2021-07-26
WO 2020/163403 PCT/US2020/016673
enriched to obtain enriched sequences that can be subsequently sequenced. In
general, any
known method in the art can be used to isolate, and enrich for, probe-
hybridized target nucleic
acids. For example, as is well known in the art, a biotin moiety can be added
to the 5'-end of the
probes (i.e., biotinylated) to facilitate isolation of target nucleic acids
hybridized to probes using
a streptavidin-coated surface (e.g., streptavidin-coated beads).
[0124] In step 130, sequence reads are generated from the enriched DNA
sequences, e.g.,
enriched sequences. Sequence data may be acquired from the enriched DNA
sequences by
known means in the art. For example, the method may include next generation
sequencing
(NGS) techniques including synthesis technology (Illumina), pyrosequencing
(454 Life
Sciences), ion semiconductor technology (Ion Torrent sequencing), single-
molecule real-time
sequencing (Pacific Biosciences), sequencing by ligation (SOLiD sequencing),
nanopore
sequencing (Oxford Nanopore Technologies), or paired-end sequencing. In some
embodiments,
massively parallel sequencing is performed using sequencing-by-synthesis with
reversible dye
terminators. In other embodiments, as would be readily understood by one of
skill in the art, any
known means for detecting nucleic acids and determining methylations status
can be used. For
example, sequences can be detected, and methylation status determined, using
known
methylation-aware sequencing (see e.g., WO 2014/043763), a DNA microarray
(e.g., with
labeled probes adhered or conjugated to a solid surface or DNA array chip),
etc.
[0125] In step 140, methylation state vectors are generated from the sequence
reads. To do so, a
sequence read is aligned to a reference genome. The reference genome helps
provide the context
as to what position in a human genome the fragment cfDNA originates from. In a
simplified
example, the sequence read is aligned such that the three CpG sites correlate
to CpG sites 23, 24,
and 25 (arbitrary reference identifiers used for convenience of description).
After alignment,
there is information both on methylation status of all CpG sites on the cfDNA
fragment and
which position in the human genome the CpG sites map to. With the methylation
status and
location, a methylation state vector may be generated for the fragment cfDNA.
Generation of data structure
[0126] FIG. 3A is a flowchart describing a process 300 of generating a data
structure for a
healthy control group, according to an embodiment. To create a healthy control
group data
structure, the analytics system obtains information related to methylation
status of a plurality of
CpG sites on sequence reads derived from a plurality of DNA molecules or
fragments from a
plurality of healthy subjects. The method provided herein for creating a
healthy control group
data structure can be performed similarly for subjects with HD, subjects with
a specific type of
32
CA 03127894 2021-07-26
WO 2020/163403 PCT/US2020/016673
HD, or subjects with another known disease state. A methylation state vector
is generated for
each DNA molecule or fragment, for example via the process 100.
[0127] With each fragment's methylation state vector, the analytics system
subdivides 310 the
methylation state vector into strings of CpG sites. In one embodiment, the
analytics system
subdivides 310 the methylation state vector such that the resulting strings
are all less than a given
length. For example, a methylation state vector of length 11 may be subdivided
into strings of
length less than or equal to 3 would result in 9 strings of length 3, 10
strings of length 2, and 11
strings of length 1. In another example, a methylation state vector of length
7 being subdivided
into strings of length less than or equal to 4 would result in 4 strings of
length 4, 5 strings of
length 3, 6 strings of length 2, and 7 strings of length 1. If a methylation
state vector is shorter
than or the same length as the specified string length, then the methylation
state vector may be
converted into a single string containing all of the CpG sites of the vector.
[0128] The analytics system tallies 320 the strings by counting, for each
possible CpG site and
possibility of methylation states in the vector, the number of strings present
in the control group
having the specified CpG site as the first CpG site in the string and having
that possibility of
methylation states. For example, at a given CpG site and considering string
lengths of 3, there
are 21'3 or 8 possible string configurations. At that given CpG site, for each
of the 8 possible
string configurations, the analytics system tallies 320 how many occurrences
of each methylation
state vector possibility come up in the control group. Continuing this
example, this may involve
tallying the following quantities: <Mg, M+1, Mx+2 < Mx, M+1, Ux+2 >, = = < Ux,
Ux+1, Ux+2 >
for each starting CpG site x in the reference genome. The analytics system
creates 330 the data
structure storing the tallied counts for each starting CpG site and string
possibility.
[0129] There are several benefits to setting an upper limit on string length.
First, depending on
the maximum length for a string, the size of the data structure created by the
analytics system
can dramatically increase in size. For instance, maximum string length of 4
means that every
CpG site has at the very least 21'4 numbers to tally for strings of length 4.
Increasing the
maximum string length to 5 means that every CpG site has an additional 21'4 or
16 numbers to
tally, doubling the numbers to tally (and computer memory required) compared
to the prior
string length. Reducing string size helps keep the data structure creation and
performance (e.g.,
use for later accessing as described below), in terms of computational and
storage, reasonable.
Second, a statistical consideration to limiting the maximum string length is
to avoid overfitting
downstream models that use the string counts. If long strings of CpG sites do
not, biologically,
have a strong effect on the outcome (e.g., predictions of anomalousness that
predictive of the
presence of HD), calculating probabilities based on large strings of CpG sites
can be problematic
33
CA 03127894 2021-07-26
WO 2020/163403 PCT/US2020/016673
as it requires a significant amount of data that may not be available, and
thus would be too sparse
for a model to perform appropriately. For example, calculating a probability
of
anomalousness/HD conditioned on the prior 100 CpG sites would require counts
of strings in the
data structure of length 100, ideally some matching exactly the prior 100
methylation states. If
only sparse counts of strings of length 100 are available, there will be
insufficient data to
determine whether a given string of length of 100 in a test sample is
anomalous or not.
Validation of data structure
[0130] Once the data structure has been created, the analytics system may seek
to validate 340
the data structure and/or any downstream models making use of the data
structure. One type of
validation checks consistency within the control group's data structure. For
example, if there are
any outlier subjects, samples, and/or fragments within a control group, then
the analytics system
may perform various calculations to determine whether to exclude any fragments
from one of
those categories. In a representative example, the healthy control group may
contain a sample
that is undiagnosed but has an HD such that the sample contains anomalously
methylated
fragments. This first type of validation ensures that potential HD samples are
removed from the
healthy control group so as to not affect the control group's purity.
[0131] A second type of validation checks the probabilistic model used to
calculate p-values
with the counts from the data structure itself (i.e., from the healthy control
group). A process for
p-value calculation is described below in conjunction with FIG. 5. Once the
analytics system
generates a p-value for the methylation state vectors in the validation group,
the analytics system
builds a cumulative density function (CDF) with the p-values. With the CDF,
the analytics
system may perform various calculations on the CDF to validate the control
group's data
structure. One test uses the fact that the CDF should ideally be at or below
an identity function,
such that CDF(x) < x. On the converse, being above the identity function
reveals some
deficiency within the probabilistic model used for the control group's data
structure. For
example, if 1/100 of fragments have a p-value score of 1/1000 meaning CDF
(1/1000) = 1/100>
1/1000, then the second type of validation fails indicating an issue with the
probabilistic model.
[0132] A third type of validation uses a healthy set of validation samples
separate from those
used to build the data structure, which tests if the data structure is
properly built and the model
works. An example process for carrying out this type of validation is
described below in
conjunction with FIG. 3B. The third type of validation can quantify how well
the healthy control
group generalizes the distribution of healthy samples. If the third type of
validation fails, then the
healthy control group does not generalize well to the healthy distribution.
34
CA 03127894 2021-07-26
WO 2020/163403 PCT/US2020/016673
[0133] A fourth type of validation tests with samples from a non-healthy
validation group. The
analytics system calculates p-values and builds the CDF for the non-healthy
validation group.
With a non-healthy validation group, the analytics system expects to see the
CDF(x) > x for at
least some samples or, stated differently, the converse of what was expected
in the second type
of validation and the third type of validation with the healthy control group
and the healthy
validation group. If the fourth type of validation fails, then this is
indicative that the model is not
appropriately identifying the anomalousness that it was designed to identify.
[0134] FIG. 3B is a flowchart describing the additional step 340 of validating
the data structure
for the control group of FIG. 3A, according to an embodiment. In this
embodiment of the step
340 of validating the data structure, the analytics system performs the fourth
type of validation
test as described above which utilizes a validation group with a supposedly
similar composition
of subjects, samples, and/or fragments as the control group. For example, if
the analytics system
selected healthy subjects without HD for the control group, then the analytics
system also uses
healthy subjects without HD in the validation group.
[0135] The analytics system takes the validation group and generates 100 a set
of methylation
state vectors as described in FIG. 3A. The analytics system performs a p-value
calculation for
each methylation state vector from the validation group. The p-value
calculation process will be
further described in conjunction with FIGs. 4 & 5. For each possibility of
methylation state
vector, the analytics system calculates a probability from the control group's
data structure. Once
the probabilities are calculated for the possibilities of methylation state
vectors, the analytics
system calculates 350 a p-value score for that methylation state vector based
on the calculated
probabilities. The p-value score represents an expectedness of finding that
specific methylation
state vector and other possible methylation state vectors having even lower
probabilities in the
control group. A low p-value score, thereby, generally corresponds to a
methylation state vector
which is relatively unexpected in comparison to other methylation state
vectors within the
control group, where a high p-value score generally corresponds to a
methylation state vector
which is relatively more expected in comparison to other methylation state
vectors found in the
control group. Once the analytics system generates a p-value score for the
methylation state
vectors in the validation group, the analytics system builds 360 a cumulative
density function
(CDF) with the p-value scores from the validation group. The analytics system
validates 370
consistency of the CDF as described above in the fourth type of validation
tests.
Anomalously methylated fragments
[0136] Anomalously methylated fragments having abnormal methylation patterns
in HD
samples, subject with a specific type of HD, or subjects with another known
disease state, are
CA 03127894 2021-07-26
WO 2020/163403 PCT/US2020/016673
selected as target genomic regions, according to an embodiment as outlined in
FIG. 4.
Exemplary processes of selected anomalously methylated fragments 440 are
visually illustrated
in FIG. 5, and is further described below the description of FIG. 4. In
process 400, the analytics
system generates 100 methylation state vectors from cfDNA fragments of the
sample. The
analytics system handles each methylation state vector as follows.
[0137] For a given methylation state vector, the analytics system enumerates
410 all possibilities
of methylation state vectors having the same starting CpG site and same length
(i.e., set of CpG
sites) in the methylation state vector. As each methylation state may be
methylated or
unmethylated there are only two possible states at each CpG site, and thus the
count of distinct
possibilities of methylation state vectors depends on a power of 2, such that
a methylation state
vector of length n would be associated with 2n possibilities of methylation
state vectors.
[0138] The analytics system calculates 420 the probability of observing each
possibility of
methylation state vector for the identified starting CpG site / methylation
state vector length by
accessing the healthy control group data structure. In one embodiment,
calculating the
probability of observing a given possibility uses a Markov chain probability
to model the joint
probability calculation which will be described in greater detail with respect
to FIG. 5 below. In
other embodiments, calculation methods other than Markov chain probabilities
are used to
determine the probability of observing each possibility of methylation state
vector.
[0139] The analytics system calculates 430 a p-value score for the methylation
state vector using
the calculated probabilities for each possibility. In one embodiment, this
includes identifying the
calculated probability corresponding to the possibility that matches the
methylation state vector
in question. Specifically, this is the possibility having the same set of CpG
sites, or similarly the
same starting CpG site and length as the methylation state vector. The
analytics system sums the
calculated probabilities of any possibilities having probabilities less than
or equal to the
identified probability to generate the p-value score.
[0140] This p-value represents the probability of observing the methylation
state vector of the
fragment or other methylation state vectors even less probable in the healthy
control group. A
low p-value score, thereby, generally corresponds to a methylation state
vector which is rare in a
healthy subject, and which causes the fragment to be labeled abnormally
methylated, relative to
the healthy control group. A high p-value score generally relates to a
methylation state vector is
expected to be present, in a relative sense, in a healthy subject. If the
healthy control group is a
non-HD group, for example, a low p-value indicates that the fragment is
abnormally methylated
relative to the non-HD group, and therefore possibly indicative of the
presence of HD in the test
subject.
36
CA 03127894 2021-07-26
WO 2020/163403 PCT/US2020/016673
[0141] As above, the analytics system calculates p-value scores for each of a
plurality of
methylation state vectors, each representing a cfDNA fragment in the test
sample. To identify
which of the fragments are abnormally methylated, the analytics system may
filter 440 the set of
methylation state vectors based on their p-value scores. In one embodiment,
filtering is
performed by comparing the p-values scores against a threshold and keeping
only those
fragments below the threshold. This threshold p-value score could be on the
order of 0.1, 0.01,
0.001, 0.0001, or similar.
P-value score calculation
[0142] FIG. 5 is an illustration 500 of an example p-value score calculation,
according to an
embodiment. To calculate a p-value score given a test methylation state vector
505, the analytics
system takes that test methylation state vector 505 and enumerates 410
possibilities of
methylation state vectors. In this illustrative example, the test methylation
state vector 505 is <
M23, M24, M25, U26>. As the length of the test methylation state vector 505 is
4, there are 21'4
possibilities of methylation state vectors encompassing CpG sites 23 ¨ 26. In
a generic example,
the number of possibilities of methylation state vectors is 2An, where n is
the length of the test
methylation state vector or alternatively the length of the sliding window
(described further
below).
[0143] The analytics system calculates 420 probabilities 515 for the
enumerated possibilities of
methylation state vectors. As methylation is conditionally dependent on
methylation status of
nearby CpG sites, one way to calculate the probability of observing a given
methylation state
vector possibility is to use Markov chain model. Generally, a methylation
state vector such as
<Si, S2, , Se>, where S denotes the methylation state whether methylated
(denoted as M),
unmethylated (denoted as U), or indeterminate (denoted as I), has a joint
probability that can be
expanded using the chain rule of probabilities as:
P(< Si, S2, , Sn >) = P (Sni ¨, Sn¨i >) * P (Sn¨ii Sn-2 >) *
(1)
* P (S2I S1) * P (Si)
Markov chain model can be used to make the calculation of the conditional
probabilities
of each possibility more efficient. In one embodiment, the analytics system
selects a Markov
chain order k which corresponds to how many prior CpG sites in the vector (or
window) to
consider in the conditional probability calculation, such that the conditional
probability is
modeled as P(Se Si, ..., Se-i ) P(Sn Sn-k-2, , Sn-1 ).
[0144] To calculate each Markov modeled probability for a possibility of
methylation state
vector, the analytics system accesses the control group's data structure,
specifically the counts of
various strings of CpG sites and states. To calculate P(Mn Sn-k-2, , Sn-1 ),
the analytics
system takes a ratio of the stored count of the number of strings from the
data structure (2)
37
CA 03127894 2021-07-26
WO 2020/163403 PCT/US2020/016673
matching < Sn-1, Mn > divided by the sum of the stored count of the
number of strings
from the data structure matching < Sn-k-2, Se-i, Mn > and < Sn-k-
2, Se-1, Un >. Thus, P(Mn
Sn-k-2, Si), is calculated ratio having the
form:
# of < Sn-k-2, Sn-1, Mn >
# of < Sn¨k-2, === Sn-1, Mn. > # of < Sn-k-2, Sn-1, Un >
[0145] The calculation may additionally implement a smoothing of the counts by
applying a
prior distribution. In one embodiment, the prior distribution is a uniform
prior as in Laplace
smoothing. As an example of this, a constant is added to the numerator and
another constant
(e.g., twice the constant in the numerator) is added to the denominator of the
above equation. In
other embodiments, an algorithmic technique such as Knesser-Ney smoothing is
used.
[0146] In the illustration, the above denoted formulas are applied to the test
methylation state
vector 505 covering sites 23 ¨26. Once the calculated probabilities 515 are
completed, the
analytics system calculates 430 a p-value score 525 that sums the
probabilities that are less than
or equal to the probability of possibility of methylation state vector
matching the test methylation
state vector 505.
[0147] In one embodiment, the computational burden of calculating
probabilities and/or p-value
scores may be further reduced by caching at least some calculations. For
example, the analytic
system may cache in transitory or persistent memory calculations of
probabilities for possibilities
of methylation state vectors (or windows thereof). If other fragments have the
same CpG sites,
caching the possibility probabilities allows for efficient calculation of p-
value scores without
needing to re-calculate the underlying possibility probabilities.
Equivalently, the analytics
system may calculate p-value scores for each of the possibilities of
methylation state vectors
associated with a set of CpG sites from vector (or window thereof). The
analytics system may
cache the p-value scores for use in determining the p-value scores of other
fragments including
the same CpG sites. Generally, the p-value scores of possibilities of
methylation state vectors
having the same CpG sites may be used to determine the p-value score of a
different one of the
possibilities from the same set of CpG sites.
Sliding window
[0148] In one embodiment, the analytics system uses 435 a sliding window to
determine
possibilities of methylation state vectors and calculate p-values. Rather than
enumerating
possibilities and calculating p-values for entire methylation state vectors,
the analytics system
enumerates possibilities and calculates p-values for only a window of
sequential CpG sites,
where the window is shorter in length (of CpG sites) than at least some
fragments (otherwise, the
38
CA 03127894 2021-07-26
WO 2020/163403 PCT/US2020/016673
window would serve no purpose). The window length may be static, user
determined, dynamic,
or otherwise selected.
[0149] In calculating p-values for a methylation state vector larger than the
window, the window
identifies the sequential set of CpG sites from the vector within the window
starting from the
first CpG site in the vector. The analytic system calculates a p-value score
for the window
including the first CpG site. The analytics system then "slides" the window to
the second CpG
site in the vector, and calculates another p-value score for the second
window. Thus, for a
window size / and methylation vector length m, each methylation state vector
will generate m-
1+1 p-value scores. After completing the p-value calculations for each portion
of the vector, the
lowest p-value score from all sliding windows is taken as the overall p-value
score for the
methylation state vector. In another embodiment, the analytics system
aggregates the p-value
scores for the methylation state vectors to generate an overall p-value score.
[0150] Using the sliding window helps to reduce the number of enumerated
possibilities of
methylation state vectors and their corresponding probability calculations
that would otherwise
need to be performed. Example probability calculations are shown in FIG. 5,
but generally the
number of possibilities of methylation state vectors increases exponentially
by a factor of 2 with
the size of the methylation state vector. To give a realistic example, it is
possible for fragments to
have upwards of 54 CpG sites. Instead of computing probabilities for 21'54 (-
1.8x10^16)
possibilities to generate a single p-value, the analytics system can instead
use a window of size 5
(for example) which results in 50 p-value calculations for each of the 50
windows of the
methylation state vector for that fragment. Each of the 50 calculations
enumerates 2A5 (32)
possibilities of methylation state vectors, which total results in 50x2A5
(1.6x10^3) probability
calculations. This results in a vast reduction of calculations to be
performed, with no meaningful
hit to the accurate identification of anomalous fragments. This additional
step can also be applied
when validating 340 the control group with the validation group's methylation
state vectors.
Identifting fragments indicative of HD
[0151] The analytics system identifies 450 DNA fragments indicative of HD from
the filtered set
of anomalously methylated fragments.
Hypomethylated and hypermethylated fragments
[0152] According to a first method, the analytics system may identify DNA
fragments that are
deemed hypomethylated or hypermethylated as fragments indicative of HD from
the filtered set
of anomalously methylated fragments. Hypomethylated and hypermethylated
fragments can be
defined as fragments of a certain length of CpG sites (e.g., more than 3, 4,
5, 6, 7, 8, 9, 10, etc.)
with a high percentage of methylated CpG sites (e.g., more than 80%, 85%, 90%,
or 95%, or any
39
CA 03127894 2021-07-26
WO 2020/163403 PCT/US2020/016673
other percentage within the range of 50%-100%) or a high percentage of
unmethylated CpG sites
(e.g., more than 80%, 85%, 90%, or 95%, or any other percentage within the
range of 50%-
100%).
Probabilistic models
[0153] According to a second method, the analytics system identifies fragments
indicative of HD
utilizing probabilistic models of methylation patterns fitted to each HD type
and non-HD type.
The analytics system calculates log-likelihood ratios for a sample using DNA
fragments in the
genomic regions considering the various HD types with the fitted probabilistic
models for each
HD type and non-HD type. The analytics system may determine a DNA fragment to
be
indicative of HD based on whether at least one of the log-likelihood ratios
considered against the
various HD types is above a threshold value.
[0154] In one embodiment of partitioning the genome, the analytics system
partitions the
genome into regions by multiple stages. In a first stage, the analytics system
separates the
genome into blocks of CpG sites. Each block is defined when there is a
separation between two
adjacent CpG sites that exceeds some threshold, e.g., greater than 200 bp, 300
bp, 400 bp, 500
bp, 600 bp, 700 bp, 800 bp, 900 bp, or 1,000 bp. From each block, the
analytics system
subdivides at a second stage each block into regions of a certain length,
e.g., 500 bp, 600 bp, 700
bp, 800 bp, 900 bp, 1,000 bp, 1,100 bp, 1,200 bp, 1,300 bp, 1,400 bp, or 1,500
bp. The analytics
system may further overlap adjacent regions by a percentage of the length,
e.g., 10%, 20%, 30%,
40%, 50%, or 60%.
[0155] The analytics system analyzes sequence reads derived from DNA fragments
for each
region. The analytics system may process samples from tissue and/or high-
signal cfDNA. High-
signal cfDNA samples may be determined by a binary classification model, by HD
stage, or by
another metric.
[0156] For each HD type and non-HD, the analytics system fits a separate
probabilistic model
for fragments. In one example, each probabilistic model is mixture model
comprising a
combination of a plurality of mixture components with each mixture component
being an
independent-sites model where methylation at each CpG site is assumed to be
independent of
methylation statuses at other CpG sites.
[0157] In alternate embodiments, calculation is performed with respect to each
CpG site.
Specifically, a first count is determined that is the number of HD samples (HD
count) that
include an anomalously methylated DNA fragment overlapping that CpG, and a
second count is
determined that is the total number of samples containing fragments
overlapping that CpG (total)
in the set. Genomic regions can be selected based on the numbers, for example,
based on criteria
CA 03127894 2021-07-26
WO 2020/163403 PCT/US2020/016673
positively correlated to the number of HD samples (HD count) that include a
DNA fragment
overlapping that CpG, and inversely correlated to the total number of samples
containing
fragments overlapping that CpG (total) in the set.
[0158] The analytics system can further calculate log-likelihood ratios ("R")
for a fragment
indicating a likelihood of the fragment being indicative of HD considering the
various HD types
with the fitted probabilistic models for each HD type and non-HD type. The two
probabilities
may be taken from probabilistic models fitted for each of the HD types and the
non-HD type, the
probabilistic models defined to calculate a likelihood of observing a
methylation pattern on a
fragment given each of the HD types and the non-HD type. For example, the
probabilistic
models may be defined fitted for each of the HD types and the non-HD type.
Selection of genomic regions indicative of HD
[0159] The analytics system identifies 460 genomic regions indicative of HD.
To identify these
informative regions, the analytics system calculates an information gain for
each genomic region
or more specifically each CpG site that describes an ability to distinguish
between various
outcomes.
[0160] A method for identifying genomic regions capable of distinguishing
between HD type
and non-HD type utilizes a trained classification model that can be applied on
the set of
anomalously methylated DNA molecules or fragments corresponding to, or derived
from an HD
or non-HD group. The trained classification model can be trained to identify
any condition of
interest that can be identified from the methylation state vectors.
[0161] In one embodiment, the trained classification model is a binary
classifier trained based on
methylation states for cfDNA fragments or genomic sequences obtained from a
subject cohort
with HD or a specific type of HD, and a healthy subject cohort without HD, and
is then used to
classify a test subject probability of having HD, or not having HD, based on
anomalously
methylation state vectors. In other embodiments, different classifiers may be
trained using
subject cohorts known to have particular HD (e.g., CHIP, leukemia, etc.); or
known to have
different stages of particular HD (e.g., CHIP, cancer stage I, II, III, or
IV). In these embodiments,
different classifiers may be trained using sequence reads obtained from
samples enriched for
tumor cells from subject cohorts known to have particular blood cancer (e.g.,
leukemia,
lymphoid neoplasms (e.g. lymphoma), multiple myeloma, and myeloid neoplasm,
etc.). Each
genomic region's ability to distinguish between HD type and non-HD type in the
classification
model is used to rank the genomic regions from most informative to least
informative in
classification performance. The analytics system may identify genomic regions
from the ranking
according to information gain in classification between non-HD type and HD
type.
41
CA 03127894 2021-07-26
WO 2020/163403 PCT/US2020/016673
Computing information gain from hypomethylated and hypermethylated fragments
indicative of HD
[0162] With fragments indicative of HD, the analytics system may train a
classifier according to
a process 600 illustrated in FIG. 6A, according to an embodiment. The process
600 accesses two
training groups of samples ¨ a non-HD group and an HD group ¨ and obtains 605
a non-HD set
of methylation state vectors and an HD set of methylation state vectors
comprising anomalously
methylated fragments, e.g., via step 440 from the process 400.
[0163] The analytics system determines 610, for each methylation state vector,
whether the
methylation state vector is indicative of HD. Here, fragments indicative of HD
may be defined as
hypermethylated or hypomethylated fragments determined if at least some number
of CpG sites
have a particular state (methylated or unmethylated, respectively) and/or have
a threshold
percentage of sites that are the particular state (again, methylated or
unmethylated, respectively).
In one example, cfDNA fragments are identified as hypomethylated or
hypermethylated,
respectively, if the fragment overlaps at least 5 CpG sites, and at least 80%,
90%, or 100% of its
CpG sites are methylated or at least 80%, 90%, or 100% are unmethylated.
[0164] In an alternate embodiment, the analytics system considers portions of
the methylation
state vector and determines whether the portion is hypomethylated or
hypermethylated, and may
distinguish that portion to be hypomethylated or hypermethylated. This
alternative resolves
missing methylation state vectors which are large in size but contain at least
one region of dense
hypomethylation or hypermethylation. This process of defining hypomethylation
and
hypermethylation can be applied in step 450 of FIG. 4. In another embodiment,
the fragments
indicative of HD may be defined according to likelihoods outputted from
trained probabilistic
models.
[0165] In one embodiment, the process generates 620 a hypomethylation score
(Pi) and a
hypermethylation score (Phyper) per CpG site in the genome. To generate either
score at a given
CpG site, the classifier takes four counts at that CpG site ¨ (1) count of
(methylations state)
vectors of the HD set labeled hypomethylated that overlap the CpG site; (2)
count of vectors of
the HD set labeled hypermethylated that overlap the CpG site; (3) count of
vectors of the non-
HD set labeled hypomethylated that overlap the CpG site; and (4) count of
vectors of the non-
HD set labeled hypermethylated that overlap the CpG site. Additionally, the
process may
normalize these counts for each group to account for variance in group size
between the non-HD
group and the HD group. In alternative embodiments wherein fragments
indicative of HD are
42
CA 03127894 2021-07-26
WO 2020/163403 PCT/US2020/016673
more generally used, the scores may be more broadly defined as counts of
fragments indicative
of HD at each genomic region and/or CpG site.
[0166] In one embodiment, to generate 620 the hypomethylation score at a given
CpG site, the
process takes a ratio of (1) over (1) summed with (3). Similarly, the
hypermethylation score is
calculated by taking a ratio of (2) over (2) and (4). Additionally, these
ratios may be calculated
with an additional smoothing technique as discussed above. The hypomethylation
score and the
hypermethylation score relate to an estimate of HD probability given the
presence of
hypomethylation or hypermethylation of fragments from the HD set.
[0167] The analytics system generates 630 an aggregate hypomethylation score
and an aggregate
hypermethylation score for each anomalous methylation state vector. The
aggregate hyper and
hypo methylation scores are determined based on the hyper and hypo methylation
scores of the
CpG sites in the methylation state vector. In one embodiment, the aggregate
hyper and hypo
methylation scores are assigned as the largest hyper and hypo methylation
scores of the sites in
each state vector, respectively. However, in alternate embodiments, the
aggregate scores could
be based on means, medians, or other calculations that use the hyper/hypo
methylation scores of
the sites in each vector.
[0168] The analytics system ranks 640 all of that subject's methylation state
vectors by their
aggregate hypomethylation score and by their aggregate hypermethylation score,
resulting in two
rankings per subject. The process selects aggregate hypomethylation scores
from the
hypomethylation ranking and aggregate hypermethylation scores from the
hypermethylation
ranking. With the selected scores, the classifier generates 650 a single
feature vector for each
subject. In one embodiment, the scores selected from either ranking are
selected with a fixed
order that is the same for each generated feature vector for each subject in
each of the training
groups. As an example, in one embodiment the classifier selects the first, the
second, the fourth,
and the eighth aggregate hyper methylation score, and similarly for each
aggregate hypo
methylation score, from each ranking and writes those scores in the feature
vector for that
subject.
[0169] The analytics system trains 660 a binary classifier to distinguish
feature vectors between
the HD and non-HD training groups. Generally, any one of a number of
classification techniques
may be used. In one embodiment the classifier is a non-linear classifier. In a
specific
embodiment, the classifier is a non-linear classifier utilizing a L2-
regularized kernel logistic
regression with a Gaussian radial basis function (RBF) kernel.
[0170] Specifically, in one embodiment, the number of non-HD samples or
different HD type(s)
(nor) and the number of HD samples or HD type(s) (n..) having an anomalously
methylated
43
CA 03127894 2021-07-26
WO 2020/163403 PCT/US2020/016673
fragment overlapping a CpG site are counted. Then the probability that a
sample is HD is
estimated by a score ("S") that positively correlates to n. and inversely
correlated to nor. The
score can be calculated using the equation: (n.. + 1) / (n.. + n.., + 2) or
(n..) / (n.. + no,..r). The
analytics system computes 670 an information gain for each HD type and for
each genomic
region or CpG site to determine whether the genomic region or CpG site is
indicative of HD. The
information gain is computed for training samples with a given HD type
compared to all other
samples. For example, two random variables 'anomalous fragment' (`AF') and 'HD
type' (`CT')
are used. In on embodiment, AF is a binary variable indicating whether there
is an anomalous
fragment overlapping a given CpG site in a given samples as determined for the
anomaly score /
feature vector above. CT is a random variable indicating whether the HD is of
a particular type.
The analytics system computes the mutual information with respect to CT given
AF. That is,
how many bits of information about the HD type are gained if it is known
whether there is an
anomalous fragment overlapping a particular CpG site.
[0171] For a given HD type, the analytics system uses this information to rank
CpG sites based
on how HD specific they are. This procedure is repeated for all HD types under
consideration. If
a particular region is commonly anomalously methylated in training samples of
a given HD but
not in training samples of other HD types or in healthy training samples, then
CpG sites
overlapped by those anomalous fragments will tend to have high information
gains for the given
HD type. The ranked CpG sites for each HD type are greedily added (selected)
to a selected set
of CpG sites based on their rank for use in the HD classifier.
Computing pairwise information gain from fragments indicative of HD identified
from
probabilistic models
[0172] With fragments indicative of HD identified according to the method
described herein, the
analytics may identify genomic regions according to the process 680 in FIG.
6B. The analytics
system defines 690 a feature vector for each sample, for each region, for each
HD type by a
count of DNA fragments that have a calculated log-likelihood ratio that the
fragment is
indicative of HD above a plurality of thresholds, wherein each count is a
value in the feature
vector. In one embodiment, the analytics system counts the number of fragments
present in a
sample at a region for each HD type with log-likelihood ratios above one or a
plurality of
possible threshold values. The analytics system defines a feature vector for
each sample, by a
count of DNA fragments for each genomic region for each HD type that provides
a calculated
log-likelihood ratio for the fragment above a plurality of thresholds, wherein
each count is a
value in the feature vector. The analytics system uses the defined feature
vectors to calculate an
informative score for each genomic region describing that genomic region's
ability to distinguish
44
CA 03127894 2021-07-26
WO 2020/163403 PCT/US2020/016673
between each pair of HD types. For each pair of HD types, the analytics system
ranks regions
based on the informative scores. The analytics system may select regions based
on the ranking
according to informative scores.
[0173] The analytics system calculates 695 an informative score for each
region describing that
region's ability to distinguish between each pair of HD types. For each pair
of distinct HD types,
the analytics system may specify one type as a positive type and the other as
a negative type. In
one embodiment, a region's ability to distinguish between the positive type
and the negative type
is based on mutual information, calculated using the estimated fraction of
cfDNA samples of the
positive type and of the negative type for which the feature would be expected
to be non-zero in
the final assay, i.e., at least one fragment of that tier that would be
sequenced in a targeted
methylation assay. Those fractions are estimated using the observed rates at
which the feature
occurs in healthy cfDNA, and in high-signal cfDNA and/or tumor samples of each
HD type. For
example, if a feature occurs frequently in healthy cfDNA, then it will also be
estimated to occur
frequently in cfDNA of any HD type, and would likely result in a low
informative score. The
analytics system may choose a certain number of regions for each pair of HD
types from the
ranking, e.g., 1024.
[0174] In additional embodiments, the analytics system further identifies
predominantly
hypermethylated or hypomethylated regions from the ranking of regions. The
analytics system
may load the set of fragments in the positive type(s) for a region that was
identified as
informative. The analytics system, from the loaded fragments, evaluates
whether the loaded
fragments are predominantly hypermethylated or hypomethylated. If the loaded
fragments are
predominately hypermethylated or hypomethylated, the analytics system may
select probes
corresponding to the predominant methylation pattern. If the loaded fragments
are not
predominantly hypermethylated or hypomethylated, the analytics system may use
a mixture of
probes for targeting both hypermethylation and hypomethylation. The analytics
system may
further identify a minimal set of CpG sites that overlap more than some
percentage of the
fragments.
[0175] In other embodiments, the analytics system, after ranking the regions
based on
informative scores, labels each region with the lowest informative ranking
across all pairs of HD
types. For example, if a region was the 10th-most-informative region for
distinguishing breast
from lung, and the 5th-most-informative for distinguishing breast from
colorectal, then it would
be given an overall label of "5". The analytics system may design probes
starting with the
lowest-labeled regions while adding regions to the panel, e.g., until the
panel's size budget has
been exhausted.
CA 03127894 2021-07-26
WO 2020/163403 PCT/US2020/016673
Off-target genomic regions
[0176] In some embodiments, probes targeting selected genomic regions are
further filtered 475
based on the number of their off-target regions. This is for screening probes
that pull down too
many cfDNA fragments corresponding to, or derived from, off-target genomic
regions.
Exclusion of probes having many off-target regions can be valuable by
decreasing off-target
rates and increasing target coverage for a given amount of sequencing.
[0177] An off-target genomic region is a genomic region that has sufficient
homology to a target
genomic region, such that DNA molecules or fragments derived from off-target
genomic regions
are hybridized to and pulled down by a probe designed to hybridize to a target
genomic region.
An off-target genomic region can be a genomic region (or a converted sequence
of that same
region) that aligns to a probe along at least 35bp, 40bp, 45bp, 50bp, 60bp,
70bp, or 80bp with at
least an 80%, 85%, 90%, 95%, or 97% match rate. In one embodiment, an off-
target genomic
region is a genomic region (or a converted sequence of that same region) that
aligns to a probe
along at least 45bp with at least a 90% match rate. Various methods known in
the art can be
adopted to screen off-target genomic regions.
[0178] Exhaustively searching the genome to find all off-target genomic
regions can be
computationally challenging. In one embodiment, a k-mer seeding strategy
(which can allow one
or more mismatches) is combined to local alignment at the seed locations. In
this case,
exhaustive searching of good alignments can be guaranteed based on k-mer
length, number of
mismatches allowed, and number of k-mer seed hits at a particular location.
This requires doing
dynamic programing local alignment at a large number of locations, so this
approach is highly
optimized to use vector CPU instructions (e.g., AVX2, AVX512) and also can be
parallelized
across many cores within a machine and also across many machines connected by
a network. A
person of ordinary skill will recognize that modifications and variations of
this approach can be
implemented for the purpose of identifying off-target genomic regions.
[0179] In some embodiments, probes having sequence homology with off-target
genomic
regions, or DNA molecules corresponding to, or derived from off-target genomic
regions
comprising more than a threshold number are excluded (or filtered) from the
panel. For example,
probes having sequence homology with off-target genomic regions, or DNA
molecules
corresponding to, or derived from off-target genomic regions from more than
30, more than 25,
more than 20, more than 18, more than 15, more than 12, more than 10, or more
than 5 off-target
regions are excluded.
[0180] In some embodiments, probes are divided into 2, 3, 4, 5, 6, or more
separate groups
depending on the numbers of off-target regions. For example, probes having
sequence homology
46
CA 03127894 2021-07-26
WO 2020/163403 PCT/US2020/016673
with no off-target regions or DNA molecules corresponding to, or derived from
off-target
regions are assigned to high-quality group, probes having sequence homology
with 1-18 off-
target regions or DNA molecules corresponding to, or derived from 1-18 off-
target regions, are
assigned to low-quality group, and probes having sequence homology with more
than 19 off-
target regions or DNA molecules corresponding to, or derived from 19 off-
target regions, are
assigned to poor-quality group. Other cut-off values can be used for the
grouping.
[0181] In some embodiments, probes in the lowest quality group are excluded.
In some
embodiments, probes in groups other than the highest-quality group are
excluded. In some
embodiments, separate panels are made for the probes in each group. In some
embodiments, all
the probes are put on the same panel, but separate analysis is performed based
on the assigned
groups.
[0182] In some embodiments, a panel comprises a larger number of high-quality
probes than the
number of probes in lower groups. In some embodiments, a panel comprises a
smaller number of
poor-quality probes than the number of probes in other group. In some
embodiments, more than
95%, 90%, 85%, 80%, 75%, or 70% of probes in a panel are high-quality probes.
In some
embodiments, less than 35%, 30%, 20%, 10%, 5%, 4%, 3%, 2% or 1% of the probes
in a panel
are low-quality probes. In some embodiments, less than 5%, 4%, 3%, 2% or 1% of
the probes in
a panel are poor-quality probes. In some embodiments, no poor-quality probes
are included in a
panel.
[0183] In some embodiments, probes having below 50%, below 40%, below 30%,
below 20%,
below 10% or below 5% are excluded. In some embodiments, probes having above
30%, above
40%, above 50%, above 60%, above 70%, above 80%, or above 90% are selectively
included in
a panel.
Methods of using HD assay panel
In yet another aspect, methods of using an HD assay panel are provided. The
methods can
comprise steps of treating DNA molecules or fragments to convert unmethylated
cytosines to
uracils (e.g., using bisulfite treatment), applying an HD panel (as described
herein) to the
converted DNA molecules or fragments, enriching a subset of converted DNA
molecules or
fragments that hybridize (or bind) to the probes in the panel, and detecting
the nucleic acid
sequence and determining the methylation status thereof, for example, by
sequencing the
enriched cfDNA fragments. In some embodiments, the sequence reads can be
compared to a
reference genome (e.g., a human reference genome), allowing for identification
of methylation
states at a plurality of CpG sites within the DNA molecules or fragments and
thus provide
information relevant to detecting a hematological disorder (HD). While the
present disclosure
47
CA 03127894 2021-07-26
WO 2020/163403 PCT/US2020/016673
pays particular attention to sequencing based approaches for detecting nucleic
acids and
determining methylation status thereof (via sequence reads), the disclosure is
broad enough to
encompass other methods for detecting nucleic acids and determining
methylation status thereof
(such as other methylation-aware sequencing approaches (e.g., as described in
WO 2014/043763,
which is incorporated herein by reference), DNA microarrays (e.g., with
labeled probes adhered
or conjugated to a solid surface or DNA array chip), etc.
Analysis of sequence reads
[0184] In some embodiments, the sequence reads may be aligned to a reference
genome using
known methods in the art to determine alignment position information. The
alignment position
information may indicate a beginning position and an end position of a region
in the reference
genome that corresponds to a beginning nucleotide base and end nucleotide base
of a given
sequence read. Alignment position information may also include sequence read
length, which
can be determined from the beginning position and end position. A region in
the reference
genome may be associated with a gene or a segment of a gene.
[0185] In various embodiments, a sequence read is comprised of a read pair
denoted as R1 and
R2. For example, the first read R1 may be sequenced from a first end of a
nucleic acid fragment
whereas the second read R2 may be sequenced from the second end of the nucleic
acid fragment.
Therefore, nucleotide base pairs of the first read R1 and second read R2 may
be aligned
consistently (e.g., in opposite orientations) with nucleotide bases of the
reference genome.
Alignment position information derived from the read pair R1 and R2 may
include a beginning
position in the reference genome that corresponds to an end of a first read
(e.g., R1) and an end
position in the reference genome that corresponds to an end of a second read
(e.g., R2). In other
words, the beginning position and end position in the reference genome
represent the likely
location within the reference genome to which the nucleic acid fragment
corresponds. An output
file having SAM (sequence alignment map) format or BAM (binary alignment map)
format may
be generated and output for further analysis.
[0186] From the sequence reads, the location and methylation state for each of
CpG site may be
determined based on alignment to a reference genome. Further, a methylation
state vector for
each fragment may be generated specifying a location of the fragment in the
reference genome
(e.g., as specified by the position of the first CpG site in each fragment, or
another similar
metric), a number of CpG sites in the fragment, and the methylation state of
each CpG site in the
fragment whether methylated (e.g., denoted as M), unmethylated (e.g., denoted
as U), or
indeterminate (e.g., denoted as I). The methylation state vectors may be
stored in temporary or
persistent computer memory for later use and processing. Further, duplicate
reads or duplicate
48
CA 03127894 2021-07-26
WO 2020/163403 PCT/US2020/016673
methylation state vectors from a single subject may be removed. In an
additional embodiment, it
may be determined that a certain fragment has one or more CpG sites that have
an indeterminate
methylation status. Such fragments may be excluded from later processing or
selectively
included where downstream data model accounts for such indeterminate
methylation statuses.
[0187] FIG. 7B is an illustration of the process 100 of FIG. 7A of sequencing
a cfDNA
fragment to obtain a methylation state vector, according to an embodiment. As
an example, the
analytics system takes a cfDNA fragment 112. In this example, the cfDNA
fragment 112
contains three CpG sites. As shown, the first and third CpG sites of the cfDNA
fragment 112 are
methylated 114. During the treatment step 120, the cfDNA fragment 112 is
converted to generate
a converted cfDNA fragment 122. During the treatment 120, the second CpG site
which was
unmethylated has its cytosine converted to uracil. However, the first and
third CpG sites are not
convert.
[0188] After conversion, a sequencing library 130 is prepared and sequenced
140 generating a
sequence read 142. The analytics system aligns 150 the sequence read 142 to a
reference genome
144. The reference genome 144 provides the context as to what position in a
human genome the
fragment cfDNA originates from. In this simplified example, the analytics
system aligns 150 the
sequence read such that the three CpG sites correlate to CpG sites 23, 24, and
25 (arbitrary
reference identifiers used for convenience of description). The analytics
system thus generates
information both on methylation status of all CpG sites on the cfDNA fragment
112 and which
to position in the human genome the CpG sites map. As shown, the CpG sites on
sequence read
142 which were methylated are read as cytosines. In this example, the
cytosine's appear in the
sequence read 142 only in the first and third CpG site which allows one to
infer that the first and
third CpG sites in the original cfDNA fragment were methylated. The second CpG
site is read as
a thymine (U is converted to T during the sequencing process), and thus, one
can infer that the
second CpG site was unmethylated in the original cfDNA fragment. With these
two pieces of
information, the methylation status and location, the analytics system
generates 160 a
methylation state vector 152 for the fragment cfDNA 112. In this example, the
resulting
methylation state vector 152 is <M23, U24, M25 >, wherein M corresponds to a
methylated CpG
site, U corresponds to an unmethylated CpG site, and the subscript numbers
correspond to
positions of each CpG site in the reference genome.
Detection of HD
[0189] Sequence reads obtained by the methods provided herein are further
processed by
automated algorithms. For example, the analytics system is used to receive
sequencing data from
a sequencer and perform various aspects of processing as described herein. The
analytics system
49
CA 03127894 2021-07-26
WO 2020/163403 PCT/US2020/016673
can be one of a personal computer (PC), a desktop computer, a laptop computer,
a notebook, a
tablet PC, a mobile device. A computing device can be communicatively coupled
to the
sequencer through a wireless, wired, or a combination of wireless and wired
communication
technologies. Generally, the computing device is configured with a processor
and memory
storing computer instructions that, when executed by the processor, cause the
processor to
perform steps as described in the remainder of this document. Generally, the
amount of genetic
data and data derived therefrom is sufficiently large, and the amount of
computational power
required so great, so as to be impossible to be performed on paper or by the
human mind alone.
[0190] The clinical interpretation of methylation status of targeted genomic
regions is a process
that includes classifying the clinical effect of each or a combination of the
methylation status and
reporting the results in ways that are meaningful to a medical professional.
The clinical
interpretation can be based on comparison of the sequence reads with database
specific to HD or
non-HD subjects, and/or based on numbers and types of the cfDNA fragments
having HD-
specific methylation patterns identified from a sample.
[0191] In some embodiments, targeted genomic regions are ranked or classified
based on their
likeness to be differentially methylated in HD samples, and the ranks or
classifications are used
in the interpretation process. The ranks and classifications can include (1)
the type of clinical
effect, (2) the strength of evidence of the effect, and (3) the size of the
effect. Various methods
for clinical analysis and interpretation of genome data can be adopted for
analysis of the
sequence reads. In some other embodiments, the clinical interpretation of the
methylation states
of such differentially methylated regions can be based on machine learning
approaches that
interpret a current sample based on a classification or regression method that
was trained using
the methylation states of such differentially methylated regions from samples
from HD and non-
HD patients with known HD status, HD type, HD stage, etc.
[0192] The clinically meaning information can include the presence or absence
of HD generally,
presence or absence of certain types of HDs, HD stage, or presence or absence
of other types of
diseases. In some embodiments, the information relates to a presence or
absence of one or more
hematological disorders, selected from the group consisting of CHIP, leukemia,
lymphoid
neoplasms (e.g. lymphoma), multiple myeloma, and myeloid neoplasm. In some
embodiments,
the information relates to a presence or absence of one or more hematological
disorders, selected
from the group consisting of lymphoid neoplasm, multiple myeloma, and myeloid
neoplasm. In
some embodiments, the samples are not cancerous and are from subjects having
white blood cell
clonal expansion or no hematological disorder.
CA 03127894 2021-07-26
WO 2020/163403 PCT/US2020/016673
HD classifier
[0193] To train an HD type classifier, the analytics system obtains a
plurality of training samples
each having a set of hypomethylated and hypermethylated fragments indicative
of HD, e.g.,
identified via step 450 in the process 400, and a label of the training
sample's HD type. The
analytics system determines, for each training sample, a feature vector based
on the set of
hypomethylated and hypermethylated fragments indicative of HD. The analytics
system
calculates an anomaly score for each CpG site in the targeted genomic regions.
In one
embodiment, the analytics system defines the anomaly score for the feature
vector as a binary
scoring based on whether there is a hypomethylated or hypermethylated fragment
from the set
that encompasses the CpG site. Once all anomaly scores are determined for a
training sample,
the analytics system determines the feature vector as a vector of elements
including, for each
element, one of the anomaly scores associated with one of the CpG sites. The
analytics system
may normalize the anomaly scores of the feature vector based on a coverage of
the sample, i.e., a
median or average sequencing depth over all CpG sites.
[0194] With the feature vectors of the training samples, the analytics system
can train the HD
classifier. In one embodiment, the analytics system trains a binary HD
classifier to distinguish
between the labels, HD and non-HD, based on the feature vectors of the
training samples. In this
embodiment, the classifier outputs a prediction score indicating the
likelihood of the presence or
absence of HD. In another embodiment, the analytics system trains a multiclass
HD classifier to
distinguish between many HD types. In this multiclass HD classifier
embodiment, the HD
classifier is trained to determine an HD prediction that comprises a
prediction value for each of
the HD types being classified for. The prediction values may correspond to a
likelihood that a
given sample has each of the HD types. For example, the HD classifier returns
an HD prediction
including a prediction value for CHIP, leukemia, lymphoid neoplasms (e.g.
lymphoma), multiple
myeloma, myeloid neoplasm, or any combination thereof For example, the HD
classifier may
return an HD prediction for a test sample including a prediction score for
CHIP, leukemia,
lymphoid neoplasms (e.g. lymphoma), multiple myeloma, myeloid neoplasm, or any
combination thereof. In either embodiment, the analytics system trains the HD
classifier by
inputting sets of training samples with their feature vectors into the HD
classifier and adjusting
classification parameters so that a function of the classifier accurately
relates the training feature
vectors to their corresponding label. The analytics system may group the
training samples into
sets of one or more training samples for iterative batch training of the HD
classifier. After
inputting all sets of training samples including their training feature
vectors and adjusting the
classification parameters, the HD classifier is sufficiently trained to label
test samples according
51
CA 03127894 2021-07-26
WO 2020/163403 PCT/US2020/016673
to their feature vector within some margin of error. The analytics system may
train the HD
classifier according to any one of a number of methods. As an example, the
binary HD classifier
may be a L2-regularized logistic regression classifier that is trained using a
log-loss function. As
another example, the multi-HD classifier may be a multinomial logistic
regression. In practice
either type of HD classifier may be trained using other techniques. These
techniques are
numerous including potential use of kernel methods, machine learning
algorithms such as
multilayer neural networks, etc. In particular, methods as described in
PCT/US2019/022122 and
U.S. Patent. App. No. 16/352,602 which are incorporated by reference in their
entireties herein
can be used for various embodiments.
[0195] During deployment, the analytics system obtains a test sample from a
subject of unknown
HD type. The analytics system processes the test sample to achieve a set of
hypomethylated and
hypermethylated fragments indicative of HD. The analytics system defines a
test feature vector
in a similar process as described for the training samples. The analytics
system then inputs the
test feature vector into the trained HD classifier to yield an HD prediction,
e.g., binary prediction
(HD or non-HD) or multiclass HD prediction (prediction score for each of a
plurality of HD
types).
Hematological disorder classifier
[0196] In some examples, the assay panel described herein can be used with a
hematological
disorder classifier that predicts a disease state for a sample, such as a
hematological disorder or
non-hematological disorder prediction, and/or an indeterminate prediction. In
some examples,
the hematological disorder classifier can generate features based on sequence
reads by taking
into account methylated or unmethylated fragments of DNA at certain genomic
areas of interest.
For instance, if the hematological disorder classifier determines that a
methylation pattern at a
fragment resembles that of a certain hematological disorder, then the
hematological disorder
classifier can set a feature for that fragment as 1, and otherwise if no such
fragment is present,
then the feature can be set as 0. In this way, the hematological disorder
classifier can produce a
set of binary features (merely by way of example, 30,000 features) for each
sample. Further, in
some examples, all or a portion of the set of binary features for a sample can
be input into the
hematological disorder classifier to provide a set of probability scores, such
as one probability
score per hematological disorder class and for a non-hematological disorder
class. Furthermore,
in some examples, the hematological disorder classifier can incorporate or
otherwise be used in
conjunction with thresholding to determine whether a sample is to be called as
hematological
disorder or non-hematological disorder, and/or indeterminate thresholding to
reflect confidence
in a specific hematological disorder call. Such methods are described further
below.
52
CA 03127894 2021-07-26
WO 2020/163403 PCT/US2020/016673
[0197] To train the hematological disorder classifier, the analytics system
(e.g., analytics system
800) can obtain a set of training samples. In some examples, each training
sample includes
fragment file(s) (e.g., file containing sequence read data), a label
corresponding to a type of
hematological disorder or non-hematological disorder status of the sample,
and/or sex of the
individual of the sample. The analytics system can utilize the training set to
train the
hematological disorder classifier to predict the disease state of the sample.
[0198] In some examples, for training, the analytics system divides the genome
(e.g., whole
genome) or a subset of the genome (e.g., targeted methylation regions) into
regions. Merely by
way of example, portions of the genome can be separated into "blocks" of CpGs,
whereby a new
block begins whenever there is a separation between nearest-neighbor CpGs is
at least a
minimum separation distance (e.g., at least 500 bp). Further, in some
examples, each block can
be divided into 1000 bp regions and positioned such that neighboring regions
have a certain
amount (e.g., 50% or 500 bp) of overlap.
[0199] Furthermore, in some examples, the analytics system can split the
training set into K
subsets or folds to be used in a K-fold cross-validation. In some examples,
the folds can be
balanced for hematological disorder /non-hematological disorder status, cancer
stage, age (e.g.,
grouped in 10yr buckets), and/or smoking status. In some examples, the
training set is split into 5
folds, whereby 5 separate classifiers are trained, in each case training on
4/5 of the training
samples and using the remaining 1/5 for validation.
[0200] During training with the training set, the analytics system can, for
each hematological
disorder (and for healthy cfDNA), fit a probabilistic model to the fragments
deriving from the
samples of that type. As used herein a "probabilistic model" is any
mathematical model capable
of assigning a probability to a sequence read based on methylation status at
one or more sites on
the read. During training, the analytics system fits sequence reads derived
from one or more
samples from subjects having a known disease and can be used to determine
sequence reads
probabilities indicative of a disease state utilizing methylation information
or methylation state
vectors. In particular, in some cases, the analytics system determines
observed rates of
methylation for each CpG site within a sequence read. The rate of methylation
represents a
fraction or percentage of base pairs that are methylated within a CpG site.
The trained
probabilistic model can be parameterized by products of the rates of
methylation. In general, any
known probabilistic model for assigning probabilities to sequence reads from a
sample can be
used. For example, the probabilistic model can be a binomial model, in which
every site (e.g.,
CpG site) on a nucleic acid fragment is assigned a probability of methylation,
or an independent
sites model, in which each CpG's methylation is specified by a distinct
methylation probability
53
CA 03127894 2021-07-26
WO 2020/163403 PCT/US2020/016673
with methylation at one site assumed to be independent of methylation at one
or more other sites
on the nucleic acid fragment.
[0201] In some examples, the probabilistic model is a Markov model, in which
the probability of
methylation at each CpG site is dependent on the methylation state at some
number of preceding
CpG sites in the sequence read, or nucleic acid molecule from which the
sequence read is
derived. See, e.g., U.S. Pat. Appl. No. 16/352,602, entitled "Anomalous
Fragment Detection and
Classification," and filed March 13, 2019, which is incorporated by reference
in its entirety
herein and can be used for various embodiments.
[0202] In some examples, the probabilistic model is a "mixture model" fitted
using a mixture of
components from underlying models. For example, in some embodiments, the
mixture
components can be determined using multiple independent sites models, where
methylation (e.g.,
rates of methylation) at each CpG site is assumed to be independent of
methylation at other CpG
sites. Utilizing an independent sites model, the probability assigned to a
sequence read, or the
nucleic acid molecule from which it derives, is the product of the methylation
probability at each
CpG site where the sequence read is methylated and one minus the methylation
probability at
each CpG site where the sequence read is unmethylated. In accordance with this
example, the
analytics system determines rates of methylation of each of the mixture
components. The
mixture model is parameterized by a sum of the mixture components each
associated with a
product of the rates of methylation. A probabilistic model Pr of n mixture
components can be
represented as:
Pr(fragmentitigki, fk}) =
fk n fi(1 -
k=1
For an input fragment, mi E {0, 11 represents the fragment's observed
methylation status at
position i of a reference genome, with 0 indicating unmethylation and 1
indicating methylation.
A fractional assignment to each mixture component k is fk, where fk 0 and
Eri=i fk = 1.
The probability of methylation at position i in a CpG site of mixture
component k is flki. Thus,
the probability of unmethylation is 1 ¨ igki. The number of mixture components
n can be 1, 2, 3,
4, 5, 6, 7, 8, 9, 10, etc.
[0203] In some examples, the analytics system fits the probabilistic model
using maximum-
likelihood estimation to identify a set of parameters {flki, fk} that
maximizes the log-likelihood
of all fragments deriving from a disease state, subject to a regularization
penalty applied to each
methylation probability with regularization strength r. The maximized quantity
for N total
fragments can be represented as:
54
CA 03127894 2021-07-26
WO 2020/163403 PCT/US2020/016673
1in (Pr (fragmentjl{flki, fk})) + r = In (flki(1 ¨ flki))
[0204] In some examples, the analytics system performs fits separately for
each hematological
disorder and for healthy cfDNA. As one of skill in the art would appreciate,
other means can be
used to fit the probabilistic models or to identify parameters that maximize
the log-likelihood of
all sequence reads derived from the reference samples. For example, in some
examples,
Bayesian fitting (using e.g., Markov chain Monte Carlo), in which each
parameter is not
assigned a single value but instead is associated to a distribution, is used.
In some examples,
gradient-based optimization, in which the gradient of the likelihood (or log-
likelihood) with
respect to the parameter values is used to step through parameter space
towards an optimum, is
used. In still some examples, expectation-maximization, in which a set of
latent parameters
(such as identities of the mixture component from which each fragment is
derived) are set to
their expected values under the previous model parameters, and then the
model's parameters are
assigned to maximize the likelihood conditional on the assumed values of those
latent variables.
The two-step process is then repeated until convergence.
[0205] Further, in some examples, the analytics system can generate features
for each sample in
the training set. For example, for each sample (regardless of label), in each
region, for each
hematological disorder, for each fragment, the analytics system can evaluate
the log-likelihood
ratio R with the fitted probabilistic models according to:
Pr (fragmentlhematological disorder A)
Rhematological disorder A (fragment) E In _______________________________
Pr (fragmentlhealthy cf DNA)
Next, for each sample, for each region, for each hematological disorder, for
each of a set of "tier"
values, the analytics system can count the number of fragments with
Rhematolgoical disorde> tier and
assign those counts as non-negative integer-valued features. For example, the
tiers include
threshold values of 1, 2, 3, 4, 5, 6, 7, 8, and 9, resulting in each region
hosting 9 features per
hematological disorder.
[0206] In some examples, the analytics system can select certain features for
inclusion in a
feature vector for each sample. For example, for each pair of distinct
hematological disorder, the
analytics system can specify one type as the "positive type" and the other as
the "negative type"
and rank the features by their ability to distinguish those types. In some
cases, the ranking is
based on mutual information calculated by the analytics system. For example,
the mutual
information can be calculated using the estimated fraction of samples of the
positive type and
negative type (e.g., hematological disorders A and B) for which the feature is
expected to be
nonzero in a resulting assay. For instance, if a feature occurs frequently in
healthy cfDNA, the
CA 03127894 2021-07-26
WO 2020/163403
PCT/US2020/016673
analytics system determines the feature is unlikely to occur frequently in
cfDNA associated with
various types of hematological disorder. Consequently, the feature can be a
weak measure in
distinguishing between disease states. In calculating mutual information I,
the variable Xis a
certain feature (e.g., binary) and variable Y represents a disease state,
e.g., hematological
disorders A or B:
/(X; Y) = p(x, y) log log ( 13(x'Y)
p(x)p(y))
yEY xEX
1 p(1IA) p(11B)
/ ===' ¨ p(11A) = log(1 ________________ + p(11B) = log __________
2
7 (p(1IA) + p(11B))
(p(11A)p(11B))))
p(1 IA) = fA fA
The joint probability mass function ofX and Y is p(x,y) and the marginal
probability mass
functions are p(x) and p(y). The analytics system can assume that feature
absence is
uninformative and either disease state is equally likely a priori, for
example, p(Y = A) =
p(Y = B) = 0.5. The
probability of observing (e.g., in cfDNA) a given binary feature of
hematological disorder A is
represented by p(1 IA), where fA is the probability of observing the feature
in ctDNA samples
from tumor (or high-signal cfDNA samples) associated with hematological
disorder A, and fH is
the probability of observing the feature in a healthy or non-hematological
disorder cfDNA
sample.
[0207] In some examples, only features corresponding to the positive type are
included in the
ranking, and only when those features' predicted rate of occurrence is greater
in the positive type
than in the negative type. For example, if "liver" is the positive type and
"breast" is the negative
type, then only "liver x" features are considered, and only if their estimated
occurrence in liver
cfDNA is greater than their estimated occurrence in breast cfDNA. Further, in
some examples,
for each region, for each hematological disorder pair (including non-
hematological disorder as a
negative type), the analytics system keeps only the best performing tier.
Further, in some
examples, the analytics system transforms feature values by binarization,
whereby any feature
value greater than 0 is set to 1, such that all features are either 0 or 1.
[0208] In some examples, the analytics system trains a multinomial logistic
regression classifier
on the training data for a fold, and generates predictions for the held-out
data. For example, for
each of the K folds, one logistic regression can be trained for each
combination of
hyperparameters. Such hyperparameters can include L2 penalty and/or topK
(e.g., the number of
high-ranking regions to keep per tissue type pair (including non-hematological
disorder), as
56
CA 03127894 2021-07-26
WO 2020/163403 PCT/US2020/016673
ranked by the mutual information procedure outlined above). For each set of
hyperparameters,
performance is evaluated on the cross-validated predictions of the full
training set, and the set of
hyperparameters with the best performance is selected for retraining on the
full training set. In
some examples, the analytics system uses log-loss as a performance metric,
whereby the log-loss
is calculated by taking the negative logarithm of the prediction for the
correct label for each
sample, and then summing over samples (i.e. a perfect prediction of 1.0 for
the correct label
would give a log-loss of 0).
[0209] To generate predictions for a new sample, feature values are calculated
using the same
method described above, but restricted to features (region/positive class
combinations) selected
under the chosen topK value. Generated features are then used to create a
prediction using the
logistic regression model trained above.
[0210] In some examples, the analytics trains a two-stage classifier. For
example, the analytics
system trains a binary hematological disorder classifier to distinguish
between the labels,
hematological disorder and non-hematological disorder, based on the feature
vectors of the
training samples. In this case, the binary classifier outputs a prediction
score indicating the
likelihood of the presence or absence of hematological disorder. In another
example, the
analytics system trains a multiclass hematological disorder classifier to
distinguish between
many hematological disorders. In this multiclass hematological disorder
classifier, the
hematological disorder classifier is trained to determine a hematological
disorder prediction that
comprises a prediction value for each of the hematological disorders being
classified for. The
prediction values can correspond to a likelihood that a given sample has each
of the
hematological disorders. For example, the hematological disorder classifier
returns a
hematological disorder prediction including a prediction value for CHIP,
leukemia, lymphoid
neoplasms (e.g., lymphoma), multiple myeloma, a myeloid neoplasm, and non-
hematological
disorder. For example, the hematological disorder classifier may return a
hematological disorder
prediction for a test sample including a prediction score for CHIP, leukemia,
lymphoid
neoplasms (e.g., lymphoma), multiple myeloma, a myeloid neoplasm, and/or non-
hematological
disorder.
[0211] The analytics system can train the hematological disorder classifier
according to any one
of a number of methods. As an example, the binary hematological disorder
classifier may be a
L2-regularized logistic regression classifier that is trained using a log-loss
function. As another
example, the multi- hematological disorder classifier may be a multinomial
logistic regression.
In practice either type of hematological disorder classifier may be trained
using other techniques.
These techniques are numerous including potential use of kernel methods,
machine learning
57
CA 03127894 2021-07-26
WO 2020/163403 PCT/US2020/016673
algorithms such as multilayer neural networks, etc. In particular, methods as
described in
PCT/US2019/022122 and U.S. Patent. App. No. 16/352,602 which are incorporated
by reference
in their entireties herein can be used for various embodiments.
Exemplary sequencer and analytics system
[0212] FIG. 9A is a flowchart of systems and devices for sequencing nucleic
acid samples
according to one embodiment. This illustrative flowchart includes devices such
as a sequencer
820 and an analytics system 800. The sequencer 820 and the analytics system
800 may work in
tandem to perform one or more steps in the processes described herein.
[0213] In various embodiments, the sequencer 820 receives an enriched nucleic
acid sample 810.
As shown in FIG. 9A, the sequencer 820 can include a graphical user interface
825 that enables
user interactions with particular tasks (e.g., initiate sequencing or
terminate sequencing) as well
as one more loading stations 830 for loading a sequencing cartridge including
the enriched
fragment samples and/or for loading necessary buffers for performing the
sequencing assays.
Therefore, once a user of the sequencer 820 has provided the necessary
reagents and sequencing
cartridge to the loading station 830 of the sequencer 820, the user can
initiate sequencing by
interacting with the graphical user interface 825 of the sequencer 820. Once
initiated, the
sequencer 820 performs the sequencing and outputs the sequence reads of the
enriched fragments
from the nucleic acid sample 810.
[0214] In some embodiments, the sequencer 820 is communicatively coupled with
the analytics
system 800. The analytics system 800 includes some number of computing devices
used for
processing the sequence reads for various applications such as assessing
methylation status at
one or more CpG sites, variant calling or quality control. The sequencer 820
may provide the
sequence reads in a BAM file format to the analytics system 800. The analytics
system 800 can
be communicatively coupled to the sequencer 820 through a wireless, wired, or
a combination of
wireless and wired communication technologies. Generally, the analytics system
800 is
configured with a processor and non-transitory computer-readable storage
medium storing
computer instructions that, when executed by the processor, cause the
processor to process the
sequence reads or to perform one or more steps of any of the methods or
processes disclosed
herein.
[0215] In some embodiments, the sequence reads may be aligned to a reference
genome using
known methods in the art to determine alignment position information.
Alignment position may
generally describe a beginning position and an end position of a region in the
reference genome
that corresponds to a beginning nucleotide based and an end nucleotide base of
a given sequence
read. Corresponding to methylation sequencing, the alignment position
information may be
58
CA 03127894 2021-07-26
WO 2020/163403 PCT/US2020/016673
generalized to indicate a first CpG site and a last CpG site included in the
sequence read
according to the alignment to the reference genome. The alignment position
information may
further indicate methylation statuses and locations of all CpG sites in a
given sequence read. A
region in the reference genome may be associated with a gene or a segment of a
gene; as such,
the analytics system 800 may label a sequence read with one or more genes that
align to the
sequence read. In one embodiment, fragment length (or size) is determined from
the beginning
and end positions.
[0216] In various embodiments, for example when a paired-end sequencing
process is used, a
sequence read is comprised of a read pair denoted as R_1 and R_2. For example,
the first read
R 1 may be sequenced from a first end of a double-stranded DNA (dsDNA)
molecule whereas
the second read R_2 may be sequenced from the second end of the double-
stranded DNA
(dsDNA). Therefore, nucleotide base pairs of the first read R 1 and second
read R_2 may be
aligned consistently (e.g., in opposite orientations) with nucleotide bases of
the reference
genome. Alignment position information derived from the read pair R 1 and R_2
may include a
beginning position in the reference genome that corresponds to an end of a
first read (e.g., R 1)
and an end position in the reference genome that corresponds to an end of a
second read (e.g.,
R_2). In other words, the beginning position and end position in the reference
genome represent
the likely location within the reference genome to which the nucleic acid
fragment corresponds.
In one embodiment, the read pair R 1 and R_2 can be assembled into a fragment,
and the
fragment used for subsequent analysis and/or classification. An output file
having SAM
(sequence alignment map) format or BAM (binary) format may be generated and
output for
further analysis.
[0217] Referring now to FIG. 9B, FIG. 9B is a block diagram of an analytics
system 800 for
processing DNA samples according to one embodiment. The analytics system
implements one or
more computing devices for use in analyzing DNA samples. The analytics system
800 includes a
sequence processor 840, sequence database 845, model database 855, models 850,
parameter
database 865, and score engine 860. In some embodiments, the analytics system
800 performs
one or more steps in the processes 300 of FIG. 3A, 340 of FIG. 3B, 400 of FIG.
4, 500 of FIG.
5, 600 of FIG. 6A, or 680 of FIG. 6B and other process described herein.
[0218] The sequence processor 840 generates methylation state vectors for
fragments from a
sample. At each CpG site on a fragment, the sequence processor 840 generates a
methylation
state vector for each fragment specifying a location of the fragment in the
reference genome, a
number of CpG sites in the fragment, and the methylation state of each CpG
site in the fragment
whether methylated, unmethylated, or indeterminate via the process 300 of FIG.
3A. The
59
CA 03127894 2021-07-26
WO 2020/163403 PCT/US2020/016673
sequence processor 840 may store methylation state vectors for fragments in
the sequence
database 845. Data in the sequence database 845 may be organized such that the
methylation
state vectors from a sample are associated to one another.
[0219] Further, multiple different models 850 may be stored in the model
database 855 or
retrieved for use with test samples. In one example, a model is a trained
hematological disorder
classifier for determining a hematological disorder prediction for a test
sample using a feature
vector derived from anomalous fragments. The training and use of the
hematological disorder
classifier is discussed elsewhere herein. The analytics system 800 may train
the one or more
models 850 and store various trained parameters in the parameter database 865.
The analytics
system 800 stores the models 850 along with functions in the model database
855.
[0220] During inference, the score engine 860 uses the one or more models 850
to return
outputs. The score engine 860 accesses the models 850 in the model database
855 along with
trained parameters from the parameter database 865. According to each model,
the score engine
receives an appropriate input for the model and calculates an output based on
the received input,
the parameters, and a function of each model relating the input and the
output. In some use cases,
the score engine 860 further calculates metrics correlating to a confidence in
the calculated
outputs from the model. In other use cases, the score engine 860 calculates
other intermediary
values for use in the model.
EXAMPLES
[0221] The following examples are put forth so as to provide those of ordinary
skill in the art
with a complete disclosure and description of how to make and use the present
description, and
are not intended to limit the scope of what the inventors regard as their
description nor are they
intended to represent that the experiments below are all or the only
experiments performed.
Efforts have been made to ensure accuracy with respect to numbers used (e.g.,
amounts,
temperature, etc.) but some experimental errors and deviations should be
accounted for.
EXAMPLE 1 ¨ Analysis of probe qualities
[0222] To test how much overlap between a cfDNA fragment and a probe is
required to achieve
a non-negligible amount of pulldown, various lengths of overlaps were tested
using panels
designed to include three different types of probes (V1D3, V1D4, V1E2) having
various
overlaps with 175bp target DNA fragments specific to each probe. Tested
overlaps ranged
between Obp and 120bp. Samples comprising 175bp target DNA fragments were
applied to the
panel and washed, and then DNA fragments bound to the probes were collected.
The amounts of
the collected DNA fragments were measured and the amounts were plotted as
densities over the
sizes of overlaps as provided in FIG. 8.
CA 03127894 2021-07-26
WO 2020/163403 PCT/US2020/016673
[0223] There was no significant binding and pull down of target DNA fragments
when there
were less than 45 bp of overlaps. These results suggest that a fragment-probe
overlap of at least
45bp is generally required to achieve a non-negligible amount of pulldown
although this number
can vary depending on the assay conditions.
[0224] Furthermore, it has been suggested that more than a 10% mismatch rate
between the
probe and fragment sequences in the region of overlap is sufficient to greatly
disrupt binding,
and thus pulldown efficiency. Therefore, sequences that can align to the probe
along at least
45bp with at least a 90% match rate are candidates for off-target pulldown.
[0225] Thus, we have performed an exhaustive searching of all genomic regions
having 45bp
alignments with 90%+ match rate (i.e., off-target regions) for each probe.
Specifically, we
combined a k-mer seeding strategy (which can allow one or more mismatches)
with local
alignment at the seed locations. This guaranteed not missing any good
alignments based on k-
mer length, number of mismatches allowed, and number of k-mer seed hits at a
particular
location. This involves performing dynamic programing local alignment at a
large number of
locations, so the implementation was optimized to use vector CPU instructions
(e.g., AVX2,
AVX512) and parallelized across many cores within a machine and also across
many machines
connected by a network. This allows exhaustive search which is valuable in
designing a high-
performance panel (i.e., low off-target rate and high target coverage for a
given amount of
sequencing).
[0226] Following the exhaustive searching, each probe was scored based on the
number of off-
target regions. The best probes have a score of 1, meaning they match in only
one place (high Q).
Probes with a low score between 2-19 hits (low Q) were accepted but probes
with a poor score
more than 20 hits (poor Q) were discarded. Other cutoff values can be used for
specific samples.
[0227] Numbers of high quality, low quality, and poor quality probes were then
counted among
probes targeting hypermethylated genomic regions or hypomethylated genomic
regions.
EXAMPLE 2 ¨ An assay panel for detecting hematological disorders
[0228] Hematological disorders: A HD panel was designed to detect different
types of
hematological disorders including CHIP, leukemia, multiple myeloma, and
lymphoma.
[0229] Samples used for genomic region selection: Sample from different
sources were used
for selection of target genomic regions. They include (1) cell-enriched
disseminated tumor cells
(DTC) from cancers of different types, (2) bone marrow mononuclear cell (PBMC)
samples
from patients with leukemia, lymphoma, or multiple myeloma, (3) peripheral
blood mononuclear
cell (PBMC) samples from patients with leukemia, lymphoma, or multiple
myeloma, (4)
61
CA 03127894 2021-07-26
WO 2020/163403 PCT/US2020/016673
genomic DNA from FFPE tissue blocks of cancer samples, or (5) genomic DNA from
white
blood cells, or (7) cfDNA samples from more than 1800 individuals.
[0230] Region selection (based on methylation status): For target selection,
fragments having
abnormal methylation patterns in samples with various hematological disorders
were selected as
using one or more method as described herein. Us of these methods allowed
identification of low
noise regions as putative targets. Among the low noise regions, fragments most
informative in
discriminating disease types were ranked and selected.
[0231] Specifically, in some embodiments, when WGBS data were used, fragment
sequences in
the database were filtered based on p-value using a distribution in healthy
control individuals,
and only fragments with p <0.001 were retained, as described herein. In some
cases, the selected
cfDNAs were further filtered to retain only those that were at least 90%
methylated or 90%
unmethylated. Next, for each CpG site in the selected fragments, the numbers
of samples with a
hematological disorder or healthy control samples were counted that include
fragments
overlapping that CpG site. Specifically, P (hematological disorder l
overlapping fragment) for
each CpG was calculated and genomic sites with high P values were selected as
general disorder
targets. By design, the selected fragments had very low noise (i.e., few
healthy control fragments
overlapping).
[0232] To find targets specific to a hematological disorder, similar selection
processes were
performed. CpG sites were ranked based on their information gain, comparing
(i) between the
numbers of samples of a specific hematological disorder and other samples,
wherein other
samples including both healthy control samples and samples of a different
hematological
disorder, (ii) between the numbers of samples of a specific hematological
disorder and healthy,
control samples, and/or (iii) between the numbers of samples of a specific
hematological
disorder and a different hematological disorder that include fragments
overlapping that CpG site.
The process was applied to each of the hematological disorders and the
comparison was done for
all pairwise combinations for the hematological disorders as illustrated in
FIG. 2. For example, P
(a hematological disorder loverlapping fragment) was calculated and then
compared with P (a
different hematological disorder overlapping fragment). An outlier fragment in
each
hematological disorder having much greater likelihood under a hematological
disorder than
under a different hematological disorder was selected as a target for the
hematological disorder.
Accordingly, genomic regions selected by the pairwise comparisons included
genomic regions
differentially methylated to separate a target hematological disorder and a
contrast hematological
disorder.
62
CA 03127894 2021-07-26
WO 2020/163403 PCT/US2020/016673
[0233] Target genomic regions selected as described in this section are listed
in TABLE 1. The
target genomic regions of Lists 2-4 contain subsets of the methylation sites
of the target genomic
regions of Lists 5-7, respectively. Likewise, the target genomic regions of
List 8 contain a subset
of the methylation sites of the target genomic regions of List 1.
TABLE 1 ¨ SEQ ID NOs corresponding to Lists 1-8. For each list, the table
identifies the total
number of target genomic regions in the list, a range of SEQ ID NOs
corresponding to all target
genomic regions in the list to be found in the sequence listing submitted with
this application,
and the total of the lengths of all target genomic regions in the list. The
sequence listing
identifies the chromosomal location of each target genomic region, whether the
cfDNA
fragments to be enriched from the region are hypermethylated or
hypomethylated, and the
sequence of one DNA strand of the target genomic region. The chromosome
numbers and the
start and stop positions are provided relative to a known human reference
genome, hg19. The
sequence of the human reference genome, hg19, is available from Genome
Reference
Consortium with a reference number, GRCh37/hg19, and also available from
Genome Browser
provided by Santa Cruz Genomics Institute.
Targeted Target SEQ ID NOs Panel
Hematological Genomic Size (kb)
List disorder Regions First Last
1 All 28130 1 28130 1586
2 Lymphoid neoplasm 1447 28131 29577 403
3 Multiple myeloma 879 29578 30456 277
4 Myeloid neoplasm 1255 30457 31711 299
Lymphoid neoplasm 1170 31712 32881 612
6 Multiple myeloma 822 32882 33703 315
7 Myeloid neoplasm 1177 33704 34880 447
8 All 22456 34881 57336 1160
EXAMPLE 3 ¨ Generation of a mixture model classifier
[0234] To maximize performance, the predictive cancer models described in this
Example were
trained using sequence data obtained from a plurality of samples from known
cancer types and
non-cancers from both CCGA sub-studies (CCGA1 and CCGA22), a plurality of
tissue samples
for known cancers obtained from CCGA1, and a plurality of non-cancer samples
from the
STRIVE study (See Clinical Trail.gov Identifier: NCT03085888
(//clinicaltrials.govict2/show/NCT03085888)). The STRIVE study is a
prospective, multi-center,
observational cohort study to validate an assay for the early detection of
breast cancer and other
invasive cancers, from which additional non-cancer training samples were
obtained to train the
classifier described herein. The known cancer types included from the CCGA
sample set
included the following: breast, lung, prostate, colorectal, renal, uterine,
pancreas, esophageal,
63
CA 03127894 2021-07-26
WO 2020/163403 PCT/US2020/016673
lymphoma, head and neck, ovarian, hepatobiliary, melanoma, cervical, multiple
myeloma,
leukemia, thyroid, bladder, gastric, and anorectal. As such, a model can be a
multi-cancer model
(or a multi-cancer classifier) for detecting one or more, two or more, three
or more, four or more,
five or more, ten or more, or 20 or more different types of cancer.
[0235] The classifier performance data shown below was reported out for a
locked classifier
trained on cancer and non-cancer samples obtained from CCGA2, a CCGA sub-
study, and on
non-cancer samples from STRIVE. The individuals in the CCGA2 sub-study were
different from
the individuals in the CCGA1 sub-study whose cfDNA was used to select target
genomes. From
the CCGA2 study, blood samples were collected from individuals diagnosed with
untreated
cancer (including 20 tumor types and all stages of cancer) and healthy
individuals with no cancer
diagnosis (controls). For STRIVE, blood samples were collected from women
within 28 days of
their screening mammogram. Cell-free DNA (cfDNA) was extracted from each
sample and
treated with bisulfite to convert unmethylated cytosines to uracils. The
bisulfite treated cfDNA
was enriched for informative cfDNA molecules using hybridization probes
designed to enrich
bisulfite-converted nucleic acids derived from each of a plurality of targeted
genomic regions in
an assay panel comprising all of the genomic regions of Lists 1-8. The
enriched bisulfite-
converted nucleic acid molecules were sequenced using paired-end sequencing on
an Illumina
platform (San Diego, CA) to obtain a set of sequence reads for each of the
training samples, and
the resulting read pairs were aligned to the reference genome, assembled into
fragments, and
methylated and unmethylated CpG sites identified.
Mixture model based featurization
[0236] For each cancer type (including non-cancer) a probabilistic mixture
model was trained
and utilized to assign a probability to each fragment from each cancer and non-
cancer sample
based on how likely it was that the fragment would be observed in a given
sample type.
Fragment-level Analysis
[0237] Briefly, for each sample type (cancer and non-cancer samples), for each
region (where
each region was used as-is if less than 1 kb, or else subdivided into 1 kb
regions in length with a
50% overlap (e.g., 500 base pairs overlap) between adjacent regions), a
probabilistic model was
fit to the fragments derived from the training samples for each type of cancer
and non-cancer.
The probabilistic model trained for each sample type was a mixture model,
where each of three
mixture components was an independent-sites model in which methylation at each
CpG is
assumed to be independent of methylation at other CpGs. Fragments were
excluded from the
model if: they had a p-value (from a non-cancer Markov model) greater than
0.01; were marked
as duplicate fragments; the fragments had a bag size of greater than 1 (for
targeted methylation
64
CA 03127894 2021-07-26
WO 2020/163403 PCT/US2020/016673
samples only); they did not cover at least one CpG site; or if the fragment
was greater than 1000
bases in length. Retained training fragments were assigned to a region if they
overlapped at least
one CpG from that region. If a fragment overlapped CpGs in multiple regions,
it was assigned to
all of them.
Local Source Models
[0238] Each probabilistic model was fit using maximum-likelihood estimation to
identify a set
of parameters that maximized the log-likelihood of all fragments deriving from
each sample
type, subject to a regularization penalty.
[0239] Specifically, in each classification region, a set of probabilistic
models were trained, one
for each training label (i.e., one for each cancer type and one for non-
cancer). Each model took
the form of a Bernoulli mixture model with three components. Mathematically,
(1) Pr (fragment0 ki, f k)) = EL1=1 fk ni fizi(i- 1301-mi
where n is the number of mixture components, set to 3; mi E {0, 1} is the
fragment's observed
methylation at position i; fk is the fractional assignment to component k
(withfk > 0 and EA= 1);
and flki is the methylation fraction in component k at CpG i. The product over
i included only
those positions for which a methylation state could be identified from the
sequencing.
Maximum-likelihood values of the parameters }fk, fiki} of each model were
estimated by using
the rprop algorithm (e.g., the rprop algorithm as described in Riedmiller M,
Braun H. RPROP -
A Fast Adaptive Learning Algorithm. Proceedings of the International Symposium
on Computer
and Information Science VII, 1992) to maximize the total log-likelihood of the
fragments of one
training label, subject to a regularization penalty on flki that took the form
of a beta-distributed
prior. Mathematically, the maximized quantity was
(2) E in (Pr (fragment] Iff3ki, fkl)) + ki r In (131,1(1 ¨
where r is the regularization strength, which was set to 1.
Featurization
[0240] Once the probabilistic models were trained, a set of numerical features
was computed for
each sample. Specifically, features were extracted for each fragment from each
training sample,
for each cancer type and non-cancer sample, in each region. The extracted
features were the
tallies of outlier fragments (i.e., anomalously methylated fragments), which
were defined as
those whose log-likelihood under a first cancer model exceeded the log-
likelihood under a
second cancer model or non-cancer model by at least a threshold tier value.
Outlier fragments
were tallied separately for each genomic region, sample model (i.e., cancer
type), and tier (for
tiers 1, 2, 3, 4, 5, 6, 7, 8, and 9), yielding 9 features per region for each
sample type. In this way,
CA 03127894 2021-07-26
WO 2020/163403 PCT/US2020/016673
each feature was defined by three properties: a genomic region; a "positive"
cancer type label
(excluding non-cancer); and the tier value selected from the set {1, 2, 3, 4,
5, 6, 7, 8, 9}. The
numerical value of each feature was defined as the number of fragments in that
region such that
(3) in (Pr(fragmentlpositive cancer type))
> tier
Pr(fragmentInon¨cancer)
where the probabilities were defined by equation (1) using the maximum-
likelihood-estimated
parameter values corresponding to the "positive" cancer type (in the numerator
of the logarithm)
or to non-cancer (in the denominator).
Feature ranking
[0241] For each set of pairwise features, the features were ranked using
mutual information
based on their ability to distinguish the first cancer type (which defined the
log-likelihood model
from which the feature was derived) from the second cancer type or non-cancer.
Specifically,
two ranked lists of features were compiled for each unique pair of class
labels: one with the first
label assigned as the "positive" and the second as the "negative", and the
other with the
positive/negative assignment swapped (with the exception of the "non-cancer"
label, which was
only permitted as the negative label). For each of these ranked lists, only
features whose positive
cancer type label (as in equation (3)) matched the positive label under
consideration were
included in the ranking. For each such feature, the fraction of training
samples with non-zero
feature value was calculated separately for the positive and negative labels.
Features for which
this fraction was greater in the positive label were ranked by their mutual
information with
respect to that pair of class labels.
[0242] The top ranked 256 features from each pairwise comparison were
identified and added to
the final feature set for each cancer type and non-cancer. To avoid
redundancy, if more than one
feature was selected from the same positive type and genomic region (i.e., for
multiple negative
types), only the one assigned the lowest (most informative) rank for its
cancer type pair was
retained, breaking ties by choosing the higher tier value. The features in the
final feature set for
each sample (cancer type and non-cancer) were binarized (any feature value
greater than 0 was
set to 1, so that all features were either 0 or 1).
Classifier training
[0243] The training samples were then divided into distinct 5-fold cross-
validation training sets,
and a two-stage classifier was trained for each fold, in each case training on
4/5 of the training
samples and using the remaining 1/5 for validation.
[0244] In the first stage of training, a binary (two-class) logistic
regression model for detecting
the presence of cancer was trained to discriminate the cancer samples
(regardless of TOO) from
66
CA 03127894 2021-07-26
WO 2020/163403 PCT/US2020/016673
non-cancer. When training this binary classifier, a sample weight was assigned
to the male non-
cancer samples to counteract sex-imbalance in the training set. For each
sample, the binary
classifier outputs a prediction score indicating the likelihood of a presence
or absence of cancer.
[0245] In the second stage of training, a parallel multi-class logistic
regression model for
determining cancer tissue of origin was trained with TOO as the target label.
Only the cancer
samples that received a score above the 95th percentile of the non-cancer
samples in the first
stage classifier were included in the training of this multi-class classifier.
For each cancer sample
used in training the multi-class classifier, the multi-class classifier
outputs prediction values for
the cancer types being classified, where each prediction value is a likelihood
that the given
sample has a certain cancer type. For example, the cancer classifier can
return a cancer
prediction for a test sample including a prediction score for breast cancer, a
prediction score for
lung cancer, and/or a prediction score for no cancer.
[0246] Both binary and multi-class classifiers were trained by stochastic
gradient descent with
mini-batches, and in each case, training was stopped early when the
performance on the
validation fold (assessed by cross-entropy loss) began to degrade. For
predicting on samples
outside of the training set, in each stage, the scores assigned by the five
cross-validated
classifiers were averaged. Scores assigned to sex-inappropriate cancer types
were set to zero,
with the remaining values renormalized to sum to one.
[0247] Scores assigned to the validation folds within the training set were
retained for use in
assigning cutoff values (thresholds) to target certain performance metrics. In
particular, the
probability scores assigned to the training set non-cancer samples were used
to define thresholds
corresponding to particular specificity levels. For example, for a desired
specificity target of
99.4%, the threshold was set at the 99.4th percentile of the cross-validated
cancer detection
probability scores assigned to the non-cancer samples in the training set.
Training samples with a
probability score that exceeded a threshold were called as positive for
cancer.
[0248] Subsequently, for each training sample determined to be positive for
cancer, a TOO or
cancer type assessment was made from the multiclass classifier. First, the
multi-class logistic
regression classifier assigned a set of probability scores, one for each
prospective cancer type, to
each sample. Next, the confidence of these scores was assessed as the
difference between the
highest and second-highest scores assigned by the multi-class classifier for
each sample. Then,
the cross-validated training set scores were used to identify the lowest
threshold value such that
of the cancer samples in the training set with top-two score differential
exceeding the threshold,
90% had been assigned the correct TOO label as their highest score. In this
way, the scores
67
CA 03127894 2021-07-26
WO 2020/163403 PCT/US2020/016673
assigned to the validation folds during training were further used to
determine a second threshold
for distinguishing between confident and indeterminate TOO calls.
[0249] At prediction time, samples receiving a score from the binary (first-
stage) classifier
below the predefined specificity threshold were assigned a "non-cancer" label.
For the remaining
samples, those whose top-two TOO-score differential from the second-stage
classifier was below
the second predefined threshold were assigned the "indeterminate cancer"
label. The remaining
samples were assigned the cancer label to which the TOO classifier assigned
the highest score.
EXAMPLE 4 ¨ Classification with the target genomic regions of Lists 2-4
[0250] The discriminatory value of the target genomic regions of Lists 2-4 was
evaluated by
testing the ability of a cancer classifier to detect 3 different hematological
disorders according to
the methylation status of these target genomic regions. Performance was
evaluated over a set of
1,532 cancer samples and 1,521 non-cancer samples that were not used to train
the classifier, as
shown in TABLE 2. For each sample, differentially methylated cfDNA was
enriched using a
bait set comprising all of the target genomic regions of Lists 1-8. The
classifier was then
constrained to provide cancer determinations based only on the methylation
status of the target
genomic regions of the List being evaluated.
TABLE 2
Cancer diagnoses of individuals whose cfDNA was used to validate the
classifier
Cancer Type Total Stage
I II III IV Not
Reported
Non-cancer 1521 -
Lung 261 60 23 72 106 0
Breast 247 102 110 27 8 0
Prostate 188 39 113 19 17 0
Lymphoid neoplasm 147 15 27 27 39 39
Colorectal 121 13 22 41 45 0
Pancreas and gallbladder 95 15 15 19 46 0
Uterine 84 73 3 5 3 0
Upper GI 67 9 12 19 27 0
Head and neck 62 7 13 16 26 0
Renal 56 37 4 4 11 0
Ovary 37 4 2 25 6 0
Multiple myeloma 34 10 13 11 0 0
Not reported 29 8 5 7 6 3
Liver bile duct 29 5 7 7 10 0
Sarcoma 17 2 4 5 6 0
Bladder and urothelial 16 6 7 3 1 0
Anorectal 14 4 5 5 0 0
Cervical 11 8 1 2 0 0
Melanoma 7 3 1 0 3 0
68
CA 03127894 2021-07-26
WO 2020/163403 PCT/US2020/016673
Myeloid neoplasm 4 2 1 0 1 0
Thyroid 4 0 0 0 0 4
Prediction only 2 0 0 0 2 0
[0251] Results from the classifier performance analysis for Lists 2-4 are
presented in TABLES
2-3. TABLE 2 shows the accuracy of determining a hematological disorder by a
classifier
considering the methylation status of the target genomic regions of Lists 2, 3
or 4. TABLE 3
shows the sensitivity with a specificity of 0.990 for detecting different
stages of the three
hematological disorders by a classifier that utilizes only the methylation
markers of the
corresponding List.
TABLE 3
Hematological disorder classification accuracy using the genomic regions of
Lists 2-4
List 2 List 3 List 4
(Lymphoid Neoplasm) (Multiple Myeloma) (Myeloid Neoplasm)
Fxn Fxn Fxn
Lymphoid Neoplasm 88 93/106 95 54/57 94
87/93
Multiple Myeloma 100 9/9 89 25/28 100
21/21
Myeloid Neoplasm n/a 0/0 n/a 0/0 100 2/2
TABLE 4
Hematological disorder classification sensitivity using the genomic regions of
Lists 2-4
Stage Lymphoid Neoplasm Multiple Myeloma Myeloid Neoplasm
(List 2) (List 3) (List 4)
33.3% [11.8-61.6] (5/15) 70% [34.8-93.3] (7/10) n.d.
II 92.6% [75.7-99.1] (25/27) 84.6% [54.6-98.1] (11/13) n.d.
III 74.1% [53.7-88.9] (20/27) 100% [71.5-100] (11/11) n.d.
IV 82.1% [66.5-92.5] (32/39) 100% [71.5-100] (11/11) n.d.
All 71.4% [63.4-78.6] (105/147) 85.3% [68.9-95]
(29/34) 75% [19.4-99.4] (3/4)
EXAMPLE 5 ¨ Classification with the target genomic regions of Lists 2-4 and 8
[0252] Results from the classifier performance analysis for List 8 and
additional results for Lists
2-4 and 8 are presented in TABLES 5-8. An exemplary receiver operator curve
(ROC) generated
by a trained classifier is shown in FIG. 10. The ROC shows true positive
results and false
positive results for a determination of cancer or no-cancer based on the
methylation status of a
randomly selected 50% subset of the target genomic regions of List 8. The
asymmetric shape of
the ROC curve illustrates that the classifier was designed to minimize false
positive results. The
areas under the curve are tightly clustered between 0.76 and 0.79, as shown in
TABLE 5. These
results indicate that a cancer determination can be made based solely on the
methylation status of
target genomic regions selected for the discrimination of hematological
disorders or even
69
CA 03127894 2021-07-26
WO 2020/163403 PCT/US2020/016673
individual hematological disorders. Furthermore, the performance of small
panels of <500 kb
indicates that panels of this size are sufficient for accurate cancer
detection.
TABLE 5
Cancer detection and cancer type determination using data for lists of target
genomic
regions optimized for the detection of hematological disorders.
Genomic Regions AUC True False False
Positive Positive Negative
List 2 0.76 103 12 1
List 3 0.76 79 6 0
List 4 0.78 110 6 0
Random 25% of List 8 0.78 101 7 0
Random 50% of List 8 0.79 106 6 0
[0253] Once a determination of cancer is made, the classifier assigns the
cancer to one of twenty
distinct cancer types. The accuracy of these determinations with a specificity
of 0.990 is
presented in various formats. TABLE 5 shows true positives, false positives,
and false negatives
as scored based on the methylation status of lists of target genomic regions
optimized for the
detection of specific hematological disorders or random subsets of a list
optimized for the
detection of all hematological disorders. A true positive occurs when the
presence of cancer is
detected and the classifier accurately determines that the sample came from a
subject with a
hematological disorder. A false positive occurs for samples from individuals
diagnosed with a
solid tumor when presence of cancer is detected and inaccurately determined to
be a
hematological disorder. A false negative occurs when the sample came from an
individual
diagnosed with a hematological disorder but the classifier inaccurately
determines that the
sample came from an individual with a solid tumor. False negatives were very
rare for Lists 2-4
and 8. Approximately 5-10% of the samples were false negatives. This might
occur because
Lists 2-4 and 8 do not include some markers that would aid in accurately
determining that a
cancer was a solid tumor.
[0254] The accuracy of cancer detection based upon the methylation status of
target genomic
regions in Lists 2-4 and 8 is evaluated for various stages of cancer in TABLE
6. When cancer is
detected, a cancer type is assigned from one of twenty possible classes of
cancer types. The
accuracy of cancer type determination is presented in TABLE 7. The cancer type
determination
results are for the accuracy of determining all twenty cancer types, even
though the lists of target
genomic regions were optimized to detect a hematological disorders.
[0255] The results in TABLES 6-7 are segregated for various stages of cancer.
Cancer detection
and cancer type determination were more accurate for samples from individuals
diagnosed with
CA 03127894 2021-07-26
WO 2020/163403 PCT/US2020/016673
later stages of cancer. This was expected because late stage tumors shed more
cfDNA.
Nevertheless, the accuracy of detecting cancer and assigning a cancer type for
early stage
cancers is remarkably high. Furthermore, classification accuracy was
reasonable accurate with
only 50% or even 25% of the target genomic regions of List 8 (all
hematological disorders).
[0256] The sensitivity at a specificity of 0.990 for detecting stages I ¨ IV
hematological
disorders by a classifier acting on the methylation status of target genomic
regions in Lists 2-4 or
random subsets of List 8 is presented in TABLE 8. For example, when the false
positive rate for
detecting cancer is limited to 1%, a classifier considering the methylation
status of the target
genomic regions of List 3 (optimized for multiple myeloma), detected multiple
myeloma in 70%
(7 out of 10) of the samples collected from individuals diagnosed with stage I
multiple myeloma.
Likewise, when the false positive rate for detecting cancer is limited to 1%,
a classifier
considering the methylation status of the target genomic regions of List 2
(optimized for
lymphoid neoplasm), detected lymphoid neoplasm in 93% (25 out of 27) of the
samples
collected from individuals diagnosed with stage II lymphoid neoplasm.
Furthermore, the
sensitivity for HD based upon the methylation status of random 50% and 25%
subsets of the
target genomic regions of List 8 were essentially identical (with the
exception of stage I
lymphoid neoplasm), indicating that a substantial fraction of the target
genomic regions of List 8
contribute to accurate HD determinations by the classifier.
71
TABLE 6
Cancer detection accuracy with 99.0% specificity by a classifier considering
the methylation status of target genomic regions from the 0
indicated List.
t..)
o
t..)
o
List 2 List 3 List 4 Random 25%
Random 50% ,..,
o
(...)
(Lymphoid (Multiple (Myeloid of List 8
of List 8 .6.
o
Neoplasm) Myeloma) Neoplasm)
(All HD) (All HD) (...)
Stage % Fxn % Fxn % Fxn % Fxn % Fxn
All
39 603/1532 36 551/1532 43 663/1532 41 622/1532 43 655/1532
I 7 30/422 8 34/422 11 45/422 8 35/422
9 39/422
II
28 107/388 25 98/388 31 119/388 27 105/388 29 111/388
III
53 167/313 51 159/313 60 188/313 58 182/313 60 187/313
I+II
17 137/810 16 132/810 20 164/810 17 140/810 19 150/810
I+II+III 27 304/1123 26 291/1123 31 352/1123 29 322/1123 30 337/1123 P
III+IV 65 442/676 61 409/676 71 477/676 68 460/676 71 481/676
,
,
.,..1 IV
76 275/363 69 250/363 80 289/363 77 278/363 81 294/363
.
,
TABLE 7
,
,
Accuracy of cancer type determinations with 99.0% specificity by a classifier
considering the methylation status of target genomic regions rõ
from the indicated list.
List 2 List 3 List 4
Random 25% Random 50%
(Lymphoid (Multiple (Myeloid of List 8 of List 8
Neoplasm) Myeloma) Neoplasm) (All HD)
(All HD)
Stage % Fxn % Fxn % Fxn % Fxn % Fxn
All
90 427/477 90 322/358 90 496/553 89 420/470 90 495/551 1-d
n
I 74 14/19 74 14/19 75 21/28 71
10/14 82 18/22
II 88 73/83 92 60/65 91 90/99 89
69/78 90 81/90 cp
t..)
III
89 113/127 90 96/107 88 137/155 89 122/137 89 140/157 o
t..)
o
I+II
85 87/102 88 74/84 87 111/127 86 79/92 88 99/112 O-
,-,
I+II+III 87 200/229 89 170/191 88 248/282 88 201/229 89 239/269 o
o
-4
III+IV 90 319/354 90 245/271 90 366/407 90 321/358 90 374/417 (...)
IV
91 206/227 91 149/164 91 229/252 90 199/221 90 234/260
TABLE 8
Sensitivity with 99.0% specificity for the indicated hematological disorder by
a classifier using only target genomic regions from the
0
indicated list.
t..)
o
t..)
Hematological Stage List 2 List 3 List 4
Random 25% Random 50%
,..,
Disorder (Lymphoid (Multiple (Myeloid
of List 8 of List 8 o
(...)
.6.
Neoplasm) Myeloma) Neoplasm)
(All HD (All HD)
(...)
% Fxn % Fxn % Fxn % Fxn % Fxn
All 38 13/34 85 29/34 68 23/34
56 19/34 56 19/34
Multiple I 10 1/10 70 7/10 40 4/10
30 3/10 30 3/10
Myeloma II 23 3/13 85 11/13 62 8/13
39 5/13 39 5/13
III 82 9/11 100 11/11 100 11/11
100 11/11 100 11/11
I+II 17 4/23 78 18/23 52 12/23
35 8/23 35 8/23
I+II+III 38 13/34 85 29/34 68 23/34
56 19/34 56 19/34 P
All 71 105/147 46 67/147 65 96/147
61 89/147 65 96/147 o
,
Lymphoid I 33 5/15 13 2/15 33 5/15
13 2/15 27 4/15
.3
d Neoplasm II 93 25/27 52 14/27 78 21/27
67 18/27 67 18/27 .
"
III 74 20/27 74 20/27 74 20/27
70 19/27 70 19/27 .
"
,
,
I+II 71 30/42 38 16/42 62 26/42
48 20/42 52 22/42 .
,
,
"
I+II+III 73 50/69 52 36/69 67 46/69
57 39/69 59 41/69 .
III+IV 79 52/66 67 44/66 77 51/66
71 47/66 76 50/66
IV 82 32/39 62 24/39 80 31/39
72 28/39 80 31/39
Myeloid
Neoplasm All 0 0/4 75 3/4 75 3/4
0 0/4 0 0/4
1-d
n
1-i
cp
t..)
o
t..)
o
O-
,-,
o
o
-4
(...,
CA 03127894 2021-07-26
WO 2020/163403 PCT/US2020/016673
EXAMPLE 6 ¨ Detecting hematological disorders using assay panel
[0257] Blood samples are collected from a group of individuals previously
diagnosed with a
hematological disorder ("test group"), and other groups of individuals without
a hematological
disorder or diagnosed with a different type of hematological disorder ("other
group"). cfDNA
fragments are extracted from the blood samples and treated with bisulfite to
convert
unmethylated cytosines to uracils. The cancer assay panel described herein was
applied to the
bisulfite treated samples. Unbound cfDNA fragments are washed and cfDNA
fragments bound
to the probes are collected. The collected cfDNA fragments are amplified and
sequenced. The
sequence reads confirm that the probes specifically enrich cfDNA fragments
having methylation
patterns indicative of a hematological disorder and samples from the test
group include
significantly more of the differentially methylated cfDNA fragments compared
to the other
group.
[0258] While preferred embodiments of the present disclosure have been shown
and described
herein, it will be obvious to those skilled in the art that such embodiments
are provided by way
of example only. Numerous variations, changes, and substitutions will now
occur to those skilled
in the art without departing from the disclosure. It should be understood that
various alternatives
to the embodiments of the disclosure described herein may be employed in
practicing the
disclosure. It is intended that the following claims define the scope of the
disclosure and that
methods and structures within the scope of these claims and their equivalents
be covered thereby.
74