Note: Descriptions are shown in the official language in which they were submitted.
CA 03128751 2021-08-02
WO 2020/160548 PCT/US2020/016423
1
SYSTEMS AND METHODS FOR MEASURING BEEHIVE STRENGTH
RELATED APPLICATION
[0001] This application is a nonprovisional patent application, which claims
the priority
benefit of U.S. Provisional Application No. 62/800,276, filed February 1,
2019, the contents of
which are incorporated by reference herein in their entirety.
BACKGROUND OF THE DISCLOSED EMBODIMENTS
[0002] Honeybee populations have been in decline since the 1980s, and the term
"Colony Collapse Disorder," was coined in 2007 to describe the troubling state
of the bees.
Beekeepers in the past could rely on 10-15% hive losses (i.e., bee mortality
rates) each year,
which was perceived as a sustainable loss percentage. Today, beekeepers are
experiencing an
average hive loss rate of 30% each year, with hive loss rates reaching nearly
50% in some
regions, which has resulted in a fairly significant decrease in honey
production over the last
couple of decades. Diverse beekeeping beliefs (i.e., decision-making
regarding hive
management) have contributed to the hive loss rates, typically with little to
no actual data being
used to support hive management practices.
[0003] Additionally, beekeepers generally do not keep an accurate accounting
of the
information associated with their apiaries (e.g., the condition of the hives,
bee counts,
environment conditions, losses, etc.). Further, current research on honeybees
relies on self-
selection citizen science, and is limited to the qualitative information
supplied by beekeepers,
which, as noted, can be largely inaccurate. In this field, there is a general
lack of quantitative
data on the ecology and production efficiency of apiaries and the bees/hives
contained therein.
Therefore, there is a need for improved technologies for monitoring and
analyzing data of
beehives in an apiary.
CA 03128751 2021-08-02
WO 2020/160548 PCT/US2020/016423
2
SUMMARY OF THE DISCLOSED EMBODIMENTS
[0004] In one embodiment, a communications and control system and method for
monitoring information about a plurality of beehives is provided. In one
aspect of an
embodiment of such a system, information or data is measured or otherwise
observed, such as
using suitable sensors, regarding the bees, and/or the beehives, and/or the
environment around
the beehives, or other relevant data or information. Such information measured
may include one
or more of temperature(s) at different points on or in the hive, gas (such as
oxygen, carbon
monoxide, and/or carbon dioxide gases) or other material or toxin levels,
infrared or other
wavelength information, weight and/or mass, activity level, decibel or other
noise level
measures, humidity levels, pressure, activity such as may be measure by
movement or another
visual measure, GPS or similar data regarding physical location, altitude,
orientation or relative
orientation, and other information or data as would occur to one of ordinary
skill in the art
regarding the beehive, bees, their activity, health, stress or other beehive
effects.
[0005] In one embodiment, the sensors sense and transmit or store the data or
information. Information may be stored at the beehive for later use,
processing, or collection.
The data or information may be collected through a variety of methods using a
variety of systems
and components well known in the art, such as automated or manual collection,
pushing the
information using a transmitter located at the beehive. Such data or
information may be
processed at the beehive or may be processed using devices or systems as
disclosed in this
disclosure or as would be known to one of ordinary skill in the art. The
information may be
processed at one or more of at the beehive, at another beehive that is in the
same apiary or is
separate from the beehive, and using other devices or systems remote from the
beehives.
[0006] Other information and data can also be manually gathered or input,
accessed,
observed or collected relating to environmental conditions at or near each
beehive and/or group
CA 03128751 2021-08-02
WO 2020/160548 PCT/US2020/016423
3
of beehives. Such information may include the information described above,
and/or other
information such as wind speed and/or direction, precipitation type and
amount, crop information
(such as crop type and related data, plant location, plant density, crop yield
information whether
aggregate or by location in an orchard, field or plot), pesticide, fertilizer,
and/or irrigation type,
quantity and rate information, planting and harvest information, and other
agricultural
information. Such information and other data may be collected or accessed
through other
systems (such as farm implements and separate agricultural monitoring systems
on the farm or
orchard, or from other available databases or measurement/monitoring systems).
[0007] In one embodiment, the system and method may be configured to perform
calculations and analyses. Calculations and analyses may be manual, automated,
and may be
performed using manually developed functions, predetermined or stablished
functions, or
machine learning. Such calculations and analyses may include for example
recommended
density or relative location of beehives placed for pollination in an orchard
or in a field or plot,
effectiveness or net yield change in a given crop, pesticide and/or fertilizer
usage as a function of
hive health, activity or other beehive information,
[0008] In one embodiment, the system and method may be configured to generate
and/or
communicate reports. Such reports may include graphs, charts, lists, and other
displays known to
those of ordinary skill in the art. Such reports may include data, analyzed
data, results of
calculations and other derived information from the data and information
gathered or accessed as
described herein.
[0009] In one embodiment, the system and method may be configured to generate
and
communicate suggestions, recommendations, or instructions such as physical
movement of one
or more beehives to a new and/or particular location in an apiary or group of
beehives placed for
pollination or relative to a portion of crops, replacement of a beehive,
collection of honey in a
CA 03128751 2021-08-02
WO 2020/160548 PCT/US2020/016423
4
beehive, replacement of a queen, inspection, repair, or maintenance of hive
structural or sensor
or other components as disclosed herein, and other actions to be taken whether
automatically or
manually by a famer, worker or beekeeper, and whether directly or remotely.
These suggestions
may be based on observed data and information gathered or may be based on
analyses or
calculations of such data.
[0010] In one embodiment, the system and method may be configured to generate
and
communicate actions. Such actions can be communicated by or within parts of
the system,
including those disclosed herein or as would be understood by one of ordinary
skill in the art,
and may illustratively include such actions that adjust a physical
characteristic of a beehive such
as changing beehive orientation, activating or positioning windscreens,
activating or positioning
sunscreens, opening ventilation equipment or doors, activating smoke, water,
food, nutrients,
medication, or other devices for providing a supply to the bees in or around
the beehive.
[0011] In one aspect, a method for monitoring and analyzing data of beehives
in an
apiary includes receiving, by a remote data analysis computing device, sensor
data from one of a
plurality of sensors associated with the apiary; analyzing, by the remote data
analysis computing
device, the received data; determining, by the remote data analysis computing
device, whether to
perform an action as a function of a result of the analysis; and performing,
by the remote data
analysis computing device and in response to a determination the action is to
be performed, the
action.
[0012] In some embodiments, analyzing the sensor data comprises to analyze the
data
using one or more machine learning algorithms. In other embodiments, analyzing
the sensor
data comprises to analyze the data using one or more regression analysis
methods. In still other
embodiments, the method further comprising aggregating, by the remote data
analysis computing
CA 03128751 2021-08-02
WO 2020/160548 PCT/US2020/016423
device, the received data with previously received sensor data from at least a
portion of the
plurality of sensors, wherein analyzing the received data includes analyzing
the aggregated data.
[0013] In some embodiments, the method further comprising comparing, by the
remote
data analysis computing device, the result of the analysis to one or more
threshold values,
wherein determining whether to perform the action as a function of the result
of the analysis
comprises determining whether to perform the action as a function of the
comparison. In some
embodiments, performing the action in response to a determination the action
is to be performed
comprises performing the action in response to a determination the result of
the analysis meets or
violates one or more threshold values. In other embodiments, performing the
action comprises
transmitting a message to a corresponding data monitoring application, wherein
the message
includes information related to the action that is usable to display to a user
of the corresponding
data monitoring application. In still other embodiments, performing the action
comprises
transmitting a command to an actuator of the apiary, wherein the command is
usable by the
actuator to adjust a physical characteristic of a beehive by positioning of a
mechanism attached
to the actuator. In yet other embodiments, performing the action comprises
transmitting an email
to an email address, wherein the email includes information related to the
action that is usable to
indicate to notify a user of the action. In still yet other embodiments,
performing the action
comprises transmitting a text message to a phone number, wherein the text
message includes
information related to the action that is usable to notify a user of the
action.
CA 03128751 2021-08-02
WO 2020/160548 PCT/US2020/016423
6
BRIEF DESCRIPTION OF THE DRAWINGS
[0014] The embodiments and other features, advantages and disclosures
contained
herein, and the manner of attaining them, will become apparent and the present
disclosure will be
better understood by reference to the following description of various
exemplary embodiments of
the present disclosure taken in conjunction with the accompanying drawings,
wherein:
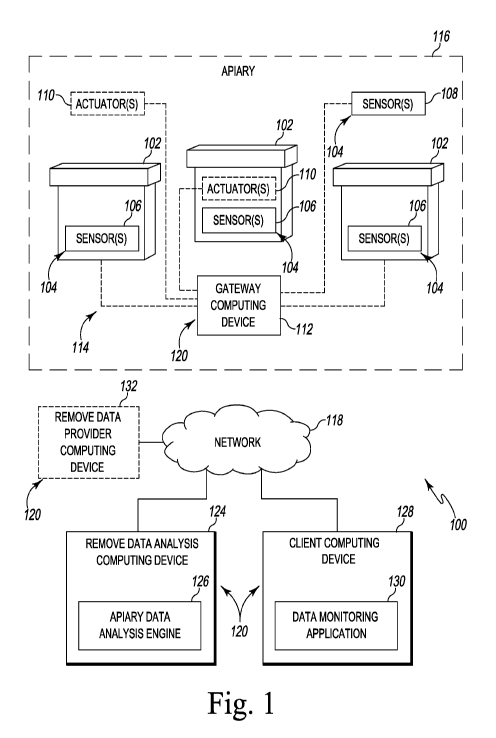
[0015] FIG. 1 is a schematic block diagram of a system for using sensor data
to monitor
beehives in an apiary that includes multiple sensors located within the apiary
which are
communicatively coupled to a remote data analysis computing device that is
communicatively
accessible by a client computing device;
[0016] FIG. 2 is a block diagram of an illustrative embodiment of the
computing devices
of the system of FIG. 1;
[0017] FIG. 3 is a block diagram of an illustrative embodiment of an
environment of the
client computing device of the system of FIG. 1;
[0018] FIG. 4 is a block diagram of an illustrative embodiment of an
environment of the
remote data analysis computing device of the system of FIG. 1; and
[0019] FIG. 5 is a schematic flow diagram of a method for monitoring and
analyzing
data of beehives in the apiary of the system of FIG. 1.
[0020] FIG. 6 is an illustrative user interface disclosed herein.
[0021] FIG. 7 is another illustrative user interface disclosed herein.
[0022] FIG. 8 is the user interface of FIG. 7 including a map.
[0023] FIG. 9 is a schematic flow diagram of a process to build a model
between sensor
data and hive population according to an embodiment.
[0024] FIG. 10 is a summary of the experimental results showing the change in
probe
temperatures within an apiary over time according to an embodiment.
CA 03128751 2021-08-02
WO 2020/160548 PCT/US2020/016423
7
[0025] FIG. 11 is a graphical representation of the solution to heat equations
based upon
distance from the heat source within an apiary according to an embodiment.
[0026] FIG. 12 schematically illustrates a system to automate the image
analysis and
report generation processes in an embodiment.
[0027] FIG. 13 illustrates one embodiment of a report to display the data
generated from
the model in an embodiment.
[0028] FIG. 14 illustrates an embodiment of a web application to display the
data
generated from the model in an embodiment.
[0029] FIG. 15 shows several screen displays of a user-facing mobile
application in an
embodiment.
[0030] FIG. 16 shows several other screen displays of a user-facing mobile
application
in an embodiment.
CA 03128751 2021-08-02
WO 2020/160548 PCT/US2020/016423
8
DETAILED DESCRIPTION OF THE DISCLOSED EMBODIMENTS
[0031] For the purposes of promoting an understanding of the principles of the
present
disclosure, reference will now be made to the embodiments illustrated in the
drawings, and
specific language will be used to describe the same. It will nevertheless be
understood that no
limitation of the scope of this disclosure is thereby intended.
[0032] FIG. 1 illustrates a system 100 for monitoring an apiary 116, or "bee
yard," that
includes a number of beehives 102 using multiple sensors 104 located within
the apiary 116.
Although the term bee yard or apiary is used herein, it is understood that the
beehives in this
disclosure do not have to be of a single apiary or in any close proximity to
one or more other
beehives of the system or method, and that the term apiary is intended to
cover any number of
one or more beehives that are to be monitored and part of the system and
method described
herein.
[0033] As illustratively shown, each of the sensors 104 are communicatively
coupled to
one or more computing devices 120 either directly or over a network 118. The
illustrative
computing devices 120 include a gateway computing device 112, a remote data
analysis
computing device 124 (e.g., a cloud computing device), a client computing
device 128, and a
remote data provider computing device 132. It should be appreciated that
additional and/or
alternative computing devices 120 may be included in other embodiments.
[0034] The sensors 104 are configured to collect data of the environment in
which they
are deployed (e.g., internal or external to the beehives 102) and transmit
(e.g., via messages,
network packets, etc.) the collected data to the remote data analysis
computing device 124. To
do so, the sensors 104 are configured to transmit the collected data to the
gateway computing
device 112 over a wireless, cell, satellite, or other suitable network 114. In
turn, and the gateway
CA 03128751 2021-08-02
WO 2020/160548 PCT/US2020/016423
9
computing device 112 is configured to forward the collected data received from
the sensors 102
to the remote data analysis computing device 124 via the network 118.
[0035] As will be described in further detail below, the remote data analysis
computing
device 124 is configured to monitor the data collected by and received from
the sensors 104 to
determine whether a condition exists such that an action should be taken
(e.g., harvesting the
produced honey from one or more of the beehives 102, attaching one or more
supers to one or
more of the beehives 102, moving/placing/repairing/replacing one or more of
the beehives 102,
adjusting a feeding schedule, etc.). In an illustrative example, the remote
data analysis
computing device 124 may be configured to determine locational placement of
one or more of
the beehives 102 within the apiary 116 in an effort to maximize honey
production efficiency
and/or reduce bee mortality rates.
[0036] The beehives 102 may be embodied as any type of enclosed structure in
which a
colony of honey bees is intended to live within. The beehives 102 may be
configured as any
type of artificial beehive 102, typically based on regional locale, such as,
but not limited to, a
top-bar hive, Warre (European style) hive, Langstroth (stacked) hive, etc. It
should be
appreciated that the beehives 102 as described herein are intended to be used
such that honey
produced from the bees living therein may be extracted therefrom. It should be
further
appreciated that, in some embodiments, the apiary 116, and more particularly
the beehives 102
contained therein, may be intended to serve one or more additional and/or
alternative purposes,
such as the pollination of nearby crops, to provide safe-housing to mitigate
the effects of colony
collapse disorder, etc.
[0037] Each of the sensors 104 may be embodied as any combination of firmware,
software, hardware, and/or circuitry capable of performing the functions
described herein,
including detecting a present condition and/or events/changes in the
environment in which the
CA 03128751 2021-08-02
WO 2020/160548 PCT/US2020/016423
sensors 104 are deployed. The illustrative sensors 104 include beehive sensors
106 and
environment sensors 108. It should be appreciated that for the purposes of the
description
provided herein, the beehive sensors 106 include any type of sensor 104 usable
to detect a state
or condition of the beehive 102. In other words, beehive sensors 106 include
any types of
sensors 104 capable of measuring data (i.e., beehive data) related to a
respective beehive 102 to
which it is attached or in proximate location thereof. Examples of such
beehive data may
include a weight of the beehive 102, a temperature inside the beehive 102, an
activity level inside
the beehive 102, etc.
[0038] It should be further appreciated that for the purposes of the
description provided
herein, the environment sensors 108 include any type of sensor 104 usable to
detect a state or
condition of an environment condition the apiary 116. In other words, the
environment sensors
108 include any types of sensors 104 usable for measuring data (i.e.,
environment data) of the
apiary 116 in which the beehives 102 reside, or the immediately surrounding
area of the apiary
116. Examples of such environment data may include weather conditions (e.g.,
temperature,
wind, humidity, sunlight, shade, UV levels, etc.) of the apiary at a given
point in time and/or
over a particular window of time, a time of day (e.g., dawn, dusk, etc.),
detected motion/activity
(e.g., of beekeepers, bees, animals, etc.), etc.
[0039] In some embodiments, the system 100 may additionally include one or
more
actuators 110. The actuators 110 may be embodied as any combination of
firmware, software,
hardware, and/or circuitry capable of performing the functions described
herein, such as moving
or controlling a mechanism or component. As illustratively shown, one or more
of the actuators
110 may be located proximate to one of the beehives 102. In other words, in
some embodiments,
one or more of the actuators 110 may be affixed to a mechanism or component
internal to or
otherwise attached or operatively coupled to one of the beehives 102.
Additionally or
CA 03128751 2021-08-02
WO 2020/160548 PCT/US2020/016423
11
alternatively, as also illustratively shown, one or more of the actuators 110
may be affixed to a
mechanism or component located external to the beehives 102, in some
embodiments. In an
illustrative example, one of the actuators 110 may be configured to open a
valve to release a
variable amount of smoke from a smoker to which the respective actuator 110
has been affixed.
[0040] The computing devices 120 may be embodied as any combination of
firmware,
software, hardware, and/or circuitry capable of performing the functions
described herein.
Referring now to FIG. 2, an embodiment of an illustrative computing device 120
is shown. The
illustrative computing device 120 includes a CPU 200, an input/output (I/O)
controller 202, a
memory 204, a network communication circuitry 206, one or more I/O peripherals
208, and a
data storage device 210. In some embodiments, one or more of the illustrative
components may
be combined on a single system-on-a-chip (SoC) on a single integrated circuit
(IC). It should be
appreciated that alternative embodiments may include additional, fewer, and/or
alternative
components to those of the illustrative computing device 120, such as may be
found in a typical
computing device (e.g., a graphics processing unit (GPU), a power supply,
etc.). It should be
further appreciated that the components and capabilities of each of the
computing devices 120
may be based on the functionality of the respective computing devices as
described herein.
[0041] The CPU 200 may be embodied as any type of hardware or combination of
circuitry capable of processing data. Accordingly, the CPU 200 may include a
single processing
core (e.g., in a single-core processor architecture) or more than one
processing core (e.g., in a
multi-core processor architecture). Irrespective of the number of processing
cores, the CPU 200
is capable of reading and executing program instructions. In some embodiments,
the CPU 200
may include a cache memory (not shown). In such embodiments, the cache memory
may be
integrated directly with the CPU 200 or placed on a separate chip with a
separate interconnect to
the CPU 200. It should be appreciated that, in some embodiments, pipeline
logic may be used to
CA 03128751 2021-08-02
WO 2020/160548 PCT/US2020/016423
12
perform software and/or hardware operations (e.g., network traffic processing
operations), rather
than commands issued to/from the CPU 200.
[0042] The I/O controller 202, or I/O interface, may be embodied as any type
of
computer hardware or combination of circuitry capable of interfacing between
input/output
devices and the computing device 120. Illustratively, the I/0 controller 202
is configured to
receive input/output requests from the CPU 200, and send control signals to
the respective
input/output devices, thereby managing the data flow to/from the computing
device 120.
[0043] The memory 204 may be embodied as any type of computer hardware or
combination of circuitry capable of holding data and instructions for
processing. Such memory
204 may be referred to as main or primary memory. It should be appreciated
that, in some
embodiments, one or more components may have direct access to memory, such
that certain data
may be stored via direct memory access (DMA) independently of the CPU 200.
[0044] The network communication circuitry 206 may be embodied as any type of
computer hardware or combination of circuitry capable of managing network
interfacing
communications (e.g., messages, datagrams, packets, etc.) via wireless and/or
wired
communication modes. Accordingly, in some embodiments, the network
communication
circuitry 206 may include a network interface controller (NIC) capable of
being configured to
connect the computing device 120 to a computer network (e.g., the network
118).
[0045] The one or more I/O peripherals 208 may be embodied as any auxiliary
device
configured to connect to and communicate with the computing device 120. For
example, the I/O
peripherals 208 may include, but are not limited to, a touchpad, a keypad, a
keyboard, a
microphone, one or more buttons, a display (e.g., a liquid crystal diode (LED)
display), a
touchscreen, a speaker, one or more illuminating components (e.g., light
emitting diode(s)
(LEDs)), etc. Accordingly, it should be appreciated that some I/O peripherals
208 are capable of
CA 03128751 2021-08-02
WO 2020/160548 PCT/US2020/016423
13
facilitating only input or output functions, while others are capable of
performing both functions
(i.e., input and output).
[0046] The data storage device 210 may be embodied as any type of computer
hardware
capable of the non-volatile storage of data (e.g., semiconductor storage
media, magnetic storage
media, optical storage media, etc.). Such data storage devices 210 are
commonly referred to as
auxiliary or secondary storage, and are typically used to store a large amount
of data relative to
the memory 204 described above.
[0047] Referring back to FIG. 1, the gateway computing device 112 may be
embodied
as any type of network gateway device capable of forwarding network traffic
between networks
(e.g., the wireless network 114 and the network 118). It should be appreciated
that the type and
functional capacity of the gateway computing device 112 may be dependent on
the type of the
wireless network 114 in which the gateway computing device 112 is used. The
wireless network
114 may be embodied as any type of network architecture/topology capable of
performing the
functions described herein. For example, in some embodiments, the wireless
network 114 may
be configured as a star network, in which the gateway computing device 112
serves as a central
hub (see, e.g., the illustrative wireless network 114 of FIG. 1). In other
words, in the star
network configuration, each of the sensors 104 are linked to the gateway
computing device 112
only, not to one or more of the other sensors 104.
[0048] In an alternative embodiment, the wireless network 114 may be
configured as a
mesh network, such as a wireless sensor network, in which each of the sensors
104 include
repeater/routing capabilities. Accordingly, in the mesh network configuration,
unlike the star
network configuration, each of the sensors 104 are connected to one or more of
the other sensors
104 of the wireless network 114. As such, information from one of the sensors
104 can be
CA 03128751 2021-08-02
WO 2020/160548 PCT/US2020/016423
14
relayed onto another of the one or more sensors 104 in an effort to transmit
collected data to the
gateway computing device 112.
[0049] The network 118 may be implemented as any type of wired and/or wireless
network, such as a local area network (LAN), a wide area network (WAN), a
global network
(e.g., the Internet), etc. Accordingly, one or more network communication
technologies (e.g.,
Ethernet, cellular, satellite, etc.) and associated protocols may be used. The
network 118 may
include one or more communicatively coupled network computing devices (not
shown) for
facilitating the flow and processing of network communication traffic via a
series of
interconnects. Such network computing devices may include, but are not limited
to, one or more
virtual and/or physical access points, routers, switches, servers, network
hubs, compute devices,
storage devices, etc.
[0050] It should be appreciated that one or more of such network computing
devices
may be configured to couple one or more of the computing devices 120 (e.g.,
the gateway
computing device 112, the remote data analysis computing device 124, the
client computing
device 128, and the remote data provider computing device 132 of the system
100 of FIG. 1) to
the network 118 as needed to facilitate network-based communications
therebetween. To do so,
the computing devices 120 may connect to the network 118 (e.g., via the
network
communication circuitry 206 of FIG. 2) using wired (e.g., Ethernet, token
ring, etc.) and/or
wireless (e.g., Bluetoothg, Wi-Fig, wireless broadband, ZigBeeg, etc.)
communication
technologies and associated protocols.
[0051] The remote data analysis device 124 may be embodied as any type of
computing
device 120 capable of monitoring, aggregating, and storing received data
(e.g., data collected and
transmitted by the sensors 104 of the apiary 116), as well as analyzing the
data to determine
whether an action should be taken as a result of the analysis. To do so, the
illustrative remote
CA 03128751 2021-08-02
WO 2020/160548 PCT/US2020/016423
data analysis device 124 includes or is otherwise communicatively coupled to
an apiary data
analysis engine 126 (see, e.g., the illustrative apiary data analysis engine
126 of FIG. 4). The
apiary data analysis engine 126, which is described in further detail below,
may be embodied as
a web server program (e.g., in a client-server architecture) running on the
remote data analysis
device 124 (e.g., as a cloud-based service). The apiary data analysis engine
126 is additionally
configured to communicate with the data monitoring application 130 of the
client computing
device 128 (e.g., in a client-server relationship via the network 118).
[0052] The remote data analysis device 124 may be embodied as any type of
computing
device with sufficient storage and compute capabilities to perform the
functions described
herein. It should be appreciated that while the remote data analysis device
124 is illustratively
shown as a single computing device 120, the remote data analysis device 124
may include more
than one computing device 120, in some embodiments, such as in distributed or
parallel
computing embodiments. For example, in some embodiments, the remote data
analysis device
124 may be embodied as one or more servers (e.g., cloud servers, stand-alone,
rack-mounted,
etc.) and/or combination of compute blades and data storage devices (e.g., of
a storage area
network (SAN)).
[0053] It should be appreciated that the remote data analysis device 124 may
be
communicatively coupled to more than one apiary (e.g., via a respective
gateway computing
device 112 of each apiary to which the remote data analysis device 124 is
communicatively
coupled) at any given point in time. In other words, the remote data analysis
device 124 may be
configured to monitor, aggregate, store, and analyze the data corresponding to
more than one
apiary 116 at a time. Accordingly, in such embodiments, the remote data
analysis device 124
may be configured to leverage data from one or more apiaries 116 to analyze
another apiary 116.
CA 03128751 2021-08-02
WO 2020/160548 PCT/US2020/016423
16
[0054] The client computing device 128 may be embodied as any type of
computing
device 120 capable of displaying data received from the remote data analysis
device 124,
receiving input data from a user of the client computing device 128, and
transmitting the
received input data to the remote data analysis device 124. To do so, the
illustrative client
computing device 128 includes a data monitoring application 130 (see, e.g.,
the illustrative data
monitoring application 130 of FIG. 3). The data monitoring application 130,
which is described
in further detail below, may be embodied as a user interfacing thin-client
application, such as,
but not limited to, a web browser, a web application, a mobile application, an
application
programming interface (API) infrastructure, or other Internet connected
software application. It
should be appreciated that the data monitoring application 130 is configured
to run, or otherwise
being executed on, the client computing device 128 and is additionally
configured to
communicate with the apiary data analysis engine 126 of the remote data
analysis device 124
(e.g., in a client-server relationship via the network 118).
[0055] In some embodiments, the client computing device 128 may be embodied as
a
mobile computing device that uses mobile-specific hardware and software (e.g.,
an operating
system) for operating, executing, and providing services and applications to
support a mobile
architecture and portability. Illustrative examples of such mobile computing
devices may
include, but are not limited to, smartphones, wearables (e.g., smartwatches,
smart glasses, etc.),
tablets, laptops, notebooks, etc. Alternatively, in other embodiments, the
client computing
device 128 may be a stationary computing device, such as a desktop computer,
an all-in-one
computer, etc. It should be appreciated that, in some embodiments, the system
100 may include
more than one client computing device 128. In other words, more than one
client computing
device 128 may be communicatively coupled to the remote data analysis device
124 at a given
point in time.
CA 03128751 2021-08-02
WO 2020/160548 PCT/US2020/016423
17
[0056] The remote data provider computing device 132 may be embodied as any
type of
computing device capable of performing the functions described herein,
including, but not
limited to, aggregating data into an organized database and transmitting the
aggregated data, or a
result of an analysis performed thereon, to the remote data analysis device
124. For example, the
remote data provider computing device 132 may be configured to collect and/or
aggregate
weather related data and transmit present and projected future weather
conditions. Accordingly,
the remote data provider computing device 132 may be embodied as a server, a
compute device,
a storage device, or a combination thereof. It should be appreciated that,
similar to the remote
data analysis device 124, the remote data provider computing device 132 may
include more than
one computing device 120, in some embodiments, such as in distributed or
parallel computing
embodiments.
[0057] Referring now to FIG. 3, in an illustrative embodiment, the client
computing
device 128 establishes an environment 300 during operation. The illustrative
environment 300
includes an interface display database 302 and an application settings
database 304, each of
which may be stored in a memory and/or data storage device of the client
computing device 128.
It should be appreciated that, in some embodiments, the data stored in, or
otherwise represented
by, each of the interface display database 302 and the application settings
database 304 may not
be mutually exclusive relative to each other.
[0058] The interface display database 302 is configured to store interface
display
information received from the remote data analysis computing device 124. Such
interface
display information may be usable to display or render/display a user
interface of the data
monitoring application to a display of the client computing device 128. The
application settings
database 304 is configured to store settings information of the data
monitoring application 130.
The settings information may include any settings usable by the data
monitoring application 130
CA 03128751 2021-08-02
WO 2020/160548 PCT/US2020/016423
18
to determine which data types are being monitored, define one or more
thresholds, set a weight
and/or priority level to certain types of data, and/or set one or more actions
associated with the
collected data and corresponding thresholds. For example, the settings may
include user-
definable thresholds and/or parameters that may be usable to dynamically
adjust one or more
thresholds.
[0059] The illustrative environment 300 additionally includes an illustrative
embodiment of the data monitoring application 130. The illustrative data
monitoring application
130 includes a dashboard interface manager 306 and a data analysis engine
interface manager
308. It should be appreciated that the interfaces described herein for
managing the user
interactions (e.g., displaying the GUI and receiving user inputs) are
graphical user interfaces
(GUIs) which allow the user to interact with the application referred to
herein through GUI
elements, graphical images, and visual indicators. Accordingly, the dashboard
interface manager
306 is configured to render/display a GUI of the data monitoring application
130 to a display of
the client computing device 128 such as, for example, the user interfaces 600,
700 of FIGS. 6-8.
In some embodiments, at least a portion of the user interface of the data
monitoring application
130 may be viewed and/or accessed as a function of a level of permission(s)
and/or needs of the
user. For example, the dashboard interface manager 306 may be configured to
display certain
information (e.g., via dedicated interface modules) based on whether the user
is a beekeeper, a
farmer, a researcher, etc., such that the respective user type can access the
information and adjust
settings relevant to that particular user type.
[0060] In some embodiments, the dashboard interface manager 306 may be
additionally
configured to generate audible tones (i.e., initiate playback of a sound
file), such as may be
associated with a notification message, or some other indication of an event
associated with the
data monitoring application 130. The dashboard interface manager 306 is
further configured to
CA 03128751 2021-08-02
WO 2020/160548 PCT/US2020/016423
19
receive inputs (e.g., notes, comments, selections, etc.) from a user of the
client computing device
128, such as may be received via a touchscreen display of the client computing
device 128, or
other peripheral device (e.g., stylus, mouse, keyboard, keypad, microphone,
etc.) connected to
the client computing device 128.
[0061] The data analysis engine interface manager 308 is configured to
interface with
the remote data analysis computing device 124. To do so, the data analysis
engine interface
manager 308 is configured to establish a communication channel with the remote
data analysis
computing device 124, which is usable to transmit and receive messages (e.g.,
network traffic,
packets, messages, etc.) therebetween.
[0062] Accordingly, the data analysis engine interface manager 308 is
configured to
generate messages for transmission to the remote data analysis computing
device 124, such as
may be generated based on inputs received from a user by the dashboard
interface manager 306.
As such, the data analysis engine interface manager 308 can provide
information (e.g., changed
settings, dashboard display requests, initiated actions, etc.) that is usable
by the remote data
analysis computing device 124, and more particularly by the apiary data
analysis engine 126, to
update a setting associated with the data being monitored, adjust the analysis
being performed,
etc. Additionally, in some embodiments, the information may be usable by the
remote data
analysis computing device 124 to initiate an operation to be performed, or
otherwise set a
time/schedule for an operation to be performed, such as may be performed via
one of the
actuators 100 of the apiary 116. Additionally, in some embodiments, the
occurrence of a
condition (such as the actual or forecasted temperature drops below a
threshold) may be usable
by the remote data analysis computing device 124 to initiate an operation to
be performed, or
otherwise set a time/schedule for an operation to be performed, such as may be
performed via
one of the actuators 100 of the apiary 116. The data analysis engine interface
manager 308 is
CA 03128751 2021-08-02
WO 2020/160548 PCT/US2020/016423
additionally configured to process messages received from the remote data
analysis computing
device 124. For example, the data analysis engine interface manager 308 is
configured interpret
a message received from the remote data analysis computing device 124 to
determine what
information is to be displayed by the data monitoring application 130 to a
display of the client
computing device 128 (e.g., in a GUI dashboard of the data monitoring
application 130) and/or
other output device coupled to the client computing device 128. It should be
appreciated that the
received information may include data (e.g., in a payload of a network packet)
that includes
information related to an object that is usable to download and/or render one
or more GUI
elements, icons, graphics, text, etc., for output by the client computing
device 128.
[0063] Referring now to FIG. 4, in an illustrative embodiment, the remote data
analysis
computing device 124 establishes an environment 400 during operation. The
illustrative
environment 400 includes a hive information database 402, an environment
information database
404, and a settings database 406, each of which may be stored in a memory
and/or data storage
device of the remote data analysis computing device 124. The hive information
database 402
may be configured to store beehive 102 related data (i.e., beehive data), such
as may be captured
by and received from the beehive sensors 106 of FIG. 1; whereas the
environment information
database 404 may be configured to store data related to the environment (i.e.,
environment data)
of the apiary 116 in which the beehives 102 reside, such as may be captured by
and received
from the environment sensors 108 of FIG. 1.
[0064] It should be appreciated that, in some embodiments, the data stored in,
or
otherwise represented by, each of the hive information database 402, the
environment
information database 404, and the settings database 406 may not be mutually
exclusive relative
to each other. In some embodiments, one or more of the hive information
database 402, the
environment information database 404, and the settings database 406 may
include data from
CA 03128751 2021-08-02
WO 2020/160548 PCT/US2020/016423
21
beehives 102 of multiple apiaries 116. In such embodiments, the data from one
apiary 116 may
be siloed from and/or combined with the data from other apiaries 116.
[0065] The illustrative environment 400 additionally includes an illustrative
embodiment of the apiary data analysis engine 126. The illustrative data
analysis engine 126
includes a sensor monitor 408, a data aggregator 410, a data analyzer 412, an
action manager
414, and an application interface manager 416. It should be appreciated that,
in some
embodiments, one or more of the components of the illustrative data analysis
engine 126 may be
combined to result in fewer components (e.g., the data analyzer 412 may
perform the function of
the sensor monitor 408 and/or the data aggregator 410). Additionally, it
should be further
appreciated that, in some embodiments, one or more of the components of the
illustrative data
analysis engine 126 may be divided into a subset of components.
[0066] The sensor monitor 408, which may be embodied as any type of firmware,
hardware, software, circuitry, or combination thereof, is configured to
receive the data collected
by the sensors 104 and store the received sensor data in the appropriate
fields of the respective
database (e.g., the hive information database 402 and/or the environment
information database
404). It should be appreciated that the types of beehive data collected from
the beehive sensors
106 may be predicated on the types of beehive sensors 106 in use in a
particular beehive 102.
Similarly, it should be appreciated that the types of environment data
collected from the
environment sensors 108 may be predicated on the types of environment sensors
108 in use in a
particular apiary 116.
[0067] As described previously, the beehive data may include any data related
to at least
a portion of a beehive 102, such as a weight of the beehive 102, a temperature
inside the beehive
102, an activity level inside the beehive 102, pheromone levels, etc. As also
described
previously, the environment data of the apiary 116 may include weather
conditions (e.g.,
CA 03128751 2021-08-02
WO 2020/160548 PCT/US2020/016423
22
temperature, wind, humidity, sunlight, shade, UV levels, etc.), a time of day
(e.g., dawn, dusk,
etc.), detected motion/activity, etc. Such data can be used to make decisions
regarding and issue
action instructions to adjust a physical characteristic of the beehive 102
such as to close doors,
change louvre positions, rotate the beehive, and the like.
[0068] In an illustrative example, one or more of the bees may be individually
monitored, or tracked, using a micro-sized transponders/transceivers (e.g., a
micro NFC/RFID
transponder, a Bluetooth Low Energy (BLE) micro module, or some other type of
low power
wireless communication technology module) that may be used for wireless
tracking and/or
identification purposes. In such embodiments, the micro-sized transponder may
be configured to
interface with one or more sensors 104 and/or readers associated with the
micro-sized
transponder (e.g., an RFID reader) that may be placed within the apiary 116,
or more particularly
within or otherwise associated with a particular beehive 102. For example, in
such
embodiments, ingress/egress pattern data may be captured for analysis.
[0069] Additionally or alternatively, in some embodiments, one or more GPS
tracking
devices may be employed. For example, in such embodiments, the queen bee of a
particular
beehive 102 may have a GPS tracking device affixed thereto such that movement,
flight speed,
flight pattern, and other properties can be tracked and monitored.
Accordingly, in such
embodiments, the sensor monitor 408 may be configured to interface with or
otherwise be
configured to interpret the tracking information received from such tracking
technologies for
analysis.
[0070] The data aggregator 410, which may be embodied as any type of firmware,
hardware, software, circuitry, or combination thereof, is configured to
aggregate, refine, and
enhance the received data. To do so, the data aggregator 410 may be configured
to gather data
from a number of data sources other than the sensors 104. In other words,
while the majority of
CA 03128751 2021-08-02
WO 2020/160548 PCT/US2020/016423
23
the data described as being collected herein has been described in relation to
the data received
from the sensors 104, it should be appreciated that additional and/or
alternative data elements
may be received from a source other than the sensors 104, such that the
externally received data
may be usable to refine and/or enhance the sensor 104 received data.
[0071] For example, in some embodiments, the data aggregator 410 may be
further
configured to aggregate data received from a user (i.e., by way of the data
monitoring application
130), such as may be received via the application interface manager 416, as
well as any
externally received and/or user input data. Accordingly, it should be
appreciated that the hive
information database 402 and/or environment information database 404 may
include additional
information that was not collected by the sensors 104, such as may have been
acquired, gathered,
or input by another source (e.g., a user of the data monitoring application
130 of the client
computing device 128) or received from an external source (e.g., via an API of
a data
aggregator).
[0072] In an illustrative example, a user (e.g., a beekeeper, an apiary owner,
an
administrator, etc.) may input information (e.g., via the data monitoring
application 130) usable
by the data analysis engine 126 to refine and/or enhance the data of the hive
information
database 402 and/or environment information database 404 (i.e., the data that
has been received
from the beehive sensors 106 and/or the environment sensors 108). The user
input data may
include data related the bees in the apiary 116 or a particular one or more of
the beehives 102.
[0073] For example, the user input data may include genetic information,
breeding
information, traits, wing span and thickness, coloration, etc. In another
example, the user input
data may be related to a particular hive, such as egg-laying levels, propolis
levels, weight/size of
individual bees in population (e.g., population size, number of drones,
proportion of new/winter
bees, proportion of workers to drones, etc.), honey production levels,
parasite/pest types/levels
CA 03128751 2021-08-02
WO 2020/160548 PCT/US2020/016423
24
(e.g., Varroa mites, small hive beetles, wax moths, etc.), travel routes/speed
of the queen and/or
other bee types, etc. In still another example, the user input data may be
related to the feeding of
the bees in the apiary 116 or a particular one or more of the beehives 102,
such as a time of day
of the feeding, a type/amount of food distributed, a type/amount of vitamin
supplements added to
the food, etc.
[0074] The user input data may additionally include data related a beekeeper
prior to,
during, or subsequent to interaction(s) with one or more beehives 102 of the
apiary 116.
Accordingly, it should be appreciated that such information may be input prior
to, during, or
subsequent to interaction(s), depending on the type of input. For example, the
interaction data
may include dietary information of the beekeeper, a mood of the beekeeper, a
present health
condition of the beekeeper, etc., prior to an interaction. Additionally and/or
alternatively, the
interaction data may include a duration of the interaction (e.g., with a
particular beehive 102, in
the apiary 116, etc.), a description of beekeeping attire worn (e.g.,
veils/masks, clothing, etc.),
type of equipment used (e.g., smoker brand, size, fuel type, etc.) a mood of
the beekeeper,
noise(s) made, whether the beekeeper was stung (e.g., at a particular beehive
102, in the apiary
116, etc.), etc., during an interaction.
[0075] In another illustrative example, the data aggregator 410 may be
configured to
interface with an externally managed data source (e.g., an external data
aggregator) to refine
and/or enhance the data of the hive information database 402 and/or
environment information
database 404. Such externally acquired data may include weather prediction
data (e.g., from a
weather data aggregator), animal/insect migration patterns, air quality
levels, etc. Additionally,
the data aggregator 410 may be configured to collect external environmental
data of one or more
areas neighboring the apiary 116. Such neighboring environmental data may
include, but is not
limited to, a number and/or types of plants (e.g., food sources, trees,
medicinal plants, etc.), other
CA 03128751 2021-08-02
WO 2020/160548 PCT/US2020/016423
pollinators/apiaries, a number and/or types of animals/insects/humans, land
type/usage, pesticide
usage, water pollution levels, etc. It should be further appreciated that some
input data may be
discernable from other input data via an externally managed data source. For
example, an
address of the apiary 116 may be usable to determine an elevation, latitude
and longitude, etc., of
the apiary 116. GPS or other geo-location information and data, altitude, and
orientation and
other positioning information such as measured through accelerometers and
other devices known
to those of ordinary skill in the art.
[0076] While the data described herein is described as being collected from a
particular
source (e.g., beehive sensors 106, environment sensors 108, user input,
3rdparty data
aggregators, etc.), it should be appreciated that the data may be collected
from an alternative data
source, which may or may not be described herein. For example, in some
embodiments, at least
a portion of the data described herein as being collected via user input may
be collected by one
or more sensors 104 in other embodiments.
[0077] The data analyzer 412, which may be embodied as any type of firmware,
hardware, software, circuitry, or combination thereof, is configured to
analyze the received data,
as well as the aggregated data (e.g., including user input data), such that
correlations may be
determined therefrom which are usable to identify one or more actions that may
be taken as a
function of the correlations and present condition information. To do so, the
data analyzer 412
may be configured to use one or more machine learning algorithms, regression
analysis methods,
and/or the like to perform the analysis. The data analyzer 412 may be further
configured to
transmit the results of the analysis to the action manager 414 and/or the
application interface
manager 416, each of which are described in further detail below.
[0078] For example, the data analyzer 412 may be configured to compare at
least a
portion of a result of the analysis to a threshold (e.g., a statistics
threshold) to determine whether
CA 03128751 2021-08-02
WO 2020/160548 PCT/US2020/016423
26
the result violates (e.g., exceeds, is less than, is outside of a range, etc.)
the threshold or that the
results of the analysis otherwise indicate that an action should be taken
(e.g., based on historical
data). In some embodiments, one or more of the thresholds may be statically
defined by a user
(e.g., via the data monitoring application 130), the settings of which may be
stored in the settings
database 406. However, the data analyzer 412 may be configured to determine or
otherwise
adjust one or more other thresholds in a dynamic fashion, as may be determined
based on
previously performed analyses and the results related thereto.
[0079] Other data either measured or observed may include age of the hive,
length of
beehive deployment, number of moves of the hive, other movement of the
beehive, beehive
mechanical structure information. Further, information can be gathered and
calculations and
other functions performed regarding crop yield and yield changes over time,
and data regarding
hive density, placement and any relationship with crop yield, calculations can
be made and
recommendations or instructions communicated regarding adjustment of physical
characteristics
of the beehives and/or the apiary such as replacement of particular beehives,
adding new
beehives, removal of beehives, repositioning of beehives, and the like.
[0080] In another example, the data analyzer 412 may be configured to perform
an
image analysis on digital images captured (e.g., color, black and white,
infrared, etc.) by one of
the sensors 104. In an illustrative example, the data analysis engine 126 may
be configured to
analyze an image to determine an actual or estimated number of objects (e.g.,
eggs, types of
bees, pollen, etc.) inside a particular beehive 102 based on one or more
digital images received
from a beehive sensor 106 embodied as an image sensor. It should be
appreciated that the data
analyzer 412 is configured to collect multiple data points for performing the
analysis and/or
updating a confidence level associated with a result of a particular analysis.
In an illustrative
example, the data analyzer 412 may be configured to analyze the movement of a
queen bee such
CA 03128751 2021-08-02
WO 2020/160548 PCT/US2020/016423
27
that liveness can be monitored. In such embodiments in which the data analyzer
412 determines
the queen has not move for a particular duration of time such that it may be
inferred that the
queen bee's health has been compromised, the data analyzer 412 may be
configured to analyze
received digital images to validate a lack of movement, such as may be
attributable to illness or
death, rather than the transponder having fallen off the queen.
[0081] The action manager 414, which may be embodied as any type of firmware,
hardware, software, circuitry, or combination thereof, is configured to
determine which action is
to be commenced or otherwise performed by the apiary data analysis engine 126,
such as may be
initiated upon a result of the analysis performed by the data analyzer 412
resulting in a
determination that one or more thresholds have been violated. Such actions may
include
transmitting a message to a corresponding data monitoring application 130
and/or a user (e.g.,
via an email, text message, etc.), transmitting a command to one or more
actuators 110 of the
respective apiary 116, adjusting a time associated with a resource of the
respective apiary 116
(e.g., an automated feeder schedule), adding a corresponding entry into a
calendar (e.g., Google
CalendarTM, Outlook , Thunderbird , etc.) linked to the corresponding data
monitoring
application 130, etc. It should be appreciated that the action manager 414 may
be configured to
make the determination of which action to perform based on one or more
settings corresponding
to a user account associated with the apiary 116 being monitored. In some
embodiments, the
action settings and/or user account settings may be stored in the settings
database 406.
[0082] The application interface manager 416, which may be embodied as any
type of
firmware, hardware, software, circuitry, or combination thereof, is configured
to interface with
the corresponding data monitoring applications 130. To do so, the application
interface manager
416 is configured to establish a communication channel with the data analysis
engine interface
CA 03128751 2021-08-02
WO 2020/160548 PCT/US2020/016423
28
manager 308, which is usable to transmit and receive messages (e.g., network
traffic, packets,
messages, etc.) therebetween.
[0083] Additionally, the application interface manager 416 is configured to
authenticate
a user of the data monitoring application 130. To do so, the application
interface manager 416 is
configured to receive credentials from the user of the data monitoring
application 130 and verify
whether the user is an authorized user, such as may be performed based on a
comparison
between the received credentials and valid credentials of the user, which may
be stored in the
settings database 406. Further, the application interface manager 416 is
configured to manage
the access to data and/or the controls which are associated with the
authenticated account.
[0084] In an illustrative example of the apiary data analysis engine 126 in
use, a sensor
106 of a beehive 102 may be a weight sensor that is configured to detect a
weight of at least a
portion of the beehive 102. In such an embodiment, the weight sensor may
transmit a weight
value that is received by the sensor monitor 408, aggregated with historically
received weight
values, and analyzed by the data analyzer 412. The result of the analysis by
the data analyzer
412 may result in a determination that the received weight value is greater
than a weight
threshold value, or is otherwise consistent with a weight threshold value that
is indicative of a
favorable time to extract honey from that beehive 102. Alternatively or
additionally, weight loss
for a sufficient period of time may indicate a deteriorating beehive health,
which may result in a
determination that the beehive needs to be checked by a beekeeper, or swapped
with another
beehive, moved, or some other action taken to improve the result.
[0085] Accordingly, as a function of the determination that the received
weight value is
greater than a weight threshold value and depending on the settings associated
with an account
corresponding to that beehive 102, the action manager 414 may be configured to
perform one or
more actions. Additionally, also dependent on the settings associated with an
account
CA 03128751 2021-08-02
WO 2020/160548 PCT/US2020/016423
29
corresponding to that beehive 102, the application interface manager may be
configured to
generate one or more messages for transmission to the respective data
monitoring application
that is usable to display one or more of a visual representation of the
monitored data, the
aggregated data, a result of the analysis of the monitored data and the
aggregated data, and the
action(s) to be taken, if applicable.
[0086] Referring now to FIG. 5, an illustrative method 500 is provided for
monitoring
and analyzing data of beehives (e.g., the beehives 102 of FIG. 1) in an apiary
(e.g., the apiary
116 of FIG. 1) that may be performed by a remote data analysis computing
device (e.g., the
remote data analysis computing device 124 of FIG. 1), or more particularly by
an apiary data
analysis engine (e.g., the apiary data analysis engine 126 of FIG. 1) of the
remote data analysis
computing device. The method 500 begins in block 502, in which the apiary data
analysis
engine 126 determines whether sensor data has been received from one or more
of the sensors
104 of the apiary 116 being monitored. As described previously, such data may
correspond to a
condition of a particular beehive 102, as may be received from one of the
beehive sensors 106, or
a condition of the apiary 116, as may be received from one of the environment
sensors 108.
[0087] In block 504, the apiary data analysis engine 126 aggregates the
received sensor
data with previously received sensor data. In block 506, the apiary data
analysis engine 126
analyzes the received sensor data and the aggregated sensor data (e.g., using
statistical models).
To do so, in some embodiments, in block 508, the apiary data analysis engine
126 is configured
to analyze the data using one or more machine learning algorithms.
Additionally or
alternatively, in some embodiments, in block 510, the apiary data analysis
engine 126 is
configured to analyze the data using one or more regression analysis methods.
[0088] In block 512, the apiary data analysis engine 126 compares the results
of the
analysis to one or more thresholds. As described previously, the thresholds
may be statically
CA 03128751 2021-08-02
WO 2020/160548 PCT/US2020/016423
defined by a user (e.g., via the data monitoring application 130) or
dynamically adjusted based
on historical data (e.g., as may be determined based historical analysis
performed and results
related thereto). In block 514, the apiary data analysis engine 126 determines
whether any
thresholds have been violated or whether the results are otherwise indicative
that an action
should be taken. If the apiary data analysis engine 126 determines that an
action should be taken
in block 514, the method 500 advances to block 516.
[0089] In block 516, the apiary data analysis engine 126 performs one or more
actions
as a function of the comparison based on one or more settings of the apiary
data analysis engine
126, as may be set by a user of a corresponding account via the data
monitoring application 130.
In some embodiments, in block 518, the apiary data analysis engine 126 may
generate and
transmit a message to the corresponding data monitoring application 130 (e.g.,
one or more
instances of the data monitoring application 130 corresponding to the
applicable account
associated with the sensor data received in block 502. For example, in some
embodiments, in
block 520, the apiary data analysis engine 126 may be configured to display a
notification in an
interface of the data monitoring application 130. In another example, in some
embodiments, in
block 522, the apiary data analysis engine 126 may be configured to add an
event to a calendar
of the data monitoring application 130. It should be appreciated that, in some
embodiments, the
apiary data analysis engine 126 may be configured to add the calendar event to
an external
calendar application (e.g., Google Calendar', Outlook , Thunderbird , etc.).
[0090] In some embodiments, in block 524, the apiary data analysis engine 126
may
additionally or alternatively generate and transmit a command to a
corresponding actuator (e.g.,
one of the actuators 110 of FIG. 1) that is usable by the receiving actuator
to perform a particular
operation (e.g., adjust a position of a mechanism attached to the actuator).
Additionally or
alternatively, in some embodiments, in block 526, the apiary data analysis
engine 126 may
CA 03128751 2021-08-02
WO 2020/160548 PCT/US2020/016423
31
generate and transmit an email to a corresponding email address of the user's
account that
includes information related to the action to be performed. It should be
appreciated that, in some
embodiments, the apiary data analysis engine 126 may be configured to provide
a notification
(e.g., via email, text, etc.) that indicates a state of the apiary 116, a
beehive 102, and/or a
particular one of the bees (e.g., the queen). In other embodiments, in block
528, the apiary data
analysis engine 126 may additionally or alternatively generate and transmit a
text message that
includes information related to the action to be performed to a corresponding
phone number of
the user's account.
[0091] It should be appreciated that, in some embodiments, sensor data
received from
one or more other accounts, apiaries 116, beehives 102, etc., may be used to
trigger an action.
For example, a present state of a monitored beehive 102 (i.e., as determined
based on the most
recently received sensor data associated with that beehive 102) may indicate
that an optimal time
to extract honey from the monitored beehive 102 may be in two days; however,
data of a similar
beehive 102 in another apiary 116 associated with another user's account may
indicate that now
is an optimal time to extract the honey from the monitored beehive 102, such
as may be based on
weather patterns that affected the similar beehive 102 previously or are
presently affecting the
similar beehive 102 and are anticipated (e.g., based on the analysis performed
in block 506) to
have a similar effect on the monitored beehive 102.
[0092] It should be further appreciated that some information to be displayed
(e.g.,
monitored sensor data, results of data analysis, etc.) and/or certain actions
to be performed which
are described herein may be queued for a particular user or account to which
the actions
correspond until a future point in time. For example, if that particular user
or account associated
therewith is not presently logged into the data monitoring application 130,
such information may
be queued until that user logs into the data monitoring application 130.
CA 03128751 2021-08-02
WO 2020/160548 PCT/US2020/016423
32
[0093] Example data and/or types of measurements received by the remote data
analysis
computing device 124, and outcomes for the beehive(s) 102 and/or the user
(e.g., the beekeeper)
associated with the data and/or types of measurements are listed below in
Table 1
TABLE 1
Data/Type of Measurement Outcome for Hive Outcome for User (e.g.,
Beekeeper)
From the beekeeper:
Standard veils/masks to unify Bees are calmer/less
1. Less smoke needed
friendly faces aggressive/less stressed 2. Increased beekeeper
productivity (beekeeper
doesn't have to leave the
area)
3. Can plan which hives to
avoid/do last
Less volatile hive Beekeeper doesn't have to
worry
about the hive
Beekeeper clothing 1. Bees less stressed 1. Less smoke needed
2. Less bees caught = less 2. Increased beekeeper
dying bees productivity (beekeeper
doesn't have to leave the
area)
3. Beekeeper doesn't have to
worry about the hive
4. Can plan which hives to do
last/avoid
Food eaten 1. Bad reaction (stinging or 1. Less smoke needed
aggression) 2. Increased beekeeper
2. Increased calmness productivity (beekeeper
doesn't have to leave the
area)
3. Beekeeper doesn't have to
worry about the hive
Chemicals interacted with Harm bees with toxicity
1. Lose a hive
2. Loose hives around it
3. Infected equipment
4. Tainted honey and liability
5. Tainted comb
6. Increased cost
7. Loss of productivity (honey
CA 03128751 2021-08-02
WO 2020/160548
PCT/US2020/016423
33
and laying)
1. Interferes with pheromones Difficulty to gauge hive
health and
a. Mood change mood
b. Ability to
communicate
Ability to sense threat Loss of a colony
Human pheromones Alters mood of hive 1. Hard to gauge health
2. Hard to gauge normal moods
3. More smoke needed
4. Effects beekeeper
productivity
Sends message to hive 1. Could optimize pheromones
for certain behavior in the
hives
2. Hive becomes conditioned to
beekeeper, making it easier
over time
Human noises (sneezes, Affects aggression (warning sign 1. Less smoke
needed
cough, speech) to bees) 2. Increased beekeeper
productivity (beekeeper
doesn't have to leave the
area)
3. Helps plan which hives to
avoid/do last
Trained to expect them 1. Easier to interact
2. More predictable
Mood of Beekeeper Changes productivity 1. Less honey, less brood
rearing
2. More attention needed
Bees match the mood 1. Less smoke needed
2. Increased beekeeper
productivity (beekeeper
doesn't have to leave the
area)
3. Helps plan which hives to
avoid/do last
4. Chance the beekeeper might
overlook something
Beekeeper Illness Bees match the mood 1. Less smoke needed
2. Increased beekeeper
productivity (beekeeper
doesn't have to leave the
CA 03128751 2021-08-02
WO 2020/160548
PCT/US2020/016423
34
area)
3. Helps plan which hives to
avoid/do last
4. Might overlook things in the
hive
Illness transmitted to hive, Lose hive
might alter pheromones, hive
might struggle, might lose
productivity and numbers
Environmental:
Aerial infrared and ultraviolet Plants in the area 1.
Increased odds of honey
2. Site selection
3. Know about food and feeding
year round
Water sources Site selection
Indicates food source as strong 1. Site selection
or weak 2. When to feed
3. How many hives can be
placed in the area
Medicinal plants available in Stronger defense and ability
to 1. Lower hive loss
area combat against threats 2. Increase chance of
survival
(including parasites and 3. More success with other
disease) issues in the hive
4. Less hive checks needed
5. Saves money and time
6. Effects other hives
Variety of food sources in the 1. Health and strength of
hive 1. Taste of honey
area (pollen and nectar 2. Vitamins that bees need 2. Color of honey
sources) 3. Profitability of honey
4. Times when food availability
is scarce and when type of
feeding is needed (carbs or
protein)
5. Peak times for extraction
Other pollinators in the area 1. More competition .. 1.
Indicates good places to place
2. Less hive and pollination bees
productivity 2. Less chance of
pollination
contracts
3. More resources used to keep
hive alive
4. Might mean less pesticides
Increased disease 1. Less honey revenue
transmission=loss of production 2. Might affect all hives
Increased robbing 1. Less honey
2. Time spent (installing
excluder, checking hive,
feeding
CA 03128751 2021-08-02
WO 2020/160548
PCT/US2020/016423
Trees in the area More shade
Cuts down on wind (Helps 1. More accurate readings
regulate temperature) 2. Increased success of hive
and
productivity
Availability of food for honey, 1. Less $ spent on sugar
potentially year round 2. Less time feeding
3. More honey (more visits to
collect this)
4. More valuable honey
5. More money
Forest density More potential food sources 1. Less $ spent on
sugar
2. Less time feeding
3. More honey (more visits to
collect this)
4. More valuable honey
5. More money
Easier to access food sources 1. Collect more honey
2. More money
Beekeeper hives nearby How fast food sources deplete 1. Less honey
2. Interact with more
beekeepers
a. Political issues
b. Increased robbing
3. Larger supply of honey=more
buyer power
Disease transmission 1. More treatments
2. More visits
3. Dependence on medication
4. Cross infection to other hives
5. Decreases survival
More robbing 1. Less robbing
2. Time installing reducer
3. More time feeding
More of your hives in one Less food 1. More time
maintaining area
place 2. Putting all of your eggs
in one
basket
3. Less time needed going from
site to site.
Presence of other animals Increase defense numbers of
1. Wasps might cause the
(predators seeking honey and guard bees, meaning less bees beekeeper to be
stressed
feeding on bees) for foraging and brood rearing 2. Hive at risk
3. Make feeding difficult
Human density (rural) 1. More pesticides 1. More time travelling to
sites
2. Less diversity of food 2. Harder to get to
sources (at least in Indiana) 3. Need diagnosis (time)
3. More diversity? 4. Immune system=hive at
risk=treat more
CA 03128751 2021-08-02
WO 2020/160548
PCT/US2020/016423
36
5. Tainted honey
Human density (suburban) 1. Chemicals flows lawns 1. Easier to get
around
2. More diversity? Less 2. Traffic
diversity? 3. Deal with upset neighbors
3. Air pollution, noise, might 4. Robbing
affect hive health
Human density (urban) 1. More pollution 1. Less resources used to
2. Less colonies in area, replace hive, hive better off
decrease chance of disease 2. Less honey, low quality
honey
transmission 3. Need to feed more
3. More competing pollinators 4. Affects honey
4. Non natural food sources,
might affect health
Elevation 1. Ability for the queen to 1. Hive dies, need to
get a queen
mate 2. Easier for new queen to
mate
2. Increased presence of wind 3. More tiring, more rest needed
3. Decreased oxygen supply 4. More gas needed
4. Might affect performance,
they might sense storm
differently
Air pressure 1. Predict and observe 1. Predict when storms are
weather patterns and hive coming
productivity 2. More $ and time
2. Sensing threats 3. (sensing threats repeat
here)
Latitude/longitude 1. Climate 1. Specific recommendations
2. Bees have to adapt to 2. Regions of beekeeping
climate patterns 3. Might impede on the need
to
3. Native and nonnative food move bees around
sources 4. Lower pollination fees
4. Magnetic field, need to 5. Hurts reputation
point them in a direction 6. (see food source)
7. Limits apiary design
8. Might not be feasible
9. Slope might be in the wrong
direction, might limit where
bees are placed
Drone (flying) What farms are nearby
Food availability 1. More health, more honey 1. Drives feeding
schedule
2. Might increase competition 2. Less time
3. Difficulty for bees to 3. More money
prioritize 4. Detract from honey
4. Might miss a bloom 5. Shorter season, less hive
5. Do they go farther for checks, more weather reliant
better food (food sources 6. Don't get honey they want
could be rated on variety of 7. Affect pollination contract
factors or historical data 8. Might need to move bees
for
observed or accessed) ore nutrition
6. More foragers dying 9. Smaller honey crop, might not
CA 03128751 2021-08-02
WO 2020/160548
PCT/US2020/016423
37
7. Less efficient, less honey harvest honey
produced in one day 10. Move hives for next year
8. Less pollen brought in closer to source
11. Might indicate better genes
Animal migration 1. Monarchs Might indicate a good
location
2. Increased competition for with diversity
food sources
3. Birds
4. Different competition each
year
Chemical Interference
Pesticide use in surrounding 1. Death from toxicity 1.
Might make beekeeper threat
area 2. Effect on the immune 2. Site selection to try to
avoid
system (physio and them, would want land
psychological) owners not spraying
3. Might make food sources 3. Adjust supply, add more hives
more or less attractive
4. Decreased competition
5. Application might affect
bees differently
6. Used on one crop might
affect other food sources in
area on different plants
Mosquito spray periods death 1. needs to be notified when
sprays happen
2. might need to make
connection with the local
people in the area
Air quality 1. lifespan of bees 1. quality of honey
2. difficulty to fly 2. more rest periods needed
3. difficulty to breath 3. more dangerous uv rays
4. more grooming needed
5. more dangerous UV rays
Water pollution in area 1. do they notice and avoid or 1. treatment and
lost hive
continue to consume 2. beekeeper needs to
provide
2. toxicity affects water source
3. might not be a water 3. a consideration in hive
alternative placement
4. difference between salt and
fresh water
5. treatment for human
consumption
6. chlorinated water
7. puddles and chemicals on
road
8. storm water runoff
9. flowing vs stagnant sources
Climate/Weather factors
CA 03128751 2021-08-02
WO 2020/160548
PCT/US2020/016423
38
Historical climate data Historically warm periods and 1. Predict actions
needed in
the hive's ability to prepare for hives
winter 2. Drive hive placement
3. Overwintering methods
Fog 1. Ability of bees to forage 1. Difficult to drive
2. Difficulty defending hive if 2. Might not be able to get to
not able to fly the bees
3. Hinder food source, as they 3. Honey production
might not be able to bring it
inside
Wind strength 1. How far they will forage Honey production
(holders could be used to 2. Whether they forage at all
keep hive flush) 3. Controlling temp within the
hive
4. Temp might be different in
different parts of the hive
5. Is the priority to heat the
hive or get food, if so would
one harm the other
6. Loss of pollen and food
sources
7. Pesticide drift
Wind direction 1. Direction the bees are Hive placement
consideration
pushed towards
2. Might bring in different
warm or cold air or
different pressure
3. Type of wind
Cloud cover 1. Ability to forage and bring 1. Money
in honey 2. Pollination contract
issues
2. Compare cloud cover in 3. Harder to visit hives
similar climates a.
Meaner, more time
3. Affects their ability to see 4. Cooler, more comfortable
plants 5. Move hives
4. Not as much food available 6. Hive at risk
from less sunlight 7. treat
5. Slower to get moving in the
morning
6. How much does this affect
things?
7. Increase fungus
Temperature 1. affect hive foraging, honey 1. When to open
hives
2. cant be productive 2. Knowledge about the hive
3. have to cool hive, detracts 3. Changes when it is too hot
from other productivity 4. If bearding and smoke if
that
4. propolis levels, wax sagging, hurts hive
honey running 5. Money
5. moisture content within 6. Lose hive
CA 03128751 2021-08-02
WO 2020/160548 PCT/US2020/016423
39
honey 7. Affects when the
beekeeper is
6. increases mite and other available
pest activity 8. Sweat affecting the hive
9. Smell of a smelly beekeeper
10. Hot propolis -> easier
11. Cold -> harder
12. treat
Shade/sunlight levels 1. Ability for control fungus 1. Where a beekeeper
places a
2. Changes productivity hive
3. More wax moths 2. Losing a hive
4. Don't wake up during the 3. When they do
activities
day right away to get 4. New foundation
moving a. Lose productivity
5. Slower changes in 5. Lose some honey crop
productivity 6. Maintenance time cleaning
a. Less time for honey and treating,
6. Ability to maintain 7. Time of day to visit bees
temperature levels a. Perspective of
hives
a. Increases swarming might be affected
7. Overheat more in the sun 8. Money
a. Cooling hive 9. Harder to get in the
hives
8. Shade: ability to stay warm 10. Less time
maintaining area
a. Does the lack of nearby
leaves make it 11. Less time painting and
easier for sun maintaining hives
9. Propolis seals faster 12. Lose a hive
a. Is it harder for bees
to use pro polis
10. Trees nearby
a. Drops branches,
pesticides, dust, etc
b. Animals nearby
11. More humid in shade
Drought 1. Water availability 1. Beekeeper has to set our
2. Plants blooming, producing water
nectar and pollen 2. Money
a. Honey yield 3. Feed more
3. More dust more chances of 4. Losing hive
pesticide drive
4. More time
UV level 1. Increase visibility of flowers 1. Sunburnt,
risks cancer
and food sources a. Affects mood
a. honey 2. Money
2. Sunburnt 3. Lose hive
3. Affects ability to see 4. Vision in hive
4. More pollen?
5. Weaker
a. More burden on
CA 03128751 2021-08-02
WO 2020/160548
PCT/US2020/016423
grooming and nurse
bees
Storms 1. Ability to collect honey 1. Honey production
(weight) 2. Drives when to beekeep
2. Vibration changes in the 3. Money
hive 4. Difficult to work with
3. Pheromone changes inside 5. Change s beekeeper's
the hive perception of how the
hive is
4. Pollen can get washed away behaving
and entire flow gone 6. Beekeeper's ability to
get out
5. Changes behavior/prepare to the hives
hive 7. Can the beekeeper go
6. Affects strength beekeeping after a storm
7. Are some storms more 8. Easier to beekeep, less
stressful than others? aggressive
a. Longer storms 9. Beekeeper prepares for a
b. Quick temperature storm
drops 10. Effects when beekeeper
8. Natural disasters might be smokes and then a
storm also
devastating happens on the hive
a. Lightening effects
9. Do they change jobs when
they can't forage
10. Does it get overcrowded
11. After a storm, do they pick
back up? (if the storm
happened in the middle of
the day
12. Electrical currents in air
effects their
communication
13. Is there a connection with
the earth's magnetic field
14. What happened with the
bees in Florida and
hurricane
15. Do they forage from a tree,
do they forage from the
ground
Length of daylight 1. Ability to forage and bring 1. $
back honey 2. When to feed, super,
harvest
2. Using phenology, bloom and other activities
periods 3. How long the beekeeper
can
3. Foraging earlier/later be in the hive
4. Hive to heat up more, 4. Hive loss
might need to cool hive 5. Consider where to put
hives
5. Might decrease nocturnal 6. Treatments
threats 7. More difficult to beekeep
CA 03128751 2021-08-02
WO 2020/160548 PCT/US2020/016423
41
a. Increase stress and
defensiveness
6. Flux and change of
temperature
7. Bee orientation
8. Internal time clock moving
might affect this
9. Decreases fungus growing
in the hive
10. Increase pests
11. Ability to get honey
During a hive visit
Need to know exactly what Bees reaction to smoke 1.
Will be able to determine
happens in the hive (that is effect of opening the
hive
measurable) when the hive is 2. Know whether the hive was
opened opened
RFID on smoker 1. What is the bees' behavior 1. Helps Bee Corp
track hive
when they sense smoke? visits for the beekeeper
2. Heat 4 rfid? 2. How long the beekeeper was
3. How the hives around one there
being smoked are affected 3. Affect perceptions of
angry
hives
4. Less honey harvested
Music 1. Frequencies, rhythms or 1. More pleasant to do
work
pitches affect their 2. Helps with their mood
Recording of peaceful hive behavior or communication 3. productivity
noises 2. Which type of speakers
3. Beneficial or harmful
Length of intervention in each 1.How this affects hive
1. effects productivity
hive and apiary as a whole productivity/stress after leaving 2. added
stress
hive 3. more strenuous on the
body
Maximum recommended time 2. longer=more stressful: 4. accuracy they can see
from
for various activities 1. more smoke bees
(feeding/routine check = 2. temp regulation a.
too short also may
short, treating for Varroa = 3. how much their
overlook important
longer) productivity changes things
4. do scouts look for new 5. less honey or
overall hive
place to go productivity
5. what's the queen doing 6. swarms
6. shorter hive visits 7. lose #s
better for bees 8. beekeeper will try to go
less
7. how long it takes them often to be quicker
to get up to speed after 9. bees may get used to scent
8. nearby hives may be 10. productivity
affected 11. beekeeper's job may be
9. more stressed or less easier or worse
stressed with you there 12. less smoke needed
Length of time in the apiary 1. hives nearby may be 1.
bees may get used to scent
CA 03128751 2021-08-02
WO 2020/160548 PCT/US2020/016423
42
affected 2. productivity
2. more stressed or less 3. beek job might be easier or
stressed with you there worse
4. less smoke needed
Smoke detector Know when beekeeper is in
hive
Lime treatments around the 1. Small hive beetle levels
1. Might not work for pollination
hive 2. Aroma have effect on site
communication in the hive 2. More or less sensitive to
3. Lime getting carried inside beekeeping
the hive, does this have an 3. Tainted honey
effect 4. Deformities
4. Affect water supply 5. Lost bees
6. Lost equipment
7. Lime might affect frame or
feeder
Chemical treatments 1. Does this affect the hive 1. Breeding poorly
adapted bees
adversely? 2. Toxic for beekeeper
2. Gets rid of pest 3. Protective gear
3. Life of queen 4. Frequency and time needed
4. Long term affects 5. Timing of the
application,
a. Do the chemicals might happen on an
linger unexpected slow
b. Cause deformations 6. Cause bees to swarm
c. Next generation 7. Behavior changes so
can fight or can't beekeeper doesn't
recognize
fight disease the natural state
d. Comb in the hive 8. Confusion on which
e. Honey treatment to use
5. Is the treatment contained? 9. Lose hive or not
lose
Does the chemicals spread 10. Replace the queen
to other hives 11. Education needed on what
6. Chemicals interacting the problem is and the
right
(other treatments and treatment
pesticides a. What level of
7. Impact on behavior infection is
necessary
8. How they affect the bees for treatment
productivity 12. weak hives, treat more,
feed
9. Zombie bees more, more attention
needed
13. purchase more comb and
reinstall it and foundation
14. could lose honey crop
15. could get sued
16. knowing how much is too
much, affect the beekeeper's
perception of the hive
17. less pleasant to work with
Smoker fuel types 1. Harm caused to bees 1. How long the fuel lasts
2. How this affects hive 2. How expensive and easy
it is
CA 03128751 2021-08-02
WO 2020/160548
PCT/US2020/016423
43
productivity/stress after to get
leaving hive 3. Health problem
3. Sends signal to hive 4. Difficult or easy to light
4. Toxins released effect bees 5. Condition the bees with
5. Is it the smoke or the different scents
typical things used, is there
an alternative?
6. Eat their honey
7. Does ink/white
paper/newspaper affect
bees
8. Calm bees with scent or
aroma
Size of smoker used 1. Don't have hot smoke with 1. How long the fuel
lasts
bigger one 2. Cost difference
2. Does it matter how big the 3. Harder to clean
holes are
3. Bigger more powerful with
smoke
Beekeeper is stung (number of 1. What happened inside the 1. Uncomfortable
stings, time between stings) hive immediately 2. Stop
beekeeping
2. What happened after next 3. Makes you mellow
visit 4. Stop working in the hive
3. Change in productivity 5. Affects your day
4. What is the reaction 6. Masks the hive
5. Which bees react 7. Probability of getting stung
6. What do the drones do? again
7. Changes in hive nearby 8. Medical treatments may be
8. Is the pheromone universal necessary
a. Is their scent 9. Is there a way to
reverse it
stronger 10. Does it stay with the
person
9. Bee smashed: does the who was stung
bees give the pheromone
or is it natural when the
stinger is removed? Is there
a difference in the two
10. Sting happens elsewhere,
are the bees on edge
11. Is the pheromone different
with different animals
12. What happens if the bee
loosed his stinger anyway
Footage of hive visit 1. How many bees are in a 1. Great for record
keeping
frame 2. When to put on a new
super
2. Software that could gauge 3. Compare footage over time
the number of bees 4. Sense of speed in the
hive
3. % brood filled up 5. Able to go back and inspect
hive in detail
CA 03128751 2021-08-02
WO 2020/160548 PCT/US2020/016423
44
6. Estimate mite levels
7. Different honey flows
happening
8. How long honey has been
capped
9. See the life cycle of the bee
10. Finding queen
11. Someone live viewing to look
for specific problems
12. Beekeeper support
13. Online classes
14. Clips for classes
Alternative disease 1. Interferes less with the 1. Might be wrongly
targeted
treatments chemicals with pheromones 2. Less risk on
contaminated
2. Less toxic honey
3. Not effective
Pheromones 1. Stress levels after 1. Depends on whether they
can
intervention be detected by humans
2. Pheromone is specific to 2. Used to manipulate
the hive
disease or disruption a. Threatening
a. Either it is different presence, etc.
b. Whether there is
anything that
blocks them
(parasite or
disease)
3. What causes the
pheromones to be emitted
4. Communicate with other
bees, is it just alarms
5. Can they overpower the
queen
6. Difference between active
and passive pheromones
7. Where food sources are
8. Conditions of the hive
Food:
Time of day bees are fed 1. Whether they forage less 1. Timed delayed
sensor to help
a. Can this help them feed bees
2. Do they work at night? If so 2. Less honey and money
then feeding can be 3. Less valuable honey
strategic 4. Less nutritious honey
3. When do they eat 5. Weaker genetics over time
4. Number of foragers that 6. More food overall for the
leave bees
5. Less nutritious honey 7. Time of day that is optimal to
feed
a. May be more
CA 03128751 2021-08-02
WO 2020/160548
PCT/US2020/016423
receptive to it in
evening
Vitamin supplements fed to 1. Could breed them to be
1. Becomes a necessity
bees reliant 2. Genetic trait good or bad
2. Less resistant to health 3. More money spent
problems, or more 4. Higher chance of hive
success
3. Enhance nutritional value of
honey
4. Stronger bees in short term
Food type fed to hive (agave, 1. Certain types of sugar harm 1. Could take
out frames and
sugar, maple syrup, honey) the hive store them for later
feeding
2. Consistence with water- (like after a spray)
what level 2. Does this get into honey
a. Are certain feeds 3. Differing costs
better at different 4. Different time spent
prepping
times of the year
Overwinter feeding 1. Survivability 1. Might save hive
2. How frequent they need it 2. Flexible in winter to visit hives
3. Do they need it year round 3. Cost and time spent doing
or do they take when they this
need a.
Time spent checking
4. Sense of conserving? it, depending on type
5. Prevent starvation 4. Add supers or switch out
6. Stronger in spring and could frames of honey
swarm
7. Regularly, though winter,
getting out when warm
8. In warm weather when
they look for food
(optionally plant for warm
days)
9. Length that it is inside the
hive
10. Which type is better
Genetics:
Type of bee (Italian, Russian, 1. Overwintering success
1. Aggressiveness (stinging)
etc.) 2. Honey production 2. Price buying and selling
hives
3. Ability to defend hive from 3. How many times
you treat
robbing and other threats 4. Who your customer is
4. More mite and disease 5. Pollination
effectiveness
resistant 6. Honey production
5. Better at reproduction 7. Affect breeding
practices
6. Queen difference in 8. Time spent in the hive
acceptability into hive and 9. Whether you want to check
lifespan on them or not
Location queen was bred 1. Success of eggs in 1. Cost
environment 2. How easy it is to get it
2. Better more effective 3. Could save a hive
CA 03128751 2021-08-02
WO 2020/160548
PCT/US2020/016423
46
mating or a queen who has 4. Chance of requeening success
been conditioned to the
climate
3. Overwintering success
4. Elevation: does this chance
her distance in the air, or is
it based on the distance to
the ground
a. Does this increase
predators
Who the breeder is 1. Mite resistance 1. Price
2. Experience in years 2. Reputation and relationships
3. Traits the beek favors 3. Resources used
4. Overwintering success with 4. Ability to give customer
queens service
5. Methods they use to
identify traits (Purdue and
insemination, good record
keeping, Beekeeper
memory)
Which traits were selected 1. Aggressiveness 1. Get
to pick what you prefer
2. Resistance 2. Price
3. Production 3. Aggressive queen + tame hive
4. How long they have hone it = will this work?
for
Wing span & thickness 1. Foraging distance & ability 1. Honey crop
to seek out plants 2. More valuable honey
2. Mating distance and height 3. survivability
3. Energy used in flying
4. How much they can carry
5. How long they live
6. Food they eat/plants
7. Capacity in hive: super
more often?
8. Cool the hive
Bee Color 1. different from standard,
might affect their
aggression
2. heating and cooling
3. Italians might be more of a
warning to other animals
4. Might affect how bees see
each other
Splits 1. Survival rates 1. Timing, need to get this
right
2. Difference in late splits vs 2. Amount of equipment
spring splits in survival and purchased
productivity 3. Save hives and revenue
3. Honey production (different 4. Which one do you move away
CA 03128751 2021-08-02
WO 2020/160548
PCT/US2020/016423
47
between old and new
hive?)
4. If need to build out
comb=reduced production
5. Overwintering success for
both hives
Emergency queen 1. Survival rates 1. More frequent checks
2. Acceptance rates 2. Risk of losing hive
3. Stressful 3. Less honey
4. Break in brood production 4. Might indicate weak hive
5. Change in bee duties:
foraging/house tasks
6. Honey production
7. Break down in other tasks
down the line
8. Temperature regulation
9. Lifespan effects
10. Eggs and larvae effects
11. Time or problem with
mating
12. Not as good laying as other
queens
13. Shorter lifespan
Mail order queen 1. Survival rates 1. Cost of queen
2. Acceptance rates 2. Risk of getting a bad or dead
3. Stressful queen
4. Might not be accepted 3. Time spent finding queen and
5. Break in rood production waiting for shipping
6. Change in bee duties:
foraging/house tasks
7. Honey production
8. Break down in other tasks
down the line
9. Temperature regulation
10. Change in the genetics
(could be good or bad)
11. Lifespan effects
Creating grooming behavior 1. Cleaner hive 1. With
certain equipment?
2. More disease and pest 2. Prevent Dirt entering
hive?
resistant 3. Less risk of losing hive
RFID on queen 1. How fast she goes 1. What frames have been
laid
2. Pre mating: in
a. Time spent before 2. When larva is going to
mating emerge
b. How far she goes 3. This makes preparing nucs
c. Will she even easier to find queen
mate? 4. Tells you if she is alive
3. Post mating Tells you if she mated
CA 03128751 2021-08-02
WO 2020/160548
PCT/US2020/016423
48
a. How she moves
over frame
b. Where she spends
the day
c. Rate of laying
4. Effects on life expectancy
5. Effects on communication
About the hive:
Propolis levels 1. Pest levels in the hive 1. Indicates strength
2. Seals up hive from wind and 2. annoying
pests
3. Does it get too old?
Number of foragers 1. Honey production 1. Strength of hive
2. Too many foragers: too 2. More time supering
little food, what happens? 3. When to move the hives
4. What hives to move
Gases inside the hive 1. effects communication 1. Indicates bad
ventilation
2. harmful to health? Effects 2. Beekeeper exhales, effect
bees like beekeepers? hive, makes it more
stressed
3. Volitazation of fertilizers out
and pesticides
4. Lingering of smoke from
beekeeper?
Weight 1. Population size 1. When to start feeding
2. Proportions of workers to 2. When to take honey off
drones 3. When to split hives
3. Honey production 4. Human robbing
4. Foraging behavior and 5. Optimizing pollination
number of bees trucking load
5. Effect on temperature 6. Effect of a hive check on
regulation weight
6. Consumption: per day, 7. When to super
during the day 8. Winter: whether hive had
enough food
9. How much to extract and feed
in the fall
10. Different nectar sources
weight different
Cause of death 1. How to best treat
equipment
upon death
2. What went wrong and what
can the beekeeper do
3. Change of it affecting living
hives
Multiple hives in apiary 1. Robbing 1. Saves time
2. Competition for food 2. Uses hives to help out
CA 03128751 2021-08-02
WO 2020/160548
PCT/US2020/016423
49
3. Higher chance of mite and struggling hives
disease transfer 3. Easier to understand
4. Ability to communicate problems in hive
within hive
Varroa mite load (sticky 1. More diseases and fungus 1. Alert beekeeper
when it
board, other testing methods) vulnerability reached
a critical point
2. Break in brood cycle 2. Force break in brood cycle
3. Attention needed to get rid 3. Time taken to detect
of them, draws away from 4. Treatments needed
other tasks 5. Hive survivability
Small hive beetle levels 1. Affect production 1. Alert beekeeper when it
2. Affect hive tasks reaches a critical point
3. Reduce population growth 2. Time spent treatment
4. Ruin honey stores and 3. Lost hive
comb
5. 5. Spread of diseases
Wax moth levels 1. Affect production 1. Alert beekeeper when it
2. Affect hive tasks reaches a critical point
3. Reduce population and 2. Hive placement need changed
growth 3. Type of foundation
purchased
4. Ruin honey stores and 4. Time spent cleaning frames
comb
5. Spread of diseases
Location 1. Wax moth levels 1. Optimal travel routes
2. Food availability 2. Accessibility
3. Competition 3. Hot or cool beekeeper
4. Risk of pesticides 4. Chance of hive survival
5. Ease of emergency
intervention
Pheromones 1. Intruders Pheromone affects hive
2. Supercedure
3. New queen
acceptance/resistance
4. Job assignments
5. Communication
6. More info from queen
Hive splits 1. Did they survive
2. Compare late splits vs
spring splits
Emergency queens Look at ordered queens and
transferred frames
Hive is moved 1. Lost foragers, production 1. Hive and money
2. Need orientation 2. Less valuable pollination
3. Increased stress contract
4. New climate, pests, 3. Less pleasant to work with,
diseases more aggressive
5. New food sources and 4. Tainted honey and usability
pesticides (does previous 5. Cant split hives
CA 03128751 2021-08-02
WO 2020/160548
PCT/US2020/016423
immunity translate to a 6. Decreased honey
production
new one) and overall value
6. Less resistant to threats in 7. Best to move in bad weather
both areas
7. Might affect brood raising
8. Foraging, memory, does
this change?
9. 3 ft vs 3 mile rule
Bee Proportions:
Number of drones 1. Mating success 1. Less stings
2. Honey consumption 2. Take drone frames out for
3. Temp regulation varroa mgt
4. More mites 3. Easily monitor varroa
5. Less honey production
6. Affect flow of work for
workers
7. What does no drones mean
Proportion of new bees 1. Number of new 1. Maybe more treatments
("hairy bees" bees/breeding rate 2. Ability to treat
2. Less foraging
3. More bees for house tasks
4. More varroa
5. Queen lay rate
Proportion of winter bees 1. Preparing for winter
1. Getting ready for winter
("fat bees") 2. Weather affecting when 2. Indicates need to get
hive
this prep happens ready for winter
3. Winter length affecting
their survival
Comb:
Age of the comb 1. Whether it is more 1. Alert that the beekeeper
conducive to the spread of should replace comb
disease 2. Fully drawn more
susceptible
2. Whether it retains to pests in storage
pesticides 3. Harder to store
3. Less effort to build out 4. More revenue from not
comb=more honey needing bees to build out
4. Effect on larvae 5. Taking out old comb =
5. More susceptible to pests increased labor
6. New comb: less foraging? 6. Need for treatment
7. More likely to blow out in
extraction
8. Builder of bee chemicals
Comb size/Bee size 1. Varroa mite levels in hive 1. Need for treatment
(correlated) 2. Build up of pesticides 2. Beekeeper can control
this
3. Collecting nectar and pollen
4. Dealing with predators
5. Distance traveled
6. Sting
CA 03128751 2021-08-02
WO 2020/160548 PCT/US2020/016423
51
7. Effects communication
8. More work for queen
9. Flow of traffic easier
10. Duration of larvae
development
11. Change in time it takes to
cap the honey
12. Best for honey or brood
frames
13. Life span
14. Confusion with difference
in cell size
15. Same size = better laying
pattern
Size of drones/Comb size 1. Mating success 1. More success with queen
2. Varroa mite levels breeding
3. Honey eaten a. Might use this in
4. Correlated to stronger hive drone selection
5. Life span genomics
6. Temperature in hive 2. Beekeeper can control this
7. Space available to move in
hive
8. Produce more waste
9. Affect behavior (if none,
hive stressed, etc)
10. Harder to kick out in the fall
Presence of brace comb 1. More wax available 1. Need more space
2. Queen laying pattern 2. Effect sensor install
and
3. Strong hive transmission
3. Might be sign comb is too old
4. Annoying
5. Indicates wrong equipment
sometimes
6. Might indicate swarm
Amount of drone brood in the 1. Worker bee population 1. Might indicate
swarming
hive 2. Increase mite levels 2. Effect treatment
frequency
3. Honey consumption 3. Need to create break in brood
4. Need for communication rearing cycle
between nurse, queen, and
rest of hive
Frame weight 1. Population 1. Difference in weight
might
2. Capped cells show what's in the comb
3. Honey 2. Harder to handle by
4. Strength of hive beekeeper
5. Temperature in winter 3. Time to add another super
4. Overwinter trends
a. Eating honey, etc
b. Shows need feed
CA 03128751 2021-08-02
WO 2020/160548
PCT/US2020/016423
52
5. When honey flow is beginning
and ending
a. Know when to move
or feed
Laying pattern 1. Strength of the queen 1. Whether to treat to
requeen
2. Diseases 2. Which frames are visited the
3. Queens movement most
throughout the hive 3. Maintenance
4. Age of the queen 4. Screened = easier to do sticky
5. How effectively she was board
mated 5. When honey flow is
6. Communication between happening
queen and nurses capping
cells
7. Temp in hive
8. Temp regulation
9. Increase robbing
10. Increase robbing
11. More labor to clean up with
solid
12. Effect humidity levels
13. More susceptible to high
winds and low temp in the
winter
14. Indicates health of the
comb
15. Grooming behavior
Equipment:
Preventing dirt being brought 1. Cleaner hive = healthier and 1. Less labor
cleaning hive in
in more productive hive spring
2. Plenty of honey 2. Frequency of cleaning
3. Knock off pollen
4. Knock off mites
5. Dependent on this, and
could lead to poor
grooming behavior
Wrapping during winter 1. Survivability 1. Skew temp data
2. Warmer inside hive 2. When to wrap and unwrap
3. Overheat hives or mild days 3. Extra labor at end of year
4. False idea of real 4. Expensive
temperature
5. Affects their ability to
control temp in spring
6. Hard to find hive because
not used to color
Bottom board style 1. Screened = better for 1. Cheaper for beekeepers
ventilation 2. Easy to build on own
2. Easier to groom
CA 03128751 2021-08-02
WO 2020/160548
PCT/US2020/016423
53
Ventilation 1. Ability to control humidity 1. Beek can
manipulate this
in winter 2. More labor to prep hives
2. Increase survivability a. Drilling holes, etc
3. Mite levels
4. Honey capping
5. Gases get in the hive
6. Extreme weather = less
work for bees, and they
don't have to beard
7. Greater exposure to
weather
Carbon filters 1. Increase productivity after 1. Bees might try to
clog it up
hive check 2. Money spent on it
2. Release trapped gases 3. Need power source
3. Less effort to ventilate 4. Another thing to check
4. Winter ventilation 5. Examine how it affects
productivity
Hive foundation used 1. Small hive beetle levels 1. Allows beekeeper to
control
2. Disease transmission for comb size
3. Affects productivity better 2. Cost associated
4. Confuse bees if not all same 3. Honey production easier
type of foundation (plastic)
5. Condition bees to not know 4. More durable (plastic)
how to form comb naturally 5. Easier to assemble
6. Toxins exposed to hive 6. (plastic) cant extract wax
through plastic 7. More difficult to look at
laying
7. Hard to communicate pattern if not as flat
through plastic
8. Queen laying speed
Age of equipment 1. Probability of holding 1. Time to repair
disease 2. Effort spent maintaining
2. How bees regulate the 3. Replacement equipment
temp (holes) needed
3. Blocking intruders 4. More expensive to buy new
4. Bees like smell of old 5. Equipment could fall apart
equipment when beekeeping
5. Mold could become a 6. Time needed to clean smoker
problem
6. Spend time using propolis
to patch up damage
7. Old smokers, more toxic
smoke on hotter
Number of repairs to 1. Effect productivity of hive 1. More time needed
for
equipment 2. Need to plug up new box beekeeper
2. Change how you repair
equipment
3. More costly with each repair
Type of comb foundation How quickly it is filled out
CA 03128751 2021-08-02
WO 2020/160548 PCT/US2020/016423
54
Number of frames used in 1. Less of a burden for the 1. Easier for
beekeeper to
honey super bees to build up instead of extract
out 2. More supers might be
needed
2. Changes capping of the a. Cost
honey 3. Need to add additional
supers
3. More comb to build out more quickly
4. Need to build this out every
season
Size of super 1. How quickly is it filled out? 1. Deep is heavier
2. How far up does the queen 2. Smaller supers=more
travel? equipment
3. Hard to adjust if the sizes a. Cost >
are different b. Maintenance >
4. Easier for bees to move 3. More storage needed
around in smaller 4. Less frequent to add
another
5. Building out vs building up super
5. 8 frames weigh less
6. Super faster for 8 frame
7. Deep: more difficult to get
bees off frame
8. More frames to extract, more
time
9. Deep takes less time to
extract
Number of supers used 1. Survivability 1. Hard to extract with
brood
2. Effects queen laying 2. Too tall for beekeeper
3. Harder to regulate temp a. More equipment
4. Increase or decrease b. Difficult to take off
chance for pests supers
5. Related to pop size? 3. More boxes to get through
while beekeeping
Slope of hive 1. Ability for water to drain 1. Worry about
tipping over
2. Effects of humidity and a. Gets exaggerated
temp levels if water drains more with more
out supers
3. Effects comb building, 2. Difficult to get to the perfect
cause gravity angle that is sturdy
enough or
4. Better for pests and the right piece of land
pesticides
Entrance direction 1. Temp regulation 1. Sometimes tricky to
2. Productivity accodomate
3. Foraging orientation 2. Know where the wind blows
4. Into wind, cool down hive
in summer
a. Exposed to north
wind in summer
5. How they store honey
CA 03128751 2021-08-02
WO 2020/160548
PCT/US2020/016423
Position of frames (honey 1. Effects moisture content
Try to maintain the pattern
outer, brood inner) and humidity
2. Heat hive and keep alive in
winter
a. Easier to access
food in winter
3. Harder for new bees to find
food
Infrared camera Disturb bees behavior 1. Beekeeping at night
2. Inspect productivity and comb
3. Tell if hive is alive in winter
4. Need to clean it
5. Laying pattern
6. How filled out frames are
7. Detect pests
8. How they are cluster and see
how survival might be
Magnetic fields 1. Foraging 1. Hive orientation (ie
facing
2. Directions south)
3. Orientation 2. Devices with magnets
4. Swarming 3. Devices stored in the
hive
5. Disease might affect how
they read the fields, or
injury
Style of hive 1. Less beekeeper disturbance .. 1. Sensors
installation is difficult
with top bar 2. Non langstroth are hard
to
2. Swarm more in langstroth transport
3. Easier to clean langstroth 3. Non langstroth have less
4. Communicate differently honey generation
among the different hive 4. Top bars more natural
styles 5. Warre insulate better
6. Langstroth easier to harvest
honey
7. Top bar no foundation
8. Top bar is cheaper
9. Warre difficult to get
equipment
10. Easier to maintain top bar, no
lifting
11. Management styles
12. Difference in algorithms for
temperature
13. Splits easier with langstroth
Color of hive 1. Ability of bees to spot the 1. Color might
influence theft
hive 2. Easier to paint whatever
2. Amount it reflects heat color, cheaper to buy paint
3. Humidity might dissipate
faster
CA 03128751 2021-08-02
WO 2020/160548
PCT/US2020/016423
56
4. Affects foraging on flowers
5. Red makes bees more
aggressive, or does color
affect mood
6. Changing the color over the
season affects them
7. Geographically, are
different colors have
different impacts
Type of top cover used 1. Amount of ventilation 1. Ease of
transportation
2. Amount of humidity 2. Time of hive checks
3. Internal temp and 3. Ease of feeding
regulation 4. Different prices
4. Telescoping drives water 5. Telescoping lid more likely to
away from the hive fly off
5. difference in the amount of 6. Telescoping more durable
pests that get in the hive
6. amount of propolis put on
or added
7. room between inner cover
might have an effect
Factors used in pollination contracts:
Rate of foraging (RFID on 1. Health/strength of hive
1. Determines prices
foragers) 2. Increased chance of survival 2. Increases
negotiation power
3. How fast they are for the beekeeper
4. How much time they spend
outside the hive
5. Genetic trait?
6. How many foragers in the
hive
7. How much honey they
bring in
8. Indicates strong hive
9. Indicates age of the queen
10. Percent of the population
that are drones
11. Size of the bees
12. Breed
13. How much the bee can
carry
Transportation style 1. More bees, more hot 1. Might change the costs of
2. More stressful to ship in shipping
large groups 2. Trucking or flying bees
3. Stops to check
4. Determines who is a t fault
Transportation distance 1. More harmful for the bees 1. More stops
2. Higher risk of overheating 2. More expensive for the
3. More stress beekeeper for longer (might
CA 03128751 2021-08-02
WO 2020/160548
PCT/US2020/016423
57
4. Bigger risk of dying have to hire two drivers, etc)
5. Latitude or longitude might 3. Have to abide by state
affect their orientation regulations
6. More likely to be exposed 4. Can get pulled over for not
to inclement weather having secured hives
7. More exposed to emissions 5. Amount of pollination
for longer contracts that can be
entered
6. If the beekeeper has to tend
to them, it is more money
7. Longer distance, harder to
replace them to honor
pollination contracts
Acceleration or velocity 1. Whether this negatively Affects how well
they have to
reached affects them secure the hives
2. Higher speed means more
wind, might affect temp
regulation and humidity
3. Vibrations might have
effect on their ability to
communicate
4. More likely to break the
seal on the hive
Knowledge about a hive when Health of hive 1. Wanting to know the
health
in holding yards of the hives
Whether they're effective in 2. Risk of theft
calming/acclimating bees, 3. Adequacy of feeding
feeding performed, distance 4. Improve productivity for
hive
between holding yard and checks
pollination site 5. Higher pollination fees,
or cut
of the fee
6. Hard to build trust between
the beekeeper and the broker
7. More security for the grower
or broker
8. Improves the layover time f
they have to be inspected
Other:
Honey prices 1. How it affects the bees 1. Optimal times to sell
honey
2. Is the highest value honey 2. Optimal crops to pollinate
for humans as good for 3. Bottling size
nutrition for bees 4. Channel it is sold
through
3. If the beekeeper extracts 5. Who conducts the extraction
more, this could harm the 6. How much the beekeeper
bees extracts
4. Different crops might have
more nutrition, but if they
taste better more likely to
CA 03128751 2021-08-02
WO 2020/160548 PCT/US2020/016423
58
be taken away from the
bees
[0094] FIG. 6 illustrates an example first user interface 600 which may be
rendered via
the dashboard interface manager 306 to the display of the client computing
device 128 to enable
a user to monitor and/or control the beehives 102. In the illustrative
embodiment, the user
interface 600 includes interactive graphical icons 602, 604, 606, each
displaying information
related to one of the beehives 102. For example, the graphical icon 602
displays information
related to the beehive 102 named "Hive 1" such as, for example, a temperature
of the beehive
102, a humidity level of the beehive 102, a number of user-inputted notes
associated with the
beehive 102 and accessible via the user interface 600, and a number of alerts
associated with the
beehive 102. Other examples may include additional and/or alternative
information. A user may
interact with (e.g., click on via a mouse, tap via a touchscreen, etc.) one of
the graphical icons
602, 604, 606 to view additional user interfaces and/or information related to
the beehives 102.
[0095] FIG. 7 illustrates an example second user interface 700 displaying
information
related to the beehive 102 associated with the graphical icon 604 of FIG. 6.
In some
embodiments, the second user interface 700 is accessed and/or displayed when a
user interacts
with the graphical icon 604 of FIG. 6. In the illustrative embodiment, the
second user interface
700 includes a graph 702 indicating temperatures and humidity levels of the
beehive 102 based
on information detected via the sensor(s) 104 over time. The second user
interface 700 also
displays a current temperature 704, a current humidity level 706, and an
indication 708 as to a
current location of the beehive (e.g., whether or not the beehive 102 is in a
predetermined or
desired location). The illustrative second user interface 700 includes alerts
710 related to the
beehive 102 and statuses 712 associated with the alerts 710. For example, one
of the alerts 710
indicates that "Queen might be dead or has left the hive. Check hive ASAP" and
the status 712
CA 03128751 2021-08-02
WO 2020/160548 PCT/US2020/016423
59
associated with the alert 710 indicates that the user checked the beehive 102.
In the illustrative
embodiment, the user may edit and/or update the statuses 712 to indicate an
action was taken in
response to receiving the alerts 710. The second user interface 700 further
includes notes 714
and/or additional and/or alternative information input by the user.
[0096] FIG. 8 illustrates the second user interface 700 of FIG. 7 displaying a
map 800.
In the illustrative embodiment, the map 800 includes an indicator 802
indicating a location of
one or more of the beehives 102 on the map 800. In some embodiments, the map
800 may be
dynamically updated such that the user may monitor a location of the
beehive(s) 102 to
determine if the beehive(s) 102 are moving.
[0097] As demonstrated above, the application of analytics to data collected
from
beehives can help growers ensure effective pollination. Use of the following
embodiments
described below decreases costs for growers by monitoring the number, health
and distribution
of pollinating bees. For a small amount per hive inspected, these embodiments
allow growers
and beekeepers to take infrared (IR) imagery from a smartphone attachment (or
other IR imaging
device) to automatically calculate the number of frames of bees inside the
hives. As used herein,
colony strength, size, and population are all synonymous. The colony refers to
the cluster of
bees, while the hive refers to the physical wooden structure as well as the
bees inside.
[0098] Observing and recording the number of frames of bees in colonies
throughout the
year gives a much clearer picture of a colony's overall health by providing a
seasonal history of
its strength and size based on fluctuations in adult bee populations. In the
past, a simple estimate
of a hive's adult bee population required the beekeeper to crack the lid and
smoke the top box
gently. After the lid is removed and the top brood box is located, the
beekeeper counts the
number of frames covered with bees. In some cases, this can be accomplished
without having to
remove any of the frames by simply looking between each frame and counting the
frames that
CA 03128751 2021-08-02
WO 2020/160548 PCT/US2020/016423
are entirely or mostly covered with adult bees. In other situations, the
frames must be removed
to get an accurate assessment. This procedure is followed for each brood box,
and the results are
added together to get an estimate of the adult population of a hive expressed
as frames of bees.
This prior art methodology clearly creates an unwanted disturbance to the
hive.
[0099] Pollination revenue ($655 million) makes up over half of the total
beekeeping
market, where over 90 crops need honeybees for proper pollination. Currently,
growers in need
of pollination will rent beehives from beekeepers, and the beekeepers
seasonally move their
hives to the grower's location for pollination. Almond pollination generates
the highest demand
for pollination, requiring 3/4ths of the nation's beehives. For almond
growers, their main concern
is renting enough strong hives to pollinate their orchard, since 100% of an
almond crop is reliant
on honeybee pollination. If the growers do not rent enough hives above a
minimum strength,
they will produce lower yields that season.
[00100] Growers pay for hives based on colony strength, measured by
the
population of bees inside the hive, since this is directly related to the
amount of pollination that a
hive can perform. If a grower or a beekeeper thinks the price is wrong or is
worried about hive
strength, they can request a hive inspection. If an inspection reveals that
some of the hives were
weak or dead, the grower will contact a beekeeper and rent more hives.
[00101] In these inspections, hives are pried opened and the frames
covered with
bees are tallied to determine the frame count. Prices for hive rentals are
then determined based
on the average number of frames across all hives sampled. Inspections are done
by hand at a rate
of 7 hives per hour and are typically performed on a limited sample of 10-15%
of hives rented.
Because manual inspections rely on human judgement based on a small sample,
they are
inaccurate measurements of colony strength. Manual inspections are also
stressful to the bees¨
CA 03128751 2021-08-02
WO 2020/160548 PCT/US2020/016423
61
they will not forage for 2-3 days after an inspection¨resulting in lost
pollination time for the
grower.
[00102] The digital hive grading tool embodiments disclosed herein
increase the
accuracy of hive grading and can work without opening hives. Since manual
inspections rely on
human judgement, disputes often arise on the quality of the inspector. Using
the embodiments
disclosed herein, the hive grading data is undisputed as it is based in an
unbiased methodology
that grades identically across all hives. The embodiments disclosed herein
also help beekeepers.
The pre-pollination season hive inspections performed to verify that hives
meet the minimum
strength required by pollination contracts is a very labor-intensive task.
[00103] The hive grading embodiments disclosed herein also allow
collection of
colony size information for use in honeybee research (such as nutrition,
pesticide impacts, etc),
where this tool can be a more objective and affordable method of data
collection. An often-cited
problem in data collection is pesticide usage and its harmful effect on
honeybee populations.
Data collected from the embodiments disclosed herein can be used as a
benchmark to test the
impact of pesticides on honeybee populations. Currently in pesticide
permitting, hive colony size
endpoints are used to measure the impact of pesticides on these nontarget
organisms. The IR
analysis capabilities of the embodiments disclosed herein may also be applied
to new verticals,
including manufacturing, medical, agriculture, and energy sectors, to name
just a few non-
limiting examples.
[00104] The hive grading embodiments disclosed herein cut down the
labor time
required to get the hives ready for pollination by 93%. Easy-to-collect
strength data also allows
the beekeeper to increase transparency and reinforce growers' confidence in
their decision to
maintain their business relationship by demonstrating the value their bees
provide. Beekeepers
CA 03128751 2021-08-02
WO 2020/160548 PCT/US2020/016423
62
can also use the product as a point of comparison to other hives on the
market, which they can
use to justify better prices during negotiation.
[00105] In some embodiments, the digital hive grading tool uses
infrared (IR)
images of the hive. In order to establish the algorithm to use for the digital
hive grading tool,
data was collected by taking an infrared image of the hive and pairing the
image with a manual
inspection frame count. Images were collected from a variety of commercial
beekeepers, which
allows us to get a vast variety of data from beehives. The IR images were
captured first, then
hives were inspected and assigned frame counts. This order was important
because opening the
hive could affect the IR heat signature. IR image data and frame counts were
collected
consecutively¨typically within minutes of each other¨to ensure the two data
points
represented the colony at the same point in time. Data was collected from
various beekeepers
from California, Michigan and Florida. In total 3,197 IR images paired with
frame counts were
collected, and 6,489 IR images of hives were captured. In some embodiments,
the IR images
may be captured with a FUR One Pro thermal camera that functions as an
attachment to a
smartphone, such as an IOS device. In some embodiments, the manual frame count
data and
other information noted by the inspector may be stored as metadata associated
with each image.
[00106] Environmental sensors were installed in a research apiary to
record local
temperature and humidity values at the site. Environmental sensors were also
installed inside the
hives to record hive temperature and humidity, and weight sensors were
installed to capture hive
weight. Hive entrance traffic counters were also installed. Collected data was
paired with open
source data, such as weather or solar data to better capture ambient
conditions affecting the
temperature of the hive. Weather and solar data are triangulated from multiple
sources (Table 2).
Weather and solar data are relevant because ambient weather factors impact
heat captured in the
IR images. The environmental and open source data are used to validate the
physics model by
CA 03128751 2021-08-02
WO 2020/160548 PCT/US2020/016423
63
comparing the thermodynamics in the physics model to the actual temperature
flow inside the
hive.
Table 2
Source Data Type
Dark Sky
Weatherbit.io
Weather
Wolfram Alpha
Weather Underground
National Solar Radiation Database
Solar
Sunset ¨ Sunrise
Honeybee.net Weight, nectar flow data
Google Image search Hive images for segmentation
[00107] During use of the FUR One Pro IR image sensor in some
embodiments,
the camera was turned on in temperatures between 55-90 F and it was ensured
that the object
being measured was above 32 F. Distance tests were also performed, where
images were taken
at 3, 5, 10 and 15 feet away from the hive. The closer the IR image sensor was
to the hive, the
greater resolution the thermal image contained. If an image is taken too
close, however, the hive
segmentation process (discussed below) is impaired. In some embodiments,
images that were
captured 3-6 feet from the front of the hive performed best.
[00108] As schematically illustrated in FIG. 9, the data from the
sensors was
analyzed to determine a model between sensor data and hive population. This
included
processing images, segmenting images, exploratory data analysis, statistical
modeling, feature
engineering, model optimization, and performance testing.
[00109] The first step in the analysis chain is to process the
images into a useful
form for modeling. The irradiance data is extracted from the metadata of the
image file created
by the IR image sensor. Software is then used to extract and format the
metadata from the image
CA 03128751 2021-08-02
WO 2020/160548 PCT/US2020/016423
64
file. The software also calculates the temperature values from radiance data
contained in the
image file.
[00110] The next step is to build a segmentation model that can
identify the
beehive within the visual image. The IR image sensor used has two cameras, one
infrared and
one visual, that capture images simultaneously. The present inventors started
with Mask RCNN,
a deep learning model commonly used for image recognition that detects objects
in an image
while simultaneously generating a high-quality segmentation mask for each
instance. The model
attempts to find a box in the image, which is well-suited for beehives. The
segmentation model
was improved and trained to meet the needs of the analysis. The model was
trained using 1992
beehive images to develop its accuracy in locating a beehive within an image.
This involved
using the images sourced from Google Images and GIMP to define and store data
on where the
hive was in the image.
[00111] While training the model, it was determined that the hive
lids and
entrances skewed temperature data, so the segmentation model was improved to
exclude lids and
entrances. The model was optimized for hive detection so it didn't overfit the
data. Because the
segmentation model only needed to classify whether the image was a hive or
not, which involves
simpler operations, all of the algorithm layers in the RCNN model were not
trained; the main
layer of analysis was enough for accurate hive detection.
[00112] The segmentation model categorizes pixels as "hive" or "not
hive". This
results in a shape cropped out of the visual image that is then applied to the
thermal image to pull
the relevant temperature values and exclude pixel values depicting background
objects. To do
this, a script was built to align the position and size of the visual image
with the thermal image.
This model accurately classifies each pixel 93.6% of the time.
CA 03128751 2021-08-02
WO 2020/160548 PCT/US2020/016423
[00113] The first step of modeling was to look at the temperature
statistics (mean,
median, range, standard deviation) distributions from the hive images and find
a correlation with
manually collected colony size data. The relationship between these two
datasets was analyzed
over the course of a day, and it was determined that a stronger relationship
exists closer to
sunrise.
[00114] A variety of different regression and classification models
were tested to
see if a relationship could be detected. In the early models, classification
performed better, but as
more data were collected, regression began performing better. For
classification, categories were
created to correspond with different levels of colony strength. This technique
results in a loss of
information because frames of bees are closer to a continuous variable than a
category. The
updated regression model can more closely output a representation of each
hive's strength. The
improvement over time of the regression model was due to incorporating feature
engineering
improvements (discussed below) and additional data.
[00115] As part of the feature engineering, the model included
weather data (Table
3). Ambient factors were incorporated into the model to account for external
heat sources
affecting the hive's infrared heat signature.
Table 3
Feature Importance
Temp entropy 30.52%
Hive temp 28.76%
Power 10.18%
Temp : Area 9.11%
Solar time 6.94%
Temp : Volume 4.44%
Ambient temp 2.99%
Wind speed 1.88%
Hive area 0.92%
Humidity 0.83%
Dew point 0.77%
Cloud cover 0.65%
CA 03128751 2021-08-02
WO 2020/160548 PCT/US2020/016423
66
Time 0.56%
Hive size 0.51%
Visibility 0.42%
Pressure 0.23%
UV Index 0.23%
Heat Index 0.03%
Precipitation 0.03%
Windchill 0.01%
[00116] The parameters of the models were then optimized, updating
items such
as the learning rate and the regularization factor, which allow the model to
train more optimally
to minimize error. The regression model used was a boosted model, a process
which combines
several weak models into one strong model. The model's performance was then
evaluated. The
model was first trained on a training set of 80% of the IR image and frame
count data, then
validated on a test set of the remaining data withheld from the model
training. This helped
determine how the model performs on unseen data.
[00117] To validate the data, a 1-dimensional physics-based model
was created
which incorporates the thermodynamics from the center of the hive out to the
center of the hive
wall as read from the infrared cameras. The simulated model comprised a heat
flow model, and
mathematical solvers were used for the differential equations. The simulated
model was tested
on real world data. The model was first tested using a simulated hive to get
early validation of
performance. In the simulated hive, Christmas lights were used as the heat
source inside a
beehive to test the model on the hive equipment before adding the bee
complexity. The physics
model matches the actual thermodynamics observed in the hive. To increase
accuracy, the model
takes into account the materials inside the hive.
[00118] To verify the 1-dimensional model, a simulated apiary is
established using
Christmas lights as the heat source in place of bees. In the experiments, IR
pictures are taken
CA 03128751 2021-08-02
WO 2020/160548 PCT/US2020/016423
67
periodically and the temperatures at important locations in the system are
recorded. Temperature
data was collected every five minutes via a probe, at various distances from
the heat source. The
experimental results are shown in FIG 10. The results of the experiment were
compared to the
typical heat source distribution over time of the Christmas lights alone.
Taking account of the
Solar radiation distribution, material used in the hive, reflection and
absorption factors of the
paint color, distance from the heat source, and time, the heat equations were
solved, resulting in
the FIG 11.
[00119] FIG. 12 schematically illustrates a system to automate the
image analysis
and report generation processes. This includes processing of IR images,
running the hive strength
model, and generating results in a format that growers can easily understand.
In one
embodiment, this system may be implemented in Amazon Web Services (AWS). The
AWS
technology allows subscribers to have at their disposal a virtual cluster of
computers, available
all the time, through the Internet. Moving the analysis models to faster
computers in AWS
allowed the analysis time to be much shorter than running the models on local
computers.
[00120] In some embodiments, the entire software chain is not
automated¨only
the most critical components. For example, Images may need to be manually
uploaded from the
IR image sensor to Dropbox, where they may then be manually pulled into AWS.
In some
embodiments, although there is a model for segmenting images automatically, a
manual
segmentation flow may be used for images that do not properly auto segment. In
some
embodiments, this process includes a human check to ensure the segmentation
model performed
well.
[00121] In some embodiments, images uploaded in the S3 bucket create
notifications (SNS) that are sent to the SQS queue. This is a distributed
system (n number of
hosts) processing the images in tandem. A load balancer calculates the number
of images and/or
CA 03128751 2021-08-02
WO 2020/160548 PCT/US2020/016423
68
amount of traffic in the SQS queue, then determines how many hosts are
necessary in order to
process the data. These images are then processed through the segmentation
model, IR
metadata extraction, and prediction models. Prediction results are then sent
to a server, or
serverless storage solution, which also stores all metadata, user, site, hive
information, picture
metadata, beekeeper and grower information. The results are securely processed
and sent to the
users. According to an embodiment, the results are sent to the users directly.
The results may
also be posted to a secure portal where the user may review the results.
[00122] FIG. 13 illustrates one embodiment of a simple report to
display the data
generated from the model in a format that is easy for growers to review their
inspection results.
[00123] Example 1: A system as described herein was tested with a
commercial
beekeeper, during which 120 hives were sampled to determine whether the image
capture
process worked and how the model performed. Actual frame counts collected
manually
averaged 9.02 frames across all 120 hives, and the model estimated 8.92
frames.
[00124] FIG. 14 illustrates one embodiment of a web application to
display the
data generated from the model. According to this embodiment, frame strength
data is provided
over time. The web application allows users to view their results and sort by
site, beekeeper, and
grower. When a user selects a filter, the entire page is responsive, and the
graphs update with the
new data. According to an embodiment, the web application includes key summary
graphs to
help growers make decisions and provides a full list of individual hive
results with images and
all other metadata. This embodiment may also compare the user's hive strength
to other hives,
or to the seasonal average hive strength. According to an embodiment, the web
application
displays a mapping tool summarizing the strength of each hive by geographic
location. The
mapping tool allows users to view their strength results on a map, so they can
see how weak and
CA 03128751 2021-08-02
WO 2020/160548 PCT/US2020/016423
69
strong colonies are distributed through the orchard. The map displays marker
colors based on
hive size, and detailed information is provided when clicking upon an
individual marker.
[00125] The system disclosed herein may be packaged in an easy-to-
use mobile
application so that personnel associated with the hives can perform the data
collection
themselves. FIGs. 15 and 16 show several features of a user-facing mobile
application, such as
average frame strength, display on the screen during IR image capture of a
bounding box to
assist the user in aligning the hive within the image plane (which helps to
place the user at the
optimum distance from the hive for image capture), and display of site and
beekeeper
information as related to captured images. The mobile application runs the
predictive model
natively, so that frame strength results can be calculated without needing
cell service or internet
connection.
[00126] While the invention has been illustrated and described in
detail in the
drawings and foregoing description, the same is to be considered as
illustrative and not
restrictive in character, it being understood that only certain embodiments
have been shown and
described and that all changes and modifications that come within the spirit
of the invention are
desired to be protected.