Note: Descriptions are shown in the official language in which they were submitted.
CA 03139123 2021-11-03
WO 2020/227661
PCT/US2020/032165
SURGERY PLANNING SYSTEM WITH AUTOMATED DEFECT
QUANTIFICATION
CROSS-REFERENCE TO RELATED APPLICATIONS
[0001] This application claims the benefit of and priority to U.S.
Provisional Patent
Application No. 62/845,676, filed on May 9, 2019, the entire contents of which
are
incorporated herein by reference.
INTRODUCTION
[0002] Aspects of the present disclosure relate to surgery planning
systems, including
surgery planning systems with automated defect quantification and population-
based decision
support capabilities.
[0003] Conventional surgery planning tools deal with pre-operative
planning procedures.
They address the conventional issues associated with a specific surgery such
as sizes and design
of various components including surgical instruments and implants, location
and orientation of
implants and fixation devices. They typically take medical images of the
patient as input, and
therefore allow the user ¨ medical professional or non-medical professional,
such as technician
or engineer ¨ to make decisions based only on the information available in
those images.
BRIEF SUMMARY
[0004] Certain aspects provide a method for preparing medical treatment
plans,
comprising: acquiring medical image data associated with an anatomy of a
patient; creating a
three-dimensional anatomy model based on the medical image data; fitting a
statistical shape
model to the three-dimensional anatomy model; determining one or more
quantitative
measurements based on the fitted statistical shape model; and classifying a
defect associated
with the anatomy of the patient based on the one or more quantitative
measurements.
[0005] Further aspects provide a method for determining a treatment for
an anatomical
defect, including: acquiring medical image data associated with an anatomy of
a patient;
creating a three-dimensional anatomy model based on the medical image data;
fitting a
statistical shape model to the three-dimensional anatomy model; identifying a
defect based on
the three-dimensional anatomy model and the statistical shape model;
determining a default
treatment based on the identified defect; receiving patient population data
associated with a
plurality of other patients having the identified defect, wherein the patient
population data
comprises a plurality of patient population data subsets associated with
different treatments of
1
CA 03139123 2021-11-03
WO 2020/227661
PCT/US2020/032165
the identified defect; generating a visualization, comprising: a
representation of each patient
population data subset based on at least one patient characteristic; and a
representation of the
patient based on the at least one patient characteristic; and selecting a
final treatment for the
patient.
[0006] Other aspects provide processing systems configured to perform the
aforementioned methods as well as those described herein; non-transitory,
computer-readable
media comprising instructions that, when executed by one or more processors of
a processing
system, cause the processing system to perform the aforementioned methods as
well as those
described herein; a computer program product embodied on a computer readable
storage
medium comprising code for performing the aforementioned methods as well as
those further
described herein; and a processing system comprising means for performing the
aforementioned methods as well as those further described herein.
[0007] The following description and the related drawings set forth in
detail certain
illustrative features of one or more embodiments.
BRIEF DESCRIPTION OF THE DRAWINGS
[0008] The appended figures depict certain aspects of the one or more
embodiments and
are therefore not to be considered limiting of the scope of this disclosure.
[0009] FIG. 1 depicts an example of a statistical shape model fitted to
a 3D image of a
patient anatomy.
[0010] FIG. 2 depicts an example of a statistical shape model divided into
six regions.
[0011] FIG. 3 depicts an example of an anatomy measurement technique.
[0012] FIG. 4 depicts an example of an anatomy measurement technique.
[0013] FIG. 5 depicts an example for measuring parameters associated
with bone loss.
[0014] FIG. 6 depicts an example of a surgical planning workflow.
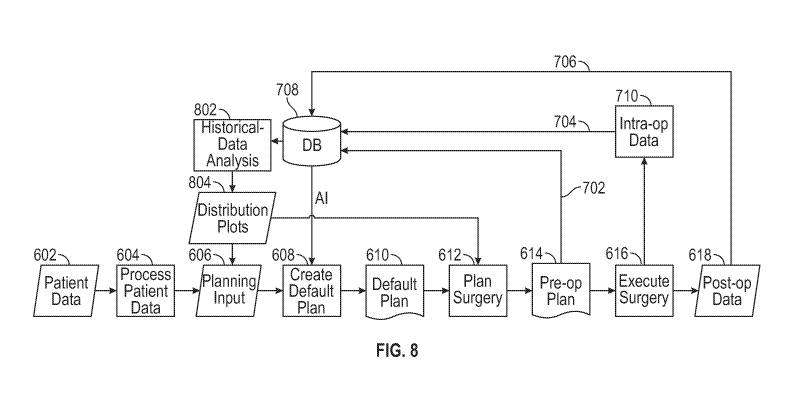
[0015] FIG. 7 depicts another example of a surgical planning workflow.
[0016] FIG. 8 depicts another example of a surgical planning workflow.
[0017] FIG. 9 depicts an example of a historical data-based analysis of
patient populations
for assessing treatment options.
2
CA 03139123 2021-11-03
WO 2020/227661
PCT/US2020/032165
[0018] FIG. 10 depicts an example of a historical data-based analysis of
patient
populations for assessing treatment options.
[0019] FIG. 11 depicts an example of a historical data-based analysis of
patient
populations for assessing a parameter value.
[0020] FIG. 12 depicts an example of a historical data-based analysis of
patient
populations for assessing a device size.
[0021] FIG. 13 depicts an example of a historical data-based analysis of
patient
populations for assessing a parameter value.
[0022] FIG. 14 depicts an example of a defect quantification.
[0023] FIG. 15 depicts an example of a historical data-based analysis of
patient
populations for assessing treatment options.
[0024] FIG. 16 depicts an example of a historical data-based analysis of
patient
populations for assessing implant options.
[0025] FIG. 17 depicts an example of a historical data-based analysis of
patient
populations for assessing implant options.
[0026] FIG. 18 depicts an example of an interactive surgical planning
system.
[0027] FIG. 19 depicts an example of a representation of a defect
quantification using
patient imaging data and an SSM.
[0028] FIG. 20 depicts an example representation of a treatment option
in a three-
dimensional patient anatomy model.
[0029] FIGS. 21A-D depict example representations of a treatment option
in a three-
dimensional patient anatomy model.
[0030] FIG. 22 depicts another example representation of a treatment
option in a three-
dimensional patient anatomy model.
[0031] FIG. 23 depicts another example representation of a treatment option
in a three-
dimensional patient anatomy model.
[0032] FIG. 24 depicts another example representation of a treatment
option in a three-
dimensional patient anatomy model.
3
CA 03139123 2021-11-03
WO 2020/227661
PCT/US2020/032165
[0033] FIG. 25 depicts another example representation of a treatment
option in a three-
dimensional patient anatomy model.
[0034] FIG. 26 depicts another example representation of a treatment
option in a three-
dimensional patient anatomy model.
[0035] FIG. 27 depicts an example method for classifying a defect with a
statistical shape
model.
[0036] FIG. 28 depicts an example decision support method.
[0037] FIG. 29 depicts an example method for determining a treatment for
an anatomical
defect.
[0038] FIG. 30 depicts an example processing system that may be configured
to perform
the various methods described herein.
[0039] To facilitate understanding, identical reference numerals have
been used, where
possible, to designate identical elements that are common to the drawings. It
is contemplated
that elements and features of one embodiment may be beneficially incorporated
in other
embodiments without further recitation.
DETAILED DESCRIPTION
[0040] Aspects of the present disclosure provide apparatuses, methods,
processing
systems, and computer readable mediums for surgery planning systems, including
surgery
planning systems with automated defect quantification and population-based
decision support
.. capabilities.
[0041] The surgery planning systems described herein resolve several
problems with
conventional surgery planning tools.
[0042] For example, conventional planning tools do not offer information
on the healthy
anatomy, and therefore do not allow a user to properly assess the size and
location of the
damage. The surgery planning tools described herein, by contrast, provide an
automated defect
classification system, which characterizes healthy anatomy as well as damaged
anatomy. Thus,
the surgery planning systems described herein overcome the issue of designing
pre-operative
plans based solely on damaged anatomy, such as bone and cartilage, among other
things.
Relatedly, the surgery planning systems described herein provide a better,
more detailed, and
4
CA 03139123 2021-11-03
WO 2020/227661
PCT/US2020/032165
automated visual representation of the damaged bone anatomy based on the
defect
classification.
[0043] As another example, while giving planning support for specific
surgeries,
conventional planning tools offer little support for choosing between such
specific surgeries.
The surgery planning systems described herein have a different starting point,
allowing the user
to also make more important, high-level surgical decisions. Thus, surgery
planning systems
described herein are more transparent to a user, such as a surgeon.
Specifically, the surgery
planning systems described herein provide statistical data allowing the
surgeon to assess where
the patient lies within a patient population, so that the surgeon can make
informed decisions
while creating a pre-operative plan. The transparency of the system allows the
user to trace
back every decision by providing the user with a complete patient profile. The
surgery planning
system also aims to reduce the number of manual interactions required for
creating a pre-
operative surgical plan.
[0044] The system and method disclosed in this invention consists of
interconnected parts.
Defect Quantification and Classification
[0045] Embodiments of a defect quantification system may implement
methods for
computing characteristics of a defect or deformity in a patient's body, such
as a bone, an organ,
musculoskeletal regions, or any other anatomical part, using medical images as
the starting
point. In some embodiments, the defect quantification systems and method
described herein
may be a subsystem, module, or otherwise an integral part of a surgery
planning system.
[0046] For example, the shape and size of a bone defect holds
information that is useful to
surgeons, implant or surgical instrument manufacturers, implant positioning
software
providers, educational institutions, and for patients, if needed. Many
classification systems are
used to describe the shape and size of bone defects, such as the Paprosky
classification system
.. for the hip, Don, Insall and Rand classification systems for the knee,
Wallace, Walsch and
Antuna classification systems for the shoulder, and others.
[0047] Conventional methods use qualitative measurements on standard
radiography or
two-dimensional (2D) computed tomography (CT) scans. They rely on the user
visually
identifying anatomical landmarks and guessing where a defect starts and what a
regular, i.e.
healthy, anatomy would look like. For example, in the case of a bone or
cartilage defect, such
as erosion of a glenoid, an acetabulum, a tibial plateau, a vertebra,
craniomaxillofacial region,
5
CA 03139123 2021-11-03
WO 2020/227661
PCT/US2020/032165
or any another bony anatomy or cartilage surface, existing techniques will
have a user rely on
anatomical landmarks or the observation of unusual bone geometry to assess
which parts of the
anatomy have eroded. However, without the shape of the undamaged anatomy as a
reference,
this generally cannot go beyond a mere assessment. Likewise, in the evaluation
of soft tissue
or organs, such as the heart, lungs, kidneys, brain, and others, under or
overdeveloped parts,
lobes, regions, chambers, vessels can be identified through visual assessment
or rules of thumb,
but without the shape of a normal or healthy anatomy as a reference, a truly
meaningful
quantification of such under or overdevelopment is not possible.
[0048] In addition, conventional methods use qualitative measurements
based on 2D
images. These measurements are not accurate as some information is lost in the
conversion of
3D objects to their 2D representation. That is, the actual patient anatomy
exists in 3D, but the
images used to plan surgeries are captured in 2D. These 2D techniques have a
poor reliability
as a result of their qualitative nature and due to variations in the imaging
protocols and
circumstances. For example, the scale of objects in a 2D X-ray depends on the
distances
between the source and the acquisition plane and between the subject and the
acquisition plane.
Similarly, parallax effects also depend on those distances and on whether the
source is static or
moving. Further, the orientation of the patient with respect to the source and
acquisition plane
influences the projection of the anatomy.
[0049] In the systems described herein, a defect or deformity is
measured from medical
images of the patient using a model of a healthy body part as a reference (or
as template). The
size of the defect can be calculated in a number of ways by measuring
distances between points
or surfaces of the actual, damaged or deformed patient anatomy and the
topological
counterparts of such points or surfaces on the reference model. Distances can,
for instance, be
measured by projecting rays from a virtual model of the healthy anatomy and
calculating the
.. distance along those rays from the healthy body part to the damaged body
part. A virtual model
of the patient anatomy can be obtained by segmenting medical images of the
actual patient
anatomy. A virtual model of a corresponding healthy anatomy can be obtained in
different
ways, as is explained below. In order to allow the user to make a visual
assessment of the
damage or deformity, 2D or 3D virtual models of the damaged or deformed body
part and the
healthy body part may be superimposed and shown to the user. One or both of
these models
may be shown in a semi-transparent way.
6
CA 03139123 2021-11-03
WO 2020/227661
PCT/US2020/032165
[0050] The reference model of normal or healthy anatomy can come from
different sources.
For example, a mirror image of a healthy contralateral anatomical part may be
used. To this
end, medical images of said contralateral anatomical part may be segmented and
the resulting
virtual model mirrored.
[0051] In some embodiments, the methods disclosed herein use 3D statistical
shape models
(SSM) to make quantitative measurements and to predict the nature of
deficiency defect or
deformity by reconstructing the healthy body part. Statistical shape modeling
may be used to
predict the native, i.e. healthy, anatomical shape without requiring (images
of) an actual healthy
bone. In such embodiments, a virtual model of the healthy anatomy can be
obtained by fitting
an SSM of a healthy anatomy to parts of the (medical images or virtual model
of the) patient
anatomy.
[0052] Generally, an SSM is a mathematical model that represents the
mean shape and
shape variations within a population. Each shape generated by the SSM can be
represented by
a number of shape coefficients, which may be referred to as the SSM
parameters.
[0053] In some embodiments, a method is performed on, for example, a 3D
virtual model,
3D biomechanical model (musculoskeletal models), SSM, and/or SSM instance, so
that there
is no approximation or conversion of measurements between a 2D representation
and the 3D
world.
[0054] As an example, a fully automated defect classification system may
be used for
describing glenoid bone loss using three-dimensional measurements on scapula
and/or
humerus models and without needing a healthy contralateral reference scapula.
In other
embodiments, the automated defect classification system can likewise be used
to measure
defects or deformities in other body parts such as the heart, knee, hip,
spine, foot, lungs, other
joints, etc.
[0055] An example method may include: (1) acquiring medical image(s) of a
patient with
a glenoid bone defect or arthroplasty; (2) segmenting the scapula to obtain a
virtual three-
dimensional surface model, for example using Mimics by MATERIALISE(); and (3)
fitting a
statistical shape model (SSM) of healthy scapulae towards the healthy surface
regions of the
patient's scapula, as depicted in FIG. 1.
[0056] Keeping with this example, the SSM should describe the healthy
scapula shape
within the population to which the patient belongs. By fitting the SSM to the
healthy portions
7
CA 03139123 2021-11-03
WO 2020/227661
PCT/US2020/032165
of the patient's anatomy, the unhealthy surface (e.g., glenoid in this
example) of the scapula
will also be reconstructed. The shape correlations embedded in the SSM will
produce a
reconstructed glenoid that statistically has the highest chance of resembling
what the original,
healthy or native shape of the now unhealthy regions would have looked like.
Example SSM Fitted to Healthy Regions of Bone
[0057] FIG. 1 depicts an example of an SSM 102 fitted to the healthy
regions of a scapula
(e.g., 104) to reconstruct its original glenoid surface 106.
[0058] Different techniques may be used for fitting an SSM to partial
data, such as healthy
anatomy, so that the missing data (e.g., bone lost to bone erosion) can be
predicted, such as
posterior shape modelling. However, such techniques require an a priori
identification of
healthy and damaged or deformed areas. This step is known to exhibit a high
inter- and intra-
user variability. Accordingly, automating this step is beneficial.
Dividing SSMs into Regions for Improving Fit Error
[0059] In one embodiment of an automated method, an SSM is subdivided in
topological
regions, such as regions 202-212 in the example of FIG. 2. For each of these
regions, it is tested
if including the region in the areas used for fitting the SSM results in a
reduced or increased fit
error. When including a certain region results in an unacceptable or increased
fit error, the
region is assumed to be damaged or deformed and is excluded from fitting. The
SSM is
subsequently fit to the subset of the remaining areas to obtain an SSM
instance, representing
what the anatomy of the patient would have looked like in healthy or non-
deformed situation.
[0060] In the example of FIG. 2, the surface of an SSM representing a
scapula is divided
into six regions: base region 202, acromion region 204, coracoid region 206,
neck region 208,
acromion tip region 210 and glenoid region 212. This is just one example, and
other
subdivisions, such as subdivisions into different regions, or subdivisions
into more or fewer
regions, are possible.
[0061] Accordingly, an example method may proceed as follows. First, the
SSM shape is
fit to the target shape based on points in the base region 202 only. After
convergence of the
shape coefficients, the fit error is computed as the root mean square error
(RMSE) between the
points on the SSM shape used for fitting and identified corresponding points
on the target
shape.
8
CA 03139123 2021-11-03
WO 2020/227661
PCT/US2020/032165
[0062] If the fit error remains below a chosen threshold, a second fit
is performed which
uses points in the acromion region 204. If then the fit error exceeds the
threshold, the acromion
region 204 of the target shape is considered as non-healthy and the acromion
region 204 is
excluded from the subset of topological regions. The same selection procedure
is subsequently
repeated for points in the coracoid region 206, the acromion tip 210, and the
neck region 208
in this example. In some cases, the glenoid region 212 may be expected to be
eroded and thus
not used for fitting.
[0063] If both the acromion region 204 and coracoid region 206 are
excluded for fitting,
for example based on fit errors exceeding a threshold, then in some cases, the
acromion tip
region 210 and neck region 208 are not further tested.
[0064] In various embodiments, different fit error thresholds may be
used. For example,
sensitivity studies have shown a fit error threshold of 1.7mm to produce good
results. Fit error
thresholds of other values, such as 0.5mm, 0.6mm, 0.7mm, 0.8mm, 0.9mm, 1.0mm,
1.1mm,
1.2mm, 1.3mm, 1.4mm, 1.5mm, 1.6mm, 1.8mm, 1.9mm, 2.0mm, 2.5mm, 3.0mm, to name
a
few, can also be chosen.
[0065] A similar approach can be applied to other anatomical structures.
Thus, to
generalize the process, an anatomical structure can be subdivided into a
plurality of topological
regions (e.g., 202-212 in FIG. 2). A first region (e.g., base region 202 in
FIG. 2) may be
selected to start the subset of topological regions, which in some cases may
be a region remote
from the defect or deformity. The first region may then be fitted and a fit
error may be
calculated and compared to a threshold, such as described above. Subsequently,
additional
topological region can be added to the subset, and the subset can then be
fitted to the target
model.
[0066] After each topological reason is added to the subset, the fit
error can be recalculated
and the additional topological region can be removed from the subset or kept
in the subset
depending on whether the fit error does or does not exceed a set threshold,
such as the
thresholds mentioned above. To speed up the process, topological regions that
are not directly
connected to the base region can be ignored if one or more regions in between
are classified as
damaged or deformed. To further speed up the process, and to improve results,
topological
regions that are known to be damaged or deformed can also be ignored.
[0067] Analyzing a bone defect (e.g., a glenoid bone defect) by
comparing its shape with
a predicted native shape (e.g., of an undamaged glenoid bone) results in
quantitative
9
CA 03139123 2021-11-03
WO 2020/227661
PCT/US2020/032165
measurements, such as, in the case of a glenoid bone, glenoid vault loss,
glenoid vault loss
percentage, glenoid erosion area, glenoid erosion area percentage, maximum
erosion depth,
and the like.
Distance Measuring Techniques for Comparing Anatomy Shapes
[0068] In one embodiment, in order to compare anatomy shapes (e.g., between
predicted
and actual shapes), distances can be measured between topologically equivalent
points on
models of each shape, such as between closest points, or between points along
rays shot from
one model to the other, to name a few options.
[0069] For example, for substantially spherical or hemispherical
anatomical parts, such as
the acetabulum 302 in FIG. 3, rays 304 may be shot in a concentric way from
the center 306
of the sphere outwards, as depicted in the example of FIG. 3.
[0070] As another example, for substantially flat or planar anatomical
parts, rays 404 may
be shot in a parallel way, perpendicular to the best-fitting plane 402, such
as depicted in FIG.
4.
[0071] As yet another example, for elongated anatomical parts, rays may be
shot outwards
and perpendicular to the central axis of the anatomical part. For other
anatomical parts, rays
may be shot perpendicular to the surface of the SSM instance. Notably, these
are just a few
options, and other ray-casting strategies or combinations of strategies are
possible.
[0072] Thus, methods described herein may automatically compute metrics
based on
SSMs, such as: glenoid vault loss (the total volume of the glenoid vault lost
due to bone
erosion), glenoid vault loss percentage (the percentage of the volume of the
glenoid vault lost
due to bone erosion), local vault loss percentages (in superior, inferior,
anterior and posterior
region), erosion area (the surface area of the glenoid cavity affected by bone
erosion),
maximum erosion depth (the maximum distance measured between the actual
anatomy surface
and the healthy reference model), erosion area percentage (the percentage of
surface area of
the glenoid cavity affected by bone erosion), subluxation distance, and
others. Notably, while
a glenoid is used as in example herein, similar metrics may be calculated for
other anatomical
parts, such as other bones, joints, and the like. Based on this computation,
the systems described
herein may automatically classify a defect.
CA 03139123 2021-11-03
WO 2020/227661
PCT/US2020/032165
Example of Measuring Metrics Associated with Bone Loss
[0073] Using a glenoid bone as an example, the glenoid vault loss
percentage metric
indicates how much of the glenoid vault volume has been eroded and represents
the severity of
the glenoid bone defect. The superior, anterior, inferior and posterior vault
loss percentages
express how much of the vault has been eroded in each anatomical region or
quadrant of the
glenoid, giving a better understanding of the shape of the defect. The maximal
erosion depth
describes the amount of bone erosion at the deepest point of erosion. This
measure can help
surgeons to decide if they should ream or use bone graft during surgery. The
erosion area
percentage shows how much of the native glenoid surface is no longer intact,
giving an
indication on the amount of possible implant-bone support. Finally, the
subluxation distance
and region describe the amount and direction of humeral subluxation, which
gives a better
understanding of the cause of the glenoid bone defect.
[0074] FIG. 5 depicts an example for measuring metrics associated with
bone loss in a
glenoid bone.
[0075] To measure these metrics, a ray-casting algorithm (as described
above) can be used.
For example, first, a plane (e.g., 506) is fitted through the glenoid surface
of the fitted SSM
and parallel rays are cast from the glenoid points of the fitted SSM shape in
the opposite
direction of the plane normal. The distance at which a ray i intersects the
fitted SSM shape is
called the vault depth (d,""it) (e.g., 502), with crax (e.g., 504) as a chosen
maximum value.
[0076] Then, the amount of bone erosion is assessed by shooting rays (e.g.,
502 and 506)
from the glenoid points of the fitted SSM shape towards the bone defect and
parallel to the
glenoid plane normal. The measured distances at which the rays intersect the
bone defect is
defined as the erosion depth (d, ) (e.g., 506), being limited to d' (e.g.,
504). If the erosion
depth is infinite, there is simply no bone present at that location. Next, the
loss depth (chl's) is
defined as the depth of the vault that is lost. The loss depth is similar to
the erosion depth,
except that it cannot exceed the vault depth.
[0077] Thus, in one example, for each ray i:
if chvault>
a : then cli'lt=d'
if chero>dmax
and diem* inf: then diem=dmws
if chero<chvault : then chl ss=chero
11
CA 03139123 2021-11-03
WO 2020/227661
PCT/US2020/032165
if chero>chvault: then diloss=divault
[0078] Based on the depth measurements, the nine parameters that
describe the glenoid
bone defect can be computed.
[0079] For example, the vault volume is computed as the sum of all vault
depths multiplied
by the size of the corresponding surface elements (AO. Similarly, the vault
loss volume is
computed as the sum of the loss depths, multiplied by the corresponding
surface areas. Then,
the vault loss percentage is calculated as the percentage of the vault loss
volume compared to
the vault volume.
[0080] For the superior (sup), anterior (ant), inferior (inf) and
posterior (post) vault loss
percentages, the glenoid surface is divided in four quadrants, using the
glenoid center point.
The vault loss percentages in these regions equal the local vault loss volume,
divided by the
local vault volume.
[0081] Next, in one example, the maximum erosion depth is computed as
the 95-percentile
value of all erosion depth values. The erosion area is computed as the area of
all surface
elements A, that encountered an erosion depth of more than one third of the
maximum erosion
depth. To obtain the erosion area percentage, in one example, the erosion area
is divided by the
total area of the glenoid. After projecting the humeral head center point to
the glenoid plane,
the subluxation distance is computed as the in-plane distance from the humeral
head center
point to the glenoid center point. The subluxation region is defined as the
region (sup, ant, inf,
post) on which the humeral head center point is projected on the glenoid.
[0082] Accordingly, in one example:
vault volume = E (chvatilt.A0
vault loss volume = E (chioss.A)
vault loss percentage = (vault loss volume)/(vault volume)
local vault volume = E (chA )vault. A iµ
for all i in region
local vault loss volume = E (chlO A )SS 1\ ,
for all i in region
local vault loss percentage = (local vault loss volume)/(local vault volume)
max erosion depth=p95(chero)
12
CA 03139123 2021-11-03
WO 2020/227661
PCT/US2020/032165
erosion area = E , A, , for all i with d,'>1/3 max erosion depth
erosion area percentage = (erosion area)/( E A,)
[0083] In some examples, multiple classification systems may be
combined, such as the
Wallace classification in the axial view and the Antuna classification in the
frontal view (as
above), which beneficially provides a user (e.g., a surgeon) a three-
dimensional classification
of the defect compared to the conventional two-dimensional classifications.
[0084] Notably, similar quantification can be performed on other
anatomical parts, such as
other joints, other bones, organs (heart, lungs, kidneys, brain, and others)
to evaluate damage,
deformity, or disease. Based on this quantification, similar classification
systems can be
defined. The system and the method uses an appropriate and/or known
classification system or
combinations thereof, based on the body part that requires treatment.
Pre-Operative Surgery Planning Tools
[0085] Existing pre-operative planning tools, such as the SurgiCase Knee
Planner by
MATERIALISE , offer the possibility of generating a pre-operative surgical
plan for a
specific type of surgery (generally involving a specific type, brand, or
product line of implants).
Pre-operative planning generally starts after important surgical decisions
have been made by a
surgeon, such as: type of surgical treatment, type of implant and type of
surgical instruments
to be used, standard implant versus patient-matched, etc.
[0086] Further, these decisions are based on medical images taken from
the patient. For
orthopedic treatments, for example, those medical images may depict damaged
bone/cartilage
anatomy. Existing planners generate an initial or default plan based on the
damaged anatomy
(e.g., bone and/or cartilage), which is then reviewed by the surgeon. Upon
review, the surgeon
may propose certain changes, such as: position or size of the implant, that
are then incorporated
by the planner and a new pre-operative plan is generated for use during the
actual surgical
procedure.
[0087] Unfortunately, as existing planners only take medical images as
input, the pre-
operative plan only takes information into account that is visible in those
medical images. The
pre-operative plan does not address any aspects that cannot be readily derived
from the medical
images or all the complexities associated with the surgery that a surgeon
encounters in an
13
CA 03139123 2021-11-03
WO 2020/227661
PCT/US2020/032165
operating room, which might affect the surgical outcome, the risk of intra-
operative or post-
operative complications, or patient satisfaction.
[0088] A surgical planning system may use more than patient-specific
medical images by
using an aggregate prediction technique that is based on one or more known pre-
operative plan
sets. For example, such a planning system may source historical data from pre-
operative plans,
data gathered intra-op, and data gathered post-op. Further, the planning
system may select pre-
operative plans into a pre-operative plan set and then apply prediction
techniques, such as
machine learning, deep learning, neural networks, or other artificial
intelligence (AI)-based
techniques, to create aggregate pre-operative plans and suggest changes to a
user. However,
this method of pre-operative plan generation is generally not transparent to
the surgeon, i.e. the
surgeon does not know how or why the planner incorporated the proposed
changes, which
characteristics of the particular patient lead to the suggested changes, how
sensitive the system
is to those characteristics, or the impact of those changes on the patient
beforehand. Thus, while
the system itself may be self-learning, it does not allow the surgeon to make
informed
decisions.
[0089] The systems disclosed herein overcome the drawbacks of existing
surgical planning
tools by providing a surgeon with more information and serving as a guide to
the surgeon. As
a guide, embodiments of the systems described herein provide timely
suggestions, advice, and
warnings along with detailed information substantiating such suggestions,
advice and
warnings, allowing a surgeon to make informed decisions. The control of the
system lies with
the surgeon such that the surgeon can consciously make every decision, making
it a transparent
and user-friendly system. The systems disclosed herein beneficially reduce the
time spent in
the operating room and the changes that the surgeon has to address in the
operating room, and
increase the likelihood of a positive surgery outcome, thus overall reducing
the number of
revision surgeries that a patient may need.
[0090] Systems described herein may use multiple feedback loops to
provide information
to the surgeon by way of suggestions, warnings, advice and/or default pre-
operative plans
which also involve establishment of one or more interconnected databases.
Surgical Planning Workflows
[0091] Surgical planning methods (e.g., performed by surgical planning
systems described
herein), may include a plurality of steps, including: (1) loading medical
images; (2) processing
14
CA 03139123 2021-11-03
WO 2020/227661
PCT/US2020/032165
the medical images, for example to identify anatomical landmarks and/or create
one or more
virtual 3D models of the anatomy; (3) automatically creating a default
surgical plan, which is
generally based on a number of geometric calculations based on the identified
landmarks and
typically comprises a selection of one or more implants, implant sizes,
locations and
orientations for all implants, the corresponding resections or reaming steps,
etc.; (4) allowing
the clinician to alter the default plan to obtain an approved pre-op plan; and
(5) making the pre-
op plan available for execution in surgery. In some embodiments, the pre-op
plan can, for
example be used in a navigation system, a robotics system, to design patient-
specific guides,
in augmented and/or virtual reality systems, and for other purposes.
[0092] For example, FIG. 6 depicts a workflow of conventional surgical
planning methods
and tools including steps 602-618.
[0093] A database or other data store may be used to store the approved
plans together with
related patient data, such as the medical images and any virtual 3D models and
landmark
information in a database. Additionally, the systems described herein add one
or more feedback
.. loops to the workflow depicted in FIG. 6.
[0094] For example, a first feedback loop 702, as depicted in FIG. 7,
may mine information
from the approved pre-op surgical plans for use before or in the planning step
and store it in a
database 708. A second feedback loop 704 may gather information intra-
operatively, store the
data in the database 708, and mine that information for use before or in the
planning step. A
third feedback loop 706 may gather information post-operatively, store the
data in the database
708, and mine that information for use before or in the planning step.
[0095] A further improvement to the data flow described in FIGS. 6 and 7
is shown in
FIG. 8, wherein the historical data available in the database is used to
perform a historical-data
analysis 802, relating either patient characteristics to planning decisions,
or one or more
planning parameters to surgery outcomes. Further, the results of this
historical-data analysis
may be presented to a user (e.g., a surgeon) in such a way that the location
of the patient within
the population or the planning parameters are shown together with the
distribution of the
planning decisions or surgery outcome, respectively, over the population
(e.g., at 804).
Beneficially, presenting this information does not force the user to blindly
choose between
accepting and declining a suggested plan alteration. Rather, it shows the user
what planning
decision options or parameter values are appropriate and to what degree they
are more
appropriate than other options or values with the possible post-op scenarios.
CA 03139123 2021-11-03
WO 2020/227661
PCT/US2020/032165
[0096] For example, when considering options A, B, and C, the system
does not simply
suggest: "Take option A", but may show how the patient population is
distributed over options
A, B, and C and where the patient lies within the population. From the
representation of the
results of the historical-data analysis, the user can not only see if the
patient sits squarely in
option A, or rather on the border between options A and B, but also whether
that border is a
sharply defined one or rather a broad range with a smooth transition.
Surgical Planning Data and Databases
[0097] Systems described herein may utilize one or more databases, which
are connected
to different parts of the surgical planning system via one or more feedback
loops. For example,
data may be collected at one or more stages of the workflow, as described
above with respect
to FIG. 7, and stored in a database.
[0098] In some implementations, the data collected may be divided
(logically or
physically) into subsets, such as patient data, pre-operative data, including
collection of pre-
existing plans (i.e. already used pre-operative plans for future pre-operative
plan optimization),
retrospective data, intra-operative data, and post-operative data. Links
between data in different
subsets but related to an individual patient are maintained; in other words,
the database keeps
track of which patient data, pre-operative plans, intra-operative data and
post-operative data
belong to the same patient. As above, the data may be stored in a single
database or in different
databases.
[0099] Which of these types of data is stored in the database(s) depends on
which feedback
loops are implemented in the system. Some subset of patient data is always
stored. However,
a basic system may, for example, only implement the feedback loop of approved
pre-op plans.
Other systems may also implement the feedback loops of the intra-operative
data and/or the
post-operative data. Other combinations are possible. One or more feedback
loops may be
invoked at a certain time. In some embodiments, in case of revision surgeries,
all feedback
loops may be invoked to get the entire patient profiled from previous
surgeries.
[0100] In some embodiments, the systems described herein may run locally
or "on-
premises", in which case the database(s) may contain only data relating to one
or more local
users, such as surgeons, physicians, or clinicians or their teams. In other
embodiments, the
system may be a network-based system, such as a web-based system or a cloud-
based system,
in which case the database(s) may contain data relating to a larger user base.
16
CA 03139123 2021-11-03
WO 2020/227661
PCT/US2020/032165
[0101] Patient data may be stored in the form of one or more of medical
images, personal
information, such as age, sex, weight, height, ethnicity, lifestyle, activity
level, medical history,
and any data gathered during pre-surgical exams, such as complaints, pain
scores, gait
measurements, range-of-motion measurements, degenerative or congenital
defects, sports or
age-related injuries, genetic information, dental casts, and others. In some
embodiments,
patient data may be anonymized to protect patient privacy or to comply with
various patient
privacy regimes, such as the Health Insurance Portability and Accountability
Act (HIPAA) or
General Data Protection Regulations (GDPR).
[0102] Pre-operative data may be stored, for example, in the form of pre-
operative
treatment plans (e.g., 614 in FIGS. 6-8), which may be alternatively referred
to as pre-op plans
or pre-op surgical plans. Pre-operative data may capture some or all medical
decisions related
to treatment of a patient's medical condition, such as one or more of: type of
treatment (both
invasive and non-invasive treatment); types, brands, product lines, sizes,
implantation locations
and orientations of planned implants, if any; delivery systems and approaches
of any implants;
designs of patient-specific instruments, if any; details of any reaming steps;
types or designs of
any defect-filling components, such as autografts, allografts, porous
structures, and other
aspects.
[0103] Intra-operative data (e.g., 710 in FIGS. 7-8) may be stored in
the form of any data
captured during surgery, such as measurements, the locations of intra-
operatively identified
.. anatomical landmarks, observations, or the occurrence of intra-operative
complications. The
intra-operative data may relate to information that cannot be easily derived
from medical
images or pre-surgical exams, such as information relating to soft tissue,
muscles, muscle
attachment points, muscle ruptures, tendons, ligaments, ligament tension, etc.
Intra-operative
data may also comprise any changes made during surgery with respect to the pre-
op plan. Intra-
operative data may also include synthetic data, which in one example, may be
data that cannot
be quantified but can be noted down due to its influence on surgery outcome
such as ligament
forces in case of knee. This may be stored in the form of biomechanical
models.
[0104] Post-operative data (e.g., 618 in FIGS. 6-8) may be stored in the
form of any data
captured after surgery, such as the occurrence of any complications, any data
captured during
.. post-surgery exams, pain scores, patient satisfaction, functional scores,
revision surgery, post-
surgery imaging, recovery time, rehabilitation time, rehabilitation method of
treatment, details
and observations of the physiotherapist; if any, range of motion measurements,
and the like.
17
CA 03139123 2021-11-03
WO 2020/227661
PCT/US2020/032165
[0105] Data may be entered into the system either manually or
automatically through the
surgical planning system, through any devices used during surgery, such as
navigation systems,
robotics systems, or augmented reality (AR) or virtual reality (VR) systems,
through an
electronic access device, through wearable devices, or through sensors
embedded in implants
or chips embedded in the patients. Notably, these are just a few examples.
[0106] The example surgery planning systems described herein may
implement the
automated defect quantification system discussed above. Based on the defect
classification and
description, the surgery planner provides additional valuable information to
the surgeon to help
plan and execute the surgery.
Acquisition of Patient Data
[0107] Patient data may be loaded from a file, storage medium or
database or entered
manually into the system. If the patient has previously undergone surgery, his
old file may be
recalled from the database. If not, a new case file or record is generated.
[0108] For many applications, medical images will be a valuable part of
the patient data.
[0109] Data processing: Patient data may be processed. For example, medical
images may
be converted into one or more virtual 3D models of anatomy parts, such as bony
anatomy,
cartilage, organs, organ walls, blood pool volume, and others. Anatomical
landmarks may be
determined or indicated in the medical images or in the virtual 3D models.
This may be done
manually or automatically, e.g. by means of feature-recognition techniques.
Further
information may be derived from the medical images, such as bone density
information, bone
loss, impingement of bone-to-bone contact, spread/extent of the defect on the
surrounding
anatomy, adjoining and attached soft-tissue characteristics such as muscles,
ligaments,
cartilage, tendons, meniscus, thickness of soft tissues, etc. Additionally,
biomechanical models
may also be generated to demonstrate musculoskeletal data such as bony anatomy
along with
soft-tissue data that may be further simulated.
[0110] In some embodiments, defects or deformities are quantified and/or
classified as
described above.
Default Treatment Plan Creation
[0111] In some embodiments, surgical planning systems as described
herein may be related
to a specific surgery and/or to a specific type, brand or product line of
implants. Additionally,
18
CA 03139123 2021-11-03
WO 2020/227661
PCT/US2020/032165
unlike conventional systems, the systems described herein may support more
important,
higher-level treatment decisions, such as: type of treatment, including
invasive treatment, non-
invasive treatment, or referral. Further treatment decisions may include type
of implant since
many pathologies can be treated with different types of implants, such as off-
the-shelf,
customized, or custom implants or combinations thereof. For example, for
joints: cartilage
repair, resurfacing, or replacement; partial or total (e.g. unicondylar/total
distal femur implant,
unicompartmental/total proximal tibia implant); fixation strategy
(cemented/non-cemented,
stemmed/stemless, press fit, screws); functional strategy (e.g. posterior- s
tabilized/cruciate-
retaining femur implant, anatomical/reversed shoulder implant); acceptable
range of motion;
and others may be considered. For cardiac applications: valve repair,
stapling, replacement,
ring annuloplasty, type of stent, and others aspects may be considered. For
craniomaxillofacial
applications: orthognathic, reconstructive, trauma, TMJ, dental aveolar type
of surgical
procedures, treatment of maxilla or mandible or both, orbital floor, or parts
of the cranium, and
other relevant aspects may be considered.
[0112] For pulmonary applications: intraluminal and extraluminal stent,
type of valve, and
other aspects may be considered.
[0113] For type of instrumentation or guidance: conventional
instrumentation, patient-
specific guides, navigation systems, AR system, robotics systems, and others
may be
considered.
[0114] To support these decisions, the surgeon may be presented with
additional relevant
information to understand the defect in more detail, such as the information
or models derived
from the medical images and/or the results of the defect or deformity
quantification and
classification as described above. For example, the surgeon may be presented
with the results
of the quantification and classification, and/or with a visual representation
of the defect or
deformity by means of a superposition of a virtual 3D model of the actual
patient anatomy and
a model representative of healthy anatomy, such as from fitting an SSM to
parts of the patient
anatomy. One or more models may be shown in a semi-transparent way, such as
described
above. A biomechanical model simulation may also be shown alongside the
virtual 3D SSM
model.
[0115] As a further support for these decisions, the system may run one or
more population
analyses based on the historical data gathered in the database through the one
or more feedback
loops. Such an analysis may relate one or more patient characteristics to one
or more of the
19
CA 03139123 2021-11-03
WO 2020/227661
PCT/US2020/032165
treatment decisions. Thus, the system may utilize 1) a selection of a
population, 2) a selection
of a treatment decision to support and 3) a selection of one or more patient
characteristics to
characterize the members of the population and the patient to be treated.
These selections may
be left to the user, for example by means of drop-down boxes or check boxes in
a user interface.
Alternatively, the system may present the user with one or more pre-programmed
combinations
of selections, for example in a wizard-style process. Correlation analyses may
reveal which
patient characteristics may be relevant for which treatment decisions.
Alternatively, the system
may first track user behavior and subsequently present the most common
combinations by
default. For example, an AI-based system may learn about the frequently chosen
decision
influencers and during future pre-operative planning stages, display them to
the surgeon at
appropriate times. Alternatively, an AI-based system may learn the correlation
between certain
characteristics, notably 'best characteristics' and their influence on
treatment decisions and use
them to optimize and thereby provide treatment options based on 'best'
characteristics or based
on surgeon's preference of "best characteristics."
[0116] Regarding the selection of a population, a historical-data analysis
may be based on
all records in the database or on a subset of records. For example, the
population may be limited
to only those records that are complete enough, i.e. records that contain the
appropriate data
needed for the analysis. The population may also be limited to patients that
have one or more
characteristics in common with the patient to be treated, e.g., sex, age,
ethnicity, and others.
The population may also be limited to only those patients that have been
treated in the same
country, in the same hospital or by the same clinician, physician, surgeon,
school of thought,
or the like.
[0117] The historical-data analysis may reveal how the selected
population is distributed
over the different options for a selected treatment decision. The members of
the population are
characterized by means of the selected patient characteristic(s). The patient
to be treated may
be positioned through his/her specific patient characteristic(s) within the
analyzed population,
so that it may be revealed which decision option, according to the historical
data in the database,
would seem the most appropriate for this particular patient. Alternatively, at
the same instance,
the system may show a comparative analysis based on the system chosen "best"
characteristic(s), if it differs from the selected patient characteristic(s),
thereby allowing the
user to re-evaluate his decision.
CA 03139123 2021-11-03
WO 2020/227661
PCT/US2020/032165
[0118] In some embodiments, the historical-data analysis may relate one
or more treatment
decisions to an expected occurrence of an intra-operative or post-operative
event, observation,
or outcome. The historical-data analysis may, for instance, reveal how the
chance or risk of a
certain event, observation or outcome happening increases or decreases with a
certain pre-
operative plan parameter.
[0119] For example, the historical-data analysis may relate the chosen
size of a heart valve
with the risk of leakage, or may relate a chosen amount of lateralization of a
shoulder implant
with the risk of acromion fracture.
[0120] In certain embodiments, the historical-data analysis may make use
of retrospective
data containing data acquired from high-level surgeons or key opinion leaders
(KOLs) and
provide it to new or low-level surgeons to guide their decisions such as bone
defect data,
mimicking the treatment options or providing their used or preferred treatment
plans to low-
level surgeons. In some embodiments, retrospective data may contain
information provided
and used by a school of thought (e.g., surgeons using the same plan or
treatment options or
other aspects).
[0121] This type of analysis can be made more accurate or more relevant
to the patient to
be treated by limiting the population to those patients that show a similarity
to the patient to be
treated, for example regarding one or more patient characteristics. This type
of historical-data
analysis may require: 1) a selection of zero or more patient characteristics
to limit the
population; 2) a selection of one or more types of events, observations or
outcomes; and 3) a
selection of one or more treatment decisions. As before, these selections may
be left to the user,
for example through drop-down boxes or check boxes in the user interface.
Alternatively, the
system may present the user with one or more pre-programmed combinations of
selections, for
example in a wizard-style process. Correlation analyses may reveal which
events, observations
or outcomes may be relevant for which treatment decisions. Alternatively, the
system may first
track user behavior and subsequently present the most common combinations by
default. For
example, an AI-based system may learn about the frequently chosen decision
influencers and
during future pre-operative planning stages, display them to the surgeon at
appropriate times.
[0122] Regarding the selection criteria of the population, the
population should preferably
be limited to members that show a similarity to the patient to be treated.
This similarity can
relate to one or more patient characteristics.
21
CA 03139123 2021-11-03
WO 2020/227661
PCT/US2020/032165
[0123] For example, in the case of heart-valve leakage, those patient
characteristics can be
a set of measurements describing the shape of the anatomy surrounding the
valve, such as
smallest and largest diameter of the annulus.
[0124] As another example, in the case of acromion fracture, the patient
characteristics can
include information regarding bone density as derived from a CT scan or the
results from the
defect quantification and classification described above.
[0125] For those analyses where the result is known or suspected to
depend on the shape
of the patient anatomy, the patient characteristics can include the parameters
or a subset of the
parameters of an SSM fit to a part of the patient's anatomy. These parameters
or such a subset
form an n-dimensional vector describing the patient's shape in an n-
dimensional space
encompassing all possible shape variations. The population for the historical-
data analysis may
therefore be limited to all members whose corresponding n-dimensional vectors
fall within a
certain pre-set distance from the patient to be treated.
[0126] The results of the historical-data analysis may be presented in
different ways, some
examples of which are described below. Example embodiments of population
analyses are also
described below.
[0127] As an alternative to a historical-data analysis, the system may
also locate within a
selected population the member that most closely matches the patient
characteristics of the
patient to be treated and display the decision options chosen for that member.
[0128] Once the high-level treatment decisions have been made, either with
or without the
use of a decision-support process as described above, the systems described
herein may create
a default pre-operative plan for the patient to be treated. This plan will
typically rely on one or
more algorithms or heuristics that compute treatment parameters, such as:
implant position and
orientation, based on patient data and processed patient data.
[0129] For example, the SurgiCase Knee Planner uses a geometric algorithm
based on
anatomical landmarks identified on virtual 3D models of a patient's femur and
tibia to compute
local anatomical coordinate systems, and default sizes, locations and
orientations with respect
to the patient anatomy of a femur implant and a tibia implant. For certain
input parameters of
such algorithms, general, population-wide values may be utilized.
Alternatively, values may
be chosen ¨ manually or automatically ¨ based on support from decision-support
processes as
described above.
22
CA 03139123 2021-11-03
WO 2020/227661
PCT/US2020/032165
[0130] For example, for total knee arthroplasty, a default value of
varus correction to 30
varus may be used for all patients, a historical-data analysis may suggest a
certain value for the
varus correction, or the value for the varus correction of the closest-
matching member of the
population may be used. Thus, the decision-support processes of the present
invention may be
used both for high-level treatment decision and for lower-level, treatment-
specific decisions.
[0131] The historical data gathered through the one or more feedback
loops may also be
used to improve automatically created default plans or to create new, default
plans. For
example, AI-based techniques, such as machine learning, deep learning, neural
networks and
the like, may be used to incorporate changes that are often or consistently
made in the planning
step or during treatment into the default plans. In addition, information
about intra-operative
or post-operative complications may be used to include some changes and ignore
other
changes.
Modifying Treatment Plans
[0132] Once a default plan has been made, it is presented to a user for
further fine tuning.
The user may be presented with the possibility of altering one or more
treatment plan
parameters. For example, the user may have the possibility to change an
implant size, an
implant location or implant orientation.
[0133] In the planning step, the system may support the decisions of the
user by means of
the decision-support processes described above.
[0134] The result of the planning step is an approved pre-operative plan,
i.e. a treatment
plan that the clinician has decided to execute.
[0135] In some embodiments, the system includes a feedback loop storing
all approved
pre-operative plans in the database. The information gathered in this way can
be used as
historical data to feed the decision-support processes. For example, running
population
analyses on the approved pre-operative plans of the user will tell the user
what changes or
parameter values lie within his past practice or experience. In contrast,
running population
analyses on the approved pre-operative plans of all users will allow the user
to learn from the
accumulated experience of a much larger group of people, or to compare his
personal practice
to the average practice of all users. Other options are possible, such as
limiting the historical
data to the approved pre-operative plans of all users of the same hospital, or
all users of the
same country.
23
CA 03139123 2021-11-03
WO 2020/227661
PCT/US2020/032165
Patient Treatment According to a Treatment Plan
[0136] Once an approved pre-operative plan has been made, the clinician
may proceed to
its execution, i.e. treating the patient. In some ¨ mainly non-invasive ¨
treatments, the pre-
approved treatment plan may take the form of a prescription, such as for
medication or exercise.
In other ¨ mainly invasive ¨ treatments, the pre-approved treatment plan may
take the form of
a data file that may be used in a surgical guidance system. For example, the
plan may be used
to design and manufacture patient-specific instruments that help a surgeon
realize a planned
surgical outcome during surgery. Alternatively, the plan may be loaded into a
surgical
navigation system or an AR system to display guidance information to the
surgeon during
surgery. Alternatively, the plan may be loaded into a robotics system, to
automatically or semi-
automatically execute part of the surgery.
[0137] The system may comprise a feedback loop to store intra-operative
data in the
database. This may comprise any of the aforementioned intra-operative data.
The data can be
gathered automatically by means of sensors in the operating room, by means of
specialized
.. surgical equipment, by means of surgical guidance systems, such as
navigation systems, AR
systems or robotics systems, or can be entered manually through an electronic
access device.
[0138] For example, the system may prompt the surgeon to store any intra-
operative
changes or complexities encountered during the surgery. This information can
be about
implants, the surrounding patient anatomy, the actual implant and surgical
instrument used,
synthetic data that cannot be measured but is vital, etc. The system may also
act as a notebook
for the surgeon to note down any relevant information about the patient
anatomy which may
be useful at a later stage. This data is stored in the database for two
purposes: 1) to complete
the patient case file; and 2) to optimize future pre-operative plans.
[0139] The information gathered in this way can be used as historical
data to feed the
decision-support processes described above. For example, capturing intra-
operative
measurements and observations allows presenting statistical information to the
user in the steps
before approving the pre-op plan about patient characteristics that cannot be
deduced from the
available medical images or can only be measured in an invasive way, such as
ligament tension,
the occurrence of infections or damage to soft tissues, etc. As another
example, capturing
information regarding intra-operative complications allows presenting
statistical information
to the user in the steps before approving the pre-op plan about the likelihood
of such
complications. Finally, capturing any changes made to the operative plan, or
any departures
24
CA 03139123 2021-11-03
WO 2020/227661
PCT/US2020/032165
from the approved pre-op plan allows replacing or extending the decision-
support process
described under "Planning step" from presenting information about choices
being made during
the planning steps to choices being made during surgery.
Post Treatment Data Gathering
[0140] After the treatment, more information may be gathered and captured
through a
feedback loop, such as post-operative medical images, virtual 3D models based
on such
images, post-operative measurements, functional measurements, pain scores,
functional scores,
patient satisfaction information, information about post-operative
complications, activity data,
information about revision surgery... The data can be gathered automatically,
for example by
sensors embedded in one or more implants or wearable devices, or entered
manually in an
electronic access device.
[0141] The information gathered in this way can be used as historical
data to feed the
decision-support processes described above. For example, it allows presenting
statistical
information to the user in the steps before approving the pre-op plan about
actual surgical
outcome, potential complication risks, implant life expectancy or patient
satisfaction.
Ineffective Treatment Plan Elimination
[0142] A special form of intra-operative or post-operative feedback loop
gathers intra-
operative and post-operative information regarding complications and uses it
to classify, tag or
flag less effective pre-op plans, for example based on how much the execution
of the surgery
diverted from the pre-op plan based on certain threshold (may be user-
defined), on the severity
of the complications or the life span of an implant. This feedback loop allows
further optimizing
automatically created default plans by eliminating the least effective
treatment plans from the
training data for AI-based techniques generating such default plans. This
feedback loop also
allows improving the decision support systems by eliminating the least
effective treatment
plans from the data used in historical-data analyses.
[0143] A very basic form of elimination feedback loop allows the user to
manually flag
pre-op plans or treatment plans that should not be included in any training
data or historical-
data analyses.
Presenting Results of Historical Data Analysis
CA 03139123 2021-11-03
WO 2020/227661
PCT/US2020/032165
[0144] The information generated as part of the decision-support
processes may be
presented to the user in any practical way. For example, when supporting a
decision involving
a limited number of discrete options or discrete parameter values ¨ such as
the choice between
a number of treatment options or available implant sizes ¨ distribution graphs
or histograms
may be shown for each of these options with one patient characteristic as
independent variable.
The value of the patient characteristic for the specific patient to be treated
may be indicated on
the graph by means of a mark on the independent axis, so as to show to the
user which decision
option seems most appropriate for the patient based on historical data.
[0145] For example, FIG. 9 depicts an example of results of historical-
data analysis
represented in the form of distribution plots 902-906. The location of the
patient to be treated
within the patient population is indicated by the vertical line 908. From this
the user may derive
that Treatment B seems most appropriate.
[0146] This represents an important improvement over conventional
systems that merely
present the user with suggestions for discrete treatment options or discrete
parameter values.
For example, in FIG. 9, the results of a historical-data analysis are
presented to the user,
preferably in an intuitive way. Specifically, in FIG. 9, the user does not
just get the suggestion
"Treatment B". The user also sees where the patient lies within the patient
population, and
whether there are sharp or smooth transitions between different options. For
example, the user
can derive from the graph that Treatment B seems most appropriate, but also
that Treatment A
might be a likely contender and Treatment C is not. If the surgeon has other
medical or non-
medical reasons to prefer Treatment A over Treatment B, such as treatment cost
or his own
lack of experience with Treatment B, the system of the present invention would
not simply
suggest Treatment B, but also teach the user that Treatment A is a viable
option and
subsequently provide the user with all the relevant information for Treatment
A.
[0147] Alternative representations are possible. For example, the data of
the graph above
may also be shown as area or bar charts. Alternatively, it may be shown in a
gradient (e.g.,
color gradient) plot, where each of the decision options is represented by a
particular color,
pattern, or intensity (e.g., a greyscale) and the distribution of the
population over the decision
options is represented by mixing proportionate amounts of the respective
colors, patterns, or
intensities.
[0148] For example, FIG. 10 depicts an example of results of historical-
data analysis
represented in the form of a color plot. The location of the patient to be
treated within the
26
CA 03139123 2021-11-03
WO 2020/227661
PCT/US2020/032165
patient population is indicated by a white dot. From this the user may derive
that Treatment B
seems most appropriate.
[0149] From the plot in FIG. 10, a user may derive similar information
as from the
distribution graphs described above. Specifically, the user may derive the
patient's location
within the population, how the population is distributed over different
treatment options or
parameter values and, by looking at the color gradients, whether there are
smooth or sharp
transitions between those options and values. It may be harder to derive
numerical values from
a color plot, but a color plot may be more intuitive to interpret.
[0150] In other embodiments, analyses relating discrete options to two
patient
characteristics may be presented by other visual means, such as 3D bar graphs
or other 2D plots
(e.g., using colors, patterns, intensities, or other visual references).
[0151] As another example, the results of a historical-data analysis
supporting the choice
of a continuous-value parameter ¨ such as varus correction for a knee implant,
lateralization of
a shoulder implant, implantation depth of a heart valve or a patient
satisfaction score ¨ can be
presented by means of a line graph.
[0152] For example, FIG. 11 depicts an example of results of historical-
data analysis
represented in the form of a line plot 1002. The location of the patient to be
treated within the
patient population is indicated by a vertical line 1004. From this the user
may derive that a
value between 0.1 and 0.2 for Parameter A seems most appropriate.
[0153] Examples, such as FIG. 11, represent an improvement over
conventional systems
that merely present the user with suggestions for continuous parameter values.
For example,
based on FIG. 11, the user does not just get the suggestion "0.15". Rather,
the user also sees
where the patient lies within the patient population, and whether within the
general location of
the patient the parameter is very sensitive to the patient characteristic. For
example, the user
can derive from the graph that a value for Parameter A of 0.15 seems most
appropriate, but
also that among patients similar to the patient to be treated, there is no
great variation in the
value of Parameter A. To give even more information, the line graph can also
show a
confidence interval, e.g. by means of vertical bars (so-called "whiskers") or
a shaded area round
the value curve.
[0154] As another example, the results of a historical-data analysis
linking the chance or
risk of an intra-operative or post-operative event, observation or outcome to
a treatment
27
CA 03139123 2021-11-03
WO 2020/227661
PCT/US2020/032165
decision or parameter may also be shown in graphs, area charts or bar charts ¨
optionally with
confidence intervals ¨ or in color or patterned plots. In the same way as the
location of the
patient within a population is displayed in the examples above, the current
selection for a
decision option or parameter value may be displayed. In some embodiments, the
graph, chart
or color plot may be displayed together with a depiction of the patient's
anatomy and/or any
devices, instruments or implants forming part of the planned treatment, such
as 2D or 3D
images, line drawings, medical images or virtual models. Graphs, charts, color
plots and
depictions may all be interactive, and changes made in one may be
automatically reflected in
the other.
[0155] For example, FIG. 12 depicts an example of results of historical-
data analysis
represented in the form of a bar chart. Here, the risks of two complications
are related to a
chosen device size. The currently chosen device size is indicated by means of
a circle 1202,
but other means are possible, such as by means of the opacity, saturation,
color, pattern, or the
like of the bars in the chart. From this the user may derive that device sizes
3 and 4 seem most
appropriate.
[0156] FIG. 13 depicts yet another example of results of historical-data
analysis
represented in the form of a color plot. Here, the risks of two complications
are related to a
chosen parameter value. The currently chosen parameter value is indicated by
the circle 1302.
From this the user may derive that the chosen value lies within the safe zone.
[0157] The various methods of displaying decision support data in the
example figures
described herein represent an important improvement over conventional systems
that merely
present the user with suggestions for decision options or parameter values.
For example, from
the representations shown in FIGS. 12 and 13, the user does not just get the
suggestion "Device
size 3" or "Parameter X = x". Rather, the user also sees what the implications
are of diverting
from the suggestion, how great the chance of an outcome or risk of a
complication is, how
sharply that chance or risk increases or decreases when changing decision
options or parameter
values, and therefore how much leeway the user has in varying decision options
or parameter
values. For example, the user can derive from the plot that the current value
for Parameter X is
within the safe zone, but also that, whereas it may be safe to increase that
value slightly,
decreasing it does not seem advisable. One or more such historical-data
analysis
representations may be displayed to the user at any given instance.
Example Application: Shoulder Treatment Decision Support
28
CA 03139123 2021-11-03
WO 2020/227661
PCT/US2020/032165
[0158] Different treatments are available for shoulder-related
complaints, depending on the
pathology. For example, shoulder arthritis may be treated with rest,
medication, corticosteroid
injections, arthroscopic debridement, hemiarthroplasty, resection
arthroplasty, total
(anatomical) shoulder replacement (TSA), reverse shoulder replacement (RSA),
and others.
Depending on the complexity of the pathology or treatment, some physicians may
also choose
to refer the patient to a colleague or another hospital or follow the
treatment option of one of
the known peers.
[0159] The systems and methods of the present invention can assist the
physician in
deciding on a treatment based on patient characteristics and historical data.
[0160] For example, based on medical images of the bone and/or cartilage
anatomy of the
patient, such as CT or MRI images, a virtual 3D model of the anatomy of
patient's shoulder
can be made. The defect can be quantified in the way described above. The
result of the
quantification may be presented to the user, for example with a depiction as
in FIG. 14.
[0161] In particular, FIG. 14 depicts an example of a representation of
the result of the
defect quantification of a glenoid. On the left-hand side, a virtual 3D model
1402 of the bony
anatomy of the patient's scapula, with the glenoid in the center. On the right-
hand side that
anatomy 1404 is shown overlaid onto an SSM 1406 representing healthy anatomy,
fit to parts
of the patient's scapula. Different results of the defect quantification are
shown. The erosion
depth (the distance from the actual bone surface to where that surface would
have been in a
healthy situation, represented here by the surface of the SSM instance) is
shown in the form of
a gradient plot 1408.
[0162] In the example of FIG. 14, erosion depth is computed
perpendicular to the best-fit
plane through the surface of the glenoid cavity of the SSM instance. Other
measuring directions
are possible, such as locally perpendicular to the surface of the glenoid
cavity of the SSM
instance.
[0163] Additional measures are computed and shown, such as vault loss
percentage (the
percentage of the volume of the glenoid vault lost due to bone erosion),
erosion area percentage
(the percentage of the surface area of the glenoid cavity affected by bone
erosion), and the
maximum erosion depth. In the example, the glenoid is also subdivided into
four quadrants,
and a quantitative metric, such as an anterior, posterior, superior or
inferior vault loss
percentage, is shown in each quadrant. In addition, the subluxation distance
is computed. To
this end, the center of rotation of the humeral head is computed by best-
fitting a sphere to the
29
CA 03139123 2021-11-03
WO 2020/227661
PCT/US2020/032165
articular surface of the humeral head; the center point of this sphere is
projected perpendicularly
onto the best-fit plane through the surface of the glenoid cavity of the SSM
instance; the
distance between this projected point and the geometric center of the glenoid
cavity is measured
and displayed. Also, the subluxation region is displayed, i.e. the quadrant in
which the humeral
head's center of rotation is projected.
[0164] FIG. 14 demonstrates an important improvement over conventional
systems in that
from this information and from the depiction, the user now has reproducible
and objective
information to assess the extent and location of the bone defect. This
information is important
for deciding on the most appropriate treatment.
[0165] The system may further support a decision by presenting statistical
information
based on historical data, as described above. For example, systems that
comprise a feedback
loop for approved pre-operative plans may run an analysis to relate any of the
metrics described
above to the treatment chosen in previous cases. The result of this historical-
data analysis may
be presented to the user in any of the ways described above. For example, the
results may be
presented in a chart, such as in FIG. 15.
[0166] In particular, FIG. 15 depicts an example of a representation of
the results of a
historical-data analysis and indicates what percentages of patients have been
treated in different
ways, sorted according to vault loss percentage. The patient to be treated is
indicated with the
vertical line 1502.
[0167] All records in the database may be used as basis for the historical-
data analysis.
Alternatively, the population selected as basis for the historical-data
analysis may be limited in
a number of ways. For example, limiting the population to only those cases
that have been
treated by the user, the user will get insight as to how the patient to be
treated relates to his past
experience. Including cases of more or all users will give insight into the
practices of a larger
surgeon community, such as all surgeons of a particular hospital, country or
the world.
[0168] The population may also be limited to patients that show a
certain similarity to the
patient to be treated. Such similarity may be based on one or more patient
characteristics, such
as sex, age, ethnicity, activity level, and others.
[0169] Referral to a colleague or other hospital may be one of the
options. Based on the
information stored in the database, the system may have the functionality to
suggest a clinician
who is open to referrals. Based on historical data in the database, the system
may even suggest
CA 03139123 2021-11-03
WO 2020/227661
PCT/US2020/032165
a clinician who has more experience with similar patients, i.e. patients that
exhibit similar
pathology and/or other patient characteristics or suggest to follow the
treatment plan of the
referred surgeon.
[0170] The historical-data analyses have now been described based on
approved pre-op
plans gathered and stored through a feedback loop. However, similar and
potentially more
relevant analyses may be performed on intra-op or post-op data gathered
through other
feedback loops. Such data may not represent the treatments surgeons intended
to give, but the
actual treatments administered.
Example Application: Shoulder Surgery Implant Type Decision Support
[0171] Similar to the previous example, systems described herein may
provide support for
the decision of which type of implant to use in shoulder arthroplasty,
including, for example,
off-the-shelf implant versus custom implant, etc.
[0172] For example, the system may offer decision support in the form of
historical-data
analysis relating the choice between standard or off-the-shelf implants and
custom implants to
a quantification of the bone defect as described above. The results of the
analysis may be
presented to the user in the form of a graph, chart, colored or patterned
plot, or such as the other
examples described herein.
[0173] For example, FIG. 16 depicts an example of a representation of
the results of a
historical-data analysis relating the choice between a standard implant and a
custom implant to
the vault loss percentage of the patient's glenoid. The patient to be treated
is indicated with the
vertical line 1602.
[0174] FIG. 17 depicts another example of a representation of the
results of a historical-
data analysis relating the choice between a standard implant and a custom
implant to the vault
loss percentage of the patient's glenoid. The patient to be treated is
indicated with the circle
1702.
[0175] As another example, the system may be provided with a library of
implants, and the
analysis may relate the choice of implant to one or more defect
characteristics as computed
from the defect quantification.
Example Application: Shoulder Surgery, RSA Lateralization
31
CA 03139123 2021-11-03
WO 2020/227661
PCT/US2020/032165
[0176] In reverse shoulder arthroplasty, lateralization of the center of
rotation is often
employed as a way to improve the torque generated by the rotator cuff and
increase internal
and external rotation. However, excessive lateralization can lead to excessive
muscle
lengthening and even to acromion fracture due to the increased loading.
Insufficient
lateralization can lead to instability of the joint due to a decrease of the
muscle loads.
[0177] The systems described herein may therefore offer decision support
through
simulation of muscle lengthening due to lateralization.
[0178] For example, the system may provide a 2D or 3D depiction of the
patient's anatomy
and the implant. This depiction may comprise virtual models of the bony
anatomy of the
scapula and humerus, the implant and one or more shoulder muscles. The
shoulder muscles
may be shown in their actual shape, or rather schematically, e.g. by means of
lines, curves,
polylines or cylindrical shapes. The depiction may simulate how the muscle
trajectories vary
with lateralization of the implant and display as a biomechanical model. For
reference, the
depiction may display the muscle trajectories and bone models in the native ¨
i.e. either pre-
operative or healthy ¨ situation in overlay. The pre-operative situation may
be derived from the
medical images. The healthy situation may be approximated by fitting an SSM
representing
healthy shoulder anatomy to parts of the patient's anatomy.
[0179] The system may be interactive. For example, as shown in FIG. 18,
the system may
allow the user to manually shift the center of rotation from a first position
1802 to a second
position 1804 by, for example, manipulating the model of the implant by
clicking and dragging
an input device, such as a computer mouse. Alternatively, the system may
provide user
interface controls, such as buttons or sliders, to adjust the lateralization.
The depiction is
automatically updated to reflect the adjustments made. For example, the
relative positions of
the scapula, humerus and implant components and the corresponding muscle
trajectories are
updated.
[0180] The system may display numerical values, such as percentages,
quantifying the
amount of lengthening of individual muscles, or in terms of decreasing
thickness of the lines,
curves, polylines, or cylindrical shapes, or an average for some or all
muscles. These values
may be overlaid onto the depiction of the anatomy, or listed elsewhere in the
user interface.
[0181] The systems according to the invention may provide additional
decision support
through historical-data analysis of past cases. As before, the data for such
an analysis may be
gathered through one or more feedback loops in the form of approved pre-
operative plans or
32
CA 03139123 2021-11-03
WO 2020/227661
PCT/US2020/032165
actually executed operative plans gathered intra-operative or post-operative.
The population
may be based on all available records, or may be limited in different ways as
described above.
In preferred embodiments, the population is limited to patients who show a
certain similarity
to the patient to be treated in one or more patient characteristics. For
example, bone density
may be derived from CT scans and may play an important role in assessing the
risk of acromion
fractures. Alternatively or additionally, shape characteristics, such as the
thickness of the
acromion, may play an important role. Those shape characteristics may be
quantified by means
of certain measurements or by means of parameter values of an SSM fit to the
anatomy of the
patient, as described above. The results of the analysis may be displayed in
the form of graphs,
charts or color plots displaying for different amounts of lateralization how
often those amounts
have been planned or implemented before. The current lateralization may be
indicated on the
graph, chart or color plot by means of a marker, such as a line, dot, diamond
or the like.
[0182] Alternatively, the analysis may investigate how often an amount
of muscle
lengthening was planned or implemented before. This could be an amount of
muscle
lengthening of an individual muscle, and average of a selection of or all
shoulder muscles, or
a weighted average of a selection of or all shoulder muscles.
[0183] Finally, in embodiments where the system gathers and stores
information regarding
intra-op or post-op complications, the analysis may additionally include the
risk of such
complications, such as acromion fracture or instability. The user may then
see, from the graph,
chart or color plot, not only whether the chosen lateralization falls within
common practice,
but also within the safe zone.
[0184] In addition or alternative to the interactive features described
above, the graph, chart
or color plot may be interactive. For example, the user may choose an amount
of lateralization
by clicking on the graph, chart or color plot, or by sliding the marker
representing the current
amount of lateralization. Any depiction of the anatomy and planned implant(s)
may be
automatically updated to reflect the change in lateralization.
[0185] The systems and methods described herein can be operated and
performed by, for
example, computing devices, such as desktop computers, portable computers,
portable
electronic devices, tablet computers, smart phones, and other computerized
devices. In some
implementations, the methods described herein may be performed by native
software
applications while in others they may be performed in server-client
implementations. For
example, in some implementations, software configured to perform the methods
described
33
CA 03139123 2021-11-03
WO 2020/227661
PCT/US2020/032165
herein may be hosted by a remote server or a cloud-based system. In some
cases, various
aspects of the systems and methods described herein may be distributed across
different
computing devices.
[0186] Further, the systems and methods described herein can be operated
and performed
by, for example a medical professional, such as a surgeon, doctor, or nurse,
or by a non-medical
professional, such as a clinical technician, design engineer, implant
manufacturer (e.g., to give
him an overview of what kind of implants a particular surgeon works with and
generate a plot
depicting the same to him), a residency student, or a patient (e.g., who is
walked through the
surgery before the actual surgery).
Example Application: CMF Treatment Decision Support
[0187] The defect quantification system described herein may further be
used to detect one
or more of defects in the craniomaxillofacial (CMF) region and further
classify it, such as
trauma; orbital reconstruction; distraction osteogenesis; temporomandibular
joint; cranial vault
reconstruction; congenital craniofacial deformities, such as craniosynostosis;
dental alveolar
surgery; or any other cosmetic or reconstruction surgeries comprising of one
or more of the
parts of the craniomaxillofacial regions.
[0188] As an example embodiment, the defect quantification system
described herein may
use patient data (e.g., imaging data) and one or more feedback loops to detect
the type of defect
to be quantified and then to classify the defect such as orthognathic defect.
[0189] In one example of a method, one or more medical images or scans
(generally,
imaging data) of a patient's anatomy requiring correction may be acquired. For
example, the
imaging data may relate to a jaw deformity of the patient. In this example,
the imaging data
may include, for example, image data of one or more of a mandible, maxilla, or
chin of the
patient. As described above, the anatomy in the imaging data may be segmented
(e.g., between
mandible, maxilla, and/or chin) to obtain a virtual three-dimensional surface
model. Then, a
statistical shape model of a healthy anatomy (e.g., a healthy jaw) may be
fitted to the three-
dimensional surface model to identify healthy and damaged portions of the
patient's anatomy
(e.g., a damaged portion of the patient's jaw).
[0190] FIG. 19 depicts an example of a representation of a defect
quantification using
patient imaging data and an SSM. In this example, the imaging data comprises a
three-
34
CA 03139123 2021-11-03
WO 2020/227661
PCT/US2020/032165
dimensional model of the patient's bony mandible anatomy 1902 overlaid on an
SSM 1904 of
an original, healthy mandible.
[0191] It is evident in this example that this patient only requires
treatment of the mandible
and not the maxilla.
[0192] The manner of comparing the patient's actual anatomy (e.g., by way
of three-
dimensional models created from medical imaging data) to a healthy anatomy
model (e.g., an
SSM model) allows a surgeon to visualise the possible surgical approaches. For
example, in
this case, the surgeon can manipulate the positioning of the mandible while
providing the
healthy anatomy as reference. In this example, the defect shown in FIG. 19 and
a proposed
surgical treatment may be identified, such as mandible reconstruction.
[0193] During the planning stage, the system guides the surgeon by
showing portions of
the anatomy that may be resected 2002, as depicted in FIG. 20. In particular,
the system shows
clear resection margins and may warn the surgeon if he decides to resect more
or less bone than
is necessary based on the quantified defect.
[0194] Further, as described above, the three-dimensional patient anatomy
model may be
accompanied by historical data associated with the patient and may suggest a
patient-specific
implant for the planned treatment. For example, the treatment plan may include
the use of bone
graft, and, based on patient's history, the patient's left fibula may be
chosen for the graft. The
system may further indicate the healthy parts on the fibula and show post-op
result. Notably,
these are just a few examples.
[0195] In another example, a proposed treatment plan may involve
treatment of the
additional CMF regions, including the maxilla, mandible, and genioplasty.
[0196] FIG. 21A depict an example in which a defect is classified as
LeFort I, which is a
type of fracture of the skull involving the maxillary bone and surrounding
structures in either
a horizontal, pyramidal or transverse direction. For such a classification,
the treatment plan
may involve bilateral sagittal split osteotomy (BSSO) and genioplasty
osteotomy. As above, a
model of the patient's anatomy is segmented into various regions 2102-2108,
which may be
used for the defect quantification and considered during pre-op planning.
[0197] FIG. 21B depicts aspects of the treatment of the defect
quantified in FIGS. 21A. In
particular, FIGS. 21B depicts a recommended distance of maxillary movement to
treat the
defect. In some cases, the recommended distance may be based on historical
data and the
CA 03139123 2021-11-03
WO 2020/227661
PCT/US2020/032165
system may further show ranges 2110A and 2110B (e.g., in mm) of maxillary
movement
possible.
[0198] FIG. 21C depicts an example of proximal overlap and a resection
margin 2112. In
particular, FIG. 21C identifies at 2114 that a reduction of the bony anatomy
is necessary.
[0199] FIG. 21D depicts another example of the proposed treatment of the
defect. In this
example, the system displays a warning 2116 that a gap needs to be filled.
[0200] In some embodiments, based on the quantified defect and initial
treatment plan, the
system may further suggest relevant implant types and sizes to connect the
different bone parts,
such as to fill the identified gap in FIG. 21D. For example, the system may
suggest use of a
guide for placement of the mandible implants. The system may further allow a
surgeon to
visualise different implant options before making a choice and updating the
treatment plan
accordingly.
Example Application: Orthognathic Surgery Decision Support
[0201] Another example application of the surgical planning systems
described herein is
orthognathic surgery decision support. In one example, a pre-operative
planning tool (e.g.,
Proplan CMF by MATERIALISE , and others) may be used to generate a pre-
operative
surgical plan for a specific craniomaxillofacial surgery. Imaging data from
the pre-operating
planning tools may then be used by a defect quantification system, such as
described herein.
[0202] In one example, a defect may be classified as a jaw deformity
requiring orthognathic
surgery to remedy the defect. In this example, the defect quantification
system may quantify
the defect based on the various existing osteotomy classifications familiar to
surgeons, such as
Limberg's oblique subcondylar osteotomy, Moose's procedures for mandibular
reduction,
Caldwell and Letterman's vertical ramus osteotomy, Trauner and Obwesefer's
sagittal split
osteotomy (SSO), bilateral sagittal split osteotomy (BSSO), Winstanley' s
intraoral vertical
ramus osteotomy (IVRO), and others. The defect quantification system may
further allow the
user to visualise different fractures of the skull, such as Lefort I, Lefort
II, modified LeFort I,
and others, if the defect is in the maxilla.
[0203] Alternatively or additionally, the defect quantification system
may classify the
defect based on a type of incision or surgery as well. For example, based on
the defect and the
SSM model generated, a user may choose to perform a bi-max (maxilla +
mandible), multi-
segment maxilla, maxilla only, mandible only, or genioplasty surgery.
36
CA 03139123 2021-11-03
WO 2020/227661
PCT/US2020/032165
[0204] Once the defect has been quantified, a default treatment plan may
be created as
described above. In some cases, three-dimensional cephalometry data (measuring
deviation
from the norm), asymmetry assessments, and records of previous surgeries, as
well as other
types of patient data stored with a patient profile, may be considered.
[0205] In one example, if the defect is in the mandible, a bilateral
sagittal split osteotomy
(BSSO) may be proposed by the surgical planning system. In some cases, this
treatment may
be performed without any treatment of the upper (maxilla) jaw. The surgical
planning system
may allow a user (e.g., a surgeon or other medical practitioner) to visualise
the mandible
surgical approaches with appropriate changes in the maxilla and allow the user
to decide the
best approach.
[0206] In some embodiments, the system may further assist the surgeon in
selecting the
exact type of BSSO to select, such as Dalpont, Obwegeser, short ramus
osteotomy, inverted L,
and vertical ramus. Depending upon the defect and the type of osteotomy, the
system may
provide warnings such as proximity or damage to surrounding nerves and propose
a suitable
osteotomy. The surgical planning system may further warn the user when too
much bone or
too little bone has been resected in the planned treatment. The surgical
planning system may
further prompt the user with appropriate resection margins and warn when
margins are
exceeded in comparison to the historical data of a selected patient population
(e.g., a population
in which the patient for which the surgery is being planned is a part).
[0207] Based on the type of osteotomy, the surgical planning system may
further help the
user decide on a suitable fixation method, such as patient-specific or
standard, and the area
upon which the fixation method would be placed. Some of the options available
to the user
may include selection of one or more plates, type of plates (patient-specific
or standard plates),
use of guides, and/or use of lag screws, etc.
[0208] In some embodiments, if the treatment plan involves treatment of the
maxilla, the
user may choose between two or more plates based on the patient history and
may be able to
compare the type and choice of number of plates chosen for similar patients
using historical
data analysis and/or patient population plots.
[0209] In some embodiments, if the treatment plan involves treatment of
the mandible, the
surgical planning system may allow the user to visualise plate or lag screw
positioning and
orientation, superior or inferior fixation areas, etc. The surgical planning
system may further
allow the selection of thickness and width of the plates, fixation material
based on amount of
37
CA 03139123 2021-11-03
WO 2020/227661
PCT/US2020/032165
bone available (e.g., CPTi, TAIV, bioresorbable), number and location of
fixation screws on
each side of osteotomy, use of guides in combination with patient-specific or
standard plates,
and others. All of the aforementioned selections and configurations may become
part of the
treatment plan generated by the surgical planning system.
[0210] In an example embodiment, the defect quantification system may
classify a patient
as having a class 2, narrow maxilla defect requiring treatment of the
mandibular advancement
and maxillary impaction. The default treatment plan may include treatment of
the maxilla, such
as multi-segment Lefort I osteotomy and BSSO for the mandible. The default
treatment plan
may further recommend use of a patient specific plate for the maxilla and
three lag screws on
each side for the mandible. The user (e.g., a surgeon) of the surgical
planning system may
approve the default treatment plan or may explore modifications to the plan
through the
surgical planning system's ability to visualize the treatment plan.
[0211] The user may then approve the treatment plan and use it in during
the surgery (e.g.,
in the operating room). While in the operating room, changes or deviations
from the treatment
plan may be entered into the surgical planning system, such as time required
to perform a
surgical step, anastomosis, ischemic time for bone graft harvesting, required
surgical
equipment check before the start of the surgery, blood loss, timed checks on
pathologic tissues
to determine accurate resection margins, and others.
[0212] After the surgery is complete, the patient's profile may be
updated and certain data
regarding the treatment may be generated for future pre-operating surgical
planning as well as
for historical data analysis, which may be used as described above. Other post-
operation data
may likewise be included in the patient profile, such as infection rate,
stability and relapse rate,
pain score, hospital discharge and related notes, mouth openings scans and
notes, recurrence
and relapse rate for oncology cases, flap survival rate for reconstructive
surgeries, functional
outcomes, and aesthetic outcomes, among others.
Example application: Reconstructive Surgery Decision Support
[0213] Another example application of the surgical planning systems
described herein is
reconstructive surgery decision support. In one example, a pre-operative
planning tool (e.g.,
Proplan CMF by MATERIALISE , and others) may be used to generate a pre-
operative
surgical plan for a specific craniomaxillofacial surgery. Imaging data from
the pre-operating
planning tools may then be used by a defect quantification system, such as
described herein.
38
CA 03139123 2021-11-03
WO 2020/227661
PCT/US2020/032165
[0214] In one example, a defect may be classified as a deformity
involving the mandible
or the midface involving reconstructive surgery. Based on patient profile
data, such as patient
history and patient imaging data, a three-dimensional SSM model may be
generated of the
patient. The imaging data (showing the defect) and the SSM may then be
compared to generate
the defect classification. Based on the defect classification, a default
treatment plan may be
generated by a surgical planning system, such as described herein.
[0215] In the case of cancer patients, the defect quantification system
may quantify the
defect based on the type of cancer and/or lesion (benign or malignant), area
of lesion to be
excised and treated during the surgery, number of surgeries required, and
other factors. Any
other patient information, such as other treatments, like chemotherapy,
radiation therapy, etc.,
are also included in the patient profile.
[0216] In the case of corrective surgery, the patient history may be
taken into account
during treatment planning. For example, based on patient imaging data, a user
(e.g., a surgeon)
can make an assessment of an asymmetry and its deviation from the normal,
original anatomy.
Using the three-dimensional models based on the patient data, the defect is
simulated in
comparison with healthy anatomy.
[0217] In the case of trauma, the visualisation function of the surgical
planning system may
be used along with patient population and historical data analysis, in order
to create an
appropriate treatment plan efficiently. In some embodiments, the surgical
planning system may
recommend a default plan based on characteristics identified in the trauma
patient.
[0218] Further, the historical data analysis performed by the surgical
planning system may
allow the user to compare the success rate of various surgical approaches for
a specific
indication, such as vascularized graft versus a bone non-vascularised graft,
autologous versus
bone substitute, and the like.
[0219] In some embodiments, the system may also store relevant information
required for
matching a donor with a recipient, and the surgical planning system may
further provide
information about other users (e.g., other surgeons) to be contacted or other
facilities to contact
(e.g., other hospitals) with potential donors. In case tissue has been
harvested, the surgical
planning system may display the information about donor site morbidity in the
case of, for
example, a harvested bone graft. In the case of trauma involving larger bone
defects, the
surgical planning system may prompt the user to use larger, stronger plate and
in some cases
even patient-specific plates. Notable, these are just some examples and others
are possible.
39
CA 03139123 2021-11-03
WO 2020/227661
PCT/US2020/032165
Example Application: Cardiac Treatment
[0220] Another example application of the surgical planning systems
described herein is
cardiac treatment. In one example, a pre-operative planning tool (e.g., MIMICS
and MIMICS
Enlight by MATERIALISE()) may be used to generate a pre-operative surgical
plan for
structural heart and other vascular interventions. Imaging data from the pre-
operating planning
tools may then be used by a defect quantification system, such as described
herein.
[0221] For example, patient data, including images, scans, patient
history, and the like, is
stored by the surgical planning system. As described above, the imaging data
may be converted
into three-dimensional models of a patient's anatomy. An SSM model may then be
used by the
defect quantification system to classify a heart defect based on congenital or
acquired diseases.
In some examples, the defect may be classified into septal defects, valvular
heart disease, such
as of the aorta or mitral valve, vascular obstructions, fistulas and, other
conditions. Each
category may be further divided into classes based on severity. Once the
defect has been
quantified, a default treatment plan may be generated, such as described
above.
[0222] In one example, a patient may be identified with a defect in the
aortic valve,
indicating a transcatheter aortic valve replacement (TAVR) procedure. Several
factors can be
determined from the three-dimensional anatomy models and SSM models as part of
the defect
classification system, which help a user (e.g., a surgeon) in generating a
treatment plan, such
as aortic valve morphology, assessment of the aortic root, assessment of the
annulus (size and
height), LVOT calcification, height of the sinutubular junction, assessment of
the coronary
ostium (height), assessment of the sinus of vulsava (diameter and height),
assessment of the
risk of coronary artery obstruction, prediction of optimal fluoroscopic
projection angles for
device deployment, assessment of the transfemoral access route for TAVR
device, assessment
of alternative routes if transfemoral is not feasible, assessment for carotid
protection device
feasibility, and others. These factors may impact treatment plan decisions,
such as catheter
planning, device selection, access planning in case the traditional
transfemoral route is not
accessible, size of the incision, type of device, and others.
[0223] In one example, a patient may be identified with a defect in the
mitral valve
indicating a transcatheter mitral valve replacement (TMVR) procedure. Several
factors can be
determined from the three-dimensional anatomy models and SSM models as part of
the defect
classification system, which help the surgeon in generating a treatment plan,
such as assessment
of the landing zone involving assessment of mitral annulus size (diameter,
height, APML,
CA 03139123 2021-11-03
WO 2020/227661
PCT/US2020/032165
leaflets), calcification, evaluation for risk of left ventricular outflow
tract (LVOT) obstruction,
assessment of risk of interaction with other intercardiac devices (new or
recently implanted or
to be implanted), distance from such devices, determination of optimal trans-
septal puncture
location or transapical route, assessment of optimal fluoroscopic angles,
height of the papillary
muscle, volume and size of the left ventricle, assessment of the delivery
device and route,
angulation of the mitral valve, access location, extend of trans-septal
crossing (e.g., fossa
ovalis), and others. These factors may impact, for example, the entry points,
incision size, type
and size of a surgical device, etc. For example, the user (e.g., a surgeon)
may determine the
entry point such that the apex/apical puncture is perpendicular to the mitral
annulus for the
placement of the device. Using the defect quantification system along with
historical data, the
surgeon may be able to predict the outcome of neoLVOT procedure by using one
or more
visualisation methods to place the patient in the selected patient population.
[0224] In one example, a patient may be identified with a defect in the
left atrial appendage
(LAA) indicating closure of the LAA. Several factors can be determined from
the three-
dimensional anatomy models and SSM models as part of the defect classification
system,
which help the surgeon in generating a treatment plan, such as assessment of
the landing zone
for device placement, determination of the optimal trans-septal puncture
location,
determination and assessment of optimal fluoroscopic projection angles for
device delivery,
selection and planning of the delivery device, selection of the catheter, and
angulation to LAA.
Based on diameter, height, depth and shape of the LAA, appropriate device and
its size may be
selected for the treatment plan.
[0225] Using historical data and patient population, the surgical
planning system may
prompt the user with the type and size of device, catheter selection, and
route of delivery as
few examples. Based on severity of the disease, age of the patient, health
risk involved, and
availability and viability of the device, the surgical planning system may
prompt the user with
alternative treatments. For example, open heart surgeries may be considered
last. Based on
historical data, the system may also store relevant information about catheter
delivery and
pathways used such as catheter deformation percentages and warn the user to
consider a more
suitable catheter if one is available.
[0226] Other structural heart interventions such as paravalvular leak,
atrial septal defect
(ASD), patent foramen ovale (PFO) may also be planned using the surgical
planning system as
described herein.
41
CA 03139123 2021-11-03
WO 2020/227661
PCT/US2020/032165
[0227] Further, intra-operative measurements, such as best viewing
angles for fluoroscopy
or C-arm angles to position the patient correctly during surgery, may also be
suggested, and
appropriate warnings may be provided both during pre-operative planning and
via one or more
navigation system during the planned treatment (e.g., surgery).
[0228] For example, based on imaging data of the anatomy of the patient
(e.g., CT or MRI
images), a virtual three-dimensional model of the anatomy of a patient's heart
can be made.
The defect can be quantified in the manners described above.
[0229] In the example depicted in FIG. 22, the patient is identified
with a defect in the
mitral valve.
[0230] Structural heart interventions, such as TMVR, involve placement of a
mitral valve
device 2202, as depicted in FIG. 22. Based on a three-dimensional model of the
patient's
heart, as depicted in FIG. 22, a user (e.g., surgeon) may determine a size,
type, position, and
location of an implant. Patient metrics such as angulation, available cross-
sectional area
corresponding to fluid passageway, and others may be considered. Further,
using one or more
visualisation tools of the surgical planning system, the risk of leakage may
be determined while
considering the type of implant. Further yet, a delivery method and access
point may also
influence the choice of the implant.
[0231] In another example, current delivery route for the implant to be
delivered may need
to be determined for a patient requiring an LAA procedure. In such a case,
selection of a
catheter based on the patient's anatomy and along with its entry point and
delivery trajectory
needs to be planned such that during the surgery, the implant is delivered
safely to the patient.
[0232] FIG. 23 depicts a target trajectory 2302 for delivery of an
implant. A user of the
surgical planning system may experiment with different catheters before making
the final
treatment plan. Further, if the delivery path selected for the patient would
lead to further
complications, the surgical planning system may warn the user to reconsider
the delivery path.
Example Application: Knee Treatment Decision Support
[0233] Another example application of the surgical planning systems
described herein is
for joint defects (e.g., ankle, hip), such as knee treatment decision support.
In one example, a
pre-operative planning tool (e.g., SurgiCase Knee Planner by MATERIALISE ),
may be used
to generate a pre-operative surgical plan for a joint arthroplasty, such as
the knee. Patient data,
including medical imaging data (e.g., MRI and CT scans), patient history, PROM
score before
42
CA 03139123 2021-11-03
WO 2020/227661
PCT/US2020/032165
the surgery, new or revision surgery information, patella height, axis,
deformity type, and
others may be utilized by the surgical planning system to generate a treatment
plan.
[0234] For example, the defect quantification system may be used to
classify the severity
of a defect as requiring a total or partial knee arthroplasty. As above, the
defect quantification
.. system may compare a three-dimensional model of the patient's anatomy to an
SSM model to
help quantify the defect. Before or during planning, information such as the
type (standard or
patient-specific) and size of implant, along with information about the
varus/valgus angle,
cartilage wear and other soft tissue data, may be presented to the user such
that a pre-operative
plan may be determined.
[0235] In some cases, the user may compare the generated default pre-
operative plan with
selected patient population and use historical data analysis, as described
above. In particular,
the surgical planning system may present to the user information about why a
certain type of
implant was suggested, the position and location of the implant, the
varus/valgus angle to be
considered, and the system may enable the user to visualise how changing the
implant
.. characteristics affects the patient's expected post-operation result.
[0236] For example, if a patient is young and active, the surgical
planning system may pull
up data about the treatment options for younger patients and suggest the user
to consider partial
knee arthroplasty (PKA) instead of total knee arthroplasty (TKA). The surgical
planning
system may further suggest the user to use guides along with a patient-
specific implant while
.. showing the best suited treatment options with minimum cartilage wear and
tear.
[0237] The surgical planning system may also enable the user to view the
treatment plan
on a biomechanical model that includes bone and cartilage information along
with soft tissue
data, such as ligaments and muscle attachment. Further, the surgical planning
system may also
be configured to simulate the biomechanical model through rotations and
translations and
.. present data such as ligament elongations and knee loading so that minimum
damage is caused
to the soft tissue around the knee as a result of the treatment.
[0238] In some cases, the biomechanical model may be stored using one of
the feedback
loops described above and may be used as reference (along with navigation
systems) during
the surgery (in real-time) so that it may prompt the user (e.g., the surgeon)
with warnings if the
.. actual treatment deviates from the treatment plan or if other complications
are encountered.
43
CA 03139123 2021-11-03
WO 2020/227661
PCT/US2020/032165
[0239] In some embodiments, intra-operative measurements, such as
deviations from the
pre-operative plans, soft tissue information, and the like may be stored to
complete the patient
profile and also to create future pre-operative plans and historical treatment
data.
[0240] In some embodiments, intra-operative measurements, including
deviations from the
plan, may be recorded by the surgical planning system, such as: need for
cementation
(tibia/femur), patella, approach, alignment techniques, femoral rotation,
femoral valgus, patella
release, medial and lateral release, level of balance satisfaction achieved
after the surgery (e.g.,
not happy, happy, very happy), blood loss, surgical time, range of motion at
closure, use of
robotic or other navigation systems, bone quality, diagnosis, PCL cut and
size, limb alignment
(varus/neutral/valgus), joint space opening before cuts (medial/lateral),
joint space opening
after implant placement (medial/lateral), laxity score (e.g., high/good/low),
flexion contracture,
ligament releases, patella resurfacing, use of tibia and/or femur guide and
guide fit, tibial slope,
proximal tibial cut, tibial implant, confirming if planned implant was used or
other size and
type, insert type and thickness of tibia, distal femur cut, posterior femur
cut, AP-Shift femur,
anterior femur cut, femur implant rotation, ROM: max flexion, balance in
flexion, balance in
extension, and others.
[0241] Further, post-operative data, such as PROM scores currently used
by surgeons such
as KSS, KOOS, OKS, EQ5D, FJS, etc., and other input provided by the patient or
their
therapists, during follow-ups may also be recorded by the surgical planning
system.
[0242] In one example, medical images of the bone and/or cartilage anatomy
of the patient,
such as CT or MRI images, may be used to generate a three-dimensional model
2402 of the
patient's knee. The defect can be quantified in the way described above.
[0243] For example, FIG. 24 depicts a representation of the cartilage
thickness on the bony
anatomy of a knee (tibia and femur). Certain identified areas (e.g., 2404) are
considered to be
healthy, such as where an adequate amount of cartilage is found. Other areas
(e.g., 2406)
indicate defects, such as weaker cartilage areas. This information may be used
by a user (e.g.,
a surgeon) when deciding which treatment option to select for a treatment
plan.
[0244] For example, a user may decide to treat the patient with a
partial knee arthroplasty
instead of total based on the images in FIG. 24, so that the cartilage found
in the healthy areas
may be saved. Based on this decision, the surgical planning system may suggest
an implant,
size, brand, and type for this patient from a variety of implants.
44
CA 03139123 2021-11-03
WO 2020/227661
PCT/US2020/032165
[0245] Further, the surgical planning system may be configured to allow
a user to visualise
the type and size of implant against cartilage wear before making a final
decision for the
treatment plan. In some embodiments, the user may further use historical data
and patient
population analysis to compare the type of implant, such as described above.
[0246] Further, the surgical planning system may also be configured to
display the
varus/valgus angle 2502 used for limb alignment, such as depicted in FIG. 25.
[0247] Similarly, the surgical planning system may be configured to
display other patient
metrics, such as tibial slope, position, and location of implant, resection
values, and others via
a three-dimensional model.
[0248] Once, an implant is selected for a patient's anatomy, such as the
implant shown in
FIG. 26 for the patient's tibia, a user (e.g., surgeon) may further refine the
position of the
implant within the three-dimensional model. For example, if the implant
overhangs (as
depicted at 2602), the surgery planning system may warn the user and may
suggest that the
user revaluate the position of the implant. In some cases, if a suitable
position is not established,
the surgical planning system may suggest a different implant.
Example Methods
[0249] FIG. 27 depicts an example method 2700 for classifying a defect
with a statistical
shape model.
[0250] Method 2700 begins at step 2702 with acquiring medical image data
associated with
an anatomy of a patient.
[0251] Method 2700 then proceeds to step 2704 with creating a three-
dimensional anatomy
model based on the medical image data.
[0252] Method 2700 then proceeds to step 2706 with fitting a statistical
shape model to the
three-dimensional anatomy model.
[0253] Method 2700 then proceeds to step 2708 with determining one or more
quantitative
measurements based on the fitted statistical shape model.
[0254] Method 2700 then proceeds to step 2710 with classifying a defect
associated with
the anatomy of the patient based on the one or more quantitative measurements.
[0255] In some embodiments of method 2700, fitting the statistical shape
model to the
three-dimensional anatomy model further includes: subdividing the statistical
shape model into
CA 03139123 2021-11-03
WO 2020/227661
PCT/US2020/032165
a plurality of topological regions; and determining a subset of topological
regions from the
plurality of topological regions to use for fitting the statistical shape
model to the three-
dimensional anatomy model.
[0256] In some embodiments of method 2700, determining the subset of
topological
regions from the plurality of topological regions to use for fitting the
statistical shape model to
the three-dimensional anatomy model further includes: excluding a respective
topological
region of the plurality of topological regions if a fit error exceeds a
threshold when the
respective topological region is included in the subset of topological
regions.
[0257] In some embodiments of method 2700, determining the subset of
topological
.. regions from the plurality of topological regions to use for fitting the
statistical shape model to
the three-dimensional anatomy model further comprises: selecting a first
topological region
from the plurality of topological regions; fitting the statistical shape model
to the three-
dimensional anatomy model based only on the first topological region; and
calculating a first
fit error based on a first fit of the statistical shape model based on the
first topological region.
[0258] In some embodiments of method 2700, the first fit error is
calculated as a root mean
square error (RMSE) between a plurality of points on the statistical shape
model and a plurality
of corresponding points on the three-dimensional anatomy model.
[0259] In some embodiments of method 2700, determining the subset of
topological
regions from the plurality of topological regions to use for fitting the
statistical shape model to
the three-dimensional anatomy model further includes: determining that the
first fit error is
below a threshold; selecting a second topological region from the plurality of
topological
regions; fitting the statistical shape model to the three-dimensional anatomy
model based on
the second topological region; and calculating a second fit error based on a
second fit of the
statistical shape model based on the second topological region.
[0260] In some embodiments of method 2700, determining the subset of
topological
regions from the plurality of topological regions to use for fitting the
statistical shape model to
the three-dimensional anatomy model further includes: determining that the
first fit error is
above a threshold; and excluding a second topological region of the plurality
of topological
regions from the subset of topological regions based on the first fit error
being above the
threshold.
46
CA 03139123 2021-11-03
WO 2020/227661
PCT/US2020/032165
[0261] In some embodiments, method 2700 further includes: excluding a
third topological
region of the plurality of topological regions from the subset of topological
regions based on
excluding the second topological region.
[0262] In some embodiments of method 2700, the threshold is
approximately 1.7mm. In
some embodiments of method 2700, the threshold is in a range of 0.5mm to 3mm.
[0263] In some embodiments of method 2700, determining the subset of
topological
regions from the plurality of topological regions to use for fitting the
statistical shape model to
the three-dimensional anatomy model further includes excluding a topological
region of the
plurality of topological regions known to be damaged or deformed from the
subset of
topological regions.
[0264] In some embodiments of method 2700, classifying the defect based
on the one or
more quantitative measurements further includes: combining two or more
classification
systems in order to generate a three-dimensional classification, wherein each
of the two or more
classification systems is based on a different perspective of the anatomy of
the patient.
[0265] In some embodiments, method 2700 further includes creating a default
treatment
plan based on the classified defect associated with the anatomy of the
patient.
[0266] In some embodiments, method 2700 further includes acquiring
patient data
associated with a plurality of patients having the classified defect;
selecting a population of
patient data based on a characteristic associated with the patient; and
displaying a treatment
option analysis comparing a plurality of treatment options based on the
population of patient
data.
[0267] In some embodiments, method 2700 further includes displaying a
patient reference
on the treatment option analysis based on the characteristic associated with
the patient.
[0268] In some embodiments, method 2700 further includes modifying the
default
treatment plan based on the treatment option analysis.
[0269] In some embodiments of method 2700, the plurality of treatment
options relate to
treatment of a shoulder defect.
[0270] In some embodiments of method 2700, the plurality of treatment
options relate to
treatment of a joint defect.
47
CA 03139123 2021-11-03
WO 2020/227661
PCT/US2020/032165
[0271] In some embodiments of method 2700, the plurality of treatment
options relate to
treatment of a diseased part of the anatomy.
[0272] In some embodiments of method 2700, the plurality of treatment
options relate to
treatment of a defected part of the anatomy.
[0273] FIG. 28 depicts an example method 2800 for determining a treatment
for an
anatomical defect.
[0274] Method 2800 begins at step 2802 with acquiring medical image data
associated with
an anatomy of a patient.
[0275] Method 2800 then proceeds to step 2804 with creating a three-
dimensional anatomy
model based on the medical image data.
[0276] Method 2800 then proceeds to step 2806 with fitting a statistical
shape model to the
three-dimensional anatomy model.
[0277] Method 2800 then proceeds to step 2808 with identifying a defect
based on the
three-dimensional anatomy model and the statistical shape model.
[0278] Method 2800 then proceeds to step 2810 with determining a default
treatment based
on the identified defect.
[0279] Method 2800 then proceeds to step 2812 with receiving patient
population data
associated with a plurality of other patients having the identified defect,
wherein the patient
population data comprises a plurality of patient population data subsets
associated with
different treatments of the identified defect.
[0280] Method 2800 then proceeds to step 2814 with generating a
visualization,
comprising: a representation of each patient population data subset based on
at least one patient
characteristic; and a representation of the patient based on the at least one
patient characteristic.
[0281] Method 2800 then proceeds to step 2816 with selecting a final
treatment for the
patient.
[0282] In some embodiments of method 2800, the final treatment comprises
a modified
default treatment.
[0283] In some embodiments of method 2800, the final treatment comprises
the default
treatment.
48
CA 03139123 2021-11-03
WO 2020/227661
PCT/US2020/032165
[0284] In some embodiments, method 2800 further includes generating a
new patient
population data entry based on a treatment outcome associated with the patient
and the selected
treatment.
[0285] In some embodiments of method 2800, fitting the statistical shape
model to the
three-dimensional anatomy model further includes: subdividing the statistical
shape model into
a plurality of topological regions; and determining a subset of topological
regions from the
plurality of topological regions to use for fitting the statistical shape
model to the three-
dimensional anatomy model.
[0286] In some embodiments of method 2800, determining the subset of
topological
regions from the plurality of topological regions to use for fitting the
statistical shape model to
the three-dimensional anatomy model further includes: excluding a respective
topological
region of the plurality of topological regions if a fit error exceeds a
threshold when the
respective topological region is included in the subset of topological
regions.
[0287] In some embodiments of method 2800, determining the subset of
topological
regions from the plurality of topological regions to use for fitting the
statistical shape model to
the three-dimensional anatomy model further includes: selecting a first
topological region from
the plurality of topological regions; fitting the statistical shape model to
the three-dimensional
anatomy model based only on the first topological region; and calculating a
first fit error based
on a first fit of the statistical shape model based on the first topological
region.
[0288] In some embodiments of method 2800, the first fit error is
calculated as a root mean
square error (RMSE) between a plurality of points on the statistical shape
model and a plurality
of corresponding points on the three-dimensional anatomy model.
[0289] In some embodiments of method 2800, determining the subset of
topological
regions from the plurality of topological regions to use for fitting the
statistical shape model to
the three-dimensional anatomy model further includes: determining that the
first fit error is
below a threshold; selecting a second topological region from the plurality of
topological
regions; fitting the statistical shape model to the three-dimensional anatomy
model based on
the second topological region; and calculating a second fit error based on a
second fit of the
statistical shape model based on the second topological region.
[0290] In some embodiments of method 2800, determining the subset of
topological
regions from the plurality of topological regions to use for fitting the
statistical shape model to
49
CA 03139123 2021-11-03
WO 2020/227661
PCT/US2020/032165
the three-dimensional anatomy model further includes: determining that the
first fit error is
above a threshold; and excluding a second topological region of the plurality
of topological
regions from the subset of topological regions based on the first fit error
being above the
threshold.
[0291] In some embodiments, method 2800 further includes excluding a third
topological
region of the plurality of topological regions from the subset of topological
regions based on
excluding the second topological region.
[0292] In some embodiments of method 2800, the threshold is
approximately 1.7mm.
[0293] In some embodiments of method 2800, the threshold is in a range
of 0.5mm to 3mm.
[0294] In some embodiments of method 2800, determining the subset of
topological
regions from the plurality of topological regions to use for fitting the
statistical shape model to
the three-dimensional anatomy model further includes excluding a topological
region of the
plurality of topological regions known to be damaged or deformed from the
subset of
topological regions.
[0295] In some embodiments of method 2800, the final treatment relates to
treatment of a
shoulder defect.
[0296] In some embodiments of method 2800, the final treatment relates
to treatment of a
joint defect.
[0297] In some embodiments of method 2800, the final treatment relates
to treatment of a
diseased part of the anatomy.
[0298] In some embodiments of method 2800, the final treatment relates
to treatment of a
defected part of the anatomy.
[0299] FIG. 29 depicts an example method for determining a treatment for
an anatomical
defect.
[0300] Method 2900 begins at step 2902 with acquiring medical image data
associated with
an anatomy of a patient.
[0301] Method 2900 then proceeds to step 2904 with creating a three-
dimensional anatomy
model based on the medical image data.
[0302] Method 2900 then proceeds to step 2906 with fitting a statistical
shape model to the
three-dimensional anatomy model.
CA 03139123 2021-11-03
WO 2020/227661
PCT/US2020/032165
[0303] Method 2900 then proceeds to step 2908 with identifying a defect
based on the
three-dimensional anatomy model and the statistical shape model.
[0304] Method 2900 then proceeds to step 2910 with receiving a default
treatment plan
using the historical data analysis, wherein the historical data comprises
previously used pre-
operative treatment plans for the identified defect.
[0305] Method 2900 then proceeds to step 2912, optionally, with
generating a
visualization, comprising: a representation of treatment plan based on at
least one patient
characteristic; and a representation of the patient based on the at least one
patient characteristic.
[0306] Method 2900 then proceeds to step 2914 with approval of a final
treatment for the
patient.
[0307] In some embodiments of method 2900, the final treatment comprises
a modified
default treatment.
[0308] In some embodiments of method 2900, the final treatment comprises
the default
treatment.
[0309] In some embodiments, method 2900 further includes generating a new
patient
population data entry based on a treatment outcome associated with the patient
and the selected
treatment.
[0310] In some embodiments of method 2900, fitting the statistical shape
model to the
three-dimensional anatomy model further includes: subdividing the statistical
shape model into
a plurality of topological regions; and determining a subset of topological
regions from the
plurality of topological regions to use for fitting the statistical shape
model to the three-
dimensional anatomy model.
[0311] In some embodiments of method 2900, determining the subset of
topological
regions from the plurality of topological regions to use for fitting the
statistical shape model to
the three-dimensional anatomy model further includes: excluding a respective
topological
region of the plurality of topological regions if a fit error exceeds a
threshold when the
respective topological region is included in the subset of topological
regions.
[0312] In some embodiments of method 2900, determining the subset of
topological
regions from the plurality of topological regions to use for fitting the
statistical shape model to
the three-dimensional anatomy model further includes: selecting a first
topological region from
the plurality of topological regions; fitting the statistical shape model to
the three-dimensional
51
CA 03139123 2021-11-03
WO 2020/227661
PCT/US2020/032165
anatomy model based only on the first topological region; and calculating a
first fit error based
on a first fit of the statistical shape model based on the first topological
region.
[0313] In some embodiments of method 2900, the first fit error is
calculated as a root mean
square error (RMSE) between a plurality of points on the statistical shape
model and a plurality
-- of corresponding points on the three-dimensional anatomy model.
[0314] In some embodiments of method 2900, determining the subset of
topological
regions from the plurality of topological regions to use for fitting the
statistical shape model to
the three-dimensional anatomy model further includes: determining that the
first fit error is
below a threshold; selecting a second topological region from the plurality of
topological
regions; fitting the statistical shape model to the three-dimensional anatomy
model based on
the second topological region; and calculating a second fit error based on a
second fit of the
statistical shape model based on the second topological region.
[0315] In some embodiments of method 2900, determining the subset of
topological
regions from the plurality of topological regions to use for fitting the
statistical shape model to
the three-dimensional anatomy model further includes: determining that the
first fit error is
above a threshold; and excluding a second topological region of the plurality
of topological
regions from the subset of topological regions based on the first fit error
being above the
threshold.
[0316] In some embodiments, method 2900 further includes excluding a
third topological
-- region of the plurality of topological regions from the subset of
topological regions based on
excluding the second topological region.
[0317] In some embodiments of method 2900, the threshold is
approximately 1.7mm.
[0318] In some embodiments of method 2900, the threshold is in a range
of 0.5mm to 3mm.
[0319] In some embodiments of method 2900, determining the subset of
topological
regions from the plurality of topological regions to use for fitting the
statistical shape model to
the three-dimensional anatomy model further includes excluding a topological
region of the
plurality of topological regions known to be damaged or deformed from the
subset of
topological regions.
[0320] In some embodiments of method 2900, the final treatment relates
to treatment of a
shoulder defect.
52
CA 03139123 2021-11-03
WO 2020/227661
PCT/US2020/032165
[0321] In some embodiments of method 2900, the final treatment relates
to treatment of a
joint defect.
[0322] In some embodiments of method 2900, the final treatment relates
to treatment of a
diseased part of the anatomy.
[0323] In some embodiments of method 2900, the final treatment relates to
treatment of a
defected part of the anatomy.
Example Processing System
[0324] FIG. 30 depicts an exemplary processing system 3000 configured to
perform
methods for detecting and removing personally identifiable information.
[0325] Processing system 3000 includes a CPU 3002 connected to a data bus
3008. CPU
3002 is configured to process computer-executable instructions, e.g., stored
in memory 3010
or storage 3030, and to cause processing system 3000 to perform methods as
described herein,
for example with respect to FIGS. 27-29. CPU 3002 is included to be
representative of a single
CPU, multiple CPUs, a single CPU having multiple processing cores, and other
forms of
.. processing architecture capable of executing computer-executable
instructions.
[0326] Processing system 3000 further includes input/output devices and
interface 3004,
which allows processing system 3000 to interface with input/output devices,
such as, for
example, keyboards, displays, mouse devices, pen input, touch sensitive input
devices,
cameras, microphones, medical imaging equipment, and other devices that allow
for interaction
with processing system 3000. Note that while not depicted with independent
external I/0
devices, processing system 3000 may connect with external I/0 devices through
physical and
wireless connections (e.g., an external display device).
[0327] Processing system 3000 further includes network interface 3006,
which provides
processing system 3000 with access to external computing devices, such as via
network 3009.
[0328] Processing system 3000 further includes memory 3010, which in this
example
includes various components configured to perform the functions described
herein. In this
embodiments, memory 3010 includes imaging component 3012, modeling component
3014,
fitting component 3016, quantifying component 3018, classifying component
3020,
determining component 3022, selecting component 3024, displaying 3026, and
identifying
component 3028. These various components may, for example, comprise computer-
executable
instructions configured to perform the various functions described herein.
53
CA 03139123 2021-11-03
WO 2020/227661
PCT/US2020/032165
[0329] Note that while shown as a single memory 3010 in FIG. 30 for
simplicity, the
various aspects stored in memory 3010 may be stored in different physical
memories, but all
accessible CPU 3002 via internal data connections, such as bus 3012. For
example, some
components of memory 3010 may be locally resident on processing system 3000,
while others
may be performed on remote processing systems or in cloud-based processing
systems in other
embodiments. This is just one example.
[0330] Processing system 3000 further includes storage 3030, which in
this example
includes patient data 3032, medical imaging data 3034, patient population data
3036, treatment
data 3038, surgical device data 3040, default plan data 3042, pre-operating
plan data 3044,
intra-operative plan data 3046, post-operative plan data 3048, historical data
and plot 3050,
and SSM model data 3052. While not depicted in FIG. 30, other aspects may be
included in
storage 3030.
[0331] As with memory 3010, a single storage 3030 is depicted in FIG. 30
for simplicity,
but the various aspects stored in storage 3030 may be stored in different
physical storages, but
all accessible to CPU 3002 via internal data connections, such as bus 3008, or
external
connection, such as network interface 3006.
Additional Considerations
[0332] The preceding description is provided to enable any person
skilled in the art to
practice the various embodiments described herein. The examples discussed
herein are not
limiting of the scope, applicability, or embodiments set forth in the claims.
Various
modifications to these embodiments will be readily apparent to those skilled
in the art, and the
generic principles defined herein may be applied to other embodiments. For
example, changes
may be made in the function and arrangement of elements discussed without
departing from
the scope of the disclosure. Various examples may omit, substitute, or add
various procedures
or components as appropriate. For instance, the methods described may be
performed in an
order different from that described, and various steps may be added, omitted,
or combined.
Also, features described with respect to some examples may be combined in some
other
examples. For example, an apparatus may be implemented or a method may be
practiced using
any number of the aspects set forth herein. In addition, the scope of the
disclosure is intended
to cover such an apparatus or method that is practiced using other structure,
functionality, or
structure and functionality in addition to, or other than, the various aspects
of the disclosure set
54
CA 03139123 2021-11-03
WO 2020/227661
PCT/US2020/032165
forth herein. It should be understood that any aspect of the disclosure
disclosed herein may be
embodied by one or more elements of a claim.
[0333] As used herein, the word "exemplary" means "serving as an
example, instance, or
illustration." Any aspect described herein as "exemplary" is not necessarily
to be construed as
preferred or advantageous over other aspects.
[0334] As used herein, a phrase referring to "at least one of' a list of
items refers to any
combination of those items, including single members. As an example, "at least
one of: a, b, or
c" is intended to cover a, b, c, a-b, a-c, b-c, and a-b-c, as well as any
combination with multiples
of the same element (e.g., a-a, a-a-a, a-a-b, a-a-c, a-b-b, a-c-c, b-b, b-b-b,
b-b-c, c-c, and c-c-c
or any other ordering of a, b, and c).
[0335] As used herein, the term "determining" encompasses a wide variety
of actions. For
example, "determining" may include calculating, computing, processing,
deriving,
investigating, looking up (e.g., looking up in a table, a database or another
data structure),
ascertaining and the like. Also, "determining" may include receiving (e.g.,
receiving
information), accessing (e.g., accessing data in a memory) and the like. Also,
"determining"
may include resolving, selecting, choosing, establishing and the like.
[0336] The methods disclosed herein comprise one or more steps or
actions for achieving
the methods. The method steps and/or actions may be interchanged with one
another without
departing from the scope of the claims. In other words, unless a specific
order of steps or actions
is specified, the order and/or use of specific steps and/or actions may be
modified without
departing from the scope of the claims. Further, the various operations of
methods described
above may be performed by any suitable means capable of performing the
corresponding
functions. The means may include various hardware and/or software component(s)
and/or
module(s), including, but not limited to a circuit, an application specific
integrated circuit
(ASIC), or processor. Generally, where there are operations illustrated in
figures, those
operations may have corresponding counterpart means-plus-function components
with similar
numbering.
[0337] The various illustrative logical blocks, modules and circuits
described in connection
with the present disclosure may be implemented or performed with a general
purpose
processor, a digital signal processor (DSP), an application specific
integrated circuit (ASIC), a
field programmable gate array (FPGA) or other programmable logic device (PLD),
discrete
gate or transistor logic, discrete hardware components, or any combination
thereof designed to
CA 03139123 2021-11-03
WO 2020/227661
PCT/US2020/032165
perform the functions described herein. A general-purpose processor may be a
microprocessor,
but in the alternative, the processor may be any commercially available
processor, controller,
microcontroller, or state machine. A processor may also be implemented as a
combination of
computing devices, e.g., a combination of a DSP and a microprocessor, a
plurality of
microprocessors, one or more microprocessors in conjunction with a DSP core,
or any other
such configuration.
[0338] A processing system may be implemented with a bus architecture.
The bus may
include any number of interconnecting buses and bridges depending on the
specific application
of the processing system and the overall design constraints. The bus may link
together various
circuits including a processor, machine-readable media, and input/output
devices, among
others. A user interface (e.g., keypad, display, mouse, joystick, etc.) may
also be connected to
the bus. The bus may also link various other circuits such as timing sources,
peripherals, voltage
regulators, power management circuits, and other circuit elements that are
well known in the
art, and therefore, will not be described any further. The processor may be
implemented with
one or more general-purpose and/or special-purpose processors. Examples
include
microprocessors, microcontrollers, DSP processors, and other circuitry that
can execute
software. Those skilled in the art will recognize how best to implement the
described
functionality for the processing system depending on the particular
application and the overall
design constraints imposed on the overall system.
[0339] If implemented in software, the functions may be stored or
transmitted over as one
or more instructions or code on a computer-readable medium. Software shall be
construed
broadly to mean instructions, data, or any combination thereof, whether
referred to as software,
firmware, middleware, microcode, hardware description language, or otherwise.
Computer-
readable media include both computer storage media and communication media,
such as any
medium that facilitates transfer of a computer program from one place to
another. The
processor may be responsible for managing the bus and general processing,
including the
execution of software modules stored on the computer-readable storage media. A
computer-
readable storage medium may be coupled to a processor such that the processor
can read
information from, and write information to, the storage medium. In the
alternative, the storage
medium may be integral to the processor. By way of example, the computer-
readable media
may include a transmission line, a carrier wave modulated by data, and/or a
computer readable
storage medium with instructions stored thereon separate from the wireless
node, all of which
may be accessed by the processor through the bus interface. Alternatively, or
in addition, the
56
CA 03139123 2021-11-03
WO 2020/227661
PCT/US2020/032165
computer-readable media, or any portion thereof, may be integrated into the
processor, such as
the case may be with cache and/or general register files. Examples of machine-
readable storage
media may include, by way of example, RAM (Random Access Memory), flash
memory, ROM
(Read Only Memory), PROM (Programmable Read-Only Memory), EPROM (Erasable
Programmable Read-Only Memory), EEPROM (Electrically Erasable Programmable
Read-
Only Memory), registers, magnetic disks, optical disks, hard drives, or any
other suitable
storage medium, or any combination thereof. The machine-readable media may be
embodied
in a computer-program product.
[0340] A software module may comprise a single instruction, or many
instructions, and
may be distributed over several different code segments, among different
programs, and across
multiple storage media. The computer-readable media may comprise a number of
software
modules. The software modules include instructions that, when executed by an
apparatus such
as a processor, cause the processing system to perform various functions. The
software modules
may include a transmission module and a receiving module. Each software module
may reside
in a single storage device or be distributed across multiple storage devices.
By way of example,
a software module may be loaded into RAM from a hard drive when a triggering
event occurs.
During execution of the software module, the processor may load some of the
instructions into
cache to increase access speed. One or more cache lines may then be loaded
into a general
register file for execution by the processor. When referring to the
functionality of a software
module, it will be understood that such functionality is implemented by the
processor when
executing instructions from that software module.
[0341] The following claims are not intended to be limited to the
embodiments shown
herein, but are to be accorded the full scope consistent with the language of
the claims. Within
a claim, reference to an element in the singular is not intended to mean "one
and only one"
unless specifically so stated, but rather "one or more." Unless specifically
stated otherwise, the
term "some" refers to one or more. No claim element is to be construed under
the provisions
of 35 U.S.C. 112(f) unless the element is expressly recited using the phrase
"means for" or,
in the case of a method claim, the element is recited using the phrase "step
for." All structural
and functional equivalents to the elements of the various aspects described
throughout this
disclosure that are known or later come to be known to those of ordinary skill
in the art are
expressly incorporated herein by reference and are intended to be encompassed
by the claims.
Moreover, nothing disclosed herein is intended to be dedicated to the public
regardless of
whether such disclosure is explicitly recited in the claims.
57