Note: Descriptions are shown in the official language in which they were submitted.
CA 03142242 2021-11-29
WO 2020/254654 PCT/EP2020/067239
1
Description
FLUORESCENT COMPLEXES COMPRISING TWO RHODAMINE
DERIVATIVES AND A NUCLEIC ACID MOLECULE
The present invention relates to fluorescent compounds, in particular for the
detection of nucleic acids.
Cells constantly adapt their content to their needs, to changing environmental
conditions or to pre-determined cell-cycles and differentiation programs by
tuning their
gene expression landscape. In addition, live-cell imaging of protein-coding
gene
expression demonstrated that significant cell-to-cell variation in gene
expression occurs
even within population of isogenic cells within the same environment.
Currently, imaging
of gene expression in live cells relies mainly on proteins genetically
modified with either
fluorescent proteins or tags for specific chemical labelling. RNA is also an
important actor
that orchestrates key steps of gene expression regulation. However, converser
to
protein, no naturally fluorescent RNA has been discovered yet, making urgent
the need
for technologies enabling live-cell RNA monitoring with single-cell resolution
and leading
to the development of a palette of RNA detection methodologies especially
imaging
technologies.
The first breakthrough in live-cell RNA imaging came with the use of RNA-
binding
proteins (RBP) fused to fluorescence proteins (FP). In these completely
genetically
encoded systems, an array (tens of repeats) of the RNA RBP-binding motif is
incorporated into the 3' untranslated region of the target messenger RNA
(mRNA). Co-
expressing the gene coding for the corresponding RBP-FP in the same cell
allowed
tracking target RNA upon its decoration with FP. This methodology has enabled
collecting important data on gene expression and RNA trafficking and remained
so far,
the reference method. Substantial simplification of the approach is possible
by using
RNA-based fluorogenic modules in which bulky FPs are substituted by small
fluorogens,
i.e. dyes lighting up their fluorescence upon interaction with a target
(bio)molecule". In
this case, target mRNA is modified by the insertion of a specific nucleic acid
sequence,
so-called "light-up RNA aptamer", able to fold to form a binding pocket where
fluorogen
turns on its fluorescence.
Capacity of RNA to light-up fluorogenic dyes was first established with an
aptamer
interacting specifically with Malachite Green, but the toxicity of the
radicals produced
upon complex illumination limited its use for live-cell applications. Later
on, Jaffrey's lab
introduced the cell permeable and non-toxic GFP-mimicking fluorogen 3,5-
difluoro-4-
hydroxybenzylidene imidazolinone (DFHBI), together with Spinach, an RNA
aptamer
CA 03142242 2021-11-29
WO 2020/254654 PCT/EP2020/067239
2
able to bind and strongly activate DFHBI fluorescence. Further derivatives of
the aptamer
(i.e. Spinach2 and Broccoli) and of the corresponding fluorogen (i.e. DFHBI-
1T) were
later developed by the same lab and started to revolutionize RNA live-cell
imaging by
making possible to set-up a whole range of imaging-based applications.
Unfortunately,
DFHBI-based modules present limited brightness and photostability because of
their
rapid photoisomerization, making them less suited for low-abundant RNA
detection and
extended imaging time. Substantial gain in photostability and brightness was
achieved
by using fluorogens based on classical organic dyes (e.g. cyanines and
rhodamines),
including those operating by Photoinduced Electron Transfer (PET) or Forster
Resonance Energy Transfer (FRET) mechanisms. For instance, conjugates of
sulforhodamine B dye (SRB) with dinitroaniline (DN) PET quencher turn on their
fluorescence upon association with an aptamer binding the SRB (e.g. SRB-2
aptamer)
or the DN moiety. An alternative strategy, which could significantly improve
brightness
of the fluorogen, is to use a homo- or hetero-dimer of dyes that self-quenches
in aqueous
solution but becomes fluorescent upon dimer opening after binding to the
target
biomolecule. So far, this concept has yielded probes for detecting ligand-
receptor
interaction or DNA hybridization, but it has not been proposed for designing
fluorogens
activated by light-up RNA aptamers. Brightness and photostability also rely on
the
aptamer itself as nicely illustrated by Corn, an aptamer that recognizes and
activates the
fluorescence of the 3,5-difluoro-4-hydroxybenzylidene imidazolinone-2-oxime
(DFHO).
In this case, the fluorogen is caged in a pocket formed by two RNA monomers,
which
protects it from rapid photoinactivation, conferring the module an impressive
photostability.
Light-up aptamers are usually isolated by a Systematic Evolution of Ligand by
Exponential enrichment (SELEX) approach, a powerful technology for selecting
aptamers with very high affinity and selectivity for their target, as
exemplified by Mango
RNA, a light-up aptamer binding its fluorogen (the biotinylated Thiazole
Orange-1 or
TO1-biotin) with nanomolar affinity. However, SELEX does not select molecules
for their
fluorogenic capacities, a limitation that can be overcome by the use of a
functional
screening.
For instance, using microfluidic-assisted in vitro compartmentalization
(pIVC),
allowed to recently identify mutants of the Spinach and Mango aptamers
displaying both
improved brightness and folding efficiency as illustrated in the international
application
W02018198013.
However, live-cell imaging of RNA remains a challenge because RNA aptamers
that can light-up small fluorogenic dyes could still suffer from poor
brightness and
photostability.
CA 03142242 2021-11-29
WO 2020/254654 PCT/EP2020/067239
3
The present invention intends to obviate these drawbacks.
One aim of the invention is to provide new and efficient means allowing to
live-cell
imaging of RNA with enhanced brightness and photostability.
The invention relates to a molecular complex emitting fluorescent light
comprising,
or consisting essentially of a fluorophore, and a nucleic acid molecule,
wherein said fluorophore has of the following formula 1
L3
I
i
Li "2
1
Al
A
I I
Fdl Fd2 (i)
wherein
- independently from each other, Fd1 and Fd2 are fluorescent dyes,
1- c-Ri ¨N
- D1 represents a group chosen from: ¨I¨ , ,vvi.µ or
.1., , or from a
cyclo(03-07)alkyl, a monocyclic aromatic group, heterocyclic group or a
monocyclic non-
aromatic, alkane or heterocyclic group, wherein R' represents a hydrogen atom
or a (Ci-
08)alkyl, linear or cyclic, saturated or not,
- independently from each other, L1 and L2 is covalently bound to D1, is a
group
consisting of a single bond; a linear or branched alkyl group having from 1 to
24 carbon
atoms (01-024), at least one of said carbon atoms being replaced by an
heteroatom, e.g.
0, N, S, or not, said alkyl group being substituted or not by an amido, an
amino, a keto,
an oxy or a carboxyl group or a linear or branched unsaturated or not alkyl
group having
from 2 to 24 carbon atoms, at least one of said carbon atoms being replaced by
an
heteroatom e.g. 0, N, S, or not, said alkyl group being substituted or not by
an amido,
an amino, a keto, an oxy, a carboxyl group;
- L3 is a hydrogen atom or corresponds to L1 or L2, i.e. a linear or branched
alkyl
group having from 1 to 24 carbon atoms (01-024), at least one of said carbon
atoms being
replaced by an heteroatom, e.g. 0, N, S, or not, said alkyl group being
substituted or not
by an amido, an amino, a keto, an oxy or a carboxyl group or a linear or
branched
unsaturated or not alkyl group having from 2 to 24 carbon atoms, at least one
of said
carbon atoms being replaced by an heteroatom e.g. 0, N, S, or not, said alkyl
group
being substituted or not by an amido, an amino, a keto, an oxy, a carboxyl
group, possibly
substituted by a functionalizable moiety, e.g. azide, alkyne, DBCO, active
ester,
CA 03142242 2021-11-29
WO 2020/254654 PCT/EP2020/067239
4
carboxylic acid, maleimide group or a functional molecule such as a ligand or
a
biomolecule e.g. biotin, or desthiobiotin, and
- A is a 01-012 alkyl, linear or cyclic, possibly substituted by an aryl,
preferably a
phenyl, substituted or not,
said fluorophore being submitted to quenching or energy transfer when it is
not
associated to said nucleic acid molecule in aqueous solution, or said
fluorophore being
submitted to quenching or energy transfer when considered alone in aqueous
solution,
wherein said nucleic acid molecule is able to activate the fluorescence of
said
fluorophore in an aqueous solution, when interacting with said fluorophore,
and
wherein said nucleic acid molecule is able to specifically interact, in a
sequence
specific manner, with said fluorophore.
The inventors unexpectedly identified molecular complex comprising essentially
a
fluorophore and a nucleic acid molecule that is soluble in aqueous solution,
can be used
in cell culture and in vivo, harbours high brightness properties and is only
activatable
when both compounds interact together.
The compounds that constitute the complex, are therefore the fluorophore and
the
nucleic acid molecule.
Fluorophore
The fluorophore of the complex described above is a fluorophore of formula 1,
L3
I
Di
L'i L 12
i 1
A A
I I
Fdl Fd2 (I)
and contains two fluorescent dyes Fd1 and Fd2 that can be identical or
different.
Both Fd1 and Fd2 are dyes that can re-emit light upon light excitation. Fd1
and
Fd2 typically contain several combined aromatic groups, or planar or cyclic
molecules
with several u bonds. It can be coumarins, pyrenes, cyanines, BODIPYs,
merocyanines
an their derivatives well known in the art. It is advantageous the Fd1 and Fd2
be
xanthene derivatives such as fluorescein dye, rhodamine dye, sulforhodamine
dye,
Oregon green dye, eosin dye, and Texas red dye, silicon-rhodamine dye, or one
of their
derivatives well known in the art.
Due to the structure of the fluorophore, both Fd1 and Fd2 dyes are chemically
linked to each other and, depending upon the environmental conditions can be
close
together. This results in a decrease of the fluorescence intensity, or an
absence of
CA 03142242 2021-11-29
WO 2020/254654 PCT/EP2020/067239
fluorescence at the emitting wavelength, when both dyes are excited at the
specific
wavelength. This phenomenon is the quenching or energy transfer.
Thus, when the fluorophore is in an environment, e.g. aqueous solution, that
induces the rapprochement of both dyes, quenching occurs and no fluorescence,
or a
5
decreased fluorescence, is emitted by the fluorophore when excited at the
appropriated
wavelength. On the contrary, when the fluorophore is in an appropriate
environment, e.g.
organic solvent, Fd1 and Fd2 are far from each other and the quenching does
not occur.
Based on these properties, the inventors engineered a strategy to specifically
activate the fluorescence of said fluorophore, when the fluorophore is in
aqueous
solution, i.e. when the fluorophore is in physiological conditions to be used
in living cells.
The inventors identified that nucleic acid molecules can specifically interact
with
said fluorophore, such that:
- the fluorescence is enhanced compared to the fluorescence of the
fluorophore,
when it does not interact with said nucleic acid molecule, or when said
fluorophore is placed alone in an organic solvent that does not induce
quenching, and
- the interaction is very specific with a high affinity.
In the fluorophore described above, L3 represents a functionalizable moiety
that
can be used to detect, isolate or purify the fluorophore.
L1 and L2 correspond to the "arms" of the fluorophore that associate to each
other
Fd1 and Fd2 dyes. L1 and L2 are covalently linked to each other via D1, as
defined
above.
L1 and L2 independently from each other can be:
- either a single bound, such that the fluorophore will have the following
formula
L3
I
D1
A'7 A
I I
Fdl Fd2,
when both L1 and L2 are a single bound,
- or a linear or branched alkyl group having 1, or, 2, or 3, or 4, or 5, or
6, or 7, or
8, or 9, or 10, or 11, or 12, or 13, or 14, or 15, or 16, or 17, or 18, or 19,
or 20,
or 21, or 22, or 23 or 24 carbon atoms
- or a linear or branched alkyl group having 1, or, 2, or 3, or 4, or 5, or 6,
or 7, or
8, or 9, or 10, or 11, or 12, or 13, or 14, or 15, or 16, or 17, or 18, or 19,
or 20,
or 21n, or 22, or 23 or 24 carbon atoms, wherein at least one carbon atom is
substituted by an hetero atom, e.g. 0, N or S,
CA 03142242 2021-11-29
WO 2020/254654 PCT/EP2020/067239
6
- or a linear or branched alkyl group having 1, or, 2, or 3, or 4, or 5, or
6, or 7, or
8, or 9, or 10, or 11, or 12, or 13, or 14, or 15, or 16, or 17, or 18, or 19,
or 20,
or 21n, or 22, or 23 or 24 carbon atoms, said alkyl group being itself
substituted
by an amido, an amino, a keto, an oxy, a carboxyl group, a linear or branched
unsaturated or not alkyl group having from 2 to 24 carbon atoms,
- or a linear or branched alkyl group having 1, or, 2, or 3, or 4, or 5, or
6, or 7, or
8, or 9, or 10, or 11, or 12, or 13, or 14, or 15, or 16, or 17, or 18, or 19,
or 20,
or 21n, or 22, or 23 or 24 carbon atoms, wherein at least one carbon atom is
substituted by an hetero atom, e.g. 0, N or S, the carbon and/or the
heteroatoms of said alkyl group being themselves substituted by an amido, an
amino, a keto, an oxy, a carboxyl group, a linear or branched unsaturated or
not alkyl group having from 2 to 24 carbon atoms.
In the fluorophore, A represents a 01-012 alkyl, i.e. a Ci, a 02, a Cs, a 04,
a 05, a
06, a 07, a Cs, a 09, a Cio, a Cii, or a 012 alkyl, or a 01-012 alkyl
substituted by an
aryl group, said aryl being substituted or not.
Nucleic acid molecule.
In the complex disclosed above, the nucleic acid molecule interacts with the
fluorophore such that it inhibits or avoids quenching that occurs between both
Fd1 and
Fd2 dyes. This interaction is specific of the nucleic acid molecule sequence,
such that
the nucleic acid molecule should advantageously have a determined nucleic acid
sequence to interact with said fluorophore.
The nucleic acid molecule in the invention is a Deoxyribonucleotide molecule
(DNA
molecule), a Ribonucleotide molecule (RNA molecule), or any derived nucleic
acid
molecules such as XNA, Spiegelmer molecule (or L-RNA molecules), or molecules
comprising 2'Fluoro, or 2' Methoxy nucleotides. The nucleic acid molecule is
preferably
a ribonucleic acid molecule (RNA molecule) that can adopt a specific three-
dimensional
conformation allowing the activation of the fluorophore submitted to quenching
or energy
transfer. This nucleic acid molecule is in particular an aptamer, having a
high affinity to
said fluorophore, and which induce a high brightness of the fluorophore
further to the
interaction.
In the invention, the nucleic acid molecule can contain advantageously a
sequence
that is repeated once, i.e. the nucleic acid contain a repeat of a determined
sequence.
Advantageously, the invention relates to the molecular complex as defined
above,
wherein Fd1 and Fd2 are represented by formula 2:
CA 03142242 2021-11-29
WO 2020/254654 PCT/EP2020/067239
7
R 1 R1
R2 R2
R3 R3 (2)
Wherein
X is NH, 0(R)2, 0, Si(R)2 Ge(R)2 Sn(R)2 P(R)2 B(R)2 S, SO2, Se, Te, Te0,
wherein R can be alkyl or aromatic groups, or 0, 0-alkyl, sulfonyl such as
sulfonate (S03-) or sulfonamide;
, R4
NL R5
Y is 0, N-R6 or
+' R4
NR,
Y' is 0-R'6 or N-R'7 or
R1 and R'1 independently from each other, are H, a halogen atoms or a (01-018)
alkyls, linear or cyclic, possibly branched,
R2, R'2, R3, R'3 can be H, sulfonyl such as sulfonate (S03-) or sulfonamide;
R2 and R4 may form, together with the atoms of the carbon cycle to which R2 is
connected to, at least one fused aromatic heterocycle, said heterocycle cycle
having 5 to 9 atoms,
R'2 and R'4 may form, together with the atoms of the carbon cycle to which R'2
is
connected to, at least one fused aromatic heterocycle, said heterocycle cycle
having 5 to 9 atoms,
R5 and R3 may also form, together with the atoms of the carbon cycle to which
R3
is connected to, at least one fused aromatic heterocycle, said heterocycle
cycle
having 5 to 9 atoms,
R'5 and R'3 may also form, together with the atoms of the carbon cycle to
which
R'3 is connected to, at least one fused aromatic heterocycle, said heterocycle
cycle having 5 to 9 atoms,
R4 and R5 may also form at least one fused aromatic heterocycle, said
heterocycle cycle having 3 to 9 atoms,
R'4 and R'5 may also form at least one fused aromatic heterocycle, said
heterocycle cycle having 3 to 9 atoms, and
111, R'4, R5, R'5, R6 and R'7, independently from each other, are
polymethylene
unit having 1 carbon to about 20 carbons, inclusive, optionally comprising at
least
one hetero atom selected from N, 0 and S.
CA 03142242 2021-11-29
WO 2020/254654 PCT/EP2020/067239
8
More advantageously, the invention relates to the above mentioned molecular
complex, wherein said fluorophore has the following formula 3:
L3
CHn----
CH2
NH.............../
0 /
0/NH
NH
NH
A/
A'/
G
G
Ri Ri
Ri Ri
R2 R2
R2 R2
IR,4 R4y X Y R4 R4
1 1 y X Y
R5 R3 R3 R5 I I
R5 R3 R3 R5 (3),
in particular formula 3-1
L3
CH2--CH2
NH................/
0/
NH
0/
NH
0,. / NH
"Scs,0 0-, /
C 1/3
C
I
I
G
G
R1 R1
R1 R1
R'2 R2
R'2 R2
IR,4 R4y X Y IR,4
1 1 R4y X Y
R5 R3 R3 R5 I I
R5 R3 R3 R5 (3_1)
CA 03142242 2021-11-29
WO 2020/254654 PCT/EP2020/067239
9
Wherein R1, R'1, R2, R'2, R3, R'3, 111, R'4, R6, R'6, R6 and R'7 and L3 are as
defined
above, and A' and A" are independently from each other ether bond, ester,
thioether,
thioester, amide, sulfonamide, carbamate, thiocarbamate urea or thiourea,
Wherein G is H, an alkane (CH3), amido, an amino, a keto, an oxy, a carboxyl,
a
.. sulfo, sulfonyl or sulfonate group), a halide atom.
G can be in ortho, or meta or para position and can be repeated on the benzyl
cycle.
A' and A" can be in ortho, meta or para position
More advantageously, the invention relates to the molecular complex as defined
above, wherein said ¨A¨Fd1 and ¨A¨Fd2 groups are one of the following
fluorophores:
.. Rhodamine, Sulfo-Rhodamine, non-N-Alkylated Rhodamine, Ethyl-alkylated
rhodamine,
fluorescein, Silicon-Rhodamine, or carborhodamine.
In one advantageous embodiment, the invention relates to the molecular complex
as defined above, wherein said fluorophore is one of the following compounds:
o
--NH
HN
H2N
HN
0
0 r_J o
_ NH2
OH i-0
0
0 rj
(-0
NH
0 N-N
0
0
0 HN,y-L
N
H
0
NH
2
0
H2N
/ )
0......NH
HO H
N.r
0 0
Gemini-490-1 (4),
CA 03142242 2021-11-29
WO 2020/254654 PC T/EP2020/067239
0
.,,i-i
HN .. .
Hs' S
HN
o--r
ri
(-0
I \ / I
N Si N N¨N
/ ....... 0
/
,
1
0 HN.,..1
Si HN \ 1\
S...... I
N
N.....
H I
-...y.õN...... S..........õ-^=.,
NH -....,
0 =yLo C00-
H
HNI.r.......,,N
0 0
Gemini 640-1 (5),
NGL/
/
0
\ )
N
_i
N
eo3s o\
H 0
"S¨N IL
0 H N
e
o so3
0
H
HN,..........õõN¨p*,..
(I '
o
Gemini 561-1 (6),
CA 03142242 2021-11-29
WO 2020/254654 PCT/EP2020/067239
11
0._-NHp
HN ..
Fr S
C1/ HN
N
/ ii 0
0 o_-/-
¨\N /
r---/
\
_/ ro
o,s N
C)\
H 0
e N-N
c(N
CY \\ \
N/¨
0 H
NH e \_
so3
o 0
H
HNIN¨S
# 0
0
0
Gemini 561-2 (7),
/
.....-N
CX
0
HO
\Si \ H
k
/-
.s" C ,0 N
--N 0 NH H rk07'''Voii-411
\
N,
0 _52
0-114 ,õ,IL
11 N
)
2NH Gemini-640-2
-NJ / HN 0
\
\Si \
/
HO
0
-N
\ (8)
and
CA 03142242 2021-11-29
WO 2020/254654 PCT/EP2020/067239
12
0
0
N1-1
00C- * 07NH 0
\N
/
= 4111 0 NH
- OID
00C
Gemini 552-alkyne (9).
In another advantageous embodiment, the invention relates to the above
mentioned molecular complex, wherein said complex harbors a fluorescence
intensity at
least 3-fold higher compared to the fluorescence intensity of corresponding
free
uncomplexed fluorophore in aqueous medium and wherein said nucleic acid
molecule
has an affinity quantified by a Kd value of at most 500 nM, preferably lower,
for said
fluorophore.
In the invention, affinity has its common sense well known in the art, the
tendency
of a chemical species to react with another species to form a chemical
compound. Affinity
can also be referred to as the tendency of certain atoms (or molecules) to
aggregate or
bond together, and includes electrostatic interactions, hydrogen bounds,
The term "specifically binding", "specifically binds" or "specifically
interacts" is used
herein to indicate that this moiety has the capacity to recognize and interact
specifically
with the molecular target of interest, while having relatively little
detectable reactivity with
other structures present in the aqueous phase such as other molecular targets
that can
be recognized by other probes. There is commonly a low degree of affinity
between any
two molecules due to non-covalent forces such as electrostatic forces,
hydrogen bonds,
Van der Waals forces and hydrophobic forces, which is not restricted to a
particular site
on the molecules and is largely independent of the identity of the molecules.
This low
degree of affinity can result in non-specific binding. By contrast when two
molecules bind
specifically, the degree of affinity is much greater than such non-specific
binding
interactions. In specific binding a particular site on each molecule
interacts, the particular
sites being structurally complementary, with the result that the capacity to
form non-
covalent bonds is increased. The term "sequence-specific" binding or
interaction refers
to specific binding of a molecule to a nucleic acid of a given sequence,
whereas the
mentioned molecule cannot bind to nucleic acids of other sequences.
The fluorescence enhancement can be measured by a fluorometer and can be
obtained by dividing the maximum fluorescence intensity of the fluorophore
alone in
CA 03142242 2021-11-29
WO 2020/254654 PCT/EP2020/067239
13
aqueous medium by the maximum fluorescence intensity of the fluorophore in the
presence of the said nucleic acid in the same medium an at the same
concentration.
The Kd value can be obtained by measuring the fluorescence intensity of the
fluorophore in aqueous medium with increasing amount of the said nucleic acid.
The plot
of the fluorescence intensity versus the concentration of the said nucleic
acid will provide
the Kd value after fitting with the proper equation (example: Hill equation).
The change in the brightness and Kd values can be acquired using standard
fluorescence spectrometer, where the complex and the fluorophore alone are
measured
in aqueous medium in a cuvette.
The affinity of a molecule X for its partner Y can generally be represented by
the
dissociation constant (Kd). In preferred embodiments, the Kd representing the
affinity
between the capture moiety and the molecular target of interest is from 1.10-
7M or lower,
preferably from 1.10-8M or lower, and even more preferably from 1.10-9M or
lower.
Specificity and affinity can be relatively determined by binding or
competitive assays,
using e.g., Biacore instruments.
Advantageously, the invention relates to the above-mentioned molecular
complex,
wherein said nucleic acid molecule comprises a first and a second region, said
first and
second regions being such that:
- the first region comprises the nucleotide sequence of SEQ ID NO: 1;
(UGAUGGA) and
- the second region comprises the nucleotide sequence of SEQ ID NO: 2
(CAAGG U UAAC),
provided that said nucleic acid molecules is not the nucleic acid molecule
consisting of
the sequence as set forth in SEQ ID NO: 3 (SRB2)
5'-GGGAGACAGCUAGAGUACGGAACCUCGCUUCGGCGAUGAUGGACAGGUUCC
GACACGAGCACAGUGUAC-3', the above proviso does not concern the molecules of
SEQ ID NO: 3 having at least one modified nucleotides, such as 2'-fluoro
nucleotides.
Advantageously, the nucleic acid molecule as defined above comprises 2
sequences SEQ ID NO: 1 and two sequences SEQ ID NO: 2.
For instance the nucleic acid molecule comprises:
- the first region comprises the nucleotide sequence of SEQ ID NO: 1;
(UGAUGGA),
repeated twice and
- the second region comprises the nucleotide sequence of SEQ ID NO: 2
(CAAGG UUAAC), or
- the first region comprises the nucleotide sequence of SEQ ID NO: 1;
(UGAUGGA), and
- the second region comprises the nucleotide sequence of SEQ ID NO: 2,
repeated twice,
or
CA 03142242 2021-11-29
WO 2020/254654 PCT/EP2020/067239
14
- the first region comprises the nucleotide sequence of SEQ ID NO: 1;
(UGAUGGA),
repeated twice and
- the second region comprises the nucleotide sequence of SEQ ID NO: 2
(CAAGGUUAAC), repeated twice.
The first and the second regions of SEQ ID NO: 1 and SEQ ID NO: 2 constitute
the minimal essential domain of the nucleic acid molecule responsible of the
activation
of the fluorescence properties of said fluorophore in aqueous solution.
Advantageously, the invention relates to the nucleic acid molecule as defined
above,
said nucleic acid molecule being a linear single-stranded molecule, a circular
single-
stranded molecule or a two-stranded molecule.
As disclosed in the art, the nucleic acid according to the invention may be a
linear
single-stranded molecule. The sequences SEQ ID NO: 1 and SEQ ID NO: 2 are
separated from each other in the same molecule but are close to each other
when the
molecule acquires its final tridimensional conformation.
Moreover, the nucleic acid molecule can be a circular single-stranded
molecule. In
this case, the molecule has the same structure than a linear single-stranded
molecule,
except that the 5'- and 3'- ends are linked by a phosphodiester bond.
The nucleic acid molecule according to the invention can also be constituted
by
two separated molecules, the first one containing the sequence SEQ ID NO: 1
and the
second one containing the sequence SEQ DI NO: 2, these two molecules being
close to
each other to confer the molecule a structure similar to the structure adopted
by a single
stranded molecule.
In the invention, when the nucleic acid molecule is a single stranded linear
or
circular molecule, both sequences are contained in the same molecule. By
contrast,
when the aptamer is constituted by two different single stranded molecules,
each
sequence is contained in one specific molecule, i.e. the two sequences are
advantageously not contained by the same single stranded molecule.
Advantageously, the invention relates to the above molecular complex, wherein
the nucleic acid molecule comprises one of the nucleotide sequences of
- (N)a UGAUGGA (N)bCAAGGUUAAC (N)a (SEQ ID NO: 4),
- (N)a CAAGGUUAAC (N), UGAUGGA (N)a (SEQ ID NO: 5), or
the two following sequences
- (N)aUGAUGGA(N)b (SEQ ID NO: 6),
(N)aCAAGGUUAAC(N)b (SEQ ID NO: 7),
wherein a, b and c are integer
a is higher than or equal to 4, preferably varies from 4 to 100,
b is higher than or equal to 1, preferably varies from 3 to 50,
CA 03142242 2021-11-29
WO 2020/254654 PCT/EP2020/067239
c is higher than or equal to 1, preferably varies from 1 to 200,
or any variant of said nucleic acid molecule by substitution of at least one
nucleic acid of one at least of said sequences SEQ ID NO: 4, SEQ ID NO: 5, SEQ
ID
NO: 6 and SEQ ID NO : 7, provided that said variant retains the ability to
interact with
5 .. said fluorophore and is able to induce fluorescence in aqueous solution.
In the above sequences, a varies from 1 to 100, which means that a can be
equal
to 1, 2, 3, 4, 5, 6, 7, 8, 9, 10, 11, 12, 13, 14, 15, 16, 17, 18, 19, 20, 21,
22,
23, 24, 25, 26, 27, 28, 29, 30, 31, 32, 33, 34, 35, 36, 37, 38, 39, 40, 41,
42,
43, 44, 45, 46, 47, 48, 49, 50, 51, 52, 53, 54, 55, 56, 57, 58, 59, 60, 61,
62,
10 63, 64, 65, 66, 67, 68, 69, 70, 71, 72, 73, 74, 75, 76, 77, 78, 79, 80,
81, 82,
83, 84, 85, 86, 87, 88, 89, 90, 91, 92, 93, 94, 95, 96, 97, 98, 99 and 100.
In the above sequences, b varies from 1 to 50, which means that b can be equal
to 1,2, 3, 4, 5, 6, 7, 8, 9, 10, 11, 12, 13, 14, 15, 16, 17, 18, 19, 20, 21,
22, 23,
24, 25, 26, 27, 28, 29, 30, 31, 32, 33, 34, 35, 36, 37, 38, 39, 40, 41, 42,
43,
15 .. 44, 45, 46, 47, 48, 49 and 50.
In the above sequences, c varies from 4 to 200, which means that c can be
equal to 4,
5, 6, 7, 8, 9, 10, 11, 12, 13, 14, 15, 16, 17, 18, 19, 20, 21, 22, 23, 24, 25,
26, 27, 28, 29, 30, 31, 32, 33, 34, 35, 36, 37, 38, 39, 40, 41, 42, 43, 44,
45,
46, 47, 48, 49, 50, 51, 52, 53, 54, 55, 56, 57, 58, 59, 60, 61, 62, 63, 64,
65,
66, 67, 68, 69, 70, 71, 72, 73, 74, 75, 76, 77, 78, 79, 80, 81, 82, 83, 84,
85,
86, 87, 88, 89, 90, 91, 92, 93, 94, 95, 96, 97, 98, 99, 100, 101, 102, 103,
104, 105, 106, 107, 108, 109, 110, 111, 112, 113, 114, 115, 116, 117, 118,
119, 120, 121, 122, 123, 124, 125, 126, 127, 128, 129, 130, 131, 132, 133,
134, 135, 136, 137, 138, 139, 140, 141, 142, 143, 144, 145, 146, 147, 148,
149, 150, 151, 152, 153, 154, 155, 156, 157, 158, 159, 160, 161, 162, 163,
164, 165, 166, 167, 168, 169, 170, 171, 172, 173, 174, 175, 176, 177, 178,
179, 180, 181, 182, 183, 184, 185, 186, 187, 188, 189, 190, 191, 192, 193,
194, 195, 196, 197, 198, 199 and 200.
In one advantageous embodiment, the invention relates to the above-defined
molecular complex, wherein the nucleic acid molecule comprises, or consists
essentially
of, or consists of one of the nucleotide sequences as set forth in SEQ ID NO:
8, SEQ ID
NO: 8, SEQ ID NO: 9, SEQ ID NO: 10, SEQ ID NO: 11, SEQ ID NO: 12, SEQ ID NO:
13, SEQ ID NO: 14, SEQ ID NO: 15, SEQ ID NO: 16, SEQ ID NO: 17, SEQ ID NO: 18,
SEQ ID NO: 19, SEQ ID NO: 20, SEQ ID NO: 21, SEQ ID NO: 22, SEQ ID NO: 23, SEQ
.. ID NO: 24, SEQ ID NO: 25, SEQ ID NO: 26, SEQ ID NO: 27 and SEQ ID NO: 29.
SEQ ID NO: 8 represents o-Coral
CA 03142242 2021-11-29
WO 2020/254654 PCT/EP2020/067239
16
5'-GGGAGACAGCUAGAGUACAGGAACCCCGCUUCGGCGGUGAUGGAGAGGCGC
AAGGUUAACCGCCUCAGGUUCCGGUGACGGGGCCUCGCUUCGGCGAUGAUGG
AGAGGCGCAAGGUUAACCGCCUCAGGUUCUGACACGAGCACAGUGUAC-3'
SEQ ID NO: 9 represents 4010
5'-AGAACCCCGCUUCGGCGGUGAUGGAGAGGCGCAAGGUUAACCGCCUCAGGU
UCC(N)dGGGGCCUCGCUUCGGCGAUGAUGGAGAGGCGCAAGGUUAACCGCCUC
AGGUUCU-3', wherein N represents A, U, G or C, and d vary from 18 to 60
nucleotides,
SEQ ID NO: 10 represents 4038
5'-GGAACCUCGCUUCGGCGAUGAUGGAGAGGCGCAAGGUUAACCGCC-CCGGU
UCC(N)dGGAACCCCGCUUCUGCGGUGAUGGAGAGGCGCAAUGUUAACCGCCUC
AGGUUCC-3', wherein N represents A, U, G or C, and d vary from 18 to 60
nucleotides,
SEQ ID NO: 11 represents 4031
5'-AGAACCCCGCUUCGGCGGUGAUGGAGAGGCGCAAGGUUAACCGCCUCAGGU
UCC(N)dGGGGCCUCGCUUCGGCGAUGAUGGAGAGGCGCAAGGUUAACCGCCUC
AGGUUCC-3', wherein N represents A, U, G or C, and d vary from 18 to 60
nucleotides,
SEQ ID NO: 12 represents 4011
5'-GGAACCUCGCUUCGGCGAUGAUGGAGAGGCGCAAGGUUAACCGCCUCAGGU
UCC(N)dGGAACCUCGCUUCGGCGAUGAUGGAGAGGCGCAAGGUUAACCGCCUC
AGGUUCC-3', wherein N represents A, U, G or C, and d vary from 18 to 60
nucleotides,
SEQ ID NO: 13 represents 4031
5'-GGAACUUCGCUUCGGCGAUGAUGGAGAGGCGCAAGGUUAACCGCCUCAGGU
UCC(N)dGGAACUUCGCUUCGGCGAUGAUGGAGAGGCGCAAGGUUAACCGCCUC
AGGUUCC-3', wherein N represents A, U, G or C, and d vary from 18 to 60
nucleotides,
SEQ ID NO: 14 represents 405
5'-GGGACCCCGCUUCGGCGGUGAUGGAGAGGCGCAAGGUUAACCGCCUCAGGU
UCC(N)dGGAACCUCGCUUCGGCGAUGAUGGAGGGGCGCAAGGUUAACCGCCUC
AGGUUUC-3', wherein N represents A, U, G or C, and d vary from 18 to 60
nucleotides,
SEQ ID NO: 15 represents 4012
5'-GGAGCCCCGCUUCGGCGGUGAUGGAGAGGCGCAAGGCUAACCGCCUC-GGU
UCC(N)dGGAGCCUCGCUUCGGCGAUGAUGGAGAGGCGCAAGGUUAACCGCCUC
AGGUUCC-3', wherein N represents A, U, G or C, and d vary from 18 to 60
nucleotides,
SEQ ID NO: 16 represents 4033
5'-GGAACCUCGCUUCGGCGAUGAUGGAGAGGCGCAAGGUUAACCGCCUCAGGU
UCC(N)dGGAGCCUCGCUUCGGCGAUGAUGGAGGGGCGCAAGGUUAACCGCCUC
AGGUUCA-3', wherein N represents A, U, G or C, and d vary from 18 to 60
nucleotides,
SEQ ID NO: 17 represents 4017
CA 03142242 2021-11-29
WO 2020/254654 PCT/EP2020/067239
17
5'-GGAACCUCACUUCGGUGAUGAUGGAGAGGCGCAAGGUUAACCGCCUCAGGU
UCC(N)dGGAGCCUCGCUUCGGCGAUGAUGGAGAGGCGCAAGGUUAACCGCCUC
AGGUUCC-3', wherein N represents A, U, G or C, and d vary from 18 to 60
nucleotides,
SEQ ID NO: 18 represents 4026
5'-GGGACCUCGUUUCGGCGAUGAUGGAGAGGCGCAAGGUUAACCGCCUCAGGU
UCC(N)dGGAGCCUCGCUUCGGCGAUGAUGGAGAGGCGCAAGGUUAACCGCCUC
AGGUUCC-3', wherein N represents A, U, G or C, and d vary from 18 to 60
nucleotides,
SEQ ID NO: 19 represents 3014
5'-GGAGCCUCGCUUAGGCGAUGAUGGAGAGGCGCAAGGUUAACCGCCUCAGGU
UCC(N)dGGAACCUCGCUUCGGCGAUGAUGGAGAGGCGCAAGGUUAACCGCCUC
AGGUUCC-3', wherein N represents A, U, G or C, and d vary from 18 to 60
nucleotides,
SEQ ID NO: 20 represents 3022
5'-GGAACCCCGCUUCGGUGGUGAUGGAGAGGCGCAAGGUUAACCGCGUCAGGU
UCC(N)dGGAACCUCGCUUCGGCGAUGAUGGAGAGGCGCAAGGUUAACCGCCUC
AGGUUCC-3', wherein N represents A, U, G or C, and d vary from 18 to 60
nucleotides,
SEQ ID NO: 21 represents 406
5'-GGAACCUCGCUUCGGCGAUGAUGGAGAGGCGCAAGGUUAACCGCCUCAGGU
UCC(N)dGGAAUCUCGCUUCGGCGAUGAUGGAGAGGCGCAAGGUUAACCGCCUC
AGGUUCC3-', wherein N represents A, U, G or C, and d vary from 18 to 60
nucleotides,
SEQ ID NO: 22 represents 4013
5'-GGAACCUCGCUUCGGCGAUGAUGGAGAGGCGCAAGGUUAACCGCCUC-GGU
UCC(N)dGGAAUCUCGCUUCGGCGAUGAUGGAGAGGCGCAAGGUUAACCGCCUC
AGGUUCC-3', wherein N represents A, U, G or C, and d vary from 18 to 60
nucleotides,
SEQ ID NO: 23 represents 3032
5'-GGAACUUCGCUUCGGCGAUGAUGGAGAGGCGCAAGGUUAACCGCCUCAGGU
UCC(N)dGGAACUUCGCUUCGGCGAUGAUGGAGAGGCGCAAGGUUAACCGCCUC-
GGUUCC-3', wherein N represents A, U, G or C, and d vary from 18 to 60
nucleotides,
SEQ ID NO: 24 represents 3021
5'-GGGACCUCGCUUCGGCGAUGAUGGAGAGGCACAAGGUUAACUGCCUCAGGU
UCC-3',
SEQ ID NO: 25 represents 302
5'-GGAACCUCGCUUCGGCGAUGAUGGAGAGGCACAAGGUUAACUGCCUCAGGU
UCC-3',
SEQ ID NO: 26 represents 402
5'-GGAACCUCGCUUCGGCGAUGAUGGAGAGGCGCAAGGUUAACCGCCUCAG-UU
CC(N)dGGAACUUCGCUUCGGCGAUGAUGGAGAGGCGCAAGGUUAACCGCCUCA
GGUUCC-3', wherein N represents A, U, G or C, and d vary from 18 to 60
nucleotides,
CA 03142242 2021-11-29
WO 2020/254654 PCT/EP2020/067239
18
SEQ ID NO: 27 represents 303
5'-GGAACCUCGCUUCGGCGAUGAUGGAGAGGCGCAAUGUUAACCGCCUC-GGU
UCC-3',
SEQ ID NO: 28 represents 3031
5'-GGAACCUCGCUUCGGCGAUGAUGGAGGGGCGCAAGGUUAACCGCCUC-GGU
UCC(N)dGGAACCUCGCUUCGGCGAUGAUGGAGAGGCGCAAGGUUAACCGCCUC
AGGUUCC-3', wherein N represents A, U, G or C, and d vary from 18 to 60
nucleotides,
SEQ ID NO: 29 represents the following sequence
5'-G UGC UCGCU UCGGCAGCACAUAUACUAGUCGACU UGCCAUGUG UAUG UGGG
CCUGCAGGGGGAGACAGCUAGAGUACAGAACCCCGCUUCGGCGGUGAUGGAG
AGGCGCAAGGUUAACCGCCUCAGGUUCCGGUGACGGGGCCUCGCUUCGGCGA
UGAUGGAGAGGCGCAAGGUUAACCGCCUCAGGUUCUGACACGAGCACAGUGUA
CCCUGCAGGCCCACAUACUCUGAUGAUCCUUCGGGAUCAUUCAUGGCAAUCUA
GAGCGGACUUCGGUCCGCUUUU-3'.
Advantageously, the invention relates to the molecular complex as defined
above,
wherein said fluorophore is the fluorophore having one of the following the
formula 6 or
7, and
KcL/
/
o
_/
o3s
H 0
IL
0 H
N \_
\ NH e
o.........õ-.....r.,L0 SO3
H
HN,Ir......,,,N¨S.,
# 0
0
0
Gemini 561-1 (6) and
CA 03142242 2021-11-29
WO 2020/254654 PCT/EP2020/067239
19
.01NHp
HN ..
1-rs S
HN
0
0-1¨
il
(0
I \ / I
N
Si
,NN¨N
/ *--..
/
-00C OyO
0 HN
I \ / I
Si HN
H I
yNS..yLNH
0 C00-
0
H
HN1.N
0 o
Gemini 640-1 (7),
and said nucleic acid comprises, or consists essentially of, or consists of
the
sequence SEQ ID NO: 8 (o-Coral).
The molecular complexes according to the invention are advantageously the
following complexes:
- compound of formula 4 and nucleic acid molecule of SEQ ID NO: 8,
- compound of formula 6 and nucleic acid molecule of SEQ ID NO: 8, and
- compound of formula 7 and nucleic acid molecule of SEQ ID NO: 8,
In one advantageous embodiment, the invention relates to the following
complexes:
- one of the compounds of formula 4, 5, 6, 7 or 8 and nucleic acid molecule
of
SEQ ID NO: 9,
- one of the compounds of formula 4, 5, 6, 7 or 8 and nucleic acid molecule
of
SEQ ID NO: 10,
- one of the compounds of formula 4, 5, 6, 7 or 8 and nucleic acid molecule of
SEQ ID NO: 11,
- one of the compounds of formula 4, 5, 6, 7 or 8 and nucleic acid molecule
of
SEQ ID NO: 12,
CA 03142242 2021-11-29
WO 2020/254654 PCT/EP2020/067239
- one of the compounds of formula 4, 5, 6, 7 or 8 and nucleic acid molecule
of
SEQ ID NO: 13,
- one of the compounds of formula 4, 5, 6, 7 or 8 and nucleic acid molecule
of
SEQ ID NO: 14,
5 - one of the compounds of formula 4, 5, 6, 7 or 8 and nucleic acid
molecule of
SEQ ID NO: 15,
- one of the compounds of formula 4, 5, 6, 7 or 8 and nucleic acid molecule
of
SEQ ID NO: 16,
- one of the compounds of formula 4, 5, 6, 7 or 8 and nucleic acid molecule
of
10 SEQ ID NO: 15,
- one of the compounds of formula 4, 5, 6, 7 or 8 and nucleic acid molecule
of
SEQ ID NO: 18,
- one of the compounds of formula 4, 5, 6, 7 or 8 and nucleic acid molecule
of
SEQ ID NO: 19,
15 - one of the compounds of formula 4, 5, 6, 7 or 8 and nucleic acid
molecule of
SEQ ID NO: 20,
- one of the compounds of formula 4, 5, 6, 7 or 8 and nucleic acid molecule
of
SEQ ID NO: 21,
- one of the compounds of formula 4, 5, 6, 7 or 8 and nucleic acid molecule
of
20 SEQ ID NO: 22,
- one of the compounds of formula 4, 5, 6, 7 or 8 and nucleic acid molecule
of
SEQ ID NO: 23,
- one of the compounds of formula 4, 5, 6, 7 or 8 and nucleic acid molecule
of
SEQ ID NO: 24,
- one of the compounds of formula 4, 5, 6, 7 or 8 and nucleic acid molecule of
SEQ ID NO: 25,
- one of the compounds of formula 4, 5, 6, 7 or 8 and nucleic acid molecule
of
SEQ ID NO: 26,
- one of the compounds of formula 4, 5, 6, 7 or 8 and nucleic acid molecule
of
SEQ ID NO: 27,
- one of the compounds of formula 4, 5, 6, 7 or 8 and nucleic acid molecule
of
SEQ ID NO: 28, and
- one of the compounds of formula 4, 5, 6, 7 or 8 and nucleic acid molecule
of
SEQ ID NO: 29.
The invention also relates to a nucleic acid molecule comprising a first and a
second region, said first and second regions being such that:
- the first region comprises the nucleotide sequence of SEQ ID NO: 1; and
CA 03142242 2021-11-29
WO 2020/254654 PCT/EP2020/067239
21
- the second region comprises the nucleotide sequence of SEQ ID NO: 2,
provided that said nucleic acid molecule is not the nucleic acid molecule as
set
forth in SEQ ID NO: 3.
Advantageously, the invention relates to the nucleic acid as defined above,
wherein the nucleic acid molecule comprises, or consists essentially of, or
consists of
one of the nucleotide sequences as set forth in SEQ ID NO: 8, SEQ ID NO: 9,
SEQ ID
NO: 10, SEQ ID NO: 11, SEQ ID NO: 12, SEQ ID NO: 13, SEQ ID NO: 14, SEQ ID NO:
15, SEQ ID NO: 16, SEQ ID NO: 17, SEQ ID NO: 18, SEQ ID NO: 19, SEQ ID NO: 20,
SEQ ID NO: 21, SEQ ID NO: 22, SEQ ID NO: 23, SEQ ID NO: 24, SEQ ID NO: 25, SEQ
ID NO: 26, SEQ ID NO: 27, SEQ ID NO: 28, and SEQ ID NO: 29.
The invention further relates to a host cell, or a non-human mammal comprising
said cell, containing the nucleic acid molecule as defined above or a
molecular complex
as defined above, or containing a DNA molecule coding for a nucleic acid
molecule as
defined above, or the genetically engineered DNA molecule allowing the
expression of
said nucleic acid molecule, or a combination thereof.
Once the constructed DNA molecule has been cloned into an expression system,
it is
ready to be incorporated into a host cell. Such incorporation can be carried
out by the
various forms of transformation, depending upon the vector/host cell system
such as
transformation, transduction, conjugation, mobilization, or electroporation.
The DNA
sequences are cloned into the vector using standard cloning procedures in the
art, as
described by Maniatis et al, Cold Springs Harbor, New York (1982)), Suitable
host cells
include, but are not limited to, bacteria, yeast, mammalian cells, insect
cells, plant cells,
and the like. The host cell is preferably present either in a cell culture (ex
vivo) or in a
whole living organism (in vivo).
Mammalian cells suitable for carrying out the present invention include,
without limitation,
COS (e.g., ATCC No. CRL 1650 or 1651), BHK (e.g., ATCC No. CRL 6281), CHO
(ATCC
No. CCL 61), HeLa (e.g., ATCC No. CCL 2), 293 (ATCC No. 1573), CHOP, NS-1
cells,
embryonic stem cells, induced pluripotent stem cells, and primary cells
recovered directly
from a mammalian organism. With regard to primary cells recovered from a
mammalian
organism, these cells can optionally be reintroduced into the mammal from
which they
were harvested or into other animals.
The invention relates also to the use of : the nucleic acid molecule as
defined
above, or the molecular complex as defined above, or the DNA molecule coding
for a
nucleic acid molecule as defined above, or the genetically engineered DNA
molecule as
defined above, or the host cell as defined above, or a mammal as defined
above, or a
combination thereof
CA 03142242 2021-11-29
WO 2020/254654 PCT/EP2020/067239
22
for imaging, preferably in vitro or ex vivo, small molecules, RNA and
proteins,
preferably in cells
The target molecule of interest can be any biomaterial or small molecule
including,
without limitation, proteins, nucleic acids (RNA or DNA), lipids,
oligosaccharides,
carbohydrates, small molecules, hormones, cytokines, chemokines, cell
signaling
molecules, metabolites, organic molecules, and metal ions. The target molecule
of
interest can be one that is associated with a disease state or pathogen
infection.
The invention also relates to a method for imaging in vitro or ex vivo small
molecules, RNA and proteins in cells, comprising the administration to a
living in vivo
and ex vivo cell cultures a nucleic acid according the above definition
operably linked to
a biomolecule, along with a fluorophore molecule according to the above
definition.
For instance, for imaging RNA in cells, it is possible to provide to a cell,
or to a cell-
free expression system, a molecule allowing the expression of a fusion RNA
constituted
by:
- the RNA to be studied in the cell, operably linked, preferably in its 3'-
end, but
possibly to its 5'end to
- an aptamer according to the above definition, or to one strand of the
aptamer
constituted by two separated single stranded molecules.
The above-disclosed fusion RNA is then expressed in the cell, or in a cell-
free
expression system, and in presence of the fluorophore, the part of the fusion
molecule
will interact with the fluorophore. This will result in a fluorescence
emission upon
exposure of an appropriate wavelength, and it could be possible to track, and
thus to
image, the RNA to be studied, because it is covalently linked to the aptamer.
It would be therefore possible to monitor the trafficking, the localization,
the
accumulation... of the RNA to be studied, in particular in living cells
without alteration of
their integrity.
It is also disclosed a method for imaging small molecules, RNA and proteins
mammals, comprising the administration to a mammal a nucleic acid according
the
above definition operably linked to a biomolecule, along with a fluorophore
molecule
according to the above definition.
From conventional techniques of molecular biology, the skilled person would be
able to obtain all the necessary fusion RNA molecules.
The invention will be better understood from the following figures and in
light of the
following examples.
Brief description of the drawings
Figure 1: 1H NMR spectrum of compound 1.
Figure 2: Characterizations of Gemini-561-Alkyne.
CA 03142242 2021-11-29
WO 2020/254654 PCT/EP2020/067239
23
Figure 2A represents the 1H NMR spectrum of Gemini-561-Alkyne.
Figure 2B represents the 130 NMR spectrum of Gemini-561-Alkyne.
Figure 20 represents the HRMS spectrum of Gemini-561-Alkyne.
Figure 3: Characterizations of Gemini-56I.
Figure 3A represents the 1H NMR spectrum of Gemini-561 (Me0D).
Figure 3B represents the HPLC traces of Gemini-561. The signal was monitored
according to ionisation detection ESI+ (top trace) and UV detection (bottom
trace).
Figure 30 represents HRMS spectrum of Gemini-S61 displaying [M+3H] and
[M+2H].
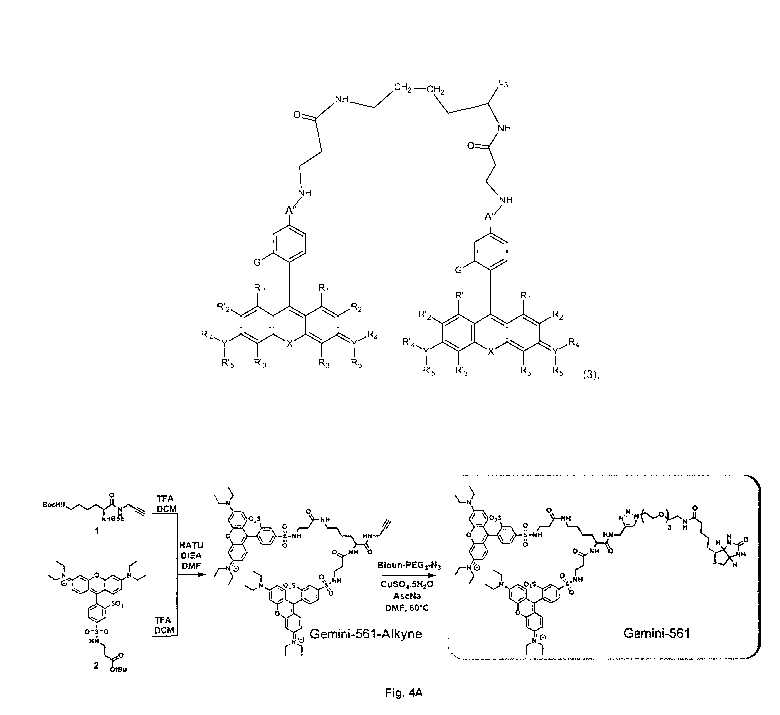
Figure 4: Design and synthesis of Gemini-561.
Figure 4A represents the synthesis of Gemini-561
Figure 4B represents the absorption and excitation spectra of Gemini-561 (200
nM) in water and methanol.
Figure 40 represents the fluorescence emission spectra of Gemini-561(200 nM)
in
water and methanol.
Figure 5: Normalized absorption and emission spectra of Gemini-561 in
different
aqueous media mimicking cellular environments.
Figure 6: Isolation of Gemini-561 lighting-up aptamers by in vitro evolution.
Figure 6A represents Gemini-561 activation capacity of the parental SRB-2 and
the evolved 4010 variant. 500 nM of RNAs were incubated with 50 nM of Gemini-
561
and the fluorescence was measured at A ex/em = 560/600 nm.
Figure 6B represents the monitoring of the evolution process. For each round,
the
enriched library was transcribed in vitro in the presence of 100 nM of Gemini-
561 and
the fluorescence monitored. The fluorescence apparition rate was computed for
each
.. library and normalized to that of the parental SRB-2 aptamer. The inset
schematizes the
different steps (A, B and C) of an evolution round. The values are the mean of
3
independent experiments, each measurement being shown as an open circle. The
error
bars correspond to 1 standard deviation.
Figure 60 is a schematic representation of genes coding for the 16 dimerized
variants found among the 19 best aptamers at the end of the evolution process.
For each
variant, the width and the color of the box respectively inform on linker
length (numerical
value given on the right) and the nature of the sequence (light gray: T7
promoter, medium
gery: 5'constant, dark grey: 3' constant). Red boxes correspond to SRB-2-
derived core.
The clone ID refers to the round of selection from which the clone was
extracted (first
number) and the clone number assigned during the final screening.
Figure 7: Gemini-561 activation by SRB-2 aptamer and its derivatives.
CA 03142242 2021-11-29
WO 2020/254654 PCT/EP2020/067239
24
Figure 7A represents a secondary structure model of SRB-2 aptamer as
originally
proposed. Paired regions (PI, P2 and P3) are distinguished from Loop (L2 and
L3) and
Junction (J2/3) regions. Constant sequence regions appended for RT-PCR
amplification
purposes are shown in gray.
Figure 7A represents the fluorogenic capacity of SRB-2 and its evolved forms
4C10
and o-Coral. 500 nM of RNAS were incubated With 50 nM of Gemini-561 and the
fluorescence was measured at X ex/em = 560/600 nm. The values are the mean of
3
independent experiments, each measurement being shown as an open circle. The
error
bars correspond to 1 standard deviation.
Figure 8: Overall in vitro evolution strategy. Each round of evolution cycle
consisted of 10 main steps. SRB-2 was used as a template for error-prone PCR
(step I)
to create a DNA mutant library that was in vitro transcribed (step 2).
Resulting RNAS
were then selected for their binding capacity via a SELEX (Systematic
Evolution of
Ligands by Exponential enrichment) approach (steps 3, 4 and 5) prior to being
screened
for their light-up capacity using pIVC (steps 7, 8, 9 and 10). For steps
performed in
microfluidic chips, Oil (0) and aqueous phase (A) inlets are labeled together
With inlets
and outlets where Emulsion (E) were respectively reinjected and collected.
Finally, the
enriched pool was reamplified by an errOr-prone PCR (Step I) before re-
entering the
whole process again. 4C10 was obtained after 4 rounds of this evolution cycle.
Figure 9: Sequence and fluorogenicity of the mutants isolated upon the in
vitro evolution process. Variant sequences were ordered according to their
Gemini-
561 activation capacity normalized to that of SRB-2 (Norm. Fluo.). Mutations
are color-
coded and deletions represented by a X. Structural elements are delineated by
shadowed areas and paired sequences indicated under the alignment. The clone
ID
refers to the round of selection from which the clone was extracted (first
number) and
the clone number (second number) assigned during the final screening. The
presence
of a linker and its size are indicated between both SRB-2 derived monomers.
The gene
coding for each mutant was transcribed in vitro in the presence of 100 nM of
Gemini-561
and the fluorescence monitored. The fluorescence apparition rate was computed
for
each library and normalized to that of the parental SRB-2 aptamer. It is to be
noted that
5' and 3' constant regions are not represented. As a consequence, the
numbering is
downshifted by 18-nucleotides in comparison with the full-length molecule
encompassing the 18-nucleotide long 5' extension.
Figure 10: Characterization and engineering of the evolved molecule
Figure 10A represents the impact of linker size and 733 sequence on the
capacity
of 4C10 aptamer to activate Gemini-561 fluorescence. 500 nM of RNAs 734 were
CA 03142242 2021-11-29
WO 2020/254654 PCT/EP2020/067239
incubated with 50 nM of Gemini-561 and the fluorescence was measured at A
ex/em =
560/600. The underlined sequence corresponds to o-Coral linker.
Figure 10B represents Contribution of the dimerization and 736 the mutations
to o-
Coral functionality. SRB-2 aptamer was used as scaffold either in its
monomeric 737 (m)
5 or
dimeric (d) form containing o-Coral linker. Indicated mutations were then
implemented
and the 738 different constructs tested as above.
Figure 10C represents the identification of interacting regions. A
destabilized
mutant (67GGUUC71/67CCAAG71) of o-Coral and two potential compensatory mutants
(1:
67GGUUC71/67CCAAG71_20GAACC24/20CUUGG24 and 2:
10
67GGUUC71/67CCAAG71_79GGGCC85/79CUUGG85) were prepared and tested as above.
The values (a-c) are the mean of 3 independent experiments, each measurement
being
shown as an open circle. The error bars correspond to 1 standard deviation.
Figure 10D represents the fluorescence emission spectra of Gemini-561 (200 nM)
in absence and in the presence of RNA aptamers (600 nM). Excitation wavelength
was
15 530 nm.
Figure 10E represents the Spectral and biochemical properties of Gemini-561
alone or in complex with SRB-2 or o-Coral aptamers. Measures were performed in
selection buffer (40 mM phosphate buffer pH7.5, 100 mM KCI, 1mM MgCl2 and
0.05%
Tween-20).
20 Figure
1OF represents Model of secondary structure for o-Coral aptamer. This
model was established based on enzymatic probing experiments (Figures 12A and
B)
and mutagenesis experiments shown on c. SRB-2 derived sequences (Part A and B)
are
shown in black or red whereas the constant regions and the linker are shown in
grey.
Acquired mutations found to contribute to o-Coral function are circled in
black.
25 Figure
11: Refinement of structural model using P1 compensatory mutants.
Figure 11A represents three mutants that were generated: a destabilized mutant
(Destabilized stem: 67GGUUC71/67CCAAG71) of o-Coral and two potentially
compensatory mutants; the first one based on the independent folding model
(67GGUUC71/67CCAAG71_20GAACC24/20CUUGG24) and the second one based on the
intertwined folding model (67GGUUC71/67CCAAG71_79GGGCC85/79CUUGG85). SRB-2
derived sequences (Part A and B) are shown in black or red whereas the linker
sequence
is shown in grey. Implemented mutations described before are shown.
Figure 11B represents Impact of implemented mutations on o-Coral aptamer
fluorogenicity. 500 nM of RNAS were incubated With 50 nM of Gemini-561 and the
fluorescence was measured at A ex/em = 560/600 nm. The values are the mean of
3
independent experiments, each measurement being shown as an open circle. The
error
bars correspond to 1 standard deviation.
CA 03142242 2021-11-29
WO 2020/254654 PCT/EP2020/067239
26
Figure 12: Refinement of structural model using P1 compensatory mutants.
Figure 12A is representation of o-Coral and the 69UU70/690070 o-Coral double
mutant according to the independent folding model (upper part) and the
intertwined
folding model (lower part). SRB-2 derived sequences (Part A and B) are shown
in black
or red whereas the linker sequence is shown in grey. Implemented mutations
described
below is shown in orange.
Figure 12A Impact of the implemented mutation on o-Coral aptamer
fluorogenicity.
500 nM of RNAs were incubated with 50 nM of Gemini-561 and the fluorescence
was
measured at A ex/em = 560/600 nm. The values are the mean of 3 independent
experiments, each measurement being shown as an open circle. The error bars
correspond to 1 standard deviation.
Figure 13: Probing of o-Coral secondary structure.
(a) Probing experiment. Radioactively labelled o-Coral RNA was subjected to
digestion by V1, Ti or T2 nucleases prior to analyzing the digestion products
on 10 %
polyacrylamide denaturing gels. The increased concentration of the enzymes is
schematized by the colored triangles (V1: 0.001 U/pL - 0.002 U/pL - 0.004
U/pL, TI: 0.25
U/pL - 0.5 U/pL - 1 U/ptL, T2: 0.0125 U/pL - 0.025 U/pL - 0.05 U/pL). Ctrl
lane
corresponds to an enzyme-free experiment, AH stands for Alkaline Hydrolysis in
which
o-Coral was statistically hydrolyzed, dT1 stands for denaturing Ti cleavages.
The
numbers on the right refer to o-Coral nucleotides.
(b) Secondary structure model of o-Coral. TI, T2 and V1 cleavage sites are
indicated respectively by the blue, green and red arrows. SRB-2 derived
monomers are
shown in black or red (Part A and B), whereas constant regions and linker are
shown in
gray. Acquired mutations found to contribute to o-Coral function are circled
in black.
Figure 14: Secondary structure models of o-Coral aptamer.
Figure 14A represents an independent folding model. In this model, each SRB-2-
derived monomers adopts an independent folding and closely resemble the
original
SRB-2 molecule associated by single stranded linker region.
Figure 14A represents an Intertwined folding model. In this model, both each
SRB-
2 derived monomers fold on each other and form an intertwined structure. On
both
models, SRB-2 derived monomers are shown in black or gray (Part A and B),
whereas
constant regions and linker are shown in light gray. Acquired mutations found
to
contribute to o-Coral function are shown are circled in black.
Figure 15: Salt dependency of Gemini561/o-Coral module.
Figure 15A is a graph that represents the monovalent ions dependency of o-
Coral.
0-Coral RNA and Gemini-561 were mixed in a solution containing 40 mM Phosphate
CA 03142242 2021-11-29
WO 2020/254654 PCT/EP2020/067239
27
buffer pH7.5, 100 mM KCI or NaCI or CsCI or LiCI or in the absence of
monovalent
cations, 2 mM MgCl2 and 0.05% Tween-20 and the fluorogenic capacity was
measured.
Figure 15B is a graph that represents magnesium dependency of o-Coral. 0-Coral
RNA and Gemini-561 were mixed in a solution containing 40 mM Phosphate buffer
pH7.5, 100 mM KCI, the indicated concentration of MgCl2 and 0.05% Tween-20 and
the
fluorogenic capacity was measured. For both condition (a and b), 500 nM of
RNAs were
incubated with 50 nM of Gemini-56I and the fluorescence was measured at A
ex/em =
560/600 nm. The values are the mean of 3 independent experiments, each
measurement
being shown as an open circle. The error bars correspond to 1 standard
deviation.
Figure 16: Left: Normalized absorption and Right: emission spectra of Gemini-
561 (200 nM) in absence and in the presence of RNA aptamers (600 nM).
Excitation
wavelength was 530 nm.
Figure 17: Absorption and emission spectra of Gemini-561 (200 nM) in the
presence of increasing concentrations (equivalents, eq.) of o-Coral.
Excitation
wavelength was 530 nm.
Figure 18: (a) Absorption and (b) emission spectra of Gemini-561 (200 nM) in
the
presence of increasing concentration (equivalents, eq.) of SRB-2 aptamer.
Excitation
wavelength was 530 nm. Normalized spectra of (c) absorption and (d) emission
spectra
respectively.
Figure 19 is a graph showing the effect of biomolecules and biological medium
on
the fluorescence intensity of Gemini-561/o-Coral (1/1 molar ratio) complex at
0.2 pM
concentration. After Gemini-561/o-Coral complex was formed, the mixture was
incubated with the corresponding biomolecule (BSA 10 mg/mL, non-targeted DNA
50
pM or SRB-2 aptamer 0.2 pM) or biological medium (FBS 10%) for 15 min and the
fluorescence was recorded at 596 nm. Excitation wavelength was 530 nm. The
values
are the mean of 3 independent experiments, each measurement being shown as a
colored dot. The error bars correspond to 1 standard deviation.
Figure 20: Cytotoxicity assay of Gemini-561. HeLa cells were incubated with
various concentration of Gemini-561 and their viability was assessed after 24
hours using
MTT test. An incubation with 0.1% Triton X100 was used as positive control.
The values
are the mean of 3 independent experiments, each measurement being shown as a
colored dot. The error bars correspond to 1 standard deviation.
Figure 21: Microinjection in HeLa cells.
Figure 21A: Microinjection of Gemini-561 (1 pM) alone (in cytosol), complex of
Gemini-561/o-Coral (1 pM) or Gemini-561/SRB-2 (1 pM) (in cytosol). Arrows show
that
Gemini-561/o-Coral complex was microinjected into either nucleus or cytosol.
Scale bar
is 20pm.
CA 03142242 2021-11-29
WO 2020/254654 PCT/EP2020/067239
28
Figure 21B: Microinjection of o-Coral (52 pM) or SRB-2 (52 pM) with Dextran-
Alexa-647 conjugate (10 pM) in cells pre-treated with Gemini-561 (200 nM) for
5 min.
Microinjection parameters: Pi=90 [hPa]; Ti=0.3 [s]; Pc=10 [hPa]. The nucleus
was
stained With Hoechst (5pg/mL). The images were acquired using a 10s exposure
time.
Gemini-561 (ex: 550 nm, em: 595 40 nm), Hoechst (ex: 395 nm, em: 510 42 nm)
and
Alexa-647 (ex: 638 nm, em: 810 90 nm). Scale bar is 30pm.
Figures 22: Live-cell imaging of o-Coral expressed from pol. ll and pol. Ill
promoter. Live cell imaging of HeLa (Figure 22A) and HEK293T (Figure 22B)
cells
expressing o-Coral from the U6¨promoter, the gfp mRNA labelled With single
copy of
o-Coral in the 3'untranslated region (3' UTR) or eGFP only. Cells were
incubated with
Gemini-56I (200 nM) for 5 min before imaging. Hoechst was used to stain the
nucleus (5
pg/mL). The images were acquired using a 500 ms exposure time. Gemini-561 in
red
(ex: 550 nm, em: 595140 nm), Hoechst in blue (ex: 395 nm, em: 510142 nm) and
eGFP
in green (ex: 470 nm, em: 53 1140 nm). Scale bar is 30 pm.
Figures 23: Live-cell imaging of o-Coral expressed from pol. ll and pol. Ill
promoter.
Figure 23A: Live cell imaging of HeLa cells expressing o-Coral from the U6-
promoter in the absence and presence of Actinomycin D, cells expressing eGFP
only
and untransfected (untr.) cells treated with Actinomycin D.
Figure 23B: Live cell imaging of HeLa cells expressing the gfp mRNA labelled
with
single copy of o-Coral. Cells expressing the gfp mRNA with or without scaffold
inserted
and untransfected cells were used as negative controls. Cells were incubated
With
Gemini-561 (200 nM) for 5 min before imaging. Hoechst was used to stain the
nucleus
(5 pg/mL). The images were acquired using a 500 ms exposure time. Gemini-561
in red
(ex: 550 nm, em: 595140 nm), Hoechst in blue (ex: 395 nm, em: 5 10 42 11m) and
eGFP
in green (ex: 470 nm, em: 531 40 nm). Scale bar is 30pm.
Figure 24: Live-cell imaging of transfected HeLa cells expressing eGFP and
o-Coral, eGFP only or eGFP and F30 scaffold only. Top panel shows Gemini-56I
channel only. Bottom channel shows merged all channels. Cells were incubated
with
Gemini-56I (200 nM) for 5 min. White arrows on the images depict the
correlation
between expression of eGFP and o-Coral as well as the different transcription
states of
cells. The images were acquired using a 500 ms exposure time. Gemini-561 in
red (ex:
550 nm, em: 595 40 nm), Hoechst in blue (ex: 395 nm, em: 510 42 nm) and eGFP
in
green (ex: 470 nm, em: 531 40 nm). Scale bar is 30pm.
Figure 25 Comparative analysis of photostability by fluorescence
microscopy and spectroscopy.
CA 03142242 2021-11-29
WO 2020/254654 PCT/EP2020/067239
29
Figure 25A: Photostability measurement in live Hela cells. In vitro
transcribed and
purified aptamers were preincubated With respective fluorogenic dyes for 10
min in
selection buffer to form complex. Complexes were microinjected in live HeLa
cells using
pM dye and 20 pM aptamer concentration. Microinjection parameters: Pi=90
[hPa];
5 Ti=0.3
[s]; Pc=10 [hPa]. Consecutive images were acquired, each using a 500 ms
exposure time. The excitation power was adjusted for the fluoromodules to
absorb similar
amount of photons. Broccoli (ex: 470 nm, em: 475 50 nm); Corn (ex: 470 nm, em:
531 40 nm); Mango (ex: 470 nm, em: 531 40 nm); Coral (ex: 550 nm, em: 595 40
nm).
Scale bar is 30ptm.
Figure 25B: Fluorescence intensity decay curves over the time. Data represent
average values 1 S.D. extracted from images from 3 independent experiments
(n=3).
Figure 25 C: Signal to background noise ratio of the first acquired image from
a
depicting the brightness of the system and the quality of obtain images.
Signal to
background noise ratios were calculated from fluorescence intensity values
extracted
from images using same region of interest from 3 independent injections. The
value of
each measurement is shown as a colored dot. The error bars correspond to 1
standard
deviation.
Figure 25D: Photostability of G561/o-Coral (0.2 pM/1 pM) compared to
Broccoli+DFHBI-1T (0.2 pM/1 pM), Corn+DFHO (0.2 pM/1 pM), Mango+TO1-Biotin
(0.2
pM/1 pM). Each complex was excited at the same molar extinction coefficient
value;
30,000 M-1 cm-1 Broccoli, Corn and Mango were excited using 488 nm laser (7.75
mW
cm-2, 11 mW cm-2, 10 mW cm-2 respectively) and o-Coral was excited using 532
nm laser
(7 mW cm-2). Fluorescence intensity was monitored at 507 nm for Broccoli, 545
nm for
Com, 535 nm for Mango and 596 nm for o-Coral.
Figure 26: Photostability of aptamer-dye couples in live HeLa cells.
Broccoli/DFHBI-1T, Corn/DFHO, Mango/T01-biotin and o-Coral/Gemini-561
photostability was assessed by fluorescence microscopy. Cells were
preincubated with
corresponding dye (10 pM DFHBI-1T, 10 pM DFHO, 0.2 pM TO1-biotin for 30 min
and
0.2 pM Gemini-561 for 5 min). Aptamers were microinjected in live HeLa cells
at 20 pM
concentration. Microinjection parameters: Pi=90 [hPa]; Ti=0.3 [S]; Pc=10
[hPa].
Consecutive images were acquired, each using a 500-ms exposure time. Broccoli
(ex:
470 nm, em: 475 50 nm); Corn (ex: 470 nm, em: 531 40 nm); Mango (ex: 470 nm,
em:
531 40 nm); Coral (ex: 550 nm, em: 595 40 nm). The excitation power was
adjusted to
reach similar emission intensity. Fluorescence intensity values were extracted
using
same region of interest from 3 independent injections. The values are mean
S.D (n=3).
Figure 27: Photostability of Gemini-56110-Coral over extensive constant
illumination. A mixture of Gemini-561/o-Coral (1 pM/2 pM) was prepared and
CA 03142242 2021-11-29
WO 2020/254654 PCT/EP2020/067239
individualized into water-in-oil droplets to prevent unwanted exchange of
complexes
between illuminated and non-illuminated areas as described before. The
emulsion was
then exposed to a constant illumination wavelength (575 nm) at the maximum
intensity
of the light source (Spectra X, Lumencor), and the emitted fluorescence (625
50 nm)
5 was collected by an Orca-Flash IV camera for 500 ms every 100 ms with x40
objective
(numerical aperture (NA) 0.45). The values are the mean of 3 independent
experiments
and the error bars correspond to 1 standard deviation.
Figure 28: Normalized absorption spectra of Gemini-552 (200 nM) in absence
(black line) and in the presence of o-Coral (dashed line) or SRB-2 (dotted
line) RNA
10 aptamers (600 nM) in an aqueous buffer (pH 7.4).
Figure 29: Fluorescence emission spectra of Gemini-552 (200 nM) in absence
(black line) and in the presence of o-Coral (dashed line) or SRB-2 (dotted
line) RNA
aptamers (600 nM) in an aqueous buffer (pH 7.4). Excitation wavelength was 520
nm.
Figure 30: In vitro transcription monitoring of SIR-A in the presence of
Gemini 640-
15 2. An in vitro transcription mixture containing Gemini 640-2 was
supplemented (gray
circles) or not (gray triangle) with DNA coding for SIR-A aptamer and the red
fluorescence (ex. = 640 nm/ em. = 680 nm) was monitored over the time at 37 C.
Figure 31: An in vitro transcription mixture containing 100 nM Gemini 640-2
was
supplemented with 0-Coral-coding DNA (dashed bars), SIRA-coding DNA (dotted
bars)
20 or without DNA (open bar), and the red fluorescence (ex. = 640 nm/ em. =
680 nm) was
monitored over the time at 37 C. The measured fluorescence was then normalized
to
that of the reaction without DNA (H20).
Figure 32: An in vitro transcription mixture containing 100 nM Gemini 561-2
was
supplemented with 0-Coral-coding DNA (dashed bars), SIRA-coding DNA (dotted
bars)
25 or without DNA (open bar), and the orange fluorescence (ex. = 560 nm/
em. = 600 nm)
was monitored over the time at 37 C. The measured fluorescence was then
normalized
to that of the reaction without DNA (H20).
EXAMPLES
Example 1
30 In this example, the inventors propose a new concept for preparation of
bright and
photostable fluorogen for RNA imaging in cells by exploiting dimerization-
induced self-
quenching of SRB dyes, which yielded fluorogen Gemini-561. Following a new
selection
scheme combining SELEX and pIVC, together with molecular engineering, they
developed o-Coral, a light-up aptamer of unprecedented compact dimeric
structure, able
to form a high affinity, bright and photostable complex with Gemini-561. This
set of
unique features allows live-cell imaging mRNAs labelled with a single copy of
the o-Coral
aptamer.
CA 03142242 2021-11-29
WO 2020/254654 PCT/EP2020/067239
31
Methods
Synthesis of Gemini-561
All starting materials for synthesis were purchased from Alfa Aesar, Sigma
Aldrich
or TO! Europe and used as received unless stated otherwise. NMR spectra were
recorded on a Bruker Avance III 400 MHz spectrometer. Mass spectra were
obtained
using an Agilent Q-TOF 6520 mass spectrometer.
Compound 1. To a mixture of di-boc-L-lysine dicyclohexylamine salt (1.53 g,
2.89
mmol) and propargylamine (277 pL, 4.33 mmol, 1.5 eq) in dry DMF (20 mL) was
added
HATU (1.32 g, 3.46 mmol, 1.2 eq) followed by DIEA (1.5 mL, 8.67 mmol, 3 eq).
After 1
h, the solvents were evaporated and the product was extracted with Et0Ac and
washed
with water (2 times) and brine. The organic phase was fried over anhydrous
MgSat,
filtered and evaporated. The crude was purified by column chromatography on
silica gel
(DCM/MeOH: 98/2) to obtain 822 mg of 1 (74% yield) as a white solid. The NMR
(Figure
1) was in accordance with the literature.
Compound 2. 2 was obtained following a protocol described in Hatai, J, et al.
J
Am Chem Soc 139, 2136-2139 (2017)).
Gemini-561-alkyne. To a solution of 1 (650 mg, 1.69 mmol) in DCM (20 mL) were
added 5 mL of TFA. The reaction was allowed to stir at room temperature and
after 1 h
the solvants were evaporated, the crude was dissolved in a minimum of Me0H and
the
product was precipitated in ether. The deprotected product in form of oil was
used in the
next step without further purification.
In a separate flask, to a solution of 2 (50 mg, 0.073 mmol) in DCM (2 mL) were
added 2 mL of TFA. After 2h, the solvents were evaporated and the deprotected
carboxylic acid was involved in the next step without further purification.
To a solution of deprotected 2 (0.073 mmol, 2 eq) and deprotected 1 (15 mg,
0.037
mmol, 1 eq) in DMF (3 mL) was added HATU (17 mg, 0.044 mmol, 1.2 eq) followed
by
DIEA (20 pL, 0,111 mmol, 3 eq). After 1 h the solvents were evaporated and the
crude
was first purified by column chromatography on silica gel (DCM/MeOH: 8/2) and
was
further purified by reverse phase column chromatography (0-18 column,
ACN/VVater:
20/80 to 100/0 over 30 minutes) to obtain 25 mg g of Gemini-561-alkyne (48%
yield) as
dark violet syrup. Rf = 0.27 (DCM/MeOH: 9/1). 1H-NMR (400 MHz, CHC13/Me0D): 5
8.66 (s, 2H, H Ar), 8.04 (dt, J = 8.0, 1.6 Hz, 2H, H Ar), 7.28 (dd, J = 8.0,
0.7 Hz, 2H, H
Ar), 7.19 (dd, J = 9.5, 2.7 Hz, 4H, H Ar), 6.87-6.84 (m, 4H, H Ar), 6.71 (s,
4H, H Ar), 4.30-
4.26 (m, 1H, Ha lysine), 3.95-3.85 (m, 2H, CH2), 3.55-3.53 (m, 16H, CH2; Et),
3.33-3.25
(m, 8H, 4 CH2), 2.46-2.43 (m, 2H), 2.35-2.33 (m, 2H), 2.18 (t, J = 2.4 Hz, 1H,
CECH),
1.45-1.41 (m, 4H, 2 CH2), 1.28 (t, J = 7.1 Hz, 24H, CH3 Et). 130-NMR (126 MHz,
CHC13/Me0D): Note that some peaks are doubled due to rotamers formed with
amide
CA 03142242 2021-11-29
WO 2020/254654 PCT/EP2020/067239
32
bonds. 130-NMR (126 MHz, 0H013/Me0D): 6 157.8 (C Ar), 157.2 (C Ar), 155.5 (C
Ar),
146.4(0 Ar), 142.1 (C Ar), 141.9(0 Ar), 133.8(0 Ar), 133.7(0 Ar), 132.9(0 Ar),
130.4
(C Ar), 128.0 (C Ar), 127.9 (C Ar), 126.8 (C Ar), 126.7 (C Ar), 114.1 (C Ar),
113.6 (C Ar),
95.7 (C Ar), 79.4 (C alkyne), 71.0 (C alkyne), 53.6 (Ca), 45.8 (CH2 Et), 39.6,
39.4, 38.8,
-- 35.8, 35.5, 31.1, 28.7, 28.3, 22.7, 12.4 (CH3 Et). HRMS (ESI+), calcd for
069H85N9015S4
[M+2H] 703.7518, found 703.7506 (Figures 2A-C).
Gemini-561. To a solution of Gemini-561-alkyne (25 mg, 17.7 pmol) and biotin-
PEG3-N3 (12 mg, 26.6 pmol, 1.5 eq) in DMF (2 mL) was added a mixture of
CuSO4=5H20
(3 mg) and sodium ascorbate (3 mg) in water (0.2 mL). The solution was allowed
to stir
-- at 60 C overnight. The solvents were evaporated and the product was
purified by
preparative TLC using DCM/Me0H (85/15) as eluent to obtain 16 mg of Gemini-561
(49% Yield) as dark violet syrup. Rf= 0.23 (DCM/MeOH: 85/15). 1H- NMR (400
MHz,
Me0D): 6 8.66-8.64 (m, 2H, H Ar), 8.14-8.10 (rn, 2H, H Ar), 7.94-7.91 (m, 1H,
H triazol),
753-750 (m, 2H, H Ar), 7.17-7.13 (m, 4H, H Ar), 7.03-6.99 (m, 4H, H Ar), 6.96-
6.92 (m,
-- 4H, H Ar). The rest of the spectrum is difficult to assign probably due to
rotamers and
the weak amount of product. HPLC traces are provided as a proof of the purity
of Gemini-
561 HPLC: Zorbax SB-C18, particle size 1.8 pm (Agilent), ACN/VVater (0.05%
formic acid)
2/98 to 100/0 in 8 min, 0.5 mL/min. HRMS (ESI+), calcd for C87H1181\115020S5
[M+3H]
617.5755, found 617.5737 (Figures 3A-C).
Optical Spectroscopy
The water used for optical spectroscopy was Milli-Q water (Millipore ). All
the
solvents were spectroscopy grade. Absorption and emission spectra were
recorded on
a Gary 4000 Scan ultraviolet- visible spectrophotometer (Varian) and a
FluoroMax-4
spectrofluorometer (Horiba Jobin Yvon) equipped with a thermostated cell
compartment,
-- respectively. For standard recording of fluorescence spectra, the emission
was collected
10 nm after the excitation wavelength. All the spectra were corrected from
wavelength-
dependent response of the detector and measured at room temperature (25 C).
Absorbance values of all solutions were systematically below 0.1 at the
maximum.
Quantum yields were determined using a reference dye (Rhodamine B in water).
Gene library generation
The sequence coding for the SRB aptamer was flanked with constant regions at
5'
(GGGAGACAGCTAGAGTAC ¨ SEQ ID NO: 30) and 3' end
(GACACGAGCACAGTGTAC ¨ SEQ ID NO: 31) to allow DNA amplification and RNA
reverse transcription. Mutant libraries were generated by error prone
polymerase chain
-- reaction (PCR) by subjecting 10 fmoles of DNA (diluted in 200 yg/ml Of
yeast total RNA
solution (Ambion)) to 4 amplification cycles in the presence of Fwd
(CTTTAATACGACTCACTATAGGGAGACAGCTAGAGTAC ¨ SEQ ID NO: 32) and Rev
CA 03142242 2021-11-29
WO 2020/254654 PCT/EP2020/067239
33
(GACACGAGCACAGTGTAC ¨ SEQ ID NO: 33) primers as well as nucleotide
analogues (JBS dNTPMutagenesis Kit, Jena Bioscienoe) as described before". 1
ng of
PCR products was amplified in a second PCR mixture containing 10 pmoles of
each
primer (Fwd and Rev), 0.2 mM of each dNTPS, 5 U of Phire 110 (Fermentas) and
the
corresponding buffer (Fermentas). The mixture was thermocycled starting with
an initial
step of denaturation of 30 sec at 95 C followed by 25 cycles of: 5 sec at 95 C
and 30
sec at 60 C. The PCR products were purified following the "Wizard SV Gel and
PCR
Clean-up System" (Promega) kit instructions and the quantity of DNA was
determined
by NanoDrop measurement.
In vitro transcription and RNA purification
Genes coding for aptamers were PCR amplified with the same procedure used
before (25 cycles of PCR using Phirell enzyme). 1 pg of PCR products was then
in vitro
transcribed in 500 pl of mixture containing 2 mM of each NTP (Larova), 25 mM
MgCl2,
44 mM Tris-HCI pH 8.0 (at 25 C), 5 mM DTP, 1 mM Spermidine and 17.5 pg/ml T7
RNA
polymerase (prepared in the laboratory). After 3 h of incubation at 37 C, 1000
units of
BaselineZeroTM DNase (Epicentre) and the corresponding buffer were added to
the
mixture and a second incubation of 1 h at 37 C was performed. RNAs were then
recovered by phenol extraction. In vitro transcribed RNA was then purified
using ion
exchange chromatography (FastFlow DEAE sepharose, GE Healthcare) by loading
the
RNA in and washing the resin with bind/wash buffer (50mM NaCI, 50 mM Tris-HCI
pH
7.5 and 10% Glycerol) and eluting it using elution buffer (600 mM NaCI and 50
mM Tris-
HCI pH 7.5). Alternatively, RNA was gel purified by ethanol precipitating
transcription
mixture and dissolving the pellet into loading buffer (0.05% bromophenol blue,
20%
glycerol, TBE lx, 8M urea). The solution was then loaded on a 12% denaturing 8
M urea
acrylamide/bisaarylamide gel. The piece of gel containing RNA was identified
by UV
shadowing, and the RNA electroeluted as described before. Eluted RNA was then
ethanol precipitated, the washed pellets were dissolved in DEPC treated water
and
quantified With Nanodrop (Thermo Scientific).
SELEX
100 pL of streptavidin-agarose beads (Sigma-Aldrich) were washed with 200 pL
of
activation buffer (100 mM NaOH, 50 mM NaCI). The beads were then centrifuged 5
minutes at 5000 g and room temperature, then the supernatant was removed by
pipetting. This procedure was repeated with 200 pL of pre-wash buffer (40 mM
potassium
phosphate buffer pH 7.5, 100 mM KCI, 1 mM MgCl2; and 0.05% Tween 20) and
finally
200 pL of wash buffer (pre-wash buffer supplemented with 1 mg/mL BSA (New
England
Biolabs), 0.1 mg/mL sodium heparin (Sigma-Aldrich) and 200 pg/mL yeast total
RNA
(Ambion). The resin was loaded into a cartridge (Plastic small column CS-20
ABT)
CA 03142242 2021-11-29
WO 2020/254654 PCT/EP2020/067239
34
previously equilibrated by an overnight incubation with wash buffer at 4 C.
Then, 500 pL
of wash buffer supplemented with 10 nmoles of biotinylated Gemini-561 dye were
added
on the beads at a controlled flow-rate of 10 mL/h using a syringe pump (PhD
2000,
Harvard Apparatus). Afterward, the unbound fluorophore was washed away by 20
mL of
wash buffer (20 mL / h). About 50 pg of purified RNA were introduced in 250 pL
of ultra-
pure DEPC-treated water and renatured by 2 min at 85 C followed by 5 min at 25
C.
Then, 250 pL of twice concentrated washing buffer were added and the mixture
was
infused through the Gemini-561 substituted resin at a flow-rate of 1.5 mL/h.
Unbound
RNAS were eliminated per 20 mL of wash buffer infused at 20 mL/h. This initial
wash
was followed by three additional washes by 15 mL of buffer of while reducing
the ionic
strength (respectively 100 mM, 10 mM and 1 mM KCI). The selection pressure was
further increased during the last round by introducing 5 pM of free Gemini-56I
dye during
the last wash of the column. The beads were then collected using a Pasteur
pipette,
centrifuged and placed in 100 pL of elution buffer (95% formamide and 25 mM
EDTA).
After 2 minutes of heating at 90 C, the beads were centrifuged, the
supernatant was
recovered, and the RNA precipitated as above. RNA was pelleted, washed and
resuspended in 50 pL of 2 pM Rev primer solution. The mixture was heated for 2
min at
85 C and cooled at 25 C for 5 min. 50 pL of reaction mixture containing 0.5 mM
of each
dNTP, 400 U of reverse transcriptase (Maxima H Minus, ThermoFisher) and the
corresponding 2x concentrated buffer were added and the mixture and incubated
1h00
at 55 C. The resulting cDNA was then extracted with a mixture Phenol /
Chloroform /
Isoamyl alcohol 25/24/1 (Roth) and precipitated. cDNA was recovered by 30
minutes of
centrifugation at 21000 g and 4 C, washed, dried, resuspended in 250 pL of
Phirell PCR
mixture and amplified by PCR as described above.
Droplet-based microfluidics
Microfluidic chips were made of polydimethylsiloxane (PDMS) as described in
Ryckelynck, M. et al. RNA 21, 458-69 (2015).
i. Droplet digital PCR. DNA mutant libraries were diluted in 200 pg/mL yeast
total
RNA solution (Ambion) down to ¨ 8 template DNA molecules per picoliter. 1 pL
of this
dilution was then introduced in 100 pL of PCR mixture containing 0.2 pM of
each primer
(Fwd and Rev), 0.2 mM of each dNTPs, 20 pM of coumarin, 0.1% Pluronic F68
(Sigma),
5 U of Phire II DNA polymerase enzyme (Fermentas) and the corresponding buffer
(Fermentas). The mixture was loaded in a length of PTFE tubing and infused
into droplet
generator microfluidic chip where it was dispersed in 2.5 pL droplets
(production rate of
about12 000 droplets/s) carried by HFE 7500 fluorinated oil (3M) supplemented
with 3%
of a fluorosurfactant (proprietary synthesis). Droplet production frequency
was monitored
in real time using an optical device and software developed by the authors of
Ryckelynck,
CA 03142242 2021-11-29
WO 2020/254654 PCT/EP2020/067239
M. et al. RNA 21, 458-69 (2015) and used to determined droplet volume. 2.5 pL
droplets
were generated by adjusting pumps flowrates (MFCS, Fluigent). The emulsion was
collected in 0.2 mL tubes and subjected to an initial denaturation step of 2
min at 98 C
followed by 30 cycles of: 10 sec at 98 C, 30 sec at 55 C, 30 sec at 72 C.
Droplets were
5 then reinjected into a droplet fusion microfluidic device.
ii. Droplet fusion. PCR droplets were reinjected and spaced into a fusion
device at
a rate of 4500 droplets/s. Each PCR droplet was then synchronized with a 16 pL
in vitro
transcription (IVT) droplet containing 2 mM each NTP (Larova), 25 mM MgCl;, 44
mM
Tris-HCI pH 8.0 (at 25 C), 5 mM DTT, 1 mM Spermidine, 0.1% of Pluronic F68
(Sigma),
10 1 pg of pyrophosphatase (Roche), 500 nM Gemini-561, 1 pM coumarin
acetate (Sigma)
and 17.5 pg/mL T7 RNA polymerase (prepared in the laboratory). IVT mixture was
loaded in a length of PTFE tubing and kept on ice during all experiment. PCR
droplets
were spaced and IVT droplets produced using a single stream HFE 7500
fluorinated oil
(3M) supplemented with 2% (w/w) of fluorinated. Flow-rates (MFCS, Fluigent)
were
15 adjusted to generate 16 pL IVT droplets and maximize synchronization of
1 PCR droplet
with 1 IVT droplet. Pairs of droplets were then fused with an AC field (400 V
at 30 kHz)
and the resulting emulsion was collected off-chip and incubated for 2 h at 37
C.
iii. Droplet analysis and sort. The emulsion was finally reinjected into an
analysis
and sorting microfluidic device at a frequency of about 150 droplets/s and
spaced with a
20 stream of surfactant-free HFE 7500 fluorinated oil (3M). The orange
fluorescence
(Gemini-561 in complex with the aptamer) of each droplet was analysed and the
1-2%
most orange fluorescence droplets were sorted. The gated droplets were
deflected into
collecting channel by applying an AC fields (1000 V 30 kHz) and collected into
a 1.5 mL
tube. Sorted droplets were recovered from the collection tubing by flushing
200 pL of
25 HFE fluorinated oil (3M). 100 pL of 1H, 1H, 2H, 2H-perfluoro-l-octanol
(Sigma-Aldrich)
and 200 pL of 200 pg/mL yeast total RNA solution (Ambion) were then added and
the
droplets broken by vortexing the mixture. DNA-containing aqueous phase was
recovered, and the DNA recovered by PCR.
RNA probing
30 20 pg of RNA were first dephosphorylated for 20 min at 37 C using 1 U
FastAP
(Fermentas) per pg of RNA. Upon phenol/chloroform extraction, and RNA
precipitation,
dephosphorylaoed RNA was 5' labelled by incubating 5 pg of dephosphorylated
RNA
with 50 pCi of [P32]yATP and 10 U of T4 polynucleotide kinase, with T4 PNK lx
buffer in
a final volume of 15 pL during 1h00 at 37 C prior to be phenol/chloroform
extracted,
35 precipitated and pelleted. Labelled RNA was then gel-purified and eluted
from the gel by
an overnight incubation at 4 C and gently mixing in RNA Elution Buffer (500
mM of
ammonium acetate and 1 mM of EDTA). Eluted radiolabelled RNA was extracted by
CA 03142242 2021-11-29
WO 2020/254654 PCT/EP2020/067239
36
phenol/chloroform treatment, precipitated in ethanol and pelleted as described
above.
The RNA is resuspended in nuclease-free water. The specific activity (cpm/pL)
is
calculated by measuring 1 pL in a radioactivity counter "Multi-Purpose
Scintilliator
Counter" (Beckman) by Cerenkov counting. Labelled RNA (200,000 cpm) was
renatured
by heating it for 1 min at 90 C then 1 min on ice and then pre-incubated at 20
C for 15
min in a buffer containing 20 mM of this-HCI pH7.5, 1 mM of MgCl2 and 150 mM
of KCI.
1 pg of total RNA is then added to the preparation and RNAS were incubated
with Ti
enzyme (0.25 U, 0.5 U, I U), T2 enzyme (0.0125 U, 0.025 U, 0.05 U) and V1
enzyme
(0.001 U, 0.002 U, 0.004 U) for 5 min at 20 C (Ti and V1) or 10 min at 20 C
(T2) or
water (Ctrl lame). The same amounts of digested products were loaded on a 10%
denaturing 8 M urea acrylamide/bisacrylamide gel in parallel of an alkaline
hydrolysis
ladder and a denaturing Ti as described in Duval, M. et al. in RNA Structure
and Folding
Biophysical Techniques and Prediction Methods 29-50 (De Gruyter, 2013). The
radiolabelled RNAS were then visualized on autoradiographic film.
Cell culture and transfection
HeLa (ATCCO CCL2TM) and HEK293T (ATCCO CRL-3216Tm) cells were grown in
Dulbecco's Modified Eagle Medium without phenol red (DMEM, Gibco-Invitrogen)
supplemented with 10% fetal bovine serum (FES, Lonza), 1% L-Glutamine (Sigma
Aldrich) and 1% antibiotic solution (Penicillin-Streptomycin, Sigma-Aldrich)
at 37 C in
humidified atmosphere containing 5% CO2. RNA-coding constructs were
transfected
directly into a 35 mm glass-bottomed imaging dish (IBiDiO) using FuGene HD
(Promega)
transfecting agent following recommended manufacturer protocol. Imaging
experiments
were performed between 16-24 h post-transfection.
Cellular Imaging
Cells were seeded onto a 35 mm glass-bottomed imaging dish (IBiDiO) at a
density
of 3-5x10⁴ cells/well 48 h before the microscopy measurement. 16-24 h prior to
imaging
cells were transfected with corresponding DNA plasmid. For imaging, the
culture medium
was removed and the attached cells were washed with Opti-MEM (Gibco-
Invitrogen).
Next, the cells were incubated in Opti-MEM with Hoechst (5 pg/mL) to stain the
nuclei
and in the presence of Gemini-561 dye (0.2 pM) for 5 min, the living cells
were washed
twice with Opti-MEM and visualized in Opti-MEM or were fixed in 4% PFA in PBS
for 5
minutes before being wash twice in PES. The images were acquired in
epifluorescence
mode with a Nikon Ti-E inverted microscope, equipped with CFI Plan Apo x 60
oil (NA =
1.4) objective, and a Hamamatsu Orca Flash 4 sCMOS camera. The acquisition
settings
were: Hoechst (ex. 395 nm, em. 510 42 nm), eGFP (ex: 470 nm, em: 531 40 nm),
G561/o-Coral complex (ex: 550 nm, em: 595 40 nm) and Alexa-647 (ex: 638 nm,
em:
CA 03142242 2021-11-29
WO 2020/254654 PCT/EP2020/067239
37
LP 647 nm). The images were recorded using NIS Elements and then processed
with
Icy software.
Microinjection experiments
Cells were seeded onto a 35 mm glass-bottomed imaging dish (IBiDiO) at a
density
.. of 1x10⁵ cells/well 24 h before the microscopy measurement. For imaging,
the culture
medium was removed and the attached cells were washed with Opti-MEM (Gibco-
Invitrogen). Next, the cells were incubated in Opti-MEM with Hoechst (5 pg/mL)
to stain
the nuclei. In vitro transcribed and purified aptamers were preincubated with
respective
fluorogen for 10 min in selection buffer to form complex at corresponding
concentrations
indicated in figures. Microinjection parameters: Pi=90 [hPa]; Ti=0.3 [s];
Pc=10 [hPa]. The
images were acquired in epi-fluorescence mode with a Nikon Ti-E inverted
microscope,
equipped with CFI Plan Apo x 60 oil (NA = 1.4) objective, and a Hamamatsu Orca
Flash
4 sCMOS camera. The acquisition settings were: Hoechst (ex. 395 nm, em. 475 50
nm),
Broccoli (ex: 470 nm, em: 531 40 nm); Corn (ex: 470 nm, em: 531 40 nm); Mango
(ex:
470 nm, em: 531 40 nm); Coral (ex: 550 nm, em: 595 40 nm). The images were
recorded using NIS Elements and then processed with Icy software.
TA cloning
The DNA contained in the libraries obtained after the last two rounds of
droplet-
based microfluidics screening were amplified by PCR as described above but
using the
DreamTaq@ enzyme and buffer (Fermentas) instead of Phirell (Fermentas). PCR
products were purified using of the "Wizard SV Gel and PCR Clean-Up System"
kit
(Promega) and inserted into the cloning vector of the "insTAclone PCR Cloning"
kit
(Thermo-Scientific) following the manufacturer's recommendations by overnight
ligation
at 4 C. ElectroTEN Blue bacteria were then transformed by electroporation by
the
ligation mixture and plated onto a 2YT / agar / Ampicillin (100 pg / mL)
plate.
Individual colonies were used to seed 20 pL of Phirell PCR mixture (see above)
while the rest of the colony was introduced in 3 mL of liquid medium 2YT
/Ampicillin (100
pg / ml) overnight at 37 C under agitation. Upon thermocycling, 2 pL of PCR
product
were added to 18 pL of in vitro transcription mixture (see above) supplemented
with 100
nM of Gemini-561. The mixture was then incubated at 37 C in a qPCR machine
(Stratagene MX300SP, Agilent Technologies) and the fluorescence of the
reaction was
monitored for 2 hours (ex/em 575/602 nm). Finally, plasmid DNA was extracted
from
bacteria of interest using "GenElute Plasmid Miniprep" kit (ThermoFisher) and
sequenced by the Sanger method (GATC Biotech).
Real-time IVT measurements
PCR products of each selection cycle were purified by the "Wizard SV Gel and
PCR Clean-up System " (Promega) kit and quantified by NanoDropTM. 50 ng of
pure DNA
CA 03142242 2021-11-29
WO 2020/254654 PCT/EP2020/067239
38
was introduced into 38 pL of in vitro transcription mixture (see above)
supplemented with
100 nM of Gemini-56I. This mixture was then incubated at 37 C in a real-time
thermOcycler (Stratagene Mx300SP, Agilent Technologies) and the fluorescence
was
monitored as above.
Fluorescence measurement on purified RNA
1 pM purified RNA was heated for 1 min at 90 C and cooled at 4 C for 1 min.
The
solution was then supplemented with 1 volume of a twice concentrated mixture
containing 80 mM potassium phosphate buffer pH 7.5, 2 mM MgCl2, 0.1% Tween 20,
200 mM of salt (KCI, NaCI, LiC or CsCI) and 100 nM Gemini-561. The mixture was
then
incubated for 10 min at 25 C prior to measuring the fluorescence at 25 C 011 a
real-time
thermocycler (ex/em 575/602 nm, MX 3005P, Agilent) or on microplate reader
(ex/em
560/600 nm, SpectraMax iD3, Molecular Devices).
Affinity measurements
To measure Kd, the concentration of renatured and purified RNAS was
progressively increased from 2.45 nM to 40 pM for SRB-2 and from 3.9 nM to 4
pM for
4C10 and o-Coral aptamer with 100 nM (for SRB-2) or 25 nM (for 4C10 and 0-
Coral) of
Gemini-56I in 40 mM potassium phosphate buffer pH 7.5, 100 mM KCI, 1 mM MgCl2
and
0.05% Tween 20. The fluorescence was measured on microplate reader (ex/em
580/620
nm, SpectraMax iD3, Molecular Devices).
Expression vectors design
The sequences coding for o-Coral or 20 nucleotides from Broccoli aptamer
(Ctrl)
were introduced downstream a U6 promotor into a F30-scaffold contained into a
pUC57
vector (Proteogenix) via a restriction (Sbfl) / ligation step. The entire
sequences (pU6_o-
Coral_F30 or pU6_CUI_F30) were then introduced into an eGFP-N1 vector
(Clontech)
using AflII restriction sites. Alternatively, o-Coral-F30 or Ctrl-F30
sequences were
introduced directly in the 3'UTR of the eGFP coding sequence under the control
of a
CMV promotor by a restriction (Mfel) / ligation step.
RESULTS
Design and synthesis of Gemini-561 fluorogen
The inventors intended to develop an orange-red emitting fluorogen that would
be
efficiently excited with a common laser (530-560 nm), allowing multicolor
imaging in
combination with GFP-tagged proteins. Rhodamine fluorophores like SRB fulfil
this
requirement and also possess numerous advantages. First, due to their tendency
to form
H-aggregates and their ability to be quenched by different systems (e.g.
sprirolactamization, PET), rhodamines constitute efficient platforms to
develop reliable
fluorogenic sensors. SRB bears two sulfonate groups and upon functionalization
becomes zwitterionic, i.e. non-charged. Compared to cationic rhodamines or non-
CA 03142242 2021-11-29
WO 2020/254654 PCT/EP2020/067239
39
charged fluorophores, this feature should increase the polarity of the
molecule and thus
enhance the water solubility and, at the same time, prevent from non-specific
interactions
in biological media. Finally, SRB features optimal photophysical properties
including
elevated quantum yield, good photostability and high molar absorption
coefficient (about
100,000 M-1.cm-1). Gemini-561 was designed to promote the dimerization induced
self-
quenching of two SRBs. For this purpose, lysine, a natural amino acid, was
chosen as a
connector to provide a small distance between the dyes and thus ensure
efficient Tr-
stacking upon dimerization. Lysine (1) and SRB (2) derivatives were
deprotected and
coupled to lead to Gemini-561-alkyne (Figure 4A). The latter was clicked to
biotin-PEG-
N3 to yield Gemini-561.
Spectroscopic properties of Gemini-561
Gemini-561 fluorogenicity was first assessed by spectroscopic approach. In
water,
Gemini-561 displayed weak fluorescence intensity with a quantum yield value of
0.01.
Moreover, a blue shifted band (530 nm) appeared in the absorption spectrum
indicating
the formation of dimeric H-aggregate (Figure 4B), in line with earlier report
on the
squaraine dimers. Additionally, excitation spectrum showed that this band did
not
correspond to emissive specie (Figure 4C), thus confirming a dimerization-
induced
quenching phenomenon. However, upon solubilization in methanol, the dimer
opened
and Gemini-561 displayed absorption and emission spectra similar to free SRB
(Figures
4B and C) along with an impressive increase in the quantum yield value (0.31,
Figure
10E). In a second step, the non-specific opening of the dimer was evaluated in
physiological media including PES, DMEM and Opti-MEM.
Gemini-561 proved to conserve its quenched form in various conditions
including
those in the presence of bovine serum albumin (BSA) or 10% fetal bovine serum
(FES).
These results suggest that Gemini-561 is not involved in non-specific
interactions with
proteins and lipoproteins that could provoke non-desired turn-on of the dimer
(Figure 5).
Altogether, these experiments demonstrate that Gemini-561 constitutes an
effective
fluorogenic molecule compatible with biological media thus making it a
promising
candidate for selection of the RNA aptamer.
Isolation of Gemini-561 lighting-up aptamers by in vitro evolution
The inventors first studied SRB-2 aptamer, which was previously developed to
specifically interact with sulforhodamine B and its derivatives. However, its
capacity to
turn on Gemini-561 fluorescence was poor (Figure 6A, Figures 7A and B). This
weak
effect might be attributed to inhibition of dye-aptamer interaction by the dye-
dye
dimerization.
The inventors therefore started in vitro evolution of SRB-2 using a strategy
combining SELEX in tandem with pIVC (Figure 6B, Figure 8) to isolate RNAs
endowed
CA 03142242 2021-11-29
WO 2020/254654 PCT/EP2020/067239
respectively with both high affinity and high fluorogenic capacity. SRB-2
mutant library
(about 3.4 mutations per gene) was first generated by error-prone PCR and
subjected to
a first round of SELEX during which RNAs were challenged to bind bead-
immobilized
Gemini-561. Upon stringent wash, bound aptamers were recovered, and reverse
5 transcribed into cDNAs to which T7 RNA polymerase promoter was appended.
Resulting
genes were then subjected to a round of droplet-based microfluidic pIVC
screening as
previously described. Genes encoding fluorogenic RNAs were then recovered and
used
to prime a new round of error-prone PCR. A total of four such evolution cycles
(mutagenesis, SELEX, pIVC) were performed and allowed to gradually improve the
10 average fluorogenic capacity of the population (Figure 6B). Cloning and
analysing genes
isolated from the two last rounds confirmed the overall success of the process
since ¨
40 % of the tested sequences were significantly more fluorogenic than the
parental SRB-
2 aptamer. Surprisingly, 16 out of the 19 best mutants also displayed a size
increase by
about 2-fold resulting from complete duplication (dimerization) of SRB-2
sequence that
15 occurred upon a recombination event at a variable position between the
5' and 3'
constant regions of two aptamers (Figure 6C and Figure 9). The exact mechanism
of
this spontaneous recombination will require a dedicated study. In addition to
this
duplication, each optimized variant displayed 1 to 6 point mutations
concentrated on PI
and P2 regions of the SRB-2 (Figure 9), while leaving region J2/3, P3 and L3
largely
20 intact, in agreement with their proposed involvement in sulforhodamine B
recognition.
Among the different clones, 4C10, a duplicated variant displaying 6 point
mutations, had a remarkably high activation capacity by forming with Gemini-
561 a
complex an order of magnitude more fluorescent than that of the parent 5RB22
(Figure
6A). 4C10 improvement correlates with a significant increase of affinity
(about 73 1.5
25 nM and 441 167 nM for 4C10 and SRB-2 respectively, Figure 10E). By
further
engineering 4C10, the inventors successfully reduced the 19-nucleotide long
linker
spacing the repeats down to 6 nucleotides while preserving intact
fluorogenicity (Figure
10A). Further reducing this length down to 3 nucleotides made aptamer
fluorescence
activation sensitive to the sequence of the linker. Therefore, the inventors
pursued the
30 study of a 6-nucleotide long linker 4C10 derivative, further named "o-
Coral", which
conserved both fluorogenicity and affinity for Gemini-561 (Figure 10E). The
duplication
event by itself accounts only partly for the high performances of o-Coral
since a molecule
made of two wild-type SRB-2 modules displays only 6% of o-Coral fluorescence
(Figure
10B). Progressive reimplantation of o-Coral mutations showed that all the
mutations
35 contributed to o-Coral function to a different degree with the double
mutant U25C/A36G (a
mutation found in a third of the 19 best mutants, Figures 9, 11A and B) having
the
predominant effect. Remarkably, simple introduction of U25C/A36G mutation into
SRB-2
CA 03142242 2021-11-29
WO 2020/254654 PCT/EP2020/067239
41
did not yield any improvement of the monomer, indicating a synergic effect of
the
mutation with the dimerization (Figure 10B). Furthermore, U250/A36G had a
higher effect
when present in the 5' monomer, whereas introducing it in both monomers did
not further
improve the aptamer.
o-Coral structural characterization
An important question raised in this work was to establish whether the
dimerization
of the RNA module was a simple duplication of the aptamer or if more important
folding
changes occurred. Enzymatic structural probing characterization (Figure 13)
was in
agreement with an overall conservation of the structure initially proposed for
the SRB-2
aptamer made of 3 stems and 3 unpaired regions. Yet, two RNA folding models
could
account for the probing signal observed: i) a model in which both SRB-2
derived modules
fold independently (Figure 14A) and ii) an intertwined folding (Figure 14B).
To
discriminate both models, the inventors generated a mutant with a destabilized
stem
(67GGUUC71 changed for 6700AAG71, Figures 11A end B) leading to the complete
loss
of fluorogenic capacity (Figure 10E). The inventors then tested compensatory
mutants
relevant either to the independent folding model (20GAACC24 changed for
2oCUUGG24)
or to the intertwined structure (79GGGCC85 changed for 79CUUGG85).
Interestingly, only
the second compensatory mutant rescued o-Coral function (Figure 10C),
suggesting
that o-Coral adopts an intertwined folding (Figure 10F). This model received
further
support from a second mutant (69UU70 changed for 690070) expected to stabilize
only the
intertwined folding (Figures 12). Finally, when looking carefully at the
mutations selected
during the evolution process, one can see that two of them (G19A and 0132U)
compensate
each other in the intertwined model (Figures 14B).
In the inventor's model, unpaired regions corresponding to J2/3 and L3 in the
original SRB-2 aptamer and proposed to form the SRB-binding site are preserved
(nucleotides 37-43, 49-60, 97-103 and 109-20). The three-dimensional structure
of SRB-
2 aptamer has not been established yet. However, even though pairs of G bases
are
found within and around these loops, the existence of a G-quartet structure
common to
many other light-up aptamers is unlikely since the complex was found to be
insensitive
to the nature of the monovalent cation added in the medium (Figure 15A).
Understanding how exactly the fluorogen and the aptamer interact together will
require
a dedicated structural characterization.
Gemini-561/o-Coral characterization in solution
Detailed spectroscopic characterization of Gemini-56I/o-Coral complex revealed
a
significant red-shifted absorption and fluorescence emission (by 19 and 16 nm,
respectively) compared to those in an "activating" solvent methanol (Figure
10D and
Figures 16 to 18), presumably because of interaction between the dyes and RNA
CA 03142242 2021-11-29
WO 2020/254654 PCT/EP2020/067239
42
nucleobases. Interestingly, the quantum yield of the complex also reached a
higher value
than Gemini-561 in Me0H (Figure 10E), showing that the dye is well confined
within o-
Coral aptamer. Moreover, estimating the brightness of the module, as
extinction
coefficient x quantum yield, indicated that a single copy of o-Coral associate
With
Gemini-561 is more than 3 times brighter than eGFP (Figure 10E), making it the
brightest aptamer-based module described so far. Moreover, Fluorescence
Correlation
Spectroscopy (FCS) confirmed high brightness of Gemini-561/o-Coral complex (at
least
1.14-fold as bright as single tetramethyl rhodamine, a close analogue of SRB)
and
suggested that this complex is composed of a single molecule of Gemini-561
bound to
a single copy of o-Coral (Table 1).
Fluoromodule/ n Tcorr, MS C,
nM Size, Brightness
reference dye nm
Tetramethylrhodamine 11.64 0.032 50 1 1
o-Coral/Gemini-651 43.22 0.22 185.71 6.86 1.14*
Fluorescein 13.03 0.026 50 1 1
Broccoli/DFHBI-IT 14.16 0.16 54.35 6.27 0.18
Corn/DFHO 54.7 0.063 209.94 2.56 0.62
Table 1: Fluorescence Correlation Spectroscopy (FCS) analysis of the
fluoromodules. n - number of emissive species per excitation volume; Tcorr -
correlation time; size - hydrodynamic diameter of fluorescent specie;
brighmess with respect to one molecule of the standard (rhodamine B for o-
Coral, fluorescein for Broccoli and Corn). Mango was excluded from this study
since its photophysical properties did not fit the analysis settings.
Concentrations of fluorogen and corresponding aptamer were systematically
200 nM and 1 pM, respectively.* This value corresponds to 532 nm excitation,
which is less efficient for excitation than that for the TMR standard, because
of the red shifted absorption of the former.
The Inventors next tested the effect of magnesium ions on fluorescence of the
complex. RNA very often uses magnesium ions as a co-factor to assist its
folding and in
vitro without any other stabilizing agent (i.e. polyamines) it may sometimes
require
concentration far exceeding the 1-3 mM available in the cell. Here, the
inventors found
that as few as 1 mM magnesium chloride was sufficient to obtain maximal
fluorescence
of Gemini-561/o-Coral (Figure 15A). This value is in agreement with that
recently
reported for SRB-2 aptamer and shows that o-Coral is compatible with
intracellular
magnesium concentrations. The inventors then investigated the effect of
physiological
media on the Gemini-561/o-Coral complex and found that whereas 10% FBS
slightly
interferes with the aptamer-fluorogen interaction (Figure 19), SRB2 aptamer,
BSA or
DNA did not challenge the fluorescence of the complex. Altogether, these data
further
support the compatibility of Gemini-561/o-Coral module in complex cellular
environment.
CA 03142242 2021-11-29
WO 2020/254654 PCT/EP2020/067239
43
Imaging Gemini-561/o-Coral in live cells
Prior to applying Gemini-561/o-Coral module in cells, the inventors first
checked for
the potent cytotoxicity of the fluorogen. As expected, the cell survival was
not affected
by an extended incubation with Gemini-561 (Figure 20). The inventors then
validated
the functionality of the fluorogenic module in live HeLa cells by micro-
injecting the
preformed Gemini-561/o-Coral complex either directly into their nucleus or
into their
cytoplasm of living HeLa cells (Figure 21A). In both cases, an intense red
fluorescence
was readily observed in the presence of the module, whereas the injection of
Gemini-56I
alone and mixed with SRB-2 aptamer did not yield significant fluorescence
(Figure 21A),
confirming that the Gemini-561 fluorescence is specifically induced by o-Coral
and that
this module is well suited for live cell applications. We also assessed the
cell permeability
of Gemini-561 by incubating HeLa cells with 200 nM fluorogen. After washing,
RNA was
microinjected along with Dextran-Alexa-647 conjugate. Both o-Coral and SRB-2
were
successfully injected in the cells as attested by Alexa-647 fluorescence
(Figure 21B).
However, Gemini-561 fluorescence inside the cytosol was observed only in the
presence
of o-Coral, suggesting both cell permeability of the fluorogen and its
capacity to detect
o-Coral inside live cells.
The inventors next evaluated the performances of their fluorogenic module with
aptamers synthesized in situ by the cell machinery. To this end, o-Coral was
inserted
into a F30 scaffold and placed under the control of a U6 truncated promoter
allowing the
gene to be transcribed by RNA polymerase III (p01111), resulting in RNA
homogeneously
distributed in the cell. The plasmid also contained the eGFP-coding region
placed under
the control of an RNA polymerase II (p0111) promoter and used for identifying
transfected
cells by their green fluorescence. Taking advantage of Gemini-561 cell-
permeability, the
inventors repeated the experiment by expressing o-Coral gene in live Hela and
HEK293T
cells, and then incubated the cells with 200 nM Gemini-561 for 5 minutes prior
to imaging.
As expected, green fluorescent (GFP) transfected cells also displayed intense
red
(Gemini-561) fluorescence both in the nucleus and in the cytoplasm (Figure 22,
Figures
23). This fluorescence correlated with o-Coral gene expression since
inhibiting it with
actinomycin D, a known inhibitor of RNA polymerases, led to the complete loss
of the
red fluorescence signal (Figure 23A). Interestingly, during these live-cell
imaging
experiments, the inventors noticed cell-to-cell variations in the fluorescence
intensity of
the Gemini-561/o¨Coral (Figure 24), suggesting different transcription states
as
reported recently with a different aptamer. Taken together, these data show
that, owing
to elevated brightness and affinity of Gemini-561/o-Coral complex, a single
copy of pol
III-expressed o-Coral aptamer is sufficient for RNA detection in living
mammalian cells
using Gemini-561.
CA 03142242 2021-11-29
WO 2020/254654 PCT/EP2020/067239
44
The inventors finally extended our study to Pol II transcripts by inserting o-
Coral/F30 scaffold directly into the 3' untranslated region of the gfp gene
carried on the
plasmid. Excitingly, they found that labelling gfp mRNA with a single copy of
o-Coral was
sufficient to detect an intense red fluorescence observed in GFP transfected
cells
(Figure 22). The mRNA detection with Gemini-561/o-Coral module worked well in
both
HeLa and HEK293T cells, revealing fine difference in mRNA distribution.
Indeed, in HEK
cells the signal of mRNA was evenly distributed between nucleus and cytosol,
similarly
to GFP, whereas in HeLa cells the mRNA signal was stronger in the nucleus
(Figure
22). It is noteworthy to highlight that, to the best of inventors' knowledge,
it is the first
time that a mRNA labelled with a single copy of a light-up aptamer can be
visualized
without the need for extensive image processing.
Comparison of Gemini-56110-Coral to other aptamer modules
To further demonstrate the advantage of their new fluorogenic module, the
inventors systematically compared its performances with that other modules
that use
commercially available fluorogens, namely Broccoli, Mango III and the Corn.
Moreover,
to properly compare our data with those reported in the literature, aptamers
were
embedded into the RNA scaffold as they were previously characterized in (i.e.
tRNA
scaffold for Corn and F30 scaffold for Broccoli, Mango III and 0-Coral).
First, the
inventors assessed photostability of the fluorogenic modules in solution with
fixed
concentrations of a fluorogenic dye (0.2 pM) and corresponding aptamer (1 pM)
(Figure
25D), where all the solution in a cuvette was irradiated with a laser light.
To ensure that
the four studied systems absorbed similar amount of photons during
photobleaching, the
applied irradiation power density (irradiance) inversely proportional to the
extinction
coefficient of the corresponding dye at the excitation wavelength used. DFHBI-
IT/Broccoli complex showed very poor photostability as its intensity vanished
within <1
s, in line with previous reports. Significantly higher photostability was
observed for
DFHO/Corn and TO1¨biotin/Mango III, as their emission changed to much lower
extent
within 200 s of irradiation, which also corroborates with the earlier studies.
Excitingly,
emission intensity of Gemini-561/o-Coral did not show any change in the
fluorescence
intensity in these conditions, indicating that it is significantly more
photostable than all
three previously reported fluorogenic modules.
Second, the inventors compared brightness of the complexes at the single-
molecule level using FCS (Mango system was not characterized because of
incompatibility with our setup). Single-molecule brightness of DFHO/Corn and
DFHBI-
1T/Broccoli was correspondingly 0.62 and 0.18 (Table 1) with respect to that
of reference
dye fluorescein (at pH 9), which confirms much higher brightness of the
DFHO/Corn
module. On the other hand, the single molecule brightness of Gemini-561/o-
Coral was
CA 03142242 2021-11-29
WO 2020/254654 PCT/EP2020/067239
1.14 of that of reference dye tetramethyl rhodamine in water (Table 1). Taking
into
account that fluorescein and TMR exhibit similar brightness in the inventors'
FCS setup,
the new fluorogenic module, Gemini-5611/o-Coral, is about 2-fold brighter than
DFHO/Corn in the single molecule experiments.
5 On the next step the inventors performed cellular experiments where the
fluorogen/aptamer complex was preformed and then microinjected into live
cells. Right
after microinjection, images were taken (Figure 25A) and the signal/background
ratio
(S/B) was measured. Gemini-561/o-Coral system provided images with a S/B value
of 9
0.9, which was significantly higher than those obtained with other three
studied
10 fluorogenic modules (Figure 25A). Images taken after different times of
irradiation
showed that fluorescence intensity within the cells decayed much slower for
Gemini-
561/o-Coral compared to other studied fluorogenic modules (Figures 25A and B),
which
confirmed superior photostability of the former. In an alternative experiment,
cells were
incubated in the presence of the fluorogenic molecules and then the
corresponding
15 aptamer was microinjected. In this case, the obtained photobleaching
curves also
showed that Gemini-561/o-Coral was significantly more photostable than other
three
reference aptamer-based systems (Figure 26), allowing >20 s continuous imaging
with
only a minor loss of fluorescence intensity. Remarkably, Gemini-561/o-Coral
fluorescence can still be detected upon several hours of constant illumination
(Figure
20 27).
DISCUSSION
Light-up aptamers gained their niche as powerful genetically encoded RNA
imaging tools. Due to its high modularity and available SELEX methodologies, a
palette
of the fluorogen-aptamer systems was discovered to shine light on complex cell
25 machinery. Unfortunately, limited brightness and photostability of
aptamer-based
fluorogenic modules developed to date narrow their broad application. In this
work the
inventors developed and characterized Gemini-561/o-Coral, a new RNA-based
fluorogenic module displaying high brightness, affinity and photostability
making it, to the
best of inventors' knowledge, one of the brightest module described so far in
the
30 literature, the inventors reached this goal mainly through the combined
use of two
innovations. First, the fluorogen Gemini-561 which consists of two copies of
the bright
and photostable sulforhodamine B dye that self-aggregates into a poorly
emissive specie
able to rapidly enter the live cells. This quenching mode is interesting
since, upon
activation, both fluorophores become strongly fluorescent making such a probe
brighter
35 than any monomeric probe described to date. Second, the inventors
developed a light-
up RNA aptamer using a powerful integrated in vitro evolution strategy
combining rounds
of mutagenesis and SELEX in tandem with pIVC screening. In this scheme, the
SELEX
CA 03142242 2021-11-29
WO 2020/254654 PCT/EP2020/067239
46
step allows isolating RNAs with highest affinity for the Gemini-561 probe,
whereas the
pIVC isolates the most fluorogenic sequences. The inventors finally obtained o-
Coral
that efficiently opens the aggregated dimer Gemini-561 through binding to each
sulforhodamine B moiety. Using the same overall strategy, it should be
possible to further
expand RNA imaging toolbox by developing new orthogonal modules made of
dimeric
(Gemini) fluorophores of any desired colour while selecting new Coral aptamers
that can
specifically activate them.
The intertwined dimerized structure of o-Coral may also be advantageous for
the
future engineering of aptamers. Indeed, both L2 and L2' loops together with
the linker
region are highly amenable to sequence modification and are attractive sites
for inserting
other sequences (e.g. sensing aptamers). By doing so, o-Coral could be
converted into
complex multi-inputs logic gates or biosensors.
o-Coral is readily expressed in mammalian cells where it forms a bright
complex
with Gemini-561 that is otherwise not activated by cell components.
Interestingly, o-Coral
does not seem to possess the G-quadruplex organization shared by most of the
other
structurally characterized light-up aptamers. This is of particular interest
when
considering a recent report suggesting that most of the RNA G-quadruplex
domains
would be kept globally unfolded in mammalian cells, suggesting that G-
quadruplex-
based RNA may not be optimal for being used in living cells. Direct comparison
of
Gemini-561/o-Coral with the most representative aptamer-based fluorogenic
modules in
live cells showed clear advantages of the new module in terms of brightness
and
photostability. Moreover, their estimated 3-fold higher brightness than GFP
suggests that
they can be brighter than a single copy of MS2-GFP module. Superior
characteristics of
Gemini-561/o-Coral module enabled imaging of mRNA by integrating just a single
copy
of the aptamer (o-Coral), which has remained a challenge so far in this
technology.
Overall, Gemini-561/o-Coral system significantly strengthens the toolbox for
RNA
imaging and shows a new direction in the development of ultrabright
fluorogenic
aptamer-based modules.
Example 2: Synthesis of Gemini 552-alkyne and its response to o-Coral.
CA 03142242 2021-11-29
WO 2020/254654 PCT/EP2020/067239
47
0
-NH
0
NHd p \--\-14-1N-1
00C * 07NH 0
\N #/ \
0 II 0 NH
/
+ N- Ill -
00C
N 0 N
1 I
Gemini-552-alkyne
Method of synthesis of Gemini-552-alkyne.
5-Carboxy-tetramethylrhodamine (20 mg, 47 pmol, 1 eq) was combined with DSC
(18
mg, 70 pmol, 1.5 eq) in DCM (2.5 mL). After adding Et3N (39 pL, 280 pmol, 6
eq) and
.. DMAP (29 mg, 232 pmol, 5 eq), the reaction was stirred at room temperature
for 1.5 h
and protected from light. After that, deprotected diamine ((S)-N,N'-(6-oxo-6-
(prop-2-yn-
1-ylamino)hexane-1,5-diy1)bis(3-aminopropanamide), 7.6 mg, 23 pmol, 0.5 eq)
was
added. The reaction was stirred 16 hat room temperature, then solvent was
removed by
concentrating in vacuo. The crude material was purified by reverse phase HPLC
to
provide 16 mg (30 %) of as a dark violet solid. HRMS (ESI+), calc. for
069H67N9011
[M+2H] 1149.51, found 1149.51. 1H NMR (400 MHz, Methanol-d4) 5 8.65 - 8.57 (m,
2H), 8.06 (ddd, J= 10.1, 7.9, 1.8 Hz, 2H), 7.34 (dd, J= 7.9, 1.3 Hz, 2H), 7.27
- 7.20 (m,
4H), 7.01 (dtd, J = 9.5, 2.4, 1.2 Hz, 3H), 6.92 (dd, J = 4.0, 2.4 Hz, 4H),
4.39 (dd, J = 9.3,
4.8 Hz, 1H), 3.99 (t, J= 2.6 Hz, 2H), 3.75 (ddt, J= 13.7, 9.5, 6.7 Hz, 4H),
3.37 (p, J= 1.6
Hz, 6H), 3.30 (d, J = 1.8 Hz, 31H), 3.23 (t, J = 6.6 Hz, 2H), 2.78 - 2.66 (m,
2H), 2.67 -
2.55 (m, 3H), 1.97 (t, J = 7.4 Hz, OH), 1.92 - 1.30 (m, 3H), 1.22 (d, J = 6.2
Hz, 1H). 130
NMR (101 MHz, Methanol-d4) 5 172.56, 167.55, 157.51, 157.49, 157.20, 157.17,
135.58, 131.15, 131.15, 129.44, 128.15, 125.25, 113.28, 95.96, 95.96, 79.27,
70.83,
39.46, 36.58, 36.58, 35.30, 31.22, 28.63, 28.11, 23.85, 22.71.
Results:
The spectroscopic response of Gemini-552 to o-Coral aptamer was studied in an
aqueous buffer by absorption and fluorescence spectroscopy. It can be seen
that
absorption spectrum of Gemini-552 in a buffer presents a short-wavelength
band, typical
for the self-quenched H-aggregate (Figure 28). In the presence of o-Coral,
this band
.. decreases with formation of a long-wavelength band, suggesting that Gemini-
552
CA 03142242 2021-11-29
WO 2020/254654 PCT/EP2020/067239
48
recognizes the aptamer, which leads to opening of the dimer. In the
fluorescence spectra
the addition of o-Coral leads to significant increase in the fluorescence
intensity (Figure
29), confirming the capacity of Gemini-552 to detect the aptamer through a
fluorescence
turn on. In case of a wild type (monomeric) aptamer (SRB-2), the spectroscopic
effect
and the fluorescence enhancement was much less pronounced, indicating that the
interaction of Gemini-552 and o-Coral is specific. This example shows that the
concept
of the dye dimers can be applied to carboxy-derivatives of rhodamine dyes
(like
tetramethylrhodamine).
Example 3 Aptamer-mediated activation of Gemini 640-2
This example shows that Gemini 640-2 (molecule 8) can be specifically
activated by an
RNA aptamer evolved to recognize the silicon-rhodamine moiety. Here, we used
the
SIR-A aptamer described in D01/10.1021/jacs.9b02697.
Method:
A template DNA
(5'-
GGGAGACAGCTAGAGTACGGCCACCGGGTTTGAAAACCTGGCTGCTTCGGCAGT
TGTATCCTTTGGCCGACACGAGCACAGTGTAC-3'), (SEQ ID NO: 34)
in which the SIR-A coding region (underlined sequence) was surrounded by two
extensions (italicized sequence), was first PCR-amplified by introducing 1 ng
of template
DNA (IDT) into 100 pL of reaction mixture containing 50 pmoles of Fwd primer
(5'-
CTTTAATACGACTCACTATAGGGAGACAGCTAGAGTAC-3' (SEQ ID NO: 35) adding
T7 RNA polymerase promoter [bolded sequence] upstream the template), 50 pmoles
of
Rev primer (5'-GTACACTGTGCTCGTGTC-3' (SEQ ID NO: 36)), 0.2 mM of each dNTPs,
1 U of Q5 DNA polymerase (New England Biolabs) and the corresponding buffer at
the
recommended concentration. The mixture was then thermocycled starting with an
initial
step of denaturation of 30 sec at 95 C followed by 25 cycles of: 5 sec at 95 C
and 30
sec at 60 C. The PCR products were purified using "Monarch PCR purification
kit" (New
England Biolabs) following supplier recommendations and the recovered DNA
quantified
determined by NanoDropTM measurement.
20 ng of purified PCR product were then introduced into 40 pL of in vitro
transcription
mixture containing 2 mM each NTP (Larova), 25 mM MgCl2, 44 mM Tris-HCI pH 8.0
(at
25 C), 5 mM DTT, 1 mM Sperm idine, 1 pg of pyrophosphatase (Roche), 500 nM
Gemini
640-2 (molecule 8), and 17.5 pg/mL T7 RNA polymerase (prepared in the
laboratory).
This mixture was then incubated at 37 C into a microplate reader (SpectraMax
iD3,
Molecular Devices) and the red fluorescence (ex./em. 640 nm/680 nm) monitored
every
minute.
Results:
CA 03142242 2021-11-29
WO 2020/254654 PCT/EP2020/067239
49
Red fluorescence constantly increased in tubes containing the SIR-A template
(i.e., gray
circles on Figure 30), whereas no signal was observed in the absence of
template (i.e.,
gray triangles on Figure 30). These data demonstrate that the fluorescence of
Gemini
640-2 (molecule 8) can be activated ¨ 2.5-fold by an aptamer recognizing the
Silicon-
.. Rhodamine moiety. Moreover, incubating Gemini 640-2 (molecule 8) with an
unrelated
aptamer (i.e., o-Coral, the specific activator of Gemini 561-2 (molecule 7))
does not yield
any fluorescence (Figure 31), demonstrating the lack of non-specific
activation of Gemini
640-2 (molecule 8). Furthermore, whereas Gemini 561-2 (molecule 7) is
activated by o-
Coral aptamer as expected (Figure 32), it stays insensitive to SIR-A, further
reinforcing
the great specificity of both systems.