Note: Descriptions are shown in the official language in which they were submitted.
CA 03142293 2021-11-30
WO 2020/245155 PCT/EP2020/065289
1
METHODS FOR MODULATING A TREATMENT REGIMEN
The present invention relates to methods for determining, modulating or
adjusting a
treatment regimen with a chemotherapeutic agent in a patient affected with a
cancer.
Background of the invention
As explained in detail by Galon et al (Cancer classification using the
Immunoscore: a
worldwide task force J Transl Med. 2012; 10: 205), prediction of clinical
outcome in
cancer is usually achieved by histopathological evaluation of tissue samples
obtained
during surgical resection of the primary tumor. Traditional tumor staging
(AJCC/UICC-
TNM classification) summarizes data on tumor burden (T), presence of cancer
cells in
draining and regional lymph nodes (N) and evidence for metastases (M). Galon
et al. have
shown that the immune active or immune silent tumors associated with cytotoxic
and
memory T-cells, Thl cells, and interferon-gamma (IFN-y) signature are
correlated with
long-term survival or rapid recurrence respectively (Galon et al, Science,
2006;313(5795):1960-4; Camus et al,. Cancer Res. 2009;69(6):2685-93). The
consensus
Immunoscoreg categorizing inflamed and non-inflamed tumors was recently
validated
globally with profound clinical implications (Pages et al, Lancet.
2018;391(10135):2128-
39).
While methods for determining sensitivity of a patient toward an anti-tumoral
therapy have
been proposed, there is still a need for tools which would aid the physician
in modulating
the therapy in a most efficient manner.
Summary of the invention
It is herein provided a method for determining, modulating or adjusting a
treatment
regimen with a chemotherapeutic agent in a patient affected with a cancer,
wherein said
agent is able to leverage or promote a tumor-targeted immune response,
preferably by
causing immunological cell death (ICD) which method comprises quantifying at
least two
biological markers which are CD8 and CD3 in a tumor sample from the patient.
More particularly, the method may advantageously comprise quantifying the
density of
CD3+ cells in center of the tumor (CT), the density of CD8+ cells in the
center of the
tumor (CT), the density of CD3+ cells in the invasive margin (IM), and the
density of
CD8+ cells in the invasive margin (IM).
CA 03142293 2021-11-30
WO 2020/245155 PCT/EP2020/065289
2
The method may typically comprise a) quantifying at least two biological
markers which
are CD8 and CD3 in a tumor sample from the patient, and b) comparing the
values
obtained in a) to predetermined reference values, and c) increasing the
exposure of the
patient to the chemotherapeutic agent by increasing the dose, the duration of
treatment
and/or the frequency of administration, when the values obtained in a) are
superior to a
predetermined reference value.
In a preferred embodiment, step b) further comprises classifying the patient
in groups
(Low, Intermediate, or High Immunoscore (IS)) as follows:
Low IS corresponds to a mean percentile below 25%,
Intermediate IS corresponds to a mean percentile between 25% and 70%,
High IS corresponds to a mean percentile above 70%;
wherein the mean percentile refers to the mean percentile of the 4 individual
percentiles of
the 4 markers (CD3ct, CD8ct, CD3im, CD8im) corresponding to the density of CD3
cells
in CT and IM regions and the density of CD8 cells in CT and IM regions.
According to the invention, the clinical benefit of a prolonged period of
chemotherapy, e.g.
6 months of chemotherapy, becomes more important the higher the IS gets.
The methods of the invention are performed in vitro, preferably before the
patient is
administered with the chemotherapeutic agent.
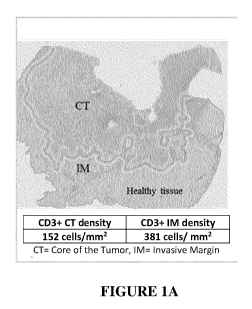
Legends to the Figures
Figure 1. Immunoscore calculation method. (A) Densities of CD3 and CD8 are
quantified in the center (CT) and invasive margin (IM) of the tumor (CD3ct,
CD8ct,
CD3im, CD8im) using dedicated Immunoscore Analyzer software. Densities are
reported
on the pre-defined Percentile scale and mean Percentiles of the 4 markers is
calculated to
define the Percentile Immunoscore (from 0 to 100). Example of CT and IM region
determined by the software are shown on the left. Example of IHC staining
(CD3) and
positive cell detection are shown on the right. On the example, the patient
has an
Intermediate Immunoscore (60%).
Figure 2. Prognostic value of the Immunoscore in Stage III cancer
patients(Kaplan
Meier estimates of DFS)(A) Among patients' groups stratified by IS into two
categories
(Low versus Int+High), the 3-year DFS rates were 66.80% [95%CI 62.23-70.95]
and
CA 03142293 2021-11-30
WO 2020/245155 PCT/EP2020/065289
3
77.14% [95%CI 73.50-80.35] for IS Low and IS Int+High, respectively (p =
0.0001) (B)
with IS in 3- categories, a 3-year DFS rate of 85% was observed in patients
with IS High,
vs 67% for patients with IS Low (p = 0.0001) NB: IS as continuous variable was
also
significantly associated with 3-year DFS (p<0.001). (C) The deleterious effect
of IS Low
in terms of DFS was higher in patients with T1-3 than in patients with T4
tumors
(p=0.0212).
Figure 3. Efficacy of 3 months versus 6 months of mFOLFOX6 therapy according
to
the Immunoscore0 status. (A) A beneficial effect of the 6 months- as compared
to 3
months- FOLFOX6 regimen was observed in patients with a CD8 CD3 (Int+High)
status
(all patients, see top graph). (B, C) This benefit was retained for these
patients in the low
risk tumors (T1-T3 and Ni) and in the high-risk tumors (T4 and/or N2 tumors)
(see top
graphs). By contrast, no significant benefit of the 6 months-FOLFOX6 regimen
was
observed for patients with a CD8 CD3 (Low) status, whether the patients were
high-risk or
low-risk (see bottom graphs). For said patients, moderate benefit of the 6
months-
FOLFOX6 regimen was observed in the first 3 years but canceled thereafter.
Detailed description of the invention
Cancers
Typically, the methods of the invention apply to various organs of cancer
origin (such as
breast, colon, rectum, lung, head and neck, bladder, ovary, prostate), and
also to various
cancer cell types (adenocarcinoma, squamous cell carcinoma, large cell cancer,
melanoma,
etc).
Typically the patient subjected to the above method may suffer from a solid
cancer
selected from the group consisting adrenal cortical cancer, anal cancer, bile
duct cancer
(e.g. periphilar cancer, distal bile duct cancer, intrahepatic bile duct
cancer), bladder
cancer, bone cancer (e.g. osteoblastoma, osteochrondroma, hemangioma,
chondromyxoid
fibroma, osteosarcoma, chondrosarcoma, fibrosarcoma, malignant fibrous
histiocytoma,
giant cell tumor of the bone, chordoma, multiple myeloma), brain and central
nervous
system cancer (e.g. meningioma, astocytoma, oligodendrogliomas, ependymoma,
gliomas,
medulloblastoma, ganglioglioma, Schwannoma, germinoma, craniopharyngioma),
breast
cancer (e.g. ductal carcinoma in situ, infiltrating ductal carcinoma,
infiltrating lobular
carcinoma, lobular carcinoma in situ, gynecomastia), cervical cancer,
colorectal cancer,
CA 03142293 2021-11-30
WO 2020/245155 PCT/EP2020/065289
4
endometrial cancer (e.g. endometrial adenocarcinoma, adenocanthoma, papillary
serous
adnocarcinoma, clear cell), esophagus cancer, gallbladder cancer (mucinous
adenocarcinoma, small cell carcinoma), gastrointestinal carcinoid tumors (e.g.
choriocarcinoma, chorioadenoma destruens), Kaposi's sarcoma, kidney cancer
(e.g. renal
cell cancer), laryngeal and hypopharyngeal cancer, liver cancer (e.g.
hemangioma, hepatic
adenoma, focal nodular hyperplasia, hepatocellular carcinoma), lung cancer
(e.g. small cell
lung cancer, non-small cell lung cancer), mesothelioma, plasmacytoma, nasal
cavity and
paranasal sinus cancer (e.g. esthesioneuroblastoma, midline granuloma),
nasopharyngeal
cancer, neuroblastoma, oral cavity and oropharyngeal cancer, ovarian cancer,
pancreatic
cancer, penile cancer, pituitary cancer, prostate cancer, retinoblastoma,
rhabdomyosarcoma
(e.g. embryonal rhabdomyosarcoma, alveolar rhabdomyosarcoma, pleomorphic
rhabdomyosarcoma), salivary gland cancer, skin cancer (e.g. melanoma,
nonmelanoma
skin cancer), stomach cancer, testicular cancer (e.g. seminoma, nonseminoma
germ cell
cancer), thymus cancer, thyroid cancer (e.g. follicular carcinoma, anaplastic
carcinoma,
poorly differentiated carcinoma, medullary thyroid carcinoma), vaginal cancer,
vulvar
cancer, and uterine cancer (e.g. uterine leiomyosarcoma).
In a preferred embodiment, the cancer is colorectal cancer.
Samples
As used herein, the term "tumor tissue sample" means any tissue tumor sample
derived
from the patient. Said tissue sample is obtained for the purpose of the in
vitro evaluation.
In some embodiments, the tumor sample may result from the tumor resected from
the
patient. In some embodiments, the tumor sample may result from a biopsy
performed in
the primary tumour of the patient or performed in metastatic sample distant
from the
primary tumor of the patient. For example an endoscopical biopsy performed in
the bowel
of the patient affected by a colorectal cancer. Typically the tumor tissue
sample is fixed in
formalin and embedded in a rigid fixative, such as paraffin (wax) or epoxy,
which is placed
in a mould and later hardened to produce a block which is readily cut. Thin
slices of
material can be then prepared using a microtome, placed on a glass slide and
submitted e.g.
to immunohistochemistry (using an IHC automate such as BenchMark XT, for
obtaining
stained slides). The tumour tissue sample can be used in microarrays, called
as tissue
microarrays (TMAs). TMA consists of paraffin blocks in which up to 1000
separate tissue
cores are assembled in array fashion to allow multiplex histological analysis.
This
CA 03142293 2021-11-30
WO 2020/245155 PCT/EP2020/065289
technology allows rapid visualization of molecular targets in tissue specimens
at a time,
either at the DNA, RNA or protein level. TMA technology is described in
W02004000992, US8068988, 01li et al 2001 Human Molecular Genetics, Tzankov et
al
2005, Elsevier; Kononen et al 1198; Nature Medicine.
5 In some embodiments, the tumor tissue sample encompasses (i) a global
primary tumor (as
a whole), (ii) a tissue sample from the center of the tumor, (iii) a tissue
sample from the
tissue directly surrounding the tumor which tissue may be more specifically
named the
"invasive margin" of the tumor, (iv) lymphoid islets in close proximity with
the tumor, (v)
the lymph nodes located at the closest proximity of the tumor, (vi) a tumor
tissue sample
collected prior surgery (for follow-up of patients after treatment for
example), and (vii) a
distant metastasis.
As used herein the "invasive margin" has its general meaning in the art and
refers to the
cellular environment surrounding the tumor. In some embodiments, the tumor
tissue
sample, irrespective of whether it is derived from the center of the tumor,
from the invasive
margin of the tumor, or from the closest lymph nodes, encompasses pieces or
slices of
tissue that have been removed from the tumor center of from the invasive
margin
surrounding the tumor, including following a surgical tumor resection or
following the
collection of a tissue sample for biopsy, for further quantification of one or
several
biological markers, notably through histology or immunohistochemistry methods,
through
flow cytometry methods and through methods of gene or protein expression
analysis,
including genomic and proteomic analysis. The tumor tissue sample can, of
course, be
subjected to a variety of well-known post-collection preparative and storage
techniques
(e.g., fixation, storage, freezing, etc.). The sample can be fresh, frozen,
fixed (e.g., formalin
fixed), or embedded (e.g., paraffin embedded). In some embodiments, when the
quantification of the number of tumor-draining lymph nodes is performed in the
ressected
tumor, the tumor tissue sample results from said ressected tumor and
encompasses the
center of the tumor, and optionally the invasive margin of the tumor. In said
embodiments,
the quantification of the marker of the immune adaptive response is typically
performed by
immunohistochemistry (IHC) a described after. In some embodiments, when the
quantification of the number of tumor-draining lymph nodes is performed is
determined by
imagery, the tumor tissue sample results from a biopsy. In said embodiments,
the
quantification of the marker of the immune adaptive response is typically
performed by
determining the expression level of at least one gene.
CA 03142293 2021-11-30
WO 2020/245155 PCT/EP2020/065289
6
Typically, the tumor sample may be selected from the group consisting of (i) a
global
primary tumor (as a whole), (ii) a tissue sample from the center of the tumor,
(iii) a tissue
sample from the tissue directly surrounding the tumor which tissue may be more
specifically named the "invasive margin" of the tumor, (iv) the lymph nodes
located at the
closest proximity of the tumor or a tertiary lymphoid structure induced by the
tumor, (v) a
tumor biopsie performed at any time and typically prior surgery, and (vi) a
distant
metastasis.
In a preferred embodiment the two or more biological markers are quantified in
the center
of the tumor and/or in the invasive margin of the tumor.
In a preferred embodiment the two or more biological markers are quantified in
the center
of the tumor and/or in the invasive margin of the tumor.
The sample can be fresh, frozen, fixed (e.g., formalin fixed), or embedded
(e.g., paraffin
embedded). In a particular embodiment the tumor sample results from biopsy
performed in
a tumor of the patient.
An example is an endoscopical biopsy performed in the bowel of the patient
suffering from
colorectal cancer or suspected to suffer from colorectal cancer.
Biological markers
According to the present invention, the methods comprise quantifying include
CD3 and
CD8 that are expressed by T cells or T cell subsets.
The expression of the CD3 antigen, or the expression of the mRNA thereof is
indicative of
the level of the adaptive immune response of the patient involving all T
lymphocytes and
NKT cells. The expression of the CD8 antigen, or the expression of the mRNA
thereof, is
indicative of the level of the adaptive immune response of the patient
involving cytotoxic T
lymphocytes.
The methods of the invention may further comprise quantifying at least another
biological
marker; however quantifying CD3 and CD8 only may be sufficient to achieve the
method
for determining, modulating or adjusting the treatment regimen according to
the invention.
As intended herein, a "biological marker" consists of any detectable,
measurable and
quantifiable parameter that is indicative of the status of the immune response
of the cancer
patient against the tumor.
CA 03142293 2021-11-30
WO 2020/245155 PCT/EP2020/065289
7
Biological markers include the presence of, or the number or density of, cells
from the
immune system at the tumor site.
Biological markers also include the presence of, or the amount of, proteins
specifically
produced by cells from the immune system at the tumor site.
Biological markers also include the presence of, or the amount of, any
biological material
that is indicative of the expression level of genes related to the raising of
a specific immune
response of the host, at the tumor site. Thus, biological markers include the
presence of, or
the amount of, messenger RNA (mRNA) transcribed from genomic DNA encoding
proteins which are specifically produced by cells from the immune system, at
the tumor
site.
Biological markers thus include surface antigens that are specifically
expressed by cells
from the immune system, including by B lymphocytes, T lymphocytes,
monocytes/macrophages dendritic cells, NK cells, NKT cells, and NK-DC cells,
that are
recruited within the tumor tissue or at its close proximity, including within
the invasive
margin of the tumor and in the closest lymph nodes, or alternatively mRNA
encoding for
said surface antigens.
Illustratively, proteins used as biological markers also include cytolytic
proteins
specifically produced by cells from the immune system, like perforin,
granulysin and also
granzyme-B.
Numerous patent applications have described a large number of biological
markers
indicative of the status of the immune response which could be used in the
methods of the
invention.
Typically, one can use the biological markers indicative of the status of the
immune
response described in W02015007625, W02014023706, W02014009535,
W02013186374, W02013107907, W02013107900, W02012095448, W02012072750
and W02007045996 (all incorporated by reference).
Typically a combination of 2, 3, 4, 5, 6, 7, 8, 9, 10, 11, 12, 13, 14, 15, 16,
17, 18, 19, 20,
21, 22, 23, 24, 25, 26, 27, 28, 29, 30, 31, 32, 33, 34, 35, 36, 37, 38, 39,
40, 41, 42, 43, 44,
45, 46, 47, 48, 49 and 50 distinct biological markers may be quantified,
preferably a
combination of 2, 3, 4, 5, 6, 7, 8, 9, or 10 biological markers and more
preferably a
combination of 2, 3, 4, 5, or 6, biological markers.
In a preferred embodiment, the biological markers indicative of the status of
the immune
response are those described in W02007045996.
CA 03142293 2021-11-30
WO 2020/245155 PCT/EP2020/065289
8
Typically, the biological markers which may be used are the cell density of
cells from the
immune system.
In a preferred embodiment the methods of the invention comprise quantifying
the density
of CD3+ cells and the density of CD8+ cells.
The methods may further comprise quantifying the density of CD45R0+ cells, the
density
of GZM-B+ cells and/or the density of CD45R0+ cells. The density of B-cells
may also be
measured (see W02013107900 and W02013107907). The density of DC cells may also
be
measured (see W02013107907).
In a preferred embodiment the density of cells from the immune system are
quantified in
the center of the tumor and/or in the invasive margin of the tumor.
In a preferred embodiment, the method of the present invention is performed by
in situ
immunohistochemical detection of protein markers of interest, in particular
when separate
quantifications of the said markers are performed both in the center of the
tumor (CT) and
in the invasive margin (IM).
In a preferred embodiment, the method of the present invention is performed by
in situ
immunohistochemical detection of protein markers of interest or mRNA gene
expression
of interest, either in the whole tumor or biopsy of the tumor, or in the
center of the tumor
(CT), or in the invasive margin (IM).
In a most preferred embodiment, the method comprises quantifying the density
of CD3+
cells in center of the tumor, the density of CD8+ cells in the center of the
tumor, the
density of CD3+ cells in the invasive margin, and the density of CD8+ cells in
the invasive
margin.
The density may be measured in the "cold spot", i.e., in the regions of the
tumor sample
where the density is the lowest, or in the 2, 3, 4, 5, 6, 7, 8, 9, 10 "cold
spots",
corresponding to the 2 to 10 area with the lowest densities.
The density may also be measured in the "hot spot", i.e., in the regions where
the density is
the highest, or in the 2, 3, 4, 5, 6, 7, 8, 9, 10 "hot spots", corresponding
to the 2 to 10 area
with the highest densities.
One can also determine the mean density on the whole tumor sample.
Typically, the method disclosed in W02013/186374 or W02017/194556 may be used
for
quantifying the immune cells in the tumor sample.
CA 03142293 2021-11-30
WO 2020/245155 PCT/EP2020/065289
9
As used herein, the term "marker" consists of any detectable, measurable or
quantifiable
parameter that is indicative of the status of the adaptive immune response of
the subject. In
some embodiments, the marker includes the presence of, or the number or
density of, cells
from the immune system. In some embodiments, the marker includes the presence
of, or
the amount of proteins specifically produced by cells from the immune system.
In some
embodiments, the marker includes the presence of, or the amount of, any
biological
material that is indicative of the level of genes related to the raising of a
specific immune
response of the host. Thus, in some embodiments, the marker includes the
presence of, or
the amount of, messenger RNA (mRNA) transcribed from genomic DNA encoding
proteins which are specifically produced by cells from the immune system. In
some
embodiments, the marker includes surface antigens that are specifically
expressed by cells
from the immune system, including by B lymphocytes, T lymphocytes,
monocytes/macrophages dendritic cells, NK cells, NKT cells, and NK-DC cells or
alternatively mRNA encoding for said surface antigens. When performing method
of the
.. present invention with more than one biological marker, the number of
distinct biological
markers that are quantified are usually of less than 100 distinct markers, and
in most
embodiments of less than 50 distinct markers, still preferably less than 20
distinct markers,
still preferably less than 15 distinct markers, still preferably less than 10
distinct markers.
The additional biological markers that may be quantified, for being indicative
of the status
of the immune response, comprise the proteins listed in Table 9 of
W02007045996 which
are: 18s, ACE, ACTB, AGTR1, AGTR2, APC, AP0A1, ARF1, AXIN1, BAX, BCL2,
BCL2L1, CXCR5, BMP2, BRCA1, BTLA, C3, CASP3, CASP9, CCL1, CCL11, CCL13,
CCL16, CCL17, CCL18, CCL19, CCL2, CCL20, CCL21, CCL22, CCL23, CCL24,
CCL25, CCL26, CCL27, CCL28, CCL3, CCL5, CCL7, CCL8, CCNB1, CCND1, CCNE1,
CCR1, CCR10, CCR2, CCR3, CCR4, CCR5, CCR6, CCR7, CCR8, CCR9, CCRL2,
CD154, CD19, CD1a, CD2, CD226, CD244, PDCD1LG1, CD28, CD34, CD36, CD38,
CD3E, CD3G, CD3Z, CD4, CD4OLG, CD5, CD54, CD6, CD68, CD69, CLIP, CD80,
CD83, SLAMF5, CD86, CD8A, CDH1, CDH7, CDK2, CDK4, CDKN1A, CDKN1B,
CDKN2A, CDKN2B, CEACAM1, COL4A5, CREBBP, CRLF2, CSF1, CSF2, CSF3,
.. CTLA4, CTNNB1, CT SC, CX3CL1, CX3 CR1, CXCL1, CXCL10, CXCL11, CXCL12,
CXCL13, CXCL14, CXCL16, CXCL2, CXCL3, CXCL5, CXCL6, CXCL9, CXCR3,
CXCR4, CXCR6, CYP1A2, CYP7A1, DCC, DCN, DEFA6, DICER1, DKK1, Dok-1,
Dok-2, DOK6, DVL1, E2F4, EBI3, ECE1, ECGF1, EDN1, EGF, EGFR, EIF4E, CD105,
CA 03142293 2021-11-30
WO 2020/245155 PCT/EP2020/065289
ENPEP, ERBB2, EREG, FCGR3A, CGR3B, FN1, FOXP3, FYN, FZD1, GAPD, GLI2,
GNLY, GOLPH4, GRB2, GSK3B, GSTP1, GUSB, GZMA, GZMB, GZMH, GZMK,
HLA-B, HLA-C, HLA-, MA, HLA-DMB, HLA-DOA, HLA-DOB, HLA-DPAL HLA-
DQA2, HLA-DRA, HLX1, HMOX1, HRAS, HSPB3, HUWEl, ICAM1, ICAM-2, ICOS,
5 ID1, ifnal, ifnal7, ifna2, ifna5, ifna6, ifna8, IFNAR1, IFNAR2, IFNG,
IFNGR1, IFNGR2,
IGF1, IHH, IKBKB, IL10, IL12A, IL12B, IL12RB1, IL12RB2, IL13, IL13RA2, IL15,
IL15RA, IL17, IL17R, IL17RB, IL18, IL1A, IL1B, IL1R1, IL2, IL21, IL21R, IL23A,
IL23R, IL24, IL27, IL2RA, IL2RB, IL2RG, IL3, IL31RA, IL4, IL4RA, IL5, IL6,
IL7,
IL7RA, IL8, CXCR1, CXCR2, IL9, IL9R, IRF1, ISGF3G, ITGA4, ITGA7, integrin
alpha
10 E (antigen CD103, human mucosal lymphocyte, antigen 1; alpha polypeptide),
Gene
hCG33203, ITGB3, JAK2, JAK3, KLRB1, KLRC4, KLRF1, KLRG1, KRAS, LAG3,
LAIR2, LEF1, LGALS9, LILRB3, LRP2, LTA, SLAMF3, MADCAM1, MADH3,
MADH7,MAF, MAP2K1, MDM2, MICA, MICB, MKI67, MMP12, M1VIP9, MTA1,
MTSS1, MYC, MYD88, MYH6, NCAM1, NFATC1, NKG7, NLK, NOS2A, P2X7,
PDCD1, PECAM-, CXCL4, PGK1, PIAS1, PIAS2, PIAS3, PIAS4, PLAT, PML, PP1A,
CXCL7, PPP2CA, PRF1, PROM1, PSMB5, PTCH, PTGS2, PTP4A3, PTPN6, PTPRC,
RAB23, RAC/RHO, RAC2, RAF, RBI, RBL1, REN, Drosha, SELE, SELL, SELP,
SERPINEL SFRP1, SIRP beta 1, SKI, SLAMF1, SLAMF6, SLAMF7, SLAMF8,
SMAD2, SMAD4, SMO, SMOH, SMURF1, SOCS1, 50052, 50053, 50054, SOCS5,
50056, 50057, SOD1, 50D2, 50D3, SOS1, 50X17, CD43, 5T14, STAM, STAT1,
STAT2, STAT3, STAT4, STAT5A, STAT5B, STAT6, 5TK36, TAP1, TAP2, TBX21,
TCF7, TERT, TFRC, TGFA, TGFB1, TGFBR1, TGFBR2, TIM-3, TLR1, TLR10, TLR2,
TLR3, TLR4, TLR5, TLR6, TLR7, TLR8, TLR9, TNF, TNFRSF10A, TNFRSF11A,
TNFRSF18, TNFRSF1A, TNFRSF1B, OX-40, TNFRSF5, TNFRSF6, TNFRSF7,
TNFRSF8, TNFRSF9, TNFSF10, TNFSF6, TOB1, TP53, TSLP, VCAM1, VEGF, WIF1,
WNT1, WNT4, XCL1, XCR1, ZAP70 and ZIC2.
In the present specification, the name of each of the genes of interest refers
to the
internationally recognized name of the corresponding gene, as found in
internationally
recognized gene sequences and protein sequences databases, including the
database from
the HUGO Gene Nomenclature Committee. In the present specification, the name
of each
of the genes of interest may also refer to the internationally recognized name
of the
corresponding gene, as found in the internationally recognized gene sequences
database
CA 03142293 2021-11-30
WO 2020/245155 PCT/EP2020/065289
11
Genbank. Through these internationally recognized sequence databases, the
nucleic acid to
each of the gene of interest described herein may be retrieved by one skilled
in the art.
In a preferred embodiment, additional biological markers indicative of the
status of the
immune response include genes or proteins representative of the adaptive
immune
response, or genes or proteins representative of the immunosuppressive
response.
As used herein the expression "gene representative of the adaptive immune
response"
refers to any gene that is expressed by a cell that is an actor of the
adaptive immune
response in the tumor or that contributes to the settlement of the adaptive
immune response
in the tumor. The adaptive immune response, also called "acquired immune
response",
comprises antigen-dependent stimulation of T cell subtypes, B cell activation
and antibody
production. For example cells of the adaptive immune response include but are
not limited
to cytotoxic T cells, T memory T cells, Thl and Th2 cells, activated
macrophages and
activated dendritic cells, NK cells and NKT cells. Accordingly, a gene
representative of the
adaptive immune response may be typically selected from the cluster of the co-
modulated
genes for the Thl adaptive immunity, for the cytotoxic response, or for the
memory
response, and may encode for a Thl cell surface marker, an interleukin (or an
interleukin
receptor), or a chemokine or (a chemokine receptor).
In a particular embodiment, the gene representative of the adaptive immune
response is
selected from the group consisting of
- the family of chemokines and chemokine receptors consisting of: CXCL13,
CXCL9, CCL5, CCR2, CXCL10, CXCL11, CXCR3, CCL2 and CX3CL1,
- the family of cytokines consisting of: IL15,
- the TH1 family consisting of: IFNG, IRF1, STAT1, STAT4 and TBX21
- the family of lymphocytes membrane receptors consisting of: ITGAE, CD3D,
CD3E, CD3G, CD8A, CD247, CD69 and ICOS,
- the family of cytotoxic molecules consisting of: GNLY, GZMH, GZMA, GZMB,
GZMK, GZMIM and PRF1,
and the kinase LTK.
Preferred such genes, or corresponding proteins thereof, are disclosed below:
CCL5, CCR2, CD247, CD3E, CD3G, CD8A, CX3CL1, CXCL11, GZMA, GZMB,
GZMH, GZMK, IFNG, IL15, IRF1, ITGAE, PRF1, STAT1, TBX21.
As used herein the expression "gene representative of the immunosuppressive
response"
refers to any gene that is expressed by a cell that is an actor of the
immunosuppressive
CA 03142293 2021-11-30
WO 2020/245155 PCT/EP2020/065289
12
response in the tumor or that contributes to the settlement of the
immunosuppressive
response in the tumor. For example, the immunosuppressive response comprises
- co-inhibition of antigen-dependent stimulation of T cell subtypes: genes
CD276,
CTLA4, PDCD1, CD274, TIM-3 or VTCN1 (B7H4),
- inactivation of macrophages and dendritic cells and inactivation of NK
cells:
genes TSLP, CD1A, or VEGFA
- expression of cancer stem cell marker, differentiation and/or
oncogenesis:
PROM1, IHH.
- expression of immunosuppressive proteins produced in the tumour
environment:
genes PF4, REN, VEGFA.
For example cells of the immunosuppressive response include immature dendritic
cells
(CD1A), regulatory T cells (Treg cells) and Th17 cells expressing IL17A gene.
Accordingly, a gene representative of the adaptive immune response may be
typically
selected from the group of the co-modulated adaptive immune genes, whereas the
immunosuppressive genes, may be representative of the inactivation of immune
cells (e.g.
dendritic cells) and may contribute to induction of an immunosuppressive
response.
Genes or corresponding proteins representative of the immunosuppressive
response are
disclosed below:
CD274, CTLA4, IHH, IL17A, PDCD1, PF4, PROM1, REN, TIM-3, TSLP or VEGFA.
In a preferred embodiment, a gene representative of the adaptive immune
response is
selected from the group consisting of GNLY, CXCL13, CX3CL1, CXCL9, ITGAE,
CCL5,
GZMH, IFNG, CCR2, CD3D, CD3E, CD3G, CD8A, CXCL10, CXCL11, GZMA, GZMB,
GZMK, GZMM, IL15, IRF1, LTK, PRF1, STAT1, CD69, CD247, ICOS, CXCR3,
STAT4, CCL2 and TBX21 and a gene representative of the immunosuppressive
response
is selected from the group consisting of PF4, REN, VEGFA, TSLP, IL17A, PROM1,
IHH,
CD1A, CTLA4, PDCD1, CD276, CD274, TIM-3 and VTCN1 (B7H4).
Because some genes are more frequently found significant when combining one
adaptive
gene and one immunosuppressive gene, the most preferred genes are:
- genes representative of the adaptive immune response: CD3G, CD8A, CCR2
and
GZMA,
- genes representative of the immunosuppressive response: REN, IL17A, CTLA4
and PDCD1.
CA 03142293 2021-11-30
WO 2020/245155 PCT/EP2020/065289
13
The biological markers indicative of the status of the immune response may
comprise the
expression level of one or more genes from the group consisting of CCR2, CD3D,
CD3E,
CD3G, CD8A, CXCL10, CXCL11, GZMA, GZMB, GZMK, GZMM, IL15, IRF1, PRF1,
STAT1, CD69, ICOS, CXCR3, STAT4, CCL2, and TBX21;
or GZMEI, IFNG, CXCL13, GNLY, LAG3, ITGAE, CCL5, CXCL9, PF4, IL17A, TSLP,
REN, IHH, PROM1 and VEGFA.
The methods of the invention may also comprise quantifying the expression
level of a
miRNA cluster comprising: miR.609, miR.518c, miR.520f, miR.220a, miR.362,
miR.29a,
miR.660, miR.603, miR.558, miR519b, miR.494, miR.130a, or miR.639, as
described in
W02012072750.
General methods for quantifying biological markers
Any one of the methods known by the one skilled in the art for quantifying
cellular types, a
protein-type or a nucleic acid-type biological marker encompassed herein may
be used for
performing the cancer prognosis method of the invention. Thus any one of the
standard and
non-standard (emerging) techniques well known in the art for detecting and
quantifying a
protein or a nucleic acid in a sample can readily be applied.
Expression of a biological marker as described herein may be assessed by any
of a wide
variety of well known methods for detecting expression of a transcribed
nucleic acid or
protein. Non-limiting examples of such methods include immunological methods
for
detection of secreted, cell-surface, cytoplasmic, or nuclear proteins, protein
purification
methods, protein function or activity assays, nucleic acid hybridization
methods, nucleic
acid reverse transcription methods, and nucleic acid amplification methods.
In one preferred embodiment, expression of a marker is assessed using an
antibody (e.g. a
radio-labeled, chromophore-labeled, fluorophore-labeled, polymer-backbone-
antibody, or
enzyme-labeled antibody), an antibody derivative (e.g. an antibody conjugated
with a
substrate or with the protein or ligand of a protein-ligand pair {e.g. biotin-
streptavidin}), or
an antibody fragment (e.g. a single-chain antibody, an isolated antibody
hypervariable
domain, etc.) which binds specifically with a marker protein or fragment
thereof, including
a marker protein which has undergone all or a portion of its normal post-
translational
modification.
In certain embodiments, a biological marker, or a set of biological markers,
may be
quantified with any one of the immunohistochemistry methods known in the art.
CA 03142293 2021-11-30
WO 2020/245155 PCT/EP2020/065289
14
Typically, for further analysis, one thin section of the tumor, is firstly
incubated with
labeled antibodies directed against one biological marker of interest. After
washing, the
labeled antibodies that are bound to said biological marker of interest are
revealed by the
appropriate technique, depending of the kind of label is borne by the labeled
antibody, e.g.
radioactive, fluorescent or enzyme label. Multiple labelling can be performed
simultaneously.
Immunohistochemistry typically includes the following steps i) fixing the
tumor tissue
sample with formalin, ii) embedding said tumor tissue sample in paraffin, iii)
cutting said
tumor tissue sample into sections for staining, iv) incubating said sections
with the binding
partner specific for the immune checkpoint protein of interest, v) rinsing
said sections, vi)
incubating said section with a secondary antibody typically biotinylated and
vii) revealing
the antigen-antibody complex typically with avidin-biotin-peroxidase complex.
Accordingly, the tumor tissue sample is firstly incubated with the binding
partners having
for the immune checkpoint protein of interest. After washing, the labeled
antibodies that
are bound to the immune checkpoint protein of interest are revealed by the
appropriate
technique, depending of the kind of label is borne by the labeled antibody,
e.g. radioactive,
fluorescent or enzyme label. Multiple labelling can be performed
simultaneously.
Alternatively, the method of the present invention may use a secondary
antibody coupled
to an amplification system (to intensify staining signal) and enzymatic
molecules. Such
coupled secondary antibodies are commercially available, e.g. from Dako,
EnVision
system. Counterstaining may be used, e.g. Hematoxylin & Eosin, DAPI, Hoechst.
Other
staining methods may be accomplished using any suitable method or system as
would be
apparent to one of skill in the art, including automated, semi-automated or
manual systems.
For example, one or more labels can be attached to the antibody, thereby
permitting
detection of the target protein (i.e. the biological markers). Exemplary
labels include
radioactive isotopes, fluorophores, ligands, chemiluminescent agents, enzymes,
and
combinations thereof. Non-limiting examples of labels that can be conjugated
to primary
and/or secondary affinity ligands include fluorescent dyes or metals (e.g.
fluorescein,
rhodamine, phycoerythrin, fluorescamine), chromophoric dyes (e.g. rhodopsin),
chemiluminescent compounds (e.g. luminal, imidazole) and bioluminescent
proteins (e.g.
luciferin, luciferase), haptens (e.g. biotin). A variety of other useful
fluorescers and
CA 03142293 2021-11-30
WO 2020/245155 PCT/EP2020/065289
chromophores are described in Stryer L (1968) Science 162:526-533 and Brand L
and
Gohlke J R (1972) Annu. Rev. Biochem. 41:843-868. Affinity ligands can also be
labeled
with enzymes (e.g. horseradish peroxidase, alkaline phosphatase, beta-
lactamase),
radioisotopes (e.g. 3H, 14C, 32P, 35S or 1251) and particles (e.g. gold). The
different types
5 of labels can be conjugated to an affinity ligand using various
chemistries, e.g. the amine
reaction or the thiol reaction. However, other reactive groups than amines and
thiols can be
used, e.g. aldehydes, carboxylic acids and glutamine. Various enzymatic
staining methods
are known in the art for detecting a protein of interest. For example,
enzymatic interactions
can be visualized using different enzymes such as peroxidase, alkaline
phosphatase, or
10 different chromogens such as DAB, AEC or Fast Red. In some embodiments,
the label is a
quantum dot. For example, Quantum dots (Qdots) are becoming increasingly
useful in a
growing list of applications including immunohistochemistry, flow cytometry,
and plate-
based assays, and may therefore be used in conjunction with this invention.
Qdot
nanocrystals have unique optical properties including an extremely bright
signal for
15 sensitivity and quantitation; high photostability for imaging and
analysis. A single
excitation source is needed, and a growing range of conjugates makes them
useful in a
wide range of cell-based applications. Qdot Bioconjugates are characterized by
quantum
yields comparable to the brightest traditional dyes available. Additionally,
these quantum
dot-based fluorophores absorb 10-1000 times more light than traditional dyes.
The
emission from the underlying Qdot quantum dots is narrow and symmetric which
means
overlap with other colors is minimized, resulting in minimal bleed through
into adjacent
detection channels and attenuated crosstalk, in spite of the fact that many
more colors can
be used simultaneously. In other examples, the antibody can be conjugated to
peptides or
proteins that can be detected via a labeled binding partner or antibody. In an
indirect IHC
assay, a secondary antibody or second binding partner is necessary to detect
the binding of
the first binding partner, as it is not labeled.
In some embodiments, the resulting stained specimens are each imaged using a
system for
viewing the detectable signal and acquiring an image, such as a digital image
of the
staining. Methods for image acquisition are well known to one of skill in the
art. For
example, once the sample has been stained, any optical or non-optical imaging
device can
be used to detect the stain or biomarker label, such as, for example, upright
or inverted
optical microscopes, scanning confocal microscopes, cameras, scanning or
tunneling
CA 03142293 2021-11-30
WO 2020/245155 PCT/EP2020/065289
16
electron microscopes, canning probe microscopes and imaging infrared
detectors. In some
examples, the image can be captured digitally. The obtained images can then be
used for
quantitatively or semi-quantitatively determining the amount of the immune
checkpoint
protein in the sample, or the absolute number of cells positive for the maker
of interest, or
the surface of cells positive for the maker of interest. Various automated
sample
processing, scanning and analysis systems suitable for use with IHC are
available in the
art. Such systems can include automated staining and microscopic scanning,
computerized
image analysis, serial section comparison (to control for variation in the
orientation and
size of a sample), digital report generation, and archiving and tracking of
samples (such as
slides on which tissue sections are placed). Cellular imaging systems are
commercially
available that combine conventional light microscopes with digital image
processing
systems to perform quantitative analysis on cells and tissues, including
immunostained
samples. See, e.g., the CAS-200 system (Becton, Dickinson & Co.). In
particular, detection
can be made manually or by image processing techniques involving computer
processors
and software. Using such software, for example, the images can be configured,
calibrated,
standardized and/or validated based on factors including, for example, stain
quality or stain
intensity, using procedures known to one of skill in the art (see e.g.,
published U.S. Patent
Publication No. U520100136549). The image can be quantitatively or semi-
quantitatively
analyzed and scored based on staining intensity of the sample. Quantitative or
semi-
quantitative histochemistry refers to method of scanning and scoring samples
that have
undergone histochemistry, to identify and quantify the presence of the
specified biomarker
(i.e. immune checkpoint protein). Quantitative or semi-quantitative methods
can employ
imaging software to detect staining densities or amount of staining or methods
of detecting
staining by the human eye, where a trained operator ranks results numerically.
For
example, images can be quantitatively analyzed using a pixel count algorithms
and tissue
recognition pattern (e.g. Aperio Spectrum Software, Automated QUantitatative
Analysis
platform (AQUA platform), or Tribvn with Ilastic and Calopix software), and
other
standard methods that measure or quantitate or semi-quantitate the degree of
staining; see
e.g., U.S. Pat. No. 8,023,714; U.S. Pat. No. 7,257,268; U.S. Pat. No.
7,219,016; U.S. Pat.
No. 7,646,905; published U.S. Patent Publication No. U520100136549 and
20110111435;
Camp et al. (2002) Nature Medicine, 8:1323-1327; Bacus et al. (1997) Analyt
Quant Cytol
Histol, 19:316-328). A ratio of strong positive stain (such as brown stain) to
the sum of
total stained area can be calculated and scored. The amount of the detected
biomarker (i.e.
CA 03142293 2021-11-30
WO 2020/245155 PCT/EP2020/065289
17
the immune checkpoint protein) is quantified and given as a percentage of
positive pixels
and/or a score. For example, the amount can be quantified as a percentage of
positive
pixels. In some examples, the amount is quantified as the percentage of area
stained, e.g.,
the percentage of positive pixels. For example, a sample can have at least or
about at least
or about 0, 1%, 2%, 3%, 4%, 5%, 6%, 7%, 8%, 9%, 10%, 11%, 12%, 13%, 14%, 15%,
16%, 17%, 18%, 19%, 20%, 21%, 22%, 23%, 24%, 25%, 26%, 27%, 28%, 29%, 30%,
31%, 32%, 33%, 34%, 35%, 40%, 45%, 50%, 55%, 60%, 65%, 70%, 75%, 80%, 85%,
90%, 95% or more positive pixels as compared to the total staining area. For
example, the
amount can be quantified as an absolute number of cells positive for the maker
of interest.
In some embodiments, a score is given to the sample that is a numerical
representation of
the intensity or amount of the histochemical staining of the sample, and
represents the
amount of target biomarker (e.g., the immune checkpoint protein) present in
the sample.
Optical density or percentage area values can be given a scaled score, for
example on an
integer scale.
Thus, in some embodiments, the method of the present invention comprises the
steps
consisting in i) providing one or more immunostained slices of tissue section
obtained by
an automated slide-staining system by using a binding partner capable of
selectively
interacting with the biological marker, ii) proceeding to digitalisation of
the slides of step i)
by high resolution scan capture, iii) detecting the slice of tissue section on
the digital
picture iv) providing a size reference grid with uniformly distributed units
having a same
surface, said grid being adapted to the size of the tissue section to be
analysed, and v)
detecting, quantifying and measuring intensity or the absolute number of
stained cells in
each unit.
Multiplex tissue analysis techniques are particularly useful for quantifying
several immune
checkpoint proteins in the tumor tissue sample. Such techniques should permit
at least five,
or at least ten or more biomarkers to be measured from a single tumor tissue
sample.
Furthermore, it is advantageous for the technique to preserve the localization
of the
biomarker and be capable of distinguishing the presence of biomarkers in
cancerous and
non-cancerous cells. Such methods include layered immunohistochemistry (L-
IHC),
layered expression scanning (LES) or multiplex tissue immunoblotting (MTI)
taught, for
example, in U.S. Pat. Nos. 6,602,661, 6,969,615, 7,214,477 and 7,838,222; U.S.
Publ. No.
2011/0306514 (incorporated herein by reference); and in Chung & Hewitt, Meth
Mol Biol,
CA 03142293 2021-11-30
WO 2020/245155 PCT/EP2020/065289
18
Prot Blotting Detect, Kurlen & Scofield, eds. 536: 139-148, 2009, each
reference teaches
making up to 8, up to 9, up to 10, up to 11 or more images of a tissue section
on layered
and blotted membranes, papers, filters and the like, can be used. Coated
membranes useful
for conducting the L-IHC/MTI process are available from 20/20 GeneSystems,
Inc.
(Rockville, MD).
In some embodiments, the L-IHC method can be performed on any of a variety of
tissue
samples, whether fresh or preserved. The samples included core needle biopsies
that were
routinely fixed in 10% normal buffered formalin and processed in the pathology
department. Standard five [tm thick tissue sections were cut from the tissue
blocks onto
charged slides that were used for L-IHC. Thus, L-IHC enables testing of
multiple markers
in a tissue section by obtaining copies of molecules transferred from the
tissue section to
plural bioaffinity- coated membranes to essentially produce copies of tissue
"images." In
the case of a paraffin section, the tissue section is deparaffinized as known
in the art, for
example, exposing the section to xylene or a xylene substitute such as NEO-
CLEAR , and
graded ethanol solutions. The section can be treated with a proteinase, such
as, papain,
trypsin, proteinase K and the like. Then, a stack of a membrane substrate
comprising, for
example, plural sheets of a 10 [tm thick coated polymer backbone with 0.4 [tm
diameter
pores to channel tissue molecules, such as, proteins, through the stack, then
is placed on
the tissue section. The movement of fluid and tissue molecules is configured
to be
essentially perpendicular to the membrane surface. The sandwich of the
section,
membranes, spacer papers, absorbent papers, weight and so on can be exposed to
heat to
facilitate movement of molecules from the tissue into the membrane stack. A
portion of the
proteins of the tissue are captured on each of the bioaffinity-coated
membranes of the stack
(available from 20/20 GeneSystems, Inc., Rockville, MD). Thus, each membrane
comprises a copy of the tissue and can be probed for a different biomarker
using standard
immunoblotting techniques, which enables open-ended expansion of a marker
profile as
performed on a single tissue section. As the amount of protein can be lower on
membranes
more distal in the stack from the tissue, which can arise, for example, on
different amounts
of molecules in the tissue sample, different mobility of molecules released
from the tissue
sample, different binding affinity of the molecules to the membranes, length
of transfer and
so on, normalization of values, running controls, assessing transferred levels
of tissue
molecules and the like can be included in the procedure to correct for changes
that occur
within, between and among membranes and to enable a direct comparison of
information
CA 03142293 2021-11-30
WO 2020/245155 PCT/EP2020/065289
19
within, between and among membranes. Hence, total protein can be determined
per
membrane using, for example, any means for quantifying protein, such as,
biotinylating
available molecules, such as, proteins, using a standard reagent and method,
and then
revealing the bound biotin by exposing the membrane to a labeled avidin or
streptavidin; a
protein stain, such as, Blot fastStain, Ponceau Red, brilliant blue stains and
so on, as
known in the art.
In some embodiments, the present methods utilize Multiplex Tissue Imprinting
(MTI)
technology for measuring biomarkers, wherein the method conserves precious
biopsy
tissue by allowing multiple biomarkers, in some cases at least six biomarkers.
In some embodiments, alternative multiplex tissue analysis systems exist that
may also be
employed as part of the present invention. One such technique is the mass
spectrometry-
based Selected Reaction Monitoring (SRM) assay system ("Liquid Tissue"
available from
OncoPlexDx (Rockville, MD)). That technique is described in U.S. Pat. No.
7,473,532.
In some embodiments, the method of the present invention utilized the
multiplex IHC
technique developed by GE Global Research (Niskayuna, NY). That technique is
described
in U.S. Pub. Nos. 2008/0118916 and 2008/0118934. There, sequential analysis is
performed on biological samples containing multiple targets including the
steps of binding
a fluorescent probe to the sample followed by signal detection, then
inactivation of the
probe followed by binding probe to another target, detection and inactivation,
and
continuing this process until all targets have been detected.
In some embodiments, multiplex tissue imaging can be performed when using
fluorescence
(e.g. fluorophore or Quantum dots) where the signal can be measured with a
multispectral
imagine system. Multispectral imaging is a technique in which spectroscopic
information
at each pixel of an image is gathered and the resulting data analyzed with
spectral image -
processing software. For example, the system can take a series of images at
different
wavelengths that are electronically and continuously selectable and then
utilized with an
analysis program designed for handling such data. The system can thus be able
to obtain
quantitative information from multiple dyes simultaneously, even when the
spectra of the
dyes are highly overlapping or when they are co-localized, or occurring at the
same point
in the sample, provided that the spectral curves are different. Many
biological materials
auto fluoresce, or emit lower- energy light when excited by higher-energy
light. This signal
can result in lower contrast images and data. High-sensitivity cameras without
multispectral imaging capability only increase the autofluorescence signal
along with the
CA 03142293 2021-11-30
WO 2020/245155 PCT/EP2020/065289
fluorescence signal. Multispectral imaging can unmix, or separate out,
autofluorescence
from tissue and, thereby, increase the achievable signal-to-noise ratio.
Briefly the
quantification can be performed by following steps: i) providing a tumor
tissue microarray
(TMA) obtained from the patient, ii) TMA samples are then stained with anti-
antibodies
5 having specificity of the immune checkpoint protein(s) of interest, iii)
the TMA slide is
further stained with an epithelial cell marker to assist in automated
segmentation of tumour
and stroma, iv) the TMA slide is then scanned using a multispectral imaging
system, v) the
scanned images are processed using an automated image analysis software
(e.g.Perkin
Elmer Technology) which allows the detection, quantification and segmentation
of specific
10 tissues through powerful pattern recognition algorithms. The machine-
learning algorithm
was typically previously trained to segment tumor from stroma and identify
cells labelled.
Determining an expression level of a gene in a tumor sample obtained from a
patient can
be implemented by a panel of techniques well known in the art.
15 Typically, an expression level of a gene is assessed by determining the
quantity of mRNA
produced by this gene.
Methods for determining a quantity of mRNA are well known in the art. For
example
nucleic acid contained in the samples (e.g., cell or tissue prepared from the
patient) is first
extracted according to standard methods, for example using lytic enzymes or
chemical
20 solutions or extracted by nucleic-acid-binding resins following the
manufacturer's
instructions. The thus extracted mRNA is then detected by hybridization (e.
g., Northern
blot analysis) and/or amplification (e.g., RT-PCR). Preferably quantitative or
semi-
quantitative RT-PCR is preferred. Real-time quantitative or semi-quantitative
RT-PCR is
particularly advantageous.
Other methods of Amplification include ligase chain reaction (LCR),
transcription-
mediated amplification (TMA), strand displacement amplification (SDA) and
nucleic acid
sequence based amplification (NASBA), quantitative new generation sequencing
of RNA
(NGS).
Nucleic acids (s) comprising at least 10 nucleotides and exhibiting sequence
complementarity or homology to the mRNA of interest herein find utility as
hybridization
probes or amplification primers. It is understood that such nucleic acids need
not be
completely identical, but are typically at least about 80% identical to the
homologous
region of comparable size, more preferably 85% identical and even more
preferably 90-
CA 03142293 2021-11-30
WO 2020/245155 PCT/EP2020/065289
21
95% identical. In certain embodiments, it will be advantageous to use nucleic
acids in
combination with appropriate means, such as a detectable label, for detecting
hybridization. A wide variety of appropriate indicators are known in the art
including,
fluorescent, radioactive, enzymatic or other ligands (e. g. avidin/biotin).
Probes typically comprise single-stranded nucleic acids of between 10 to 1000
nucleotides
in length, for instance of between 10 and 800, more preferably of between 15
and 700,
typically of between 20 and 500 nucleotides. Primers typically are shorter
single-stranded
nucleic acids, of between 10 to 25 nucleotides in length, designed to
perfectly or almost
perfectly match a nucleic acid of interest, to be amplified. The probes and
primers are
"specific" to the nucleic acids they hybridize to, i.e. they preferably
hybridize under high
stringency hybridization conditions (corresponding to the highest melting
temperature Tm,
e.g., 50% formamide, 5x or 6x SCC. SCC is a 0.15 M NaC1, 0.015 M Na-citrate).
Nucleic acids which may be used as primers or probes in the above
amplification and
detection method may be assembled as a kit. Such a kit includes consensus
primers and
molecular probes. A preferred kit also includes the components necessary to
determine if
amplification has occurred. A kit may also include, for example, PCR buffers
and
enzymes; positive control sequences, reaction control primers; and
instructions for
amplifying and detecting the specific sequences.
In a particular embodiment, the expression of a biological marker as described
herein may
be assessed by tagging the biomarker (in its DNA, RNA or protein for) with a
digital
oligonucleotide barcode, and to measure or count the number of barcodes.
In a particular embodiment, the methods of the invention comprise the steps of
providing
total RNAs extracted from cumulus cells and subjecting the RNAs to
amplification and
hybridization to specific probes, more particularly by means of a quantitative
or semi-
quantitative RT-PCR.
Probes made using the disclosed methods can be used for nucleic acid
detection, such as in
situ hybridization (ISH) procedures (for example, fluorescence in situ
hybridization
(FISH), chromogenic in situ hybridization (CISH) and silver in situ
hybridization (SISH))
or comparative genomic hybridization (CGH).
In situ hybridization (ISH) involves contacting a sample containing target
nucleic acid
sequence (e.g., genomic target nucleic acid sequence) in the context of a
metaphase or
interphase chromosome preparation (such as a cell or tissue sample mounted on
a slide)
with a labeled probe specifically hybridizable or specific for the target
nucleic acid
CA 03142293 2021-11-30
WO 2020/245155 PCT/EP2020/065289
22
sequence (e.g., genomic target nucleic acid sequence). The slides are
optionally pretreated,
e.g., to remove paraffin or other materials that can interfere with uniform
hybridization.
The sample and the probe are both treated, for example by heating to denature
the double
stranded nucleic acids. The probe (formulated in a suitable hybridization
buffer) and the
sample are combined, under conditions and for sufficient time to permit
hybridization to
occur (typically to reach equilibrium). The chromosome preparation is washed
to remove
excess probe, and detection of specific labeling of the chromosome target is
performed
using standard techniques.
For example, a biotinylated probe can be detected using fluorescein-labeled
avidin or
avidin-alkaline phosphatase. For fluorochrome detection, the fluorochrome can
be detected
directly, or the samples can be incubated, for example, with fluorescein
isothiocyanate
(FITC)-conjugated avidin. Amplification of the FITC signal can be conducted,
if
necessary, by incubation with biotin-conjugated goat antiavidin antibodies,
washing and a
second incubation with FITC-conjugated avidin. For detection by enzyme
activity, samples
.. can be incubated, for example, with streptavidin, washed, incubated with
biotin-conjugated
alkaline phosphatase, washed again and pre-equilibrated (e.g., in alkaline
phosphatase (AP)
buffer). For a general description of in situ hybridization procedures, see,
e.g., U.S. Pat.
No. 4,888,278.
Numerous procedures for FISH, CISH, and SISH are known in the art. For
example,
.. procedures for performing FISH are described in U.S. Pat. Nos. 5,447,841;
5,472,842; and
5,427,932; and for example, in Pinkel et al., Proc. Natl. Acad. Sci. 83:2934-
2938, 1986;
Pinkel et al., Proc. Natl. Acad. Sci. 85:9138-9142, 1988; and Lichter et al.,
Proc. Natl.
Acad. Sci. 85:9664-9668, 1988. CISH is described in, e.g., Tanner et al., Am.
J. Pathol.
157:1467-1472, 2000 and U.S. Pat. No. 6,942,970. Additional detection methods
are
provided in U.S. Pat. No. 6,280,929.
Numerous reagents and detection schemes can be employed in conjunction with
FISH,
CISH, and SISH procedures to improve sensitivity, resolution, or other
desirable
properties. As discussed above probes labeled with fluorophores (including
fluorescent
dyes and QUANTUM DOTS ) can be directly optically detected when performing
FISH.
Alternatively, the probe can be labeled with a nonfluorescent molecule, such
as a hapten
(such as the following non-limiting examples: biotin, digoxigenin, DNP, and
various
oxazoles, pyrrazoles, thiazoles, nitroaryls, benzofurazans, triterpenes,
ureas, thioureas,
rotenones, coumarin, courmarin-based compounds, Podophyllotoxin,
Podophyllotoxin-
CA 03142293 2021-11-30
WO 2020/245155 PCT/EP2020/065289
23
based compounds, and combinations thereof), ligand or other indirectly
detectable moiety.
Probes labeled with such non-fluorescent molecules (and the target nucleic
acid sequences
to which they bind) can then be detected by contacting the sample (e.g., the
cell or tissue
sample to which the probe is bound) with a labeled detection reagent, such as
an antibody
.. (or receptor, or other specific binding partner) specific for the chosen
hapten or ligand. The
detection reagent can be labeled with a fluorophore (e.g., QUANTUM DOT ) or
with
another indirectly detectable moiety, or can be contacted with one or more
additional
specific binding agents (e.g., secondary or specific antibodies), which can be
labeled with a
fluorophore.
.. In other examples, the probe, or specific binding agent (such as an
antibody, e.g., a primary
antibody, receptor or other binding agent) is labeled with an enzyme that is
capable of
converting a fluorogenic or chromogenic composition into a detectable
fluorescent, colored
or otherwise detectable signal (e.g., as in deposition of detectable metal
particles in SISH).
As indicated above, the enzyme can be attached directly or indirectly via a
linker to the
.. relevant probe or detection reagent. Examples of suitable reagents (e.g.,
binding reagents)
and chemistries (e.g., linker and attachment chemistries) are described in
U.S. Patent
Application Publications Nos. 2006/0246524; 2006/0246523, and 2007/0117153.
It will be appreciated by those of skill in the art that by appropriately
selecting labelled
probe-specific binding agent pairs, multiplex detection schemes can be
produced to
facilitate detection of multiple target nucleic acid sequences (e.g., genomic
target nucleic
acid sequences) in a single assay (e.g., on a single cell or tissue sample or
on more than
one cell or tissue sample). For example, a first probe that corresponds to a
first target
sequence can be labelled with a first hapten, such as biotin, while a second
probe that
corresponds to a second target sequence can be labelled with a second hapten,
such as
DNP. Following exposure of the sample to the probes, the bound probes can be
detected by
contacting the sample with a first specific binding agent (in this case avidin
labelled with a
first fluorophore, for example, a first spectrally distinct QUANTUM DOT ,
e.g., that
emits at 585 mn) and a second specific binding agent (in this case an anti-DNP
antibody,
or antibody fragment, labelled with a second fluorophore (for example, a
second spectrally
distinct QUANTUM DOT , e.g., that emits at 705 mn). Additional probes/binding
agent
pairs can be added to the multiplex detection scheme using other spectrally
distinct
fluorophores. Numerous variations of direct, and indirect (one step, two step
or more) can
be envisioned, all of which are suitable in the context of the disclosed
probes and assays.
CA 03142293 2021-11-30
WO 2020/245155 PCT/EP2020/065289
24
Probes typically comprise single-stranded nucleic acids of between 10 to 1000
nucleotides
in length, for instance of between 10 and 800, more preferably of between 15
and 700,
typically of between 20 and 500. Primers typically are shorter single-stranded
nucleic
acids, of between 10 to 25 nucleotides in length, designed to perfectly or
almost perfectly
match a nucleic acid of interest, to be amplified. The probes and primers are
"specific" to
the nucleic acids they hybridize to, i.e. they preferably hybridize under high
stringency
hybridization conditions (corresponding to the highest melting temperature Tm,
e.g., 50 %
formamide, 5x or 6x SCC. SCC is a 0.15 M NaC1, 0.015 M Na-citrate).
The nucleic acid primers or probes used in the above amplification and
detection method
may be assembled as a kit. Such a kit includes consensus primers and molecular
probes. A
preferred kit also includes the components necessary to determine if
amplification has
occurred. The kit may also include, for example, PCR buffers and enzymes;
positive
control sequences, reaction control primers; and instructions for amplifying
and detecting
the specific sequences.
In a particular embodiment, the methods of the invention comprise the steps of
providing
total RNAs extracted from cumulus cells and subjecting the RNAs to
amplification and
hybridization to specific probes, more particularly by means of a quantitative
or semi-
quantitative RT-PCR.
In another preferred embodiment, the expression level is determined by DNA
chip
analysis. Such DNA chip or nucleic acid microarray consists of different
nucleic acid
probes that are chemically attached to a substrate, which can be a microchip,
a glass slide
or a microsphere-sized bead. A microchip may be constituted of polymers,
plastics, resins,
polysaccharides, silica or silica-based materials, carbon, metals, inorganic
glasses, or
nitrocellulose. Probes comprise nucleic acids such as cDNAs or
oligonucleotides that may
be about 10 to about 60 base pairs. To determine the expression level, a
sample from a test
subject, optionally first subjected to a reverse transcription, is labelled
and contacted with
the microarray in hybridization conditions, leading to the formation of
complexes between
target nucleic acids that are complementary to probe sequences attached to the
microarray
surface. The labelled hybridized complexes are then detected and can be
quantified or
semi-quantified. Labelling may be achieved by various methods, e.g. by using
radioactive
or fluorescent labelling. Many variants of the microarray hybridization
technology are
available to the man skilled in the art (see e.g. the review by Hoheisel,
Nature Reviews,
Genetics, 2006, 7:200-210).
CA 03142293 2021-11-30
WO 2020/245155 PCT/EP2020/065289
The expression level of a gene may be expressed as absolute expression level
or
normalized expression level. Both types of values may be used in the present
method. The
expression level of a gene is preferably expressed as normalized expression
level when
quantitative PCR is used as method of assessment of the expression level
because small
5 differences at the beginning of an experiment could provide huge
differences after a
number of cycles.
Typically, expression levels are normalized by correcting the absolute
expression level of a
gene by comparing its expression to the expression of a gene that is not
relevant for
determining the cancer stage of the patient, e.g., a housekeeping gene that is
constitutively
10 expressed. Suitable genes for normalization include housekeeping genes
such as the actin
gene ACTB, ribosomal 18S gene, GUSB, PGK1 and TFRC. This normalization allows
comparing the expression level of one sample, e.g., a patient sample, with the
expression
level of another sample, or comparing samples from different sources.
15 Therapeutic agents
It is herein provided a method for determining, modulating or adjusting a
treatment
regimen with a chemotherapeutic agent in a patient affected with a cancer,
wherein said
agent is able to leverage or promote a tumor-targeted immune response.
The treatment may consist of an adjuvant therapy (i.e. treatment after
chirurgical resection
20 of the primary tumor) of a neoadjuvant therapy (i.e. treatment before
chirurgical resection
of the primary tumor).
The term "chemotherapeutic agent" refers to chemical compounds that are
effective in
inhibiting tumor growth.
As described in Galluzzi et al, 2016, Cancer Immunol Res, 4(11): 895-902, and
Galluzzi et
25 al, 2015, Cancer Cell Review, 28(6): 690-714, agents that are enable to
cause tumor-
targeting immune responses, either increase the immunogenicity (antigenicity
or
adjuvanticity) of malignant cells ("on-target" immunostimulation), or interact
with immune
effectors or immunosuppressive cell populations ("off-target"
immunostimulation).
In a preferred embodiment, the chemotherapeutic agent is able to cause
immunologic cell
death (ICD). Unlike normal apoptosis, which is mostly nonimmunogenic or even
tolerogenic, immunogenic apoptosis of cancer cells can induce an effective
antitumor
immune response through activation of dendritic cells (DCs) and consequent
activation of
specific T cell response.
CA 03142293 2021-11-30
WO 2020/245155 PCT/EP2020/065289
26
In a most preferred embodiment, the chemotherapeutic agent is a platinum, or a
platinum
salt, derivative or analog, including oxaliplatin, cisplatin and carboplatin,
which
chemotherapeutic agent may be used alone or in combination with another
therapeutic
agent, e.g. a fluoropyrimidine, such as 5-fluorouracil (5FU) and/or
capecitabine. Preferably
the chemotherapeutic agent is oxaliplatin, used either alone or in combination
with 5-
fluorouracil (5FU) and/or capecitabine. In a particular embodiment, the
therapy is
FOLFOX (oxaliplatin+5FU), mFOLFOX6 (oxaliplatin+5FU+leucovorin) or CAPDX
(oxaliplatin+capecitabine).
Alternatively, other chemotherapeutic agents that are able to leverage or
promote a tumor-
targeted immune response, include, without limitation, the following:
Bleomycin
Bortezomib
Alkylating agents (such as Cyclophosphamide)
Dacarbazine
Taxoids (such as Docetaxel or Paclitaxel)
Anthracyclins, such as Doxorubicin
Fluoropyrimidines (such as 5-Fluorouracil or capecitabine)
Irinotecan
Gemcitabine
Idarubicine
Melphalan
Pemetrexed
Vinorelbine
Most preferably, the chemotherapeutic agent is able to induce ICD, such as
platinum, or a
platinum salt, derivative or analog, including oxaliplatin, cisplatin and
carboplatin, well as
bleomycin, bortezomib, cyclophosphamide, or anthracyclins, such as
doxorubicin.
In a particular embodiment, the chemotherapeutic agent can be combined with
another
therapeutic agent, such as an immunotherapeutic agent (e.g. an antibody).
Reference values
Predetermined reference values used for comparison may comprise "cut-off' or
"threshold" values that may be determined as described herein. Each reference
("cut-off')
CA 03142293 2021-11-30
WO 2020/245155 PCT/EP2020/065289
27
value for each gene of interest may be predetermined by carrying out a method
comprising
the steps of
a) providing a collection of tumor tissue samples from patients suffering of
cancer;
b) determining the expression level of the gene or protein for each tumor
tissue sample
contained in the collection provided at step a);
c) ranking the tumor tissue samples according to said expression level
d) classifying said tumor tissue samples in pairs of subsets of increasing,
respectively
decreasing, number of members ranked according to their expression level,
e) providing, for each tumor tissue sample provided at step a), information
relating to the
actual clinical outcome for the corresponding cancer patient (i.e. the
duration of the
disease-free survival (DFS) or the overall survival (OS) or the time to
recurrence (TTR) or
both);
f) for each pair of subsets of tumor tissue samples, obtaining a Kaplan Meier
percentage of
survival curve;
g) for each pair of subsets of tumor tissue samples calculating the
statistical significance (p
value) between both sub sets
h) selecting as reference value for the expression level, the value of
expression level for
which the p value is the smallest.
For example the expression level of a gene X has been assessed for 100 cancer
samples of
100 patients. The 100 samples are ranked according to their expression level.
Sample 1 has
the best expression level and sample 100 has the worst expression level. A
first grouping
provides two subsets: on one side sample Nr 1 and on the other side the 99
other samples.
The next grouping provides on one side samples 1 and 2 and on the other side
the 98
remaining samples etc., until the last grouping: on one side samples 1 to 99
and on the
other side sample Nr 100. According to the information relating to the actual
clinical
outcome for the corresponding cancer patient, Kaplan Meier curves are prepared
for each
of the 99 groups of two subsets. Also for each of the 99 groups, the p value
between both
subsets was calculated.
The reference value is selected such as the discrimination based on the
criterion of the
minimum p value is the strongest. In other terms, the expression level
corresponding to the
boundary between both subsets for which the p value is minimum is considered
as the
reference value. It should be noted that the reference value is not
necessarily the median
value of expression levels.
CA 03142293 2021-11-30
WO 2020/245155 PCT/EP2020/065289
28
In routine work, the reference value (cut-off value) may be used in the
present method to
discriminate tumour samples and therefore the corresponding patients.
Kaplan¨Meier curves of percentage of survival as a function of time are
commonly to
measure the fraction of patients living for a certain amount of time after
treatment and are
well known by the man skilled in the art.
The man skilled in the art also understands that the same technique of
assessment of the
expression level of a gene should of course be used for obtaining the
reference value and
thereafter for assessment of the expression level of a gene of a patient
subjected to the
method of the invention.
Such predetermined reference values of expression level may be determined for
any gene
defined herein.
As described, e.g. in International patent application W02017/194556, the
reference value
may be a distribution of values obtained for each of CD3 and CD8 from a
reference group
of patients suffering from said cancer. The method of the invention then
comprises
determining the percentile of the distribution to which the values, obtained
when
quantifying each of CD3 and CD8, correspond; calculating the arithmetic mean
value or
the median value of percentile; and
comparing the arithmetic mean value or the median value of percentile obtained
with a
predetermined reference arithmetic mean value or a predetermined median value
of
percentile.
When the patient is a patient with colorectal cancer, predetermined reference
values may
be as described in Pages et al, Lancet 2018; 391: 2128-2139. An international
consortium
of 14 centres in 13 countries, led by the Society for Immunotherapy of Cancer,
assessed
the Immunoscore assay in patients with TNM stage I¨III colon cancer. Patients
were
randomly assigned to a training set, an internal validation set, or an
external validation set.
Paraffin sections of the colon tumor and invasive margin from each patient
were processed
by immunohistochemistry, and the densities of CD3+ and cytotoxic CD8+ T cells
in the
tumor and in the invasive margin were quantified by digital pathology. An
Immunoscore
for each patient was derived from the mean of four density percentiles. The
primary
endpoint was to evaluate the prognostic value of the Immunoscore for time to
recurrence,
defined as time from surgery to disease recurrence. Stratified multivariable
Cox models
were used to assess the associations between Immunoscore and outcomes,
adjusting for
potential confounders. Harrell's C-statistics was used to assess model
performance.
CA 03142293 2021-11-30
WO 2020/245155 PCT/EP2020/065289
29
In a particular embodiment, the immune status of the patient, referred to as
the
"Immunoscore (IS)" in the Examples, can be classified in two groups (Low,
Intermediate
+High), or in three groups (Low, Intermediate, High), as follows:
A mean percentile of the 4 individual percentiles of the 4 markers (CD3ct,
CD8ct, CD3im,
CD8im) is determined, corresponding to the density of CD3 cells in CT and IM
regions
and the density of CD8 cells in CT and IM regions.
- Low IS corresponds to a mean percentile below 25%,
- Intermediate IS corresponds to a mean percentile between 25% and 70%,
- High IS corresponds to a mean percentile above 70%.
Methods for treating or modulating the treatment regimen
According to conventional chemotherapy regimens, anticancer drugs are
administered in
cycles near or at the Maximum Tolerated Dose, that can alternate with long
drug-free
periods to allow patient's recovery from adverse drug reactions.
For example, typical colon cancer chemotherapies are capecitabine, LV5FU2,
CAPDX,
FOLFOX4 or mFOLFOX6, preferably administered according to the following
regimens:
= Capecitabine: 1250 mg/m2 capecitabine administered twice a day, for 14
days
(duration of the cycle), cycle to be repeated every 3 weeks;
= LV5FU2: 400 mg/m2 AF (folinic acid) combined with 400 mg/m2 5-FUb (5-
fluorouracil, bolus) and 2400 5-FUc (5-fluorouracil, continued), administered
for
46h (duration of the cycle), cycle to be repeated every 2 weeks;
= CAPDX: 130 mg/m2 oxaliplatin administered the first day (day 1) of the
cycle,
combined with 1000 mg/m2 capecitabine administered twice a day from day 1 for
14 days (duration of the cycle), cycle to be repeated every 3 weeks;
= FOLFOX4: 85 mg/m2 oxaliplatin, 400 mg/m2 AF, 400 mg/m2 5-FUb, and 600
mg/m2 5-FUc, administered on day 1, followed by 400 mg/m2AF, 400 mg/m2 5-
FUb, 600 mg/ m2 5-FUc administered on day 2 (duration of the cycle: 2 days),
cycle to be repeated every two weeks;
= mFOLFOX6: 85 mg/m2 oxaliplatin, 400 mg/m2 AF, 400 mg/m2 5-FUb, 2400
mg/m2 5-FUc, administered for 46h (duration of the cycle), cycle to be
repeated
every 2 weeks.
CA 03142293 2021-11-30
WO 2020/245155 PCT/EP2020/065289
Based on the in vitro methods of the invention, the skilled person may herein
determine,
modulate or adjust a treatment regimen, so that the patient is more likely to
benefit from
said treatment.
The dosage, the frequency of administration (namely the number of cycles),
and/or the
5 duration of treatment may be adapted accordingly.
It is herein provided a method for determining sensitivity of a patient
affected with a
cancer, toward a treatment with a chemotherapeutic agent, wherein said agent
is able to
leverage or promote a tumor-targeted immune response, preferably by causing
10 immunological cell death (ICD), which method comprises quantifying at
least two
biological markers which are CD8 and CD3 in a tumor sample from the patient.
It is herein also provided methods of treating a patient suffering from
cancer, which
method comprises quantifying at least two biological markers which are CD8 and
CD3 in a
15 tumor sample from the patient, comparing the values obtained in a) to
predetermined
reference values, and c)
- when the values obtained in a) are superior to a predetermined
reference value,
adjusting the dose, duration of treatment and/or frequency of administration
compared to a
standard treatment reference, of a chemotherapeutic agent in a patient
affected with a
20 cancer, wherein said agent is able to leverage or promote a tumor-
targeted immune
response; or
treating the patient with a therapeutic regimen that does not comprise said
chemotherapeutic agent.
25 A "cumulative dose" refers to the quantity of agent that is administered
to the patient over
the period of treatment.
The cumulative dose may be modulated by playing on one or several parameters,
such as
the frequency of administration (e.g. the time period between two cycles of
administration), the duration of cycles of administration, and/or the dosage
for each
30 administration.
In a particular embodiment, it is contemplated to modulate the chemotherapy by
implementing a metronomic protocol. A "metronomic chemotherapy" is the
frequent
CA 03142293 2021-11-30
WO 2020/245155 PCT/EP2020/065289
31
administration of chemotherapy agents at doses below the Maximum Tolerated
Dose
(MTD) and with no prolonged drug-free break.
Alternatively, the cycles of treatment may be repeated with a predetermined
frequency
(e.g. between 5 days and 15 days, preferably between 5 and 10 days). The
duration of the
.. treatment may also prolonged (as proposed in the Experimental Section).
A particular example is set forth below.
A typical regimen when administering oxaliplatin-based chemotherapy is a
cyclic
administration (during 1 to 3 days, every two or three weeks), leading to a
cumulative dose
of about 400 to 500 mg/m2 after 3 months of treatment, or 600 to 800 mg/m2
after 6
months. The method of the invention makes it possible to provide a benefit for
patients
who show an intermediate or high IS when treated with a cumulative dose of 600
to 800
mg/m2 over a course of 6 months.
Patients with colorectal cancers are preferred.
The chemotherapeutic agents may be administered by any convenient route,
preferably by
i.v. route. When metronomic chemotherapy is contemplated, oral route may be
preferred.
The Examples and Figures illustrate the invention without limiting its scope.
EXAMPLES
Abbreviations: mFOLFOX6: modified FOLFOX6 therapy (infusional 5-fluorouracil
plus
leucovorin plus oxaliplatin); CAPDX: therapy with capecitadine plus
oxaliplatin; IS:
Immunoscoreg status corresponding to CD8 and CD3 cellular density; High: high
IS
.. value; Low: high IS value; Int: Intermediate IS value; IM: Invasive Margin;
CT: Core of
the Tumor; MSI: microsatellite instability; DFS: disease-free survival; RMST:
restricted
mean survival time; TNM classification: Tumor, lymph Nodes and Metastasis
cancer stage
as defined by the American Joint Cancer Committee (Green FL, Page D, Fleming
ID:
American Joint Cancer Committee Staging Handbook, 6th edition, New York, NY
Springer, 2002); T: primary tumor stage (e.g. TX, TO, Ti to T4) ; N: N
regional lymph
nodes (e.g. NX, NO, Ni to N4); M: metastasis stage (e.g. MX, MO, M1).
CA 03142293 2021-11-30
WO 2020/245155 PCT/EP2020/065289
32
1. MATERIAL and METHODS
1322 patients suffering from stage III colon cancer (CC), and intended to
receive
mFOLFOX6 and/or CAPDX therapy over 3 or 6 months, were included in the present
analysis.
Tumor samples were collected for each patient before treatment, every two
weeks during
treatment, and then every 6 months for 5 years.
As described in Andre et al, 2018, J Clin Oncol 36.1-11, in the 6 months
period, the
median oxaliplatin (with mFOLFOX6) dose received per patient was 732.39 mg/m2
(mean:
8.9 cycles).
In contrast, in the 3 months period, the median oxaliplatin dose received per
patient was
494.22 mg/m2 (with mFOLFOX6), or 504.44 mg/ m2 (with CAPDX).
One formalin-Fixed Paraffin-Embedded (FFPE) block per patient was selected in
a central
pathology laboratory (Hopital Ambroise Pare, Boulogne, FR) according to the
Immunoscoreg Sample Preparation Instructions. Briefly, either one FFPE block
or four
unstained labeled slides prepared from 4[tm-thick adjacent FFPE sections were
sent at
room temperature to two laboratories (HalioDx , Marseille, France;
Immunomonitoring
Platform, Hopital Europeen Georges Pompidou AP-HP, INSERM, Paris, France)
where
Immunoscoreg testing (Immunohistochemistry (IHC) and image analysis), i.e.
measure of
CD3 and CD8 expression, was performed blinded to clinical data. Automatized
Immunohistochemistry on BenchMark XT (Ventana) was performed within 4 months
of
sectioning. Sections were incubated at 37 C with primary antibodies: rabbit
monoclonal
anti-human CD3 (clone HDx2 HalioDx, Marseille, FR) and mouse monoclonal anti-
human
CD8 (clone HDx1 HalioDx, Marseille, FR) as recommended by the manufacturer.
Counterstained slides were digitalized at 20x magnification and 0.45 p.m/pixel
resolution
on a NanoZoomer XR (Hamamatsu).
Image analysis software was used for automatic tissue detection (tumor,
healthy non-
epithelial tissue and epithelium) and to quantify the density of stained
immune CD3+ and
CD8+ cells by number of cells per mm2 in both the core of the tumor (CT) and
the
invasive margin (IM) using a software algorithm (Immunoscoreg Analyzer,
HalioDx,
Marseille, FR) integrated into an image analysis system (Pages et al, Lancet
2018; 391:
2128-2139; Hermitte et al, 2016 ; 4: 57). IM, defined as a region of 360pm
width on each
side of the frontier between malignant cells and peritumoral stroma was
generated
CA 03142293 2021-11-30
WO 2020/245155 PCT/EP2020/065289
33
automatically. CD3+ and CD8+ T-cell densities were converted into an
Immunoscoreg
with pre-defined cutoffs, per an algorithm previously developed on patients
with stages Ito
III colon cancer (Pages et al, supra; Hermitte et al, 2016 ; 4: 57).
Immunoscoreg utilizes
standardized percentile values (0 to 100%) and the algorithm categorizes the
continuous
Immunoscoreg into 5 groups using predefined density scores with a mean
percentile of [0-
10%], [>10-25%], [>25-70%], [>70-95%] and [>95-100%] corresponding to IS 0 ,
IS 1, IS
2, IS 3, and IS 4 respectively. The 3-group classification corresponds to IS 0-
1, IS 2 and IS
3-4 being Immunoscoreg Low, Intermediate and High respectively and the
categorization
into 2 groups corresponds to IS 0-1 (mean percentile 0-25%) and IS 2-3-4 (mean
percentile
>25-100%) being Immunoscoreg Low and High respectively.
Samples were not eligible in case of FFPE block issue, sample identification
issue, if the
tissue was torn or folded, in case of high IHC staining background, or if a
tumor region
(CT or IM) was missing. For Immunoscoreg analysis quality control, samples
were
excluded from the analysis if CD3 or CD8 counts were missing from a tumor
region (CT
or IM) or if staining intensity was deemed low.
2. RESULTS
2.1. Patient characteristics and IS determination
A total of 1322 patients out of 2010 suffering from stage III colon cancer
(CC) with
available tumor samples before and throughout treatment were included in the
analysis.
As compared to the entire population of patients, a lower proportion of low-
risk patients
(T1-T3N1) and especially Ti-stage tumors were observed in patients with sample
available
for Immunoscoreg characterization (Table 1).
Table 1. Multivariate analysis for DFS combining IS and histopathological
classifications.
N event, HR 95%Cl P-value
lmmunoscore classification
High 100 17
Intermediate 499 133 1345 1.053 to 2.892
Low 463 167 2.321 1.409 to 3.824
0.0008
Histopathological classification
Low risk (T1-3, Ni) 622 129 1
High risk (T4 or N2) 439 188 2.343 1.871 to 2.935
<0001
Among the available samples, 82 samples were excluded due to pre-analytical
non-
conformity. A dedicated software monitored the CD3 and CD8 staining
intensities and
CA 03142293 2021-11-30
WO 2020/245155 PCT/EP2020/065289
34
determined the IS (Figure IA). This procedure providing an internal quality
control,
allowed consistency for the counting of stained cells (Pages et al 2018,
supra) and
reproducibility of IS between the two centers involved in IS assessment
(Figure IB).
Overall, 1062 cases (85.6%) reached the quality control.
After translation of the immune densities into a 2-category IS scoring system
(Figure IC),
IS Low and Int+High were observed in n=599 (43.6%) and n=463 (56.4% including
47%
Int and 9.4% High) patients, respectively.
2.2. IS associated prognostic value
IS in 2 categories was significantly correlated with T stage, T/N stage (T1-3
and Ni versus
T4 and/or N2), and microsatellite instability (MSI) status.
The primary objective of study was met since a significant difference of the
DFS among
patient's groups stratified by IS in two categories (Low vs Int+High) in the
patients'
population was evidenced by univariate analysis (HR= 1.54 (95%CI 1.24-1.93);
P=0.0001), and illustrated by Kaplan-Meier curves (Table 3 and Figure 2A). The
3-year
DFS rates were 66.80% [95%CI 62.23-70.95] and 77.14% [95%CI 73.50-80.35] for
IS
Low and IS Int+High, respectively. IS as a continuous variable (Table 2) was
also
significantly associated with DFS (P<0.0001).
Table 2. Final multivariate model for DFS prediction (with IS in its
continuous form)
[i]flil oriale 311:111.,,i,, 1\
c. PviLJe
Immunoscore
1
' 1._
Turnii,.Node Staitt
1.949 1113 <O001
= 1
1 2 I-: - i71 4. 1
Tleatment Arm
AL1 : 0,564 196 r
d Alta ins sbIlity
= r =
if
0.308 :13
CA 03142293 2021-11-30
WO 2020/245155 PCT/EP2020/065289
In accordance, IS stratified in 3- categories (Figure 2B) and in 5-categories
further
discriminate patient's outcome for DFS times (Logrank tests, all P <0.001).
With IS
stratified in 3- categories, a 3-year DFS rate of 85 % was observed in
patients with IS
High, as compared to 67% for patients with IS Low. With IS stratified in 5-
categories,
5 patients with the lowest IS (ISO) presented with a 3-year DFS rate of 55
% as compared to
100% (no relapse or death) in the group with the highest IS (IS4).
Finally, the restricted mean survival time (RMST) was further tested as an
alternative
measure of the survival time distribution according to IS. RMST was
significant in DFS
analysis for IS High vs IS Low subgroups, similarly to Logrank P-values and HR
analyses.
10 For example, RMST for relapse or death events (DFS) showed a gain of 367
days for
patients with Immunoscore-High compared to patients with Immunoscore-Low.
In multivariable analysis, IS remained significantly and independently
associated with DFS
when combined with gender, histological grade, T stage, N stage and MSI status
(Table 1).
Moreover, IS remained independently associated with DFS when combined with T/N
stage
15 categorization (high-risk T4 and/or N2; low risk T1-3 and Ni). The
addition of IS to the
T/N stage significantly improved the model discrimination capacity [bootstrap
C index
mean difference, 0.022; 95%CI 0.005-0.04].
2.3. Prognostic value of IS according to T/N stage subgroups
20 A significant correlation was found between the IS in 2, 3 or 5
categories and the
occurrence of relapse or death in the subgroup of patients with low risk T1-3
and Ni tumor
(Logrank tests) all P<= 0.001) (see Figure 3).
In patients with high-risk T4 and/or N2 tumors, IS categorization did not
reach significance
but the highest IS was constantly observed in patients with the lowest risk of
event and the
25 risk of recurrence or death gradually increased along with the decrease
of IS (Figure 2).)
2.4. Predictive value of IS for duration of adjuvant FOLFOX6 chemotherapy
according to the invention
492 and 481 patients receiving mFOLFOX6 in the 3- and 6-month arms,
respectively, were
30 analysed. High-risk tumors (T4 and/or N2 tumors) represented 38.4%
(n=408 patients) of
the cohort.
A beneficial effect of the 6 months- as compared to 3 months- FOLFOX6 regimen
was
observed in patients with a (Int+ High) IS (HR = 0.528; 95%CI 0.372 to 0.750;
Logrank P
CA 03142293 2021-11-30
WO 2020/245155 PCT/EP2020/065289
36
= 0.0004, Figure 3A). This benefit was retained in the low risk tumors (T1-T3
and Ni; HR
= 0.467, Logrank P = 0.010) and in the high-risk tumors (T4 and/or N2 tumors;
HR =
0.542, Logrank P = 0.0067) (Figure 3A).
Strikingly, no significant benefit of the 6 months- FOLFOX6 regimen was
observed for
patients with a Low IS (HR = 0836, Logrank P = 0.269; (Figure 3B). In those
patients, a
moderate benefit of the 6 months-FOLFOX6 regimen was observed in the first 3
years but
canceled thereafter. This trend was more pronounced in the group of high-risk
tumors
(Figure 3B). To further investigate the relationship between density of immune
infiltrate
and the benefit of 6-months chemotherapy, IS was evaluated as a continuous
variable. The
clinical benefit of 6 months of chemotherapy, as evaluated with the DFS rate
at 3 year (%),
becomes more important the higher the IS gets.
To further investigate the relationship between the density of immune
infiltrate and the
benefit of 6 months chemotherapy, IS was stratified into 5-categories. The
results show
that the population that benefit the most of a 6 months-chemotherapy are the
patients with
an Int IS.
3. DISCUSSION
The Immunoscoreg (IS) test has previously been shown to prognostically
classify Stage I-
III colon cancer (CC) patients. This test has herein been assessed in a cancer
France cohort
study, to study 3 versus 6 months of oxaliplatin-based adjuvant chemotherapy
in colon
cancer patients at various cancer stages (TNM stages Ti-T3, Ni, T4, N2).
Densities of CD3+ and cytotoxic CD8+ T cells in the tumor and invasive margin
of each
patient were quantified by digital pathology and converted to Immunoscoreg
status (High,
Low, Intermediate) depending on the measured CD3 and CD8 densities, and using
pre-
defined published cut-off The performance of Immunoscoreg to predict disease-
free
survival (DFS) was assessed in the modified intention-to-treat population, in
each study
arm, and was adjusted with relevant clinical features in multivariable Cox
models.
Harrell's C-statistics was used to investigate the IS performance.
IS was successfully analyzed in 1062 (85.6%) eligible patients. In a 2-
category IS analysis,
Low and Int+High IS were observed in n=599 (43.6%) and n=463 (56.4%) patients,
respectively. IS was significantly correlated with T stage, T/N stage (T1-3
and Ni versus
T4 and/or N2), and microsatellite instability status. This study thus
validates that Low IS
CA 03142293 2021-11-30
WO 2020/245155 PCT/EP2020/065289
37
identifies patients with higher-risk of relapse or death [HR=1.54; 95%CI 1.24-
1.93,
p=0.0001]. The 3-year DFS rates were 66.80% [95%CI 62.23-70.95] and 77.14%
[95%CI
73.50-80.35] for Low IS and Int+High IS, respectively. In multivariable
analysis, IS
remained independently associated with DFS (p<0.0012) when combined with T/N
stage.
The addition of IS to the T/N stage significantly improved the model
discrimination
capacity [bootstrap C index mean difference, 0.022; 95%CI 0.005-0.04]. In
addition, IS in
3 categories (Low, Int, High) and as a continuous variable were also both
significantly
associated with DFS (all p<0.001). In univariable analysis, IS was also
associated with
DFS in 6 months arm (p<0.0001); a similar trend was observed in 3 months arm
(p=0.09).
The present study demonstrates that only patients with an Intermediate or High
IS status
did benefit from 6 months of mFOLFOX6 therapy compared with 3 months, both in
low
(T1-T3, Ni) and high-risk (T4 and/or N2) stage III groups.